Introduction
Azure Red Hat OpenShift (ARO) clusters store log data inside the cluster by default. Understanding metrics and logs is critical in successfully running your cluster. Included with ARO is the OpenShift Cluster Logging Operator, which is intended to simplify log management and analysis within an ARO cluster, offering centralized log collection, powerful search capabilities, visualization tools, and integration with other other Azure systems like Azure Blob Storage.
In this section of the workshop, we’ll configure ARO to forward logs and metrics to Azure Blob Storage and view them using Grafana.
Configure Autoscaling for All Worker MachineSets
OpenShift Cluster Logging takes place in the cluster itself, so we need to scale up the number of worker nodes. We’ll use the MachineAutoscaler on each of the existing MachineSets to scale up the number of worker nodes.
-
To deploy the MachineAutoscalers, run the following command:
MACHINESETS=$(oc -n openshift-machine-api get machinesets -o name | cut -d / -f2 )

for MACHINESET in $(echo ${MACHINESETS}); do
cat <<EOF | oc apply -f -
---
apiVersion: "autoscaling.openshift.io/v1beta1"
kind: "MachineAutoscaler"
metadata:
  name: "${MACHINESET}"
  namespace: "openshift-machine-api"
spec:
  minReplicas: 1
  maxReplicas: 3
  scaleTargetRef:
    apiVersion: machine.openshift.io/v1beta1
    kind: MachineSet
    name: "${MACHINESET}"
EOF
done
| Be patient with this lab. As you progress through this lab deploying logging be aware that it will take about five minutes to provision each machine and another one minute for the Nodes to become Ready. |
-
Be prepareed to watch the progress of the MachineAutoscaler as you work through this lab with the following commands.
-
Get the list of Pods in state "Pending", which triggers the MachineAutoscaler to scale up the number of worker nodes
-
Get the list of Machines in the cluster, which you will see in various states as they are being provisioned
-
Get the list of Nodes as they become ready and the Pods in Pending are deployed to them
oc get pods -A | grep Pending
oc -n openshift-machine-api get machines -l "machine.openshift.io/cluster-api-machine-role=worker"
oc get nodes -o wide
-
Configure Metrics and Log Forwarding to Azure Blob Storage
-
First, let’s create our Azure Blob Storage account. To do so, run the following command::
AZR_STORAGE_ACCOUNT_NAME="storage${GUID}"

ARO_LOCATION=$(az aro show --resource-group openenv-${GUID} --name aro-cluster-${GUID} --query location -o tsv)

az storage account create --name "${AZR_STORAGE_ACCOUNT_NAME}" --allow-blob-public-access --resource-group "openenv-${GUID}" --location "${AZ_LOCATION}" --sku Standard_LRS
Sample OutputThe public access to all blobs or containers in the storage account will be disallowed by default in the future, which means default value for --allow-blob-public-access is still null but will be equivalent to false. { "accessTier": "Hot", "accountMigrationInProgress": null, "allowBlobPublicAccess": true, "allowCrossTenantReplication": false, [... Lots of output Omitted ...]You may get an error about rate limiting when running the
az storage account createcommand. If so just wait a few seconds and repeat the command. -
Next, let’s grab our storage account key. To do so, run the following command:
AZR_STORAGE_KEY=$(az storage account keys list --resource-group "openenv-${GUID}" -n "${AZR_STORAGE_ACCOUNT_NAME}" --query "[0].value" -o tsv)

echo ${AZR_STORAGE_KEY}
Sample Outputgr6ujd144KyO14BVQ5cEupJw/MWQx/XvXxQE/eG62oOvoVfnLVO68EcFGDygSXQD4pUGx+oA+wNJ+AStwccBSw== -
Now let’s save these values in our
.workshoprcfile in case we get disconnected:cat << EOF >> ~/.workshoprc # Azure storage export AZR_STORAGE_ACCOUNT_NAME="storage${GUID}" export ARO_LOCATION=$(az aro show --resource-group openenv-${GUID} --name aro-cluster-${GUID} --query location -o tsv) export AZR_STORAGE_KEY=\$(az storage account keys list --resource-group "openenv-${GUID}" -n "${AZR_STORAGE_ACCOUNT_NAME}" --query "[0].value" -o tsv) EOF -
Now, let’s create a separate storage bucket for logs and metrics. To do so, run the following command:
az storage container create --name "aro-logs" \
  --account-name "${AZR_STORAGE_ACCOUNT_NAME}" \
  --account-key "${AZR_STORAGE_KEY}"
az storage container create --name "aro-metrics" \
  --account-name "${AZR_STORAGE_ACCOUNT_NAME}" \
  --account-key "${AZR_STORAGE_KEY}"
Sample Output{ "created": true } { "created": true } -
Check that
helmis installed properly:helm versionSample Outputversion.BuildInfo{Version:"v3.15.4+60.el9", GitCommit:"fa384522f2878321c8b6b1a06f8ff5f86f47a937", GitTreeState:"clean", GoVersion:"go1.22.7 (Red Hat 1.22.7-2.el9_5)"} -
Next, let’s add the MOBB Helm Chart repository. To do so, run the following command:
helm repo add mobb https://rh-mobb.github.io/helm-charts/

helm repo update
Sample Output"mobb" has been added to your repositories Hang tight while we grab the latest from your chart repositories... ...Successfully got an update from the "mobb" chart repository Update Complete. ⎈Happy Helming!⎈ -
Now, we need to create a project (namespace) to deploy our logging resources to. To create that, run the following command:
oc new-project custom-loggingSample OutputNow using project "custom-logging" on server "https://api.rbrlitrg.westeurope.aroapp.io:6443". You can add applications to this project with the 'new-app' command. For example, try: oc new-app rails-postgresql-example to build a new example application in Ruby. Or use kubectl to deploy a simple Kubernetes application: kubectl create deployment hello-node --image=k8s.gcr.io/e2e-test-images/agnhost:2.33 -- /agnhost serve-hostname -
Next, we need to install a few operators to run our logging setup. These operators include the Red Hat Cluster Logging Operator, the Loki operator, the Grafana operator, and more. First, we’ll create a list of all the operators we’ll need to install by running the following command:
cat <<EOF > clf-operators.yaml subscriptions: - name: grafana-operator channel: v5 installPlanApproval: Automatic source: community-operators sourceNamespace: openshift-marketplace - name: cluster-logging channel: stable-6.3 installPlanApproval: Automatic source: redhat-operators sourceNamespace: openshift-marketplace namespace: openshift-logging - name: loki-operator channel: stable-6.3 installPlanApproval: Automatic source: redhat-operators sourceNamespace: openshift-marketplace namespace: openshift-operators-redhat - name: resource-locker-operator channel: alpha installPlanApproval: Automatic source: community-operators sourceNamespace: openshift-marketplace namespace: resource-locker-operator - name: patch-operator channel: alpha installPlanApproval: Automatic source: community-operators sourceNamespace: openshift-marketplace namespace: patch-operator - name: cluster-observability-operator installPlanApproval: Automatic channel: stable source: redhat-operators sourceNamespace: openshift-marketplace namespace: openshift-cluster-observability-operator operatorGroups: - name: custom-logging targetNamespace: ~ - name: openshift-logging namespace: openshift-logging targetNamespace: openshift-logging - name: openshift-operators-redhat namespace: openshift-operators-redhat targetNamespace: all - name: resource-locker namespace: resource-locker-operator targetNamespace: all - name: patch-operator namespace: patch-operator targetNamespace: all - name: cluster-observability-operator namespace: openshift-cluster-observability-operator targetNamespace: all EOF -
Next, let’s deploy the Grafana, Cluster Logging, and Loki operators from the file we just created above. To do so, run the following command:
oc create ns openshift-logging
oc label namespaces openshift-logging openshift.io/cluster-monitoring="true" --overwrite=true

oc create ns openshift-operators-redhat
oc label namespaces openshift-operators-redhat openshift.io/cluster-monitoring="true" --overwrite=true

oc create ns resource-locker-operator

oc create ns patch-operator

oc create ns openshift-cluster-observability-operator

helm upgrade -n custom-logging clf-operators \
  mobb/operatorhub --install \
  --values ./clf-operators.yaml
Sample Outputnamespace/openshift-logging created namespace/openshift-operators-redhat created namespace/resource-locker-operator created namespace/patch-operator created Release "clf-operators" does not exist. Installing it now. NAME: clf-operators LAST DEPLOYED: Tue Nov 4 20:34:38 2025 NAMESPACE: custom-logging STATUS: deployed REVISION: 1 TEST SUITE: None NOTES: . -
Now, let’s wait for the operators to be installed.
These commands will loop through each type of resource until the CRDs for the Operators have been deployed.
Eventually you’ll see the message
No resources found in custom-logging namespaceand be returned to a prompt.while ! oc get grafana; do sleep 5; echo -n .; done while ! oc get clusterlogforwarders; do sleep 5; echo -n .; done while ! oc get lokistack; do sleep 5; echo -n .; done while ! oc get resourcelocker; do sleep 5; echo -n .; doneSample OutputNo resources found in custom-logging namespace. No resources found in custom-logging namespace. No resources found in custom-logging namespace. No resources found in custom-logging namespace. -
Now that the operators have been successfully installed, let’s use a helm chart to deploy Grafana and forward metrics to Azure Blob Storage. To do so, run the following command:
helm upgrade -n "custom-logging" aro-thanos-af \
  --install mobb/aro-thanos-af --version 0.8.8 \
  --set "aro.storageAccount=${AZR_STORAGE_ACCOUNT_NAME}" \
  --set "aro.storageAccountKey=${AZR_STORAGE_KEY}" \
  --set "aro.storageContainer=aro-metrics" \
  --set "enableUserWorkloadMetrics=true"
Sample OutputRelease "aro-thanos-af" does not exist. Installing it now. NAME: aro-thanos-af LAST DEPLOYED: Tue Dec 19 09:41:57 2023 NAMESPACE: custom-logging STATUS: deployed REVISION: 1 TEST SUITE: NoneIf you get an error during that command wait a few seconds and try it again. Sometimes the Patch Operator takes a little longer to fully deploy.
-
Wait until Grafana has successfully deployed. Run the following command:
oc -n custom-logging rollout status deploy aro-thanos-af-grafana-cr-deployment -
Next, let’s ensure that we can access Grafana. To do so, we should fetch its route and try browsing to it with your web browser. To grab the route, run the following command:
oc -n custom-logging get route aro-thanos-af-grafana-cr-route \
  -o jsonpath='{"https://"}{.spec.host}{"\n"}'
Sample Outputhttps://grafana-route-custom-logging.apps.nbybk9f3.eastus.aroapp.io -
You should already be logged into the cluster because you logged into the web console earlier. Accept all permissions by clicking on Allow selected permissions. You should see the Grafana dashboard.
Set up Log Forwarding
-
Now, set the storage class to use for the persistent volumes to be created - using the storage class that is set as the default storage class:
STORAGE_CLASS=$(oc get storageclass -o=jsonpath='{.items[?(@.metadata.annotations.storageclass\.kubernetes\.io/is-default-class=="true")].metadata.name}')
echo "export STORAGE_CLASS=${STORAGE_CLASS}" >> .workshoprc
echo ${STORAGE_CLASS}
Sample Outputmanaged-csi -
Next, let’s use another helm chart to deploy forward logs to Azure Blob Storage. To do so, run the following command:
helm upgrade -n custom-logging aro-clf-blob \
 --install mobb/aro-clf-blob --version 0.2.37 \
 --set "azure.storageAccount=${AZR_STORAGE_ACCOUNT_NAME}"  \
 --set "azure.storageAccountKey=${AZR_STORAGE_KEY}"   \
 --set "azure.storageContainer=aro-logs" \
 --set "lokiStack.storageClassName=${STORAGE_CLASS}"
Sample OutputRelease "aro-clf-blob" does not exist. Installing it now. NAME: aro-clf-blob LAST DEPLOYED: Tue Dec 19 09:43:20 2023 NAMESPACE: custom-logging STATUS: deployed REVISION: 1 TEST SUITE: None -
Wait until loki has been successfully deployed. Run the following command:
oc -n openshift-logging rollout status deploy logging-loki-distributor
oc -n openshift-logging rollout status deploy logging-loki-gateway
oc -n openshift-logging rollout status deploy logging-loki-querier
oc -n openshift-logging rollout status deploy logging-loki-query-frontend
Sample Outputdeployment "logging-loki-distributor" successfully rolled out deployment "logging-loki-gateway" successfully rolled out deployment "logging-loki-querier" successfully rolled out deployment "logging-loki-query-frontend" successfully rolled out
View the Metrics and Logs in Grafana
Now that the metrics and log forwarding are forwarding to Azure Blob Storage, let’s view them in Grafana.
-
First, we’ll need to fetch the route for Grafana and visit it in our web browser. To get the route, run the following command
oc -n custom-logging get route aro-thanos-af-grafana-cr-route \
  -o jsonpath='{"https://"}{.spec.host}{"\n"}'
Sample Outputhttps://grafana-route-custom-logging.apps.nbybk9f3.eastus.aroapp.io -
Browse to the provided route address in the same browser window as your OCP console and login using your OpenShift credentials. If you tested this before you are already logged in.
-
To view an existing dashboard, first click on Dashboards in the left menu and then: custom-logging -> Node Exporter -> USE Method -> Cluster (click on the search icon on the left to see the custom-logging dashboard).
These dashboards are copies of the dashboards that are available directly on the OpenShift web console under Observability.
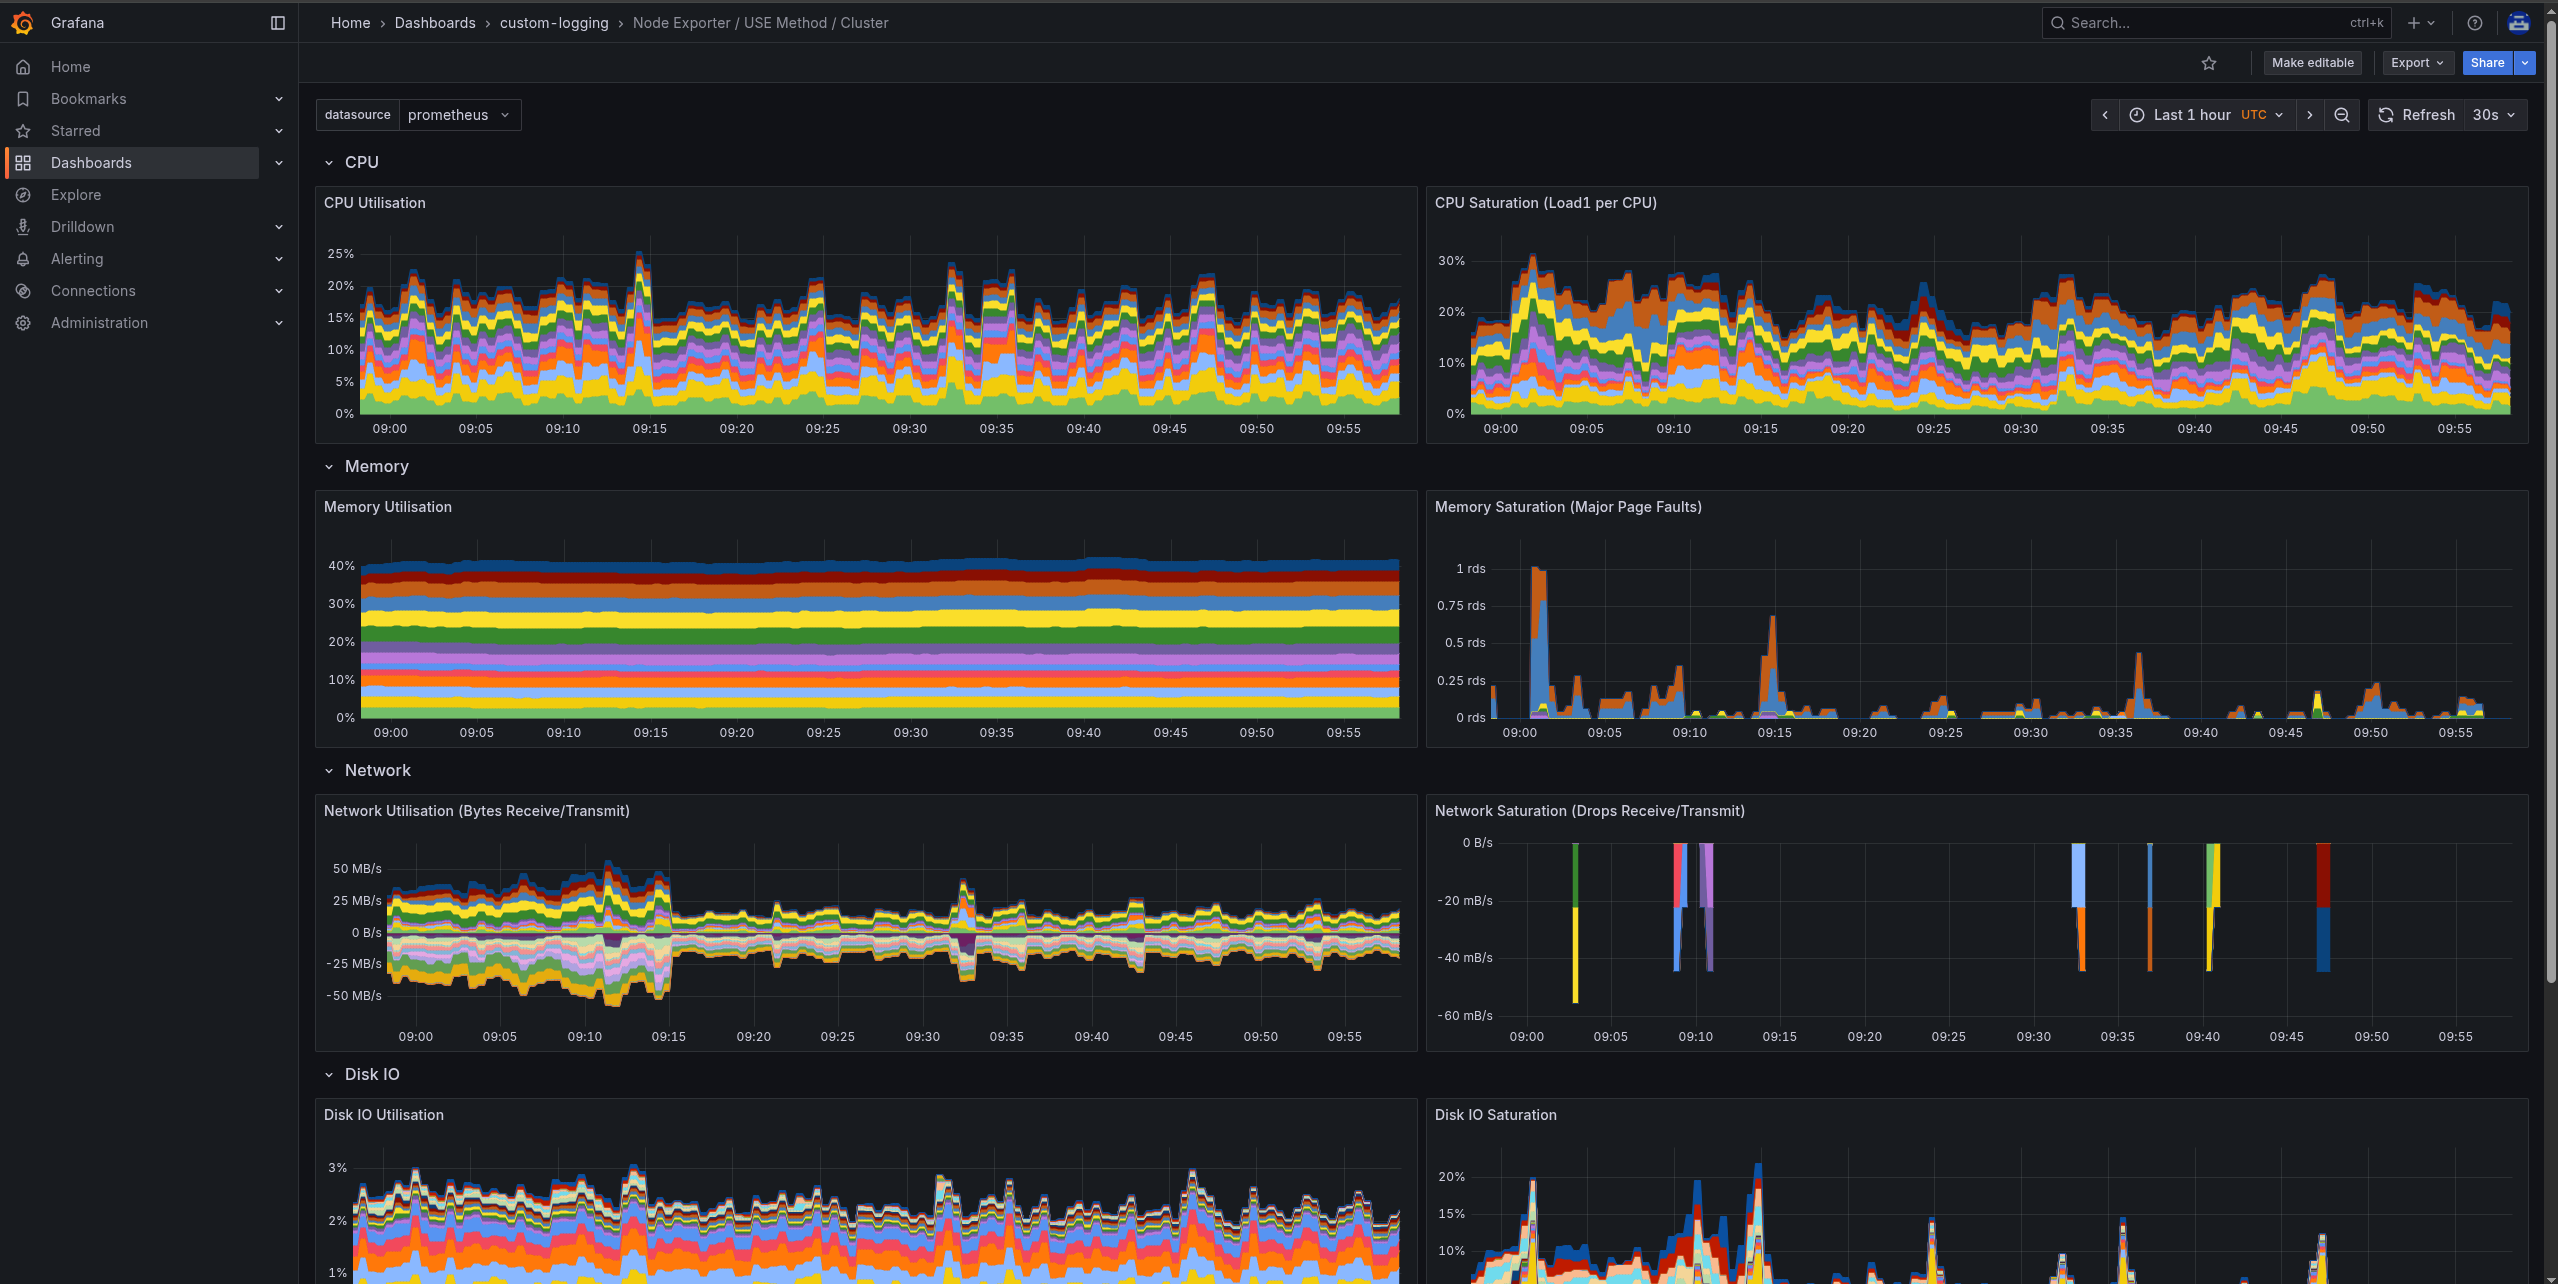
If you don’t see the graphs as in the screenshot above wait a minute and refresh the browser window - it takes a few minutes for the Grafana dashboard to start showing data.
-
To view the logs, click the Drilldown (drill) icon in the left hand menu, then select "Logs". You will now see an error message like this:
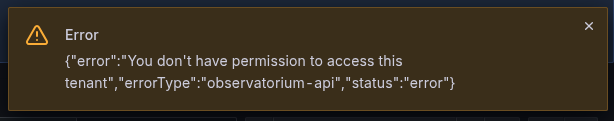
This you can safely ignore, the reason is because we have only given permission to see logs in the
custom-loggingnamespace and Grafana tries to access API endpoints it does not have permissions to use. When setting up the label selector you will also see a few warning about access, that is again because Grafana tries to read all values from the backend but it’s limited in access. -
The data source
Loki (Application)is preselected in the dropdown for "Data source", if not, select it.
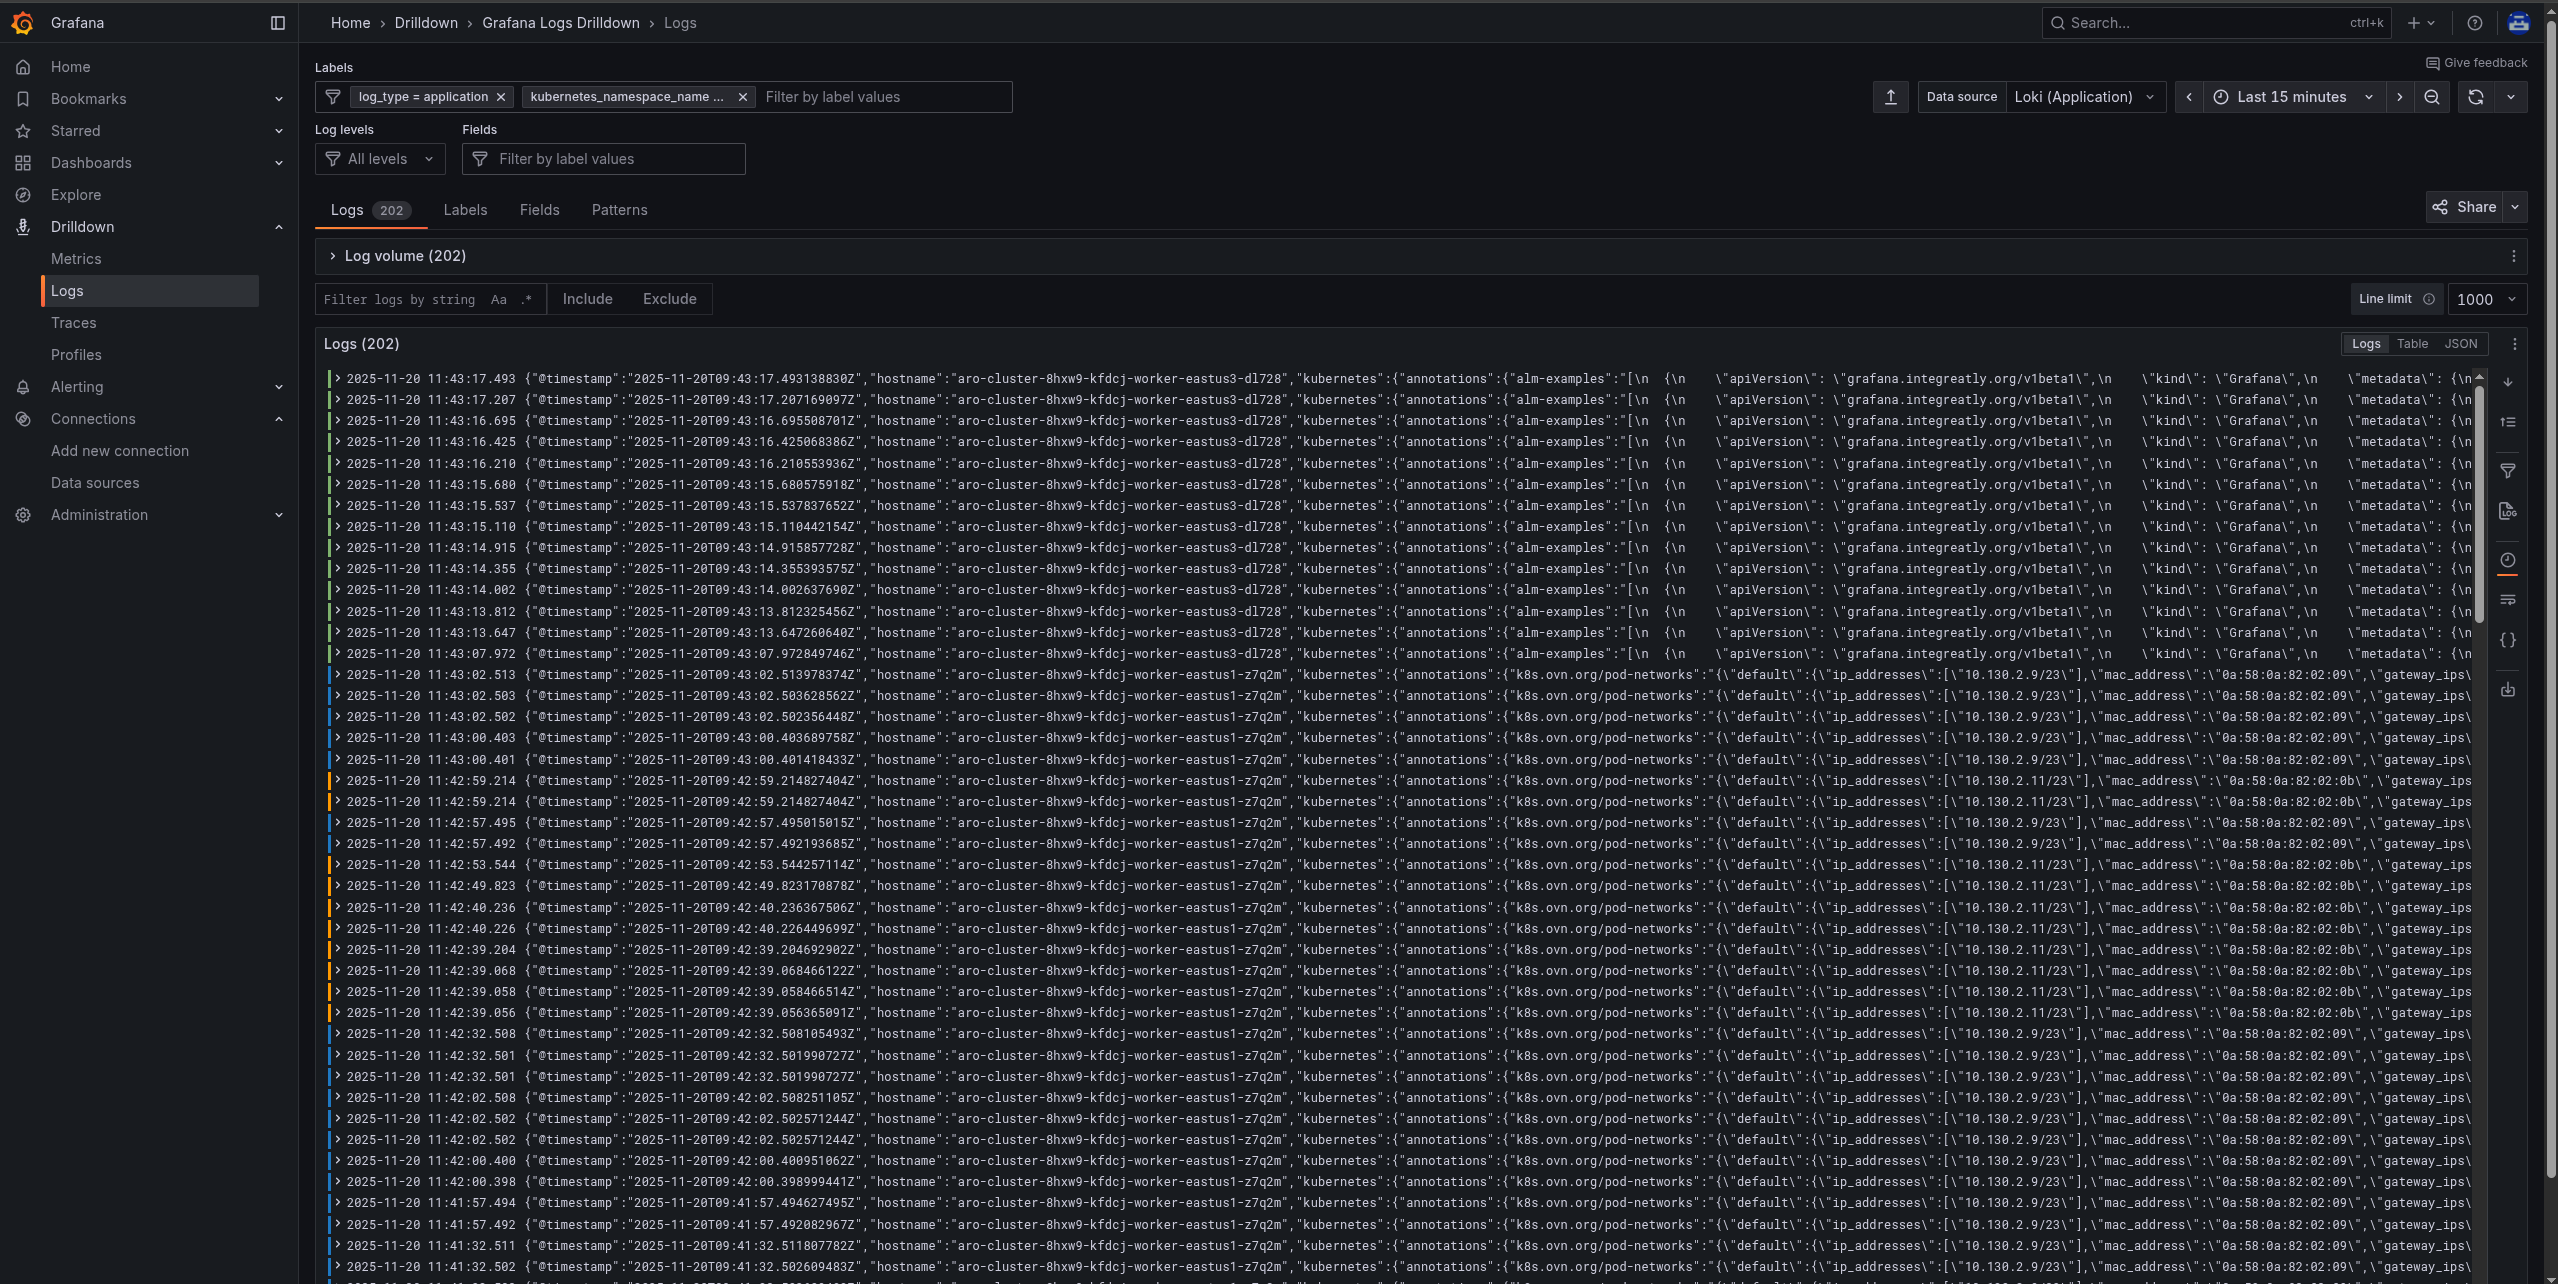
In the labels field first enter
log_typeThen click on the
Use custom value, then click= Equalsand enterapplicationThen press the enter key (Grafana tries to ). For the second label, enter:
kubernetes_namespace_nameThen click on the
Use custom value, then click= Equalsand entercustom-loggingComplete the label setup by pressing the enter key.
-
Click the "Show logs" button to view application logs from loki.
-
Now select the data source
Loki (Infrastructure)in the dropdown for "Data source":
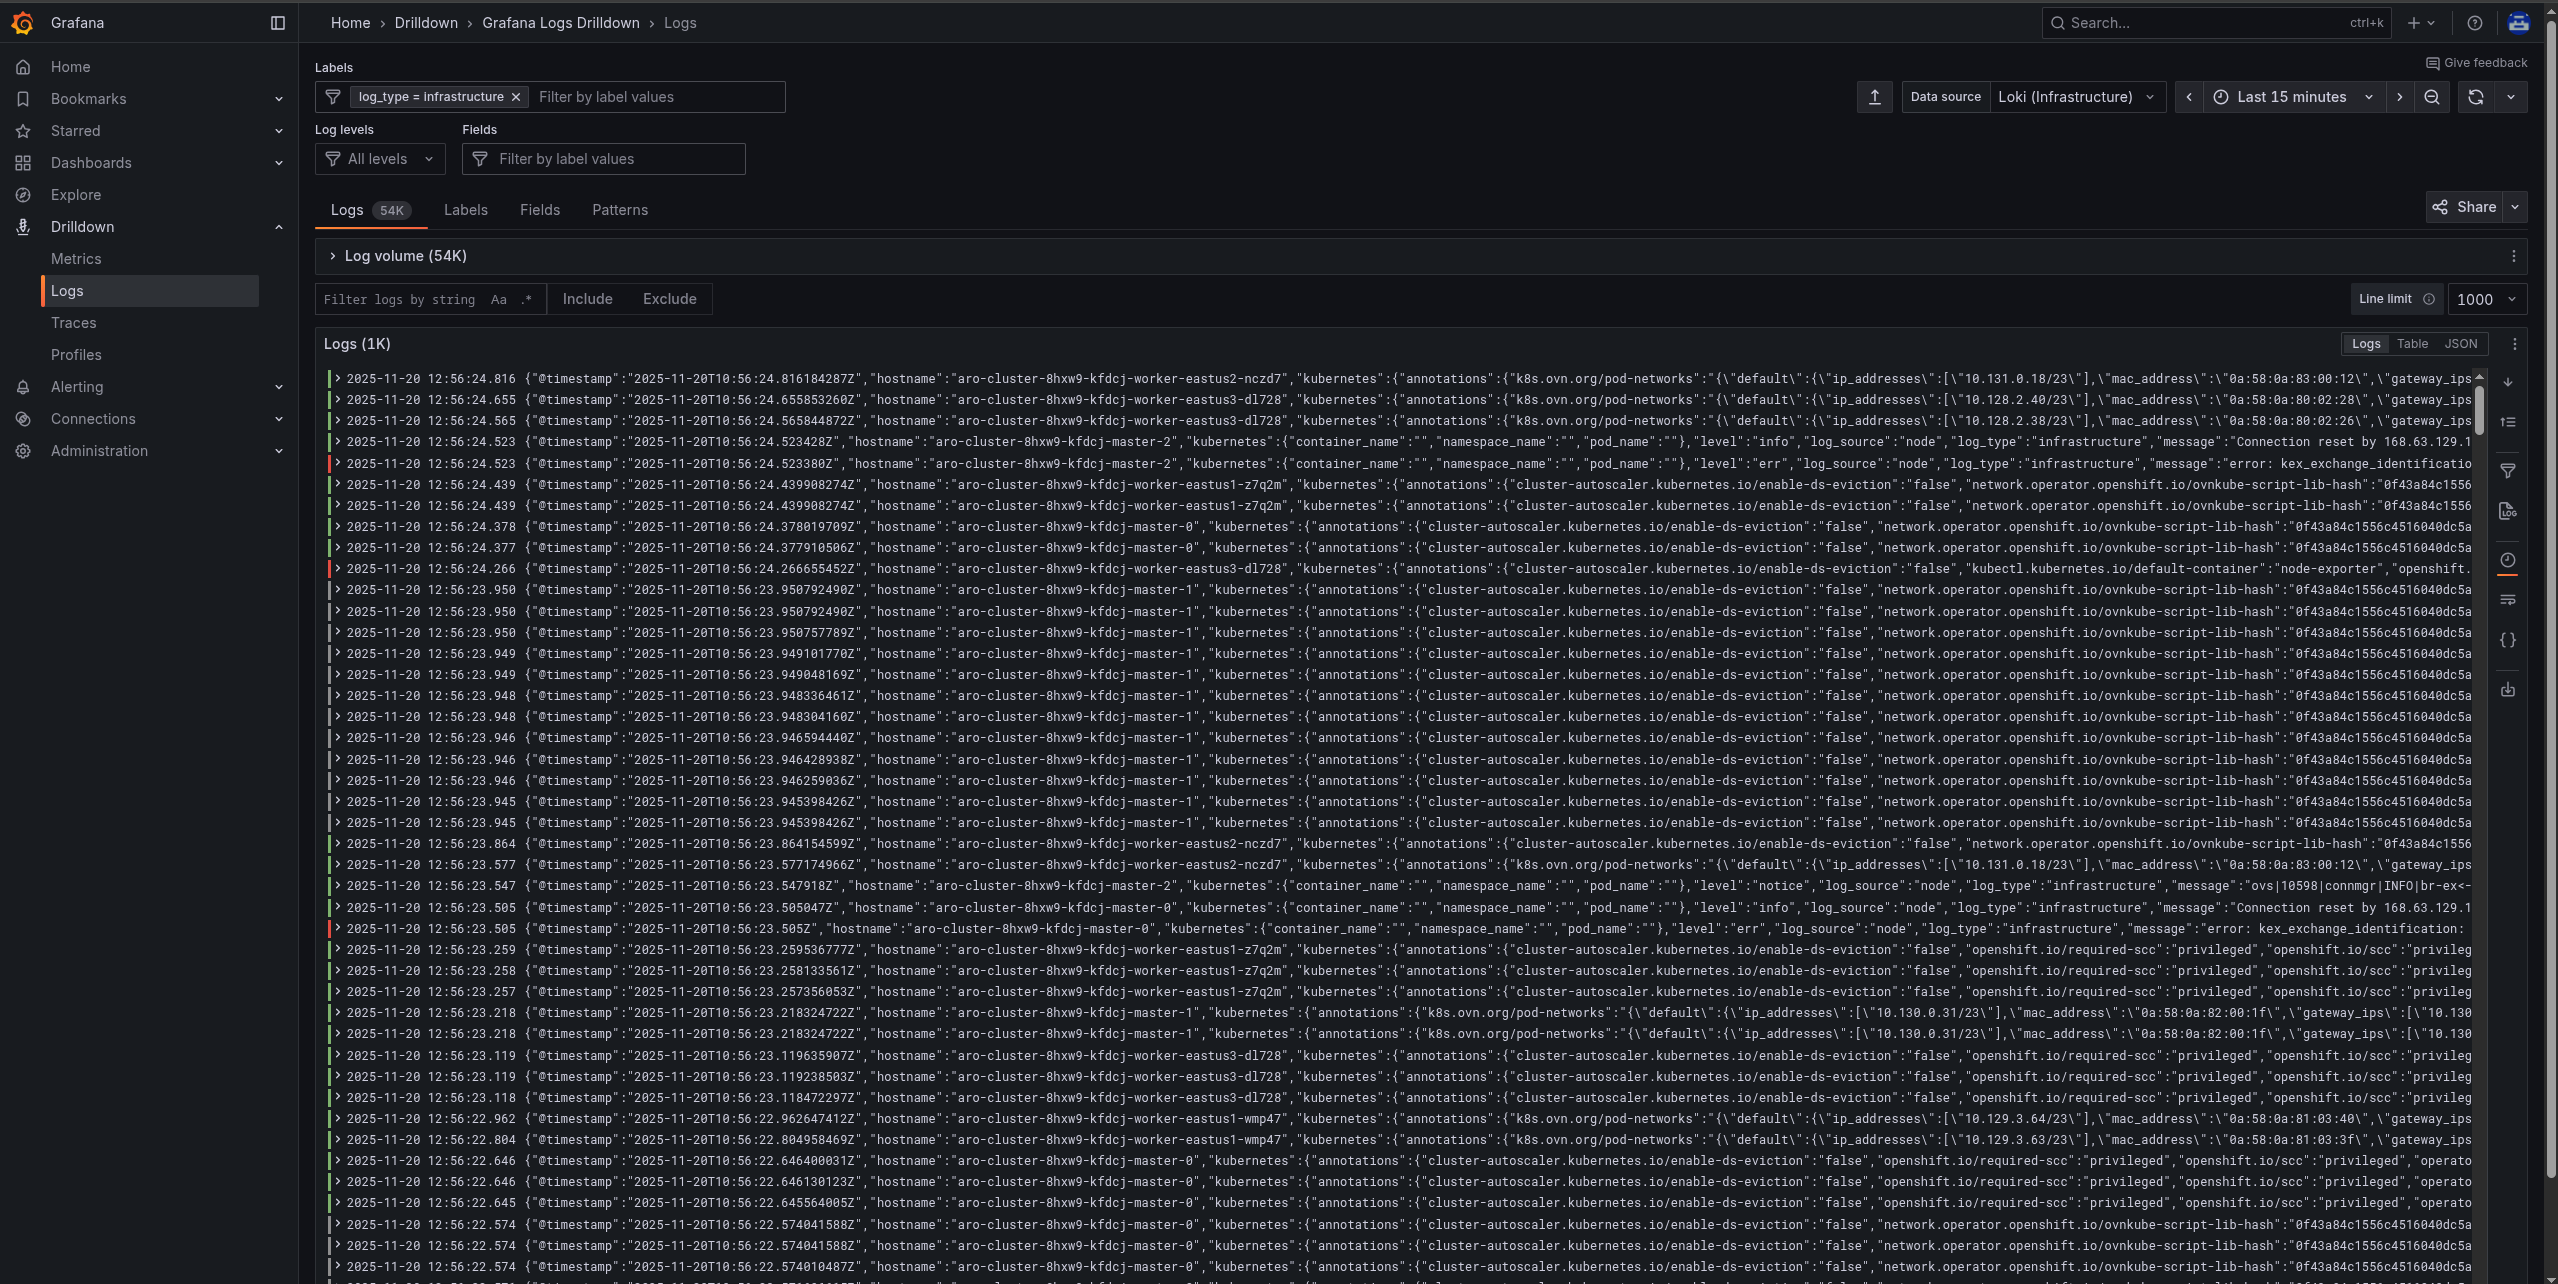
In the labels field first enter
log_typeThen click on the
Use custom value, then click= Equalsand enterinfrastructureComplete the label setup by pressing the enter key.
-
Click the "Show logs" button to view infrastructure logs from loki.
Enabling Custom Metrics
In order to display metrics from your own applications you need to enable custom metrics. We already did this as part of the aro-thanos-af helm chart earlier.
-
Let’s confirm these settings by checking the cluster-monitoring-config ConfigMap object. You can see here how we have enabled the
enableUserWorkload: trueflag and setupremoteWritetothanos.oc -n openshift-monitoring get configmap cluster-monitoring-config -o yamlSample OutputapiVersion: v1 data: config.yaml: | enableUserWorkload: true prometheusK8s: remoteWrite: - url: "http://thanos-receive.custom-logging.svc.cluster.local:9091/api/v1/receive" kind: ConfigMap metadata: namespace: openshift-monitoring annotations: meta.helm.sh/release-name: aro-thanos-af meta.helm.sh/release-namespace: custom-logging labels: app.kubernetes.io/managed-by: Helm name: cluster-monitoring-config -
We can also check that the User workload monitoring has started up (wait until the output below matches what you see):
oc -n openshift-user-workload-monitoring get podsSample OutputNAME READY STATUS RESTARTS AGE prometheus-operator-78774d88c8-vq2pz 2/2 Running 0 23m prometheus-user-workload-0 6/6 Running 0 23m prometheus-user-workload-1 6/6 Running 0 23m thanos-ruler-user-workload-0 3/3 Running 0 23m thanos-ruler-user-workload-1 3/3 Running 0 23m -
You can also review the User Workload Config Map that setups logging via thanos:
oc -n openshift-user-workload-monitoring get \
  configmaps user-workload-monitoring-config -o yaml
Sample OutputapiVersion: v1 data: config.yaml: | prometheus: remoteWrite: - url: "http://thanos-receive.custom-logging.svc.cluster.local:9091/api/v1/receive" kind: ConfigMap metadata: namespace: openshift-user-workload-monitoring labels: app.kubernetes.io/managed-by: cluster-monitoring-operator app.kubernetes.io/part-of: openshift-monitoring name: user-workload-monitoring-config
Congratulations!
Your cluster is now configured to allow custom metrics.
View the Metrics and Logs in the OpenShift console
In addition to viewing logs in Grafana, you can also view logs stored in Azure Blob Storage directly inside the OpenShift console with the help of the OpenShift logging UI plugin. The logging UI plugin is provided by the Red Hat OpenShift Cluster Observability Operator that we installed as part of the aro-clf-blob helm chart.
-
To view metrics, to go the "Observe" left hand menu and then click on "Metrics".
-
To view logs, to go the "Observe" left hand menu and then click on "Logs" and select appropriate filter