VMA Analysis Guide
1. Summary
This lab provides a comprehensive guide on using RVTools to extract detailed inventory data from VMware vSphere environments and utilizing the VMA-ANALYSIS Jupyter Notebook to analyze and interpret the collected data. It covers the entire workflow, from setting up the necessary environment to executing the analysis and extracting meaningful insights.
Additionally, this lab outlines the required software dependencies, environment configurations, and the step-by-step process for conducting the analysis. By the end of the lab, users will be equipped with the skills to efficiently process RVTools data and apply the insights for migration planning, performance optimization, and virtualization assessments.
-
Understand the purpose of using RVTools for data extraction.
-
Set up the necessary environment for running Jupyter Lab.
-
Execute the Jupyter Lab notebook for processing RVTools data.
-
Interpret the extracted data for actionable insights.
-
Understanding the high-level design (HLD) document.
2. Overview of RVTools and VMA-ANALYSIS Tool
2.1. Introduction to RVTools
RVTools is a powerful, free Windows-based utility designed to collect and display detailed inventory data from VMware vSphere environments. Originally released in 2008, it has undergone continuous updates and improvements, making it one of the most widely used tools for VMware infrastructure assessment. Currently, RVTools runs on Windows systems utilizing the .NET 4.7.2 Framework and supports nearly all versions of ESXi and vCenter Server.
This tool provides a comprehensive snapshot of the vSphere infrastructure, offering insights into virtual machines (VMs), hosts, datastores, cluster configurations, networking, storage, and snapshots. Its user-friendly, spreadsheet-style graphical interface (GUI) organizes data across multiple tabs, allowing administrators to explore different aspects of their environment efficiently. Additionally, RVTools allows users to export reports in Excel (.xlsx) or Comma Separated Values (.csv) format, making it easier to analyze and share data.
Assessing your vSphere environment with RVTools is a great way to gather insights into your virtual infrastructure, helping organizations optimize resource allocation, identify potential risks, and plan migrations effectively.
2.2. Enhancing Analysis with VMA-ANALYSIS Jupyter Notebook
While RVTools provides raw data exports, deeper analysis and visualization require additional processing. The VMA-ANALYSIS Jupyter Notebook was designed to bridge this gap by analyzing RVTools-generated reports and providing a structured, interactive approach to data interpretation.
This notebook parses RVTools exports to extract critical VM attributes, evaluates migration feasibility, and generates detailed reports and visualizations. By leveraging NumPy and Pandas, it performs advanced data manipulation, filtering, and calculations, allowing Red Hatters tasked to conduct VMAs to assess workload distribution, migration complexity, and infrastructure details.
-
Comprehensive Inventory Collection:
-
Gathers detailed information about vCenter Servers, ESXi hosts, VMs, clusters, networks, storage, and snapshots.
-
Displays data in an intuitive, tabbed spreadsheet-style GUI.
-
-
Exports reports in Excel (.xlsx) or CSV format for external analysis.
-
VMA-ANALYSIS Jupyter Notebook automates data parsing and report generation.
-
Provides visualizations to highlight key metrics.
-
Assesses migration complexity and feasibility for Red Hat OpenShift Virtualization.
-
Utilizes NumPy and Pandas for structured reporting and efficient calculations.
-
Offers an interactive Jupyter Notebook environment for customized analysis.
By combining RVTools’ data extraction with the VMA-ANALYSIS Jupyter Notebook’s analytical capabilities, Red Hatters can gain deeper insights into client’s vSphere environments and make more informed decisions regarding optimization, migration planning, and infrastructure details.
3. RVTools - Installing, Setting Up and Exporting Data
RVTools is compatible with any version of Windows, provided that .NET Framework is greater or equal to 4.7.2 installed (you can download it from the official Microsoft website). The tool does not have specific operating system requirements beyond this, making it highly flexible and easy to deploy across different Windows environments.
This section is for reference only and can be skipped. We have already provided four pre-generated RVTools files (Section 3.3) for analysis, allowing you to proceed directly to VMA ANALYSIS Tool (Section 4) for processing and interpretation without needing to extract data from vSphere manually. However, you may review this section if you wish to understand the data extraction process in more detail.
3.1. Installing
-
Verify .NET Framework
-
Ensure your Windows system has .NET Framework >= 4.7.2 installed.
-
On the Windows terminal run
reg query "HKLM\SOFTWARE\Microsoft\Net Framework Setup\NDP" /s
-
-
Download RVTools
-
Visit RVTools Download and download the RVTools MSI package.
-
-
Install RVTools
-
Double-click the MSI package and follow the installation prompts.
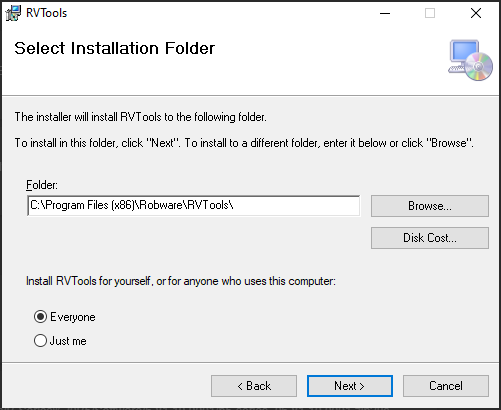 Figure 3.
-
-
Launch RVTools
-
Open the Start menu, type RVTools, and press Enter.
-
Connect to vSphere
-
In the RVTools login interface, enter the IP address or DNS of your vCenter Server or ESXi host, along with your credentials, then click Login.
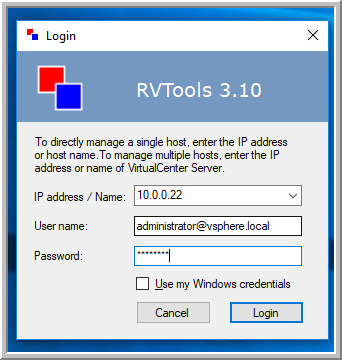 Figure 4.
-
3.2. Usage
-
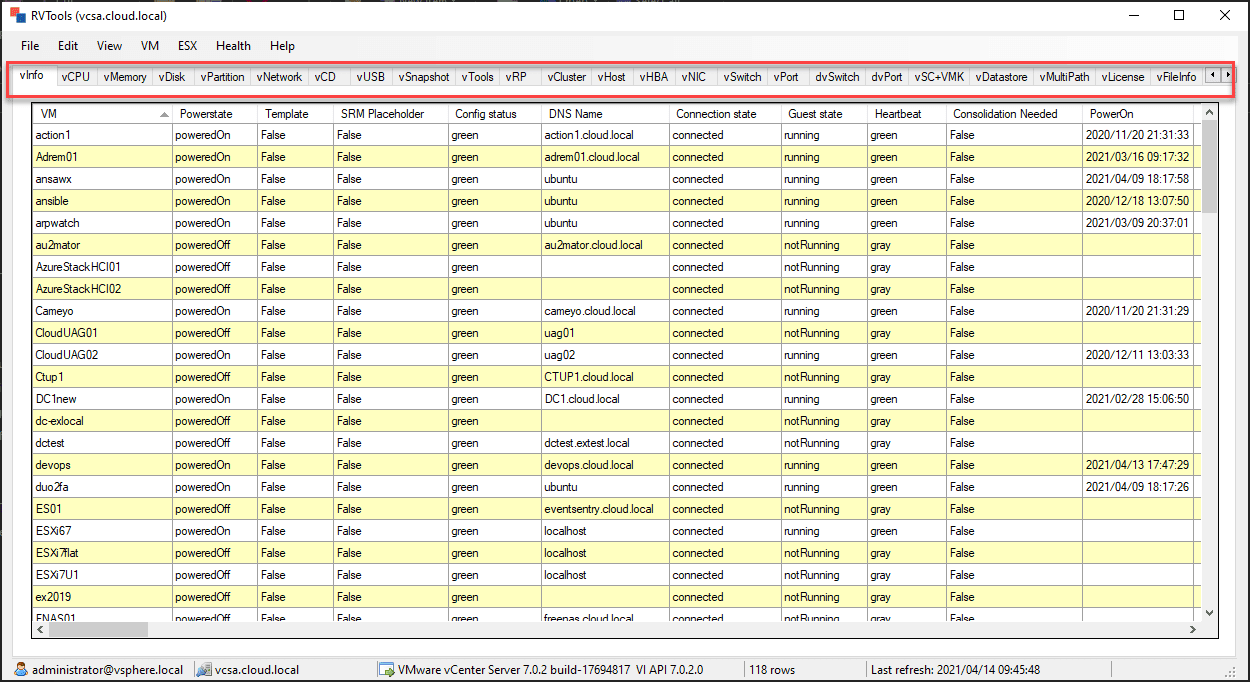
View VM Inventory
-
Upon launching RVTools, the vInfo tab opens by default, displaying detailed information about virtual machines (VMs) in your vSphere environment.
-
This includes key details such as power state, resource allocation, and fault tolerance configuration.
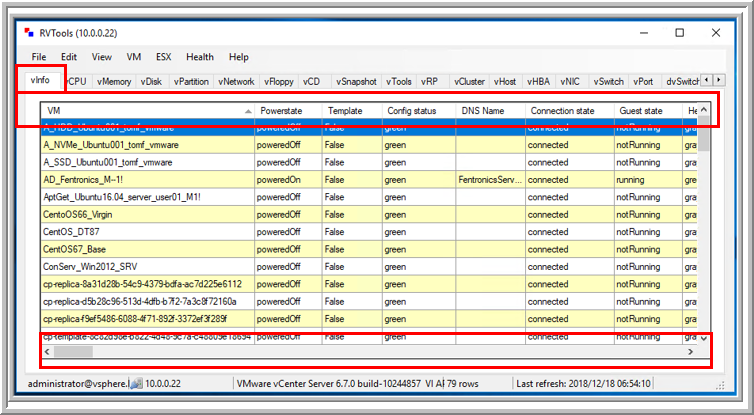 Figure 5.
-
-
Navigate Through Tabs and Data
-
Use the dropdown menus at the top to access different data categories.
-
For example, selecting "Switch" from the ESX dropdown menu will take you to the vSwitch tab, where network configurations are displayed.
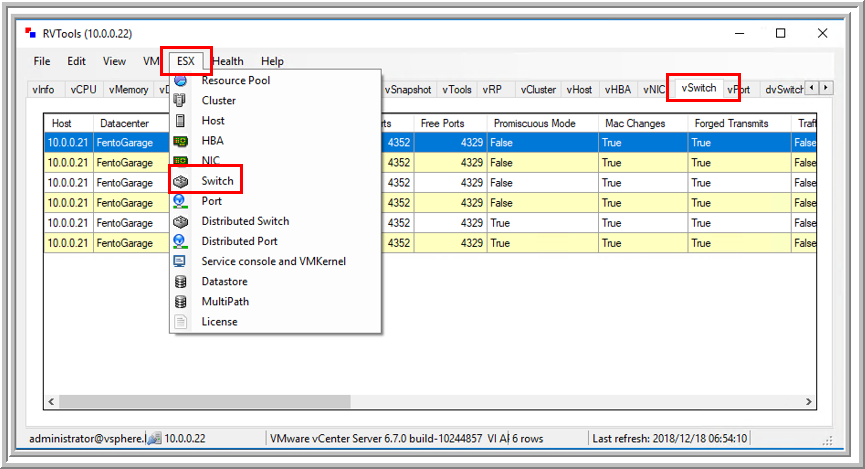 Figure 6.
-
-
Access Documentation for Field Descriptions
-
RVTools provides extensive documentation to explain each field.
-
To access it, go to Help > Documentation, where you can review a 144-page guide detailing all collected data points.
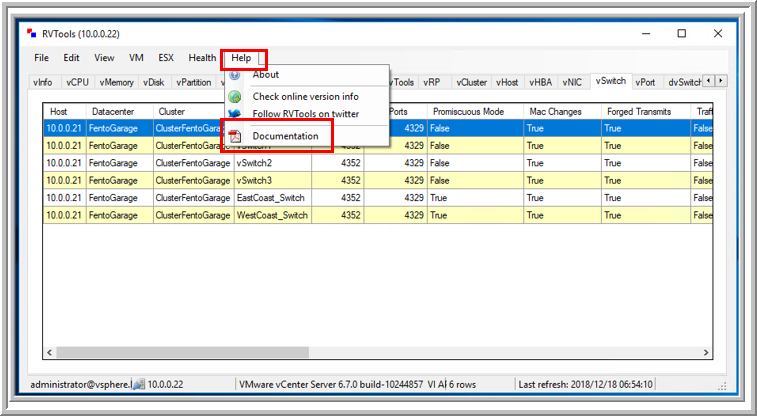 Figure 7.
-
-
Exporting Data
-
Select "File" then "Export all to Excel"
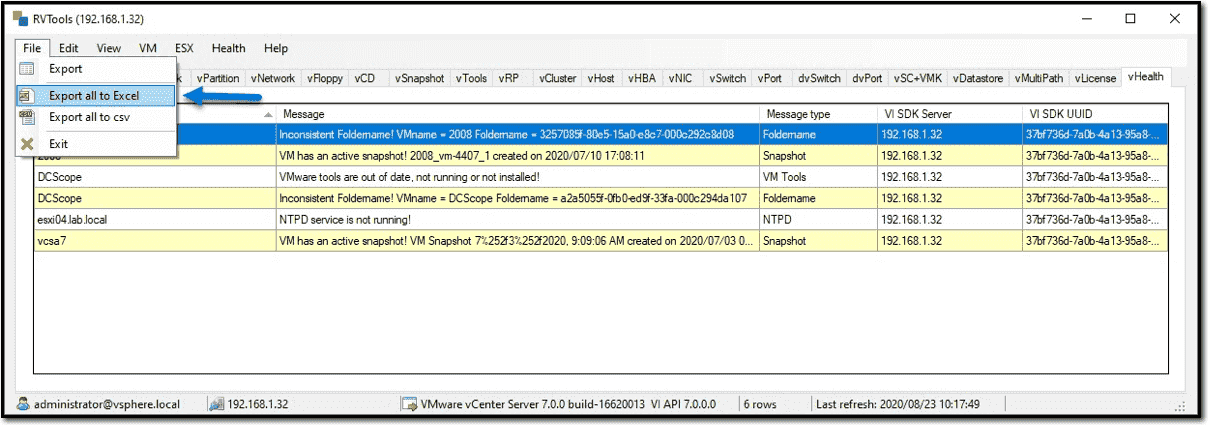 Figure 8.
 -
or using CLI
RVTools -passthroughAuth -s <virtualcenter> -c ExportAll2xlsx -d <directory> –f <filename>ExampleRVTools –passthroughAuth –s vc5.robware.local -c ExportAll2xlsx -d c:\temp –f mytest.xlsx
-
3.3. Provided RVTools Data
We have provided four pre-generated RVTools files from different vCenter environments for analysis in this lab. These files have been sanitized to remove any real data, ensuring privacy and security. Additionally, certain data tab sections have been removed to streamline and optimize data ingestion, allowing for a more efficient analysis process. These modifications help simplify the workflow while still preserving the essential data needed for meaningful insights.
Company "Acme, Inc." has 4 vCenters located in:
|
Please download these files to your laptop, as they will be required later in the lab. |
4. VMA ANALYSIS Tool (Jupyter Notebook)
4.1. Setting the Environment
4.1.1. PreRequisites
-
Ensure the following are installed:
-
Python (>= 3.10)
-
pip (Python package manager)
-
Git (for version control)
-
xclip (clipboard management for Linux)
-
LibreOffice or Microsoft Excel (for spreadsheet processing)
-
-
Ensure the following are installed:
-
Python (>= 3.10)
-
Git
-
LibreOffice or Microsoft Excel
-
Visual Studio (Community Edition) (required for compiling dependencies)
-
Rust (required for some Python dependencies)
-
4.1.2. Setting Up the Environment
|
The tool and repo below are an export of a non-supported project, and are not maintained by Red Hat. It is provided as a reference for educational purposes only and could be used at Consulting engagements without any guarantees. The version of the code provided in this repository for the execution of this lab is not the latest version of the tool. If you are a Red Hatter, please check the latest version of the tool in the following internal Git repository: Git VMA RVTools Analysis. |
-
Clone the Repository
git clone https://github.com/rhpds/etx-virt-vma-factory-showroom.git -
Navigate to the Project Directory
cd vma-rvtools-analysis -
Set Up the Python Virtual Environment
-
Automated Way
A shell script (setup.sh) for Linux/macOS and a batch file (startanalyzer.bat) for Windows are included to automate the setup as well as launch the VMA ANALYSIS Jupyter notebook
Linux/macOS
./setup.shWindows
startanalyzer.bat -
Manual Way
If you prefer to set up the environment manually, follow these steps
-
Linux/macOS
-
Create a virtual environment inside the project’s root directory
python3 -m venv .venv -
Activate the virtual environment
source .venv/bin/activate -
Upgrade pip to the latest version
.venv/bin/pip install --upgrade pip -
Install Dependencies
.venv/bin/pip install -r requirements.txt
-
-
Windows
-
Create a virtual environment
python -m venv .venv -
Add the virtual environment scripts to your system path
set PATH=%USERPROFILE%\mywork\rvtools-virt-analysis\.venv\Scripts;%PATH% -
Activate the virtual environment
.venv\Scripts\activate -
Upgrade pip to the latest version
.venv\Scripts\pip.exe install --upgrade pip -
Install Dependencies
.venv\Scripts\pip.exe install -r requirements.txt-
The commands above create a hidden .venv directory inside the project.
-
Unless you add .venv/bin (Linux/macOS) or .venv\Scripts (Windows) to your system path, you will need to specify the full path when using pip or python.
-
-
-
-
4.2. Preparing the Data
-
Copy Exported Spreadsheets
-
Copy the example RVTools files from
example_rvtools_filesinto thedatadirectory
-
-
Create an Index File
-
Copy the file
index_template.xlsxand rename it toindex.xlsxinside thedatadirectory.
-
-
Update index.xlsx
-
Follow the instructions inside the file.
-
Remove sample entries before proceeding.
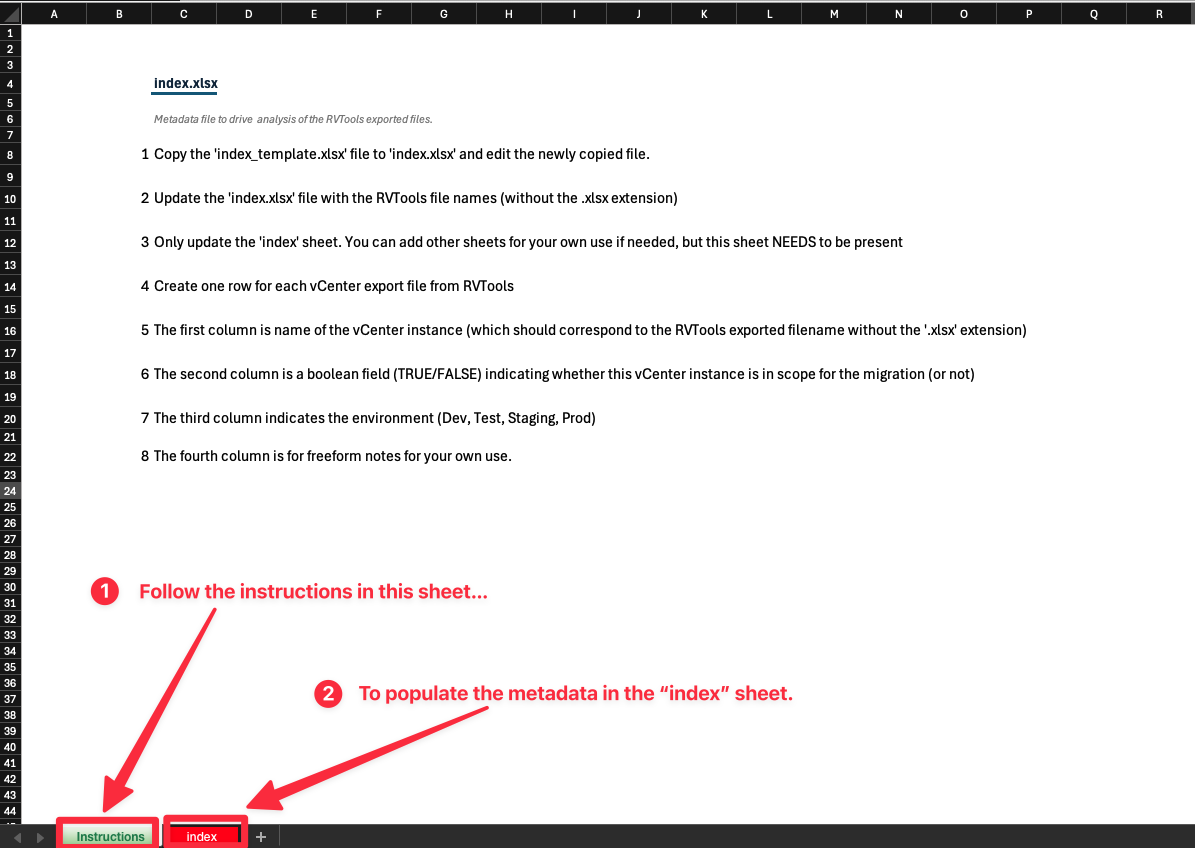 Figure 9.
-
-
Verify Exported Worksheets
-
Ensure the exported RVTools spreadsheets contain the default set of worksheets.
-
The worksheets highlighted in yellow in the following image are mandatory for analysis
 Figure 10.
These sheets must be present with the exact spelling as shown.
-
-
Ensure Correct File Naming
-
The exported spreadsheet filenames (excluding the file extension .xlsx) must match the corresponding vCenter instance names.
-
If the vCenter instance is named
vcenterinstance123, the exported file should be named:vcenterinstance123.xlsxAll RVTools export files must be in lowercase, including both the filenames and the corresponding names referenced in
index.xlsx. Failure to maintain consistent lowercase formatting may result in errors during data processing.
-
-
4.3. Running the Jupyter Lab Notebook
|
If you have already executed the setup.sh (Linux/macOS) or startanalyzer.bat (Windows) script, you can skip this section. These scripts automate the setup process by creating and activating the virtual environment (venv), installing all required dependencies using pip, and launching Jupyter Lab. |
-
Activate the Python Virtual Environment
-
Ensure that the virtual environment is activated in your shell.
-
-
Start JupyterLab
-
Run the following command in the terminal
jupyter lab
-
-
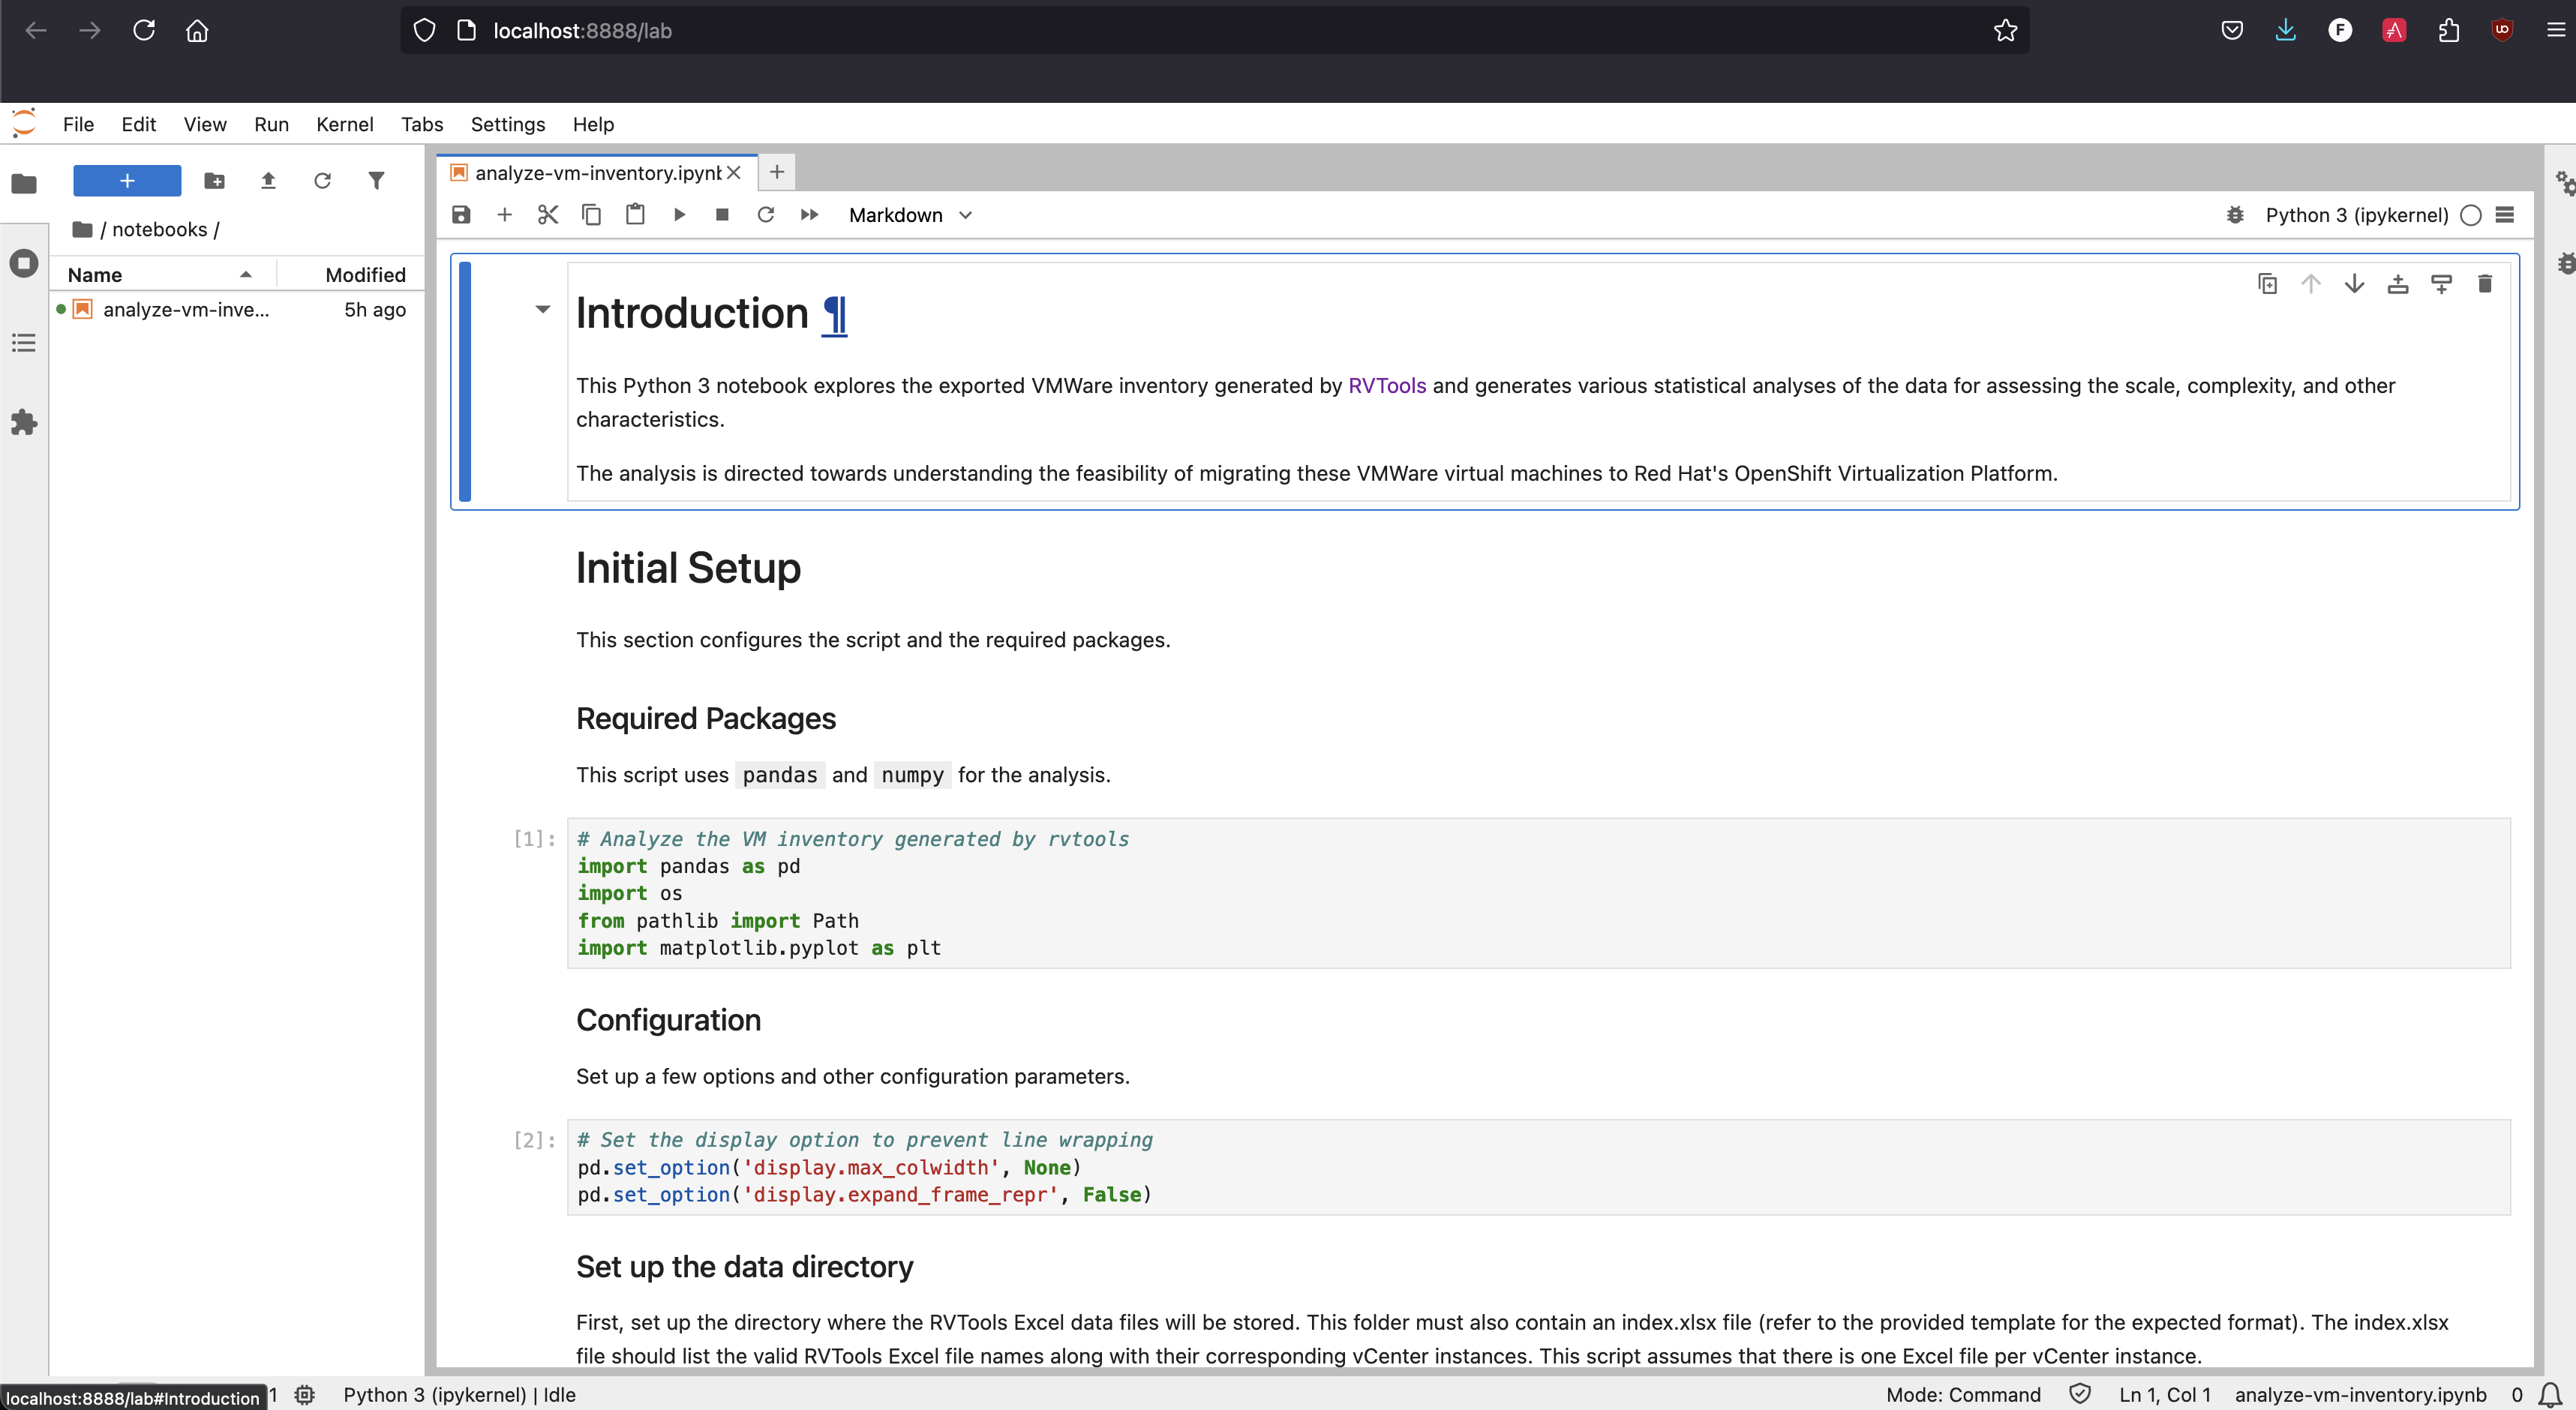
Access the Notebook
-
Jupyter Lab should launch automatically in your default web browser.
-
If it does not open automatically, navigate to: http://localhost:8888/lab
-
-
Once JupyterLab opens, you should see the following interface
If you deployed the rvtool analysis tool in your bastion node, you could access it by forwarding the port using the following command:
ssh -L 8888:localhost:8888 lab-user@<bastion-node> -p <port>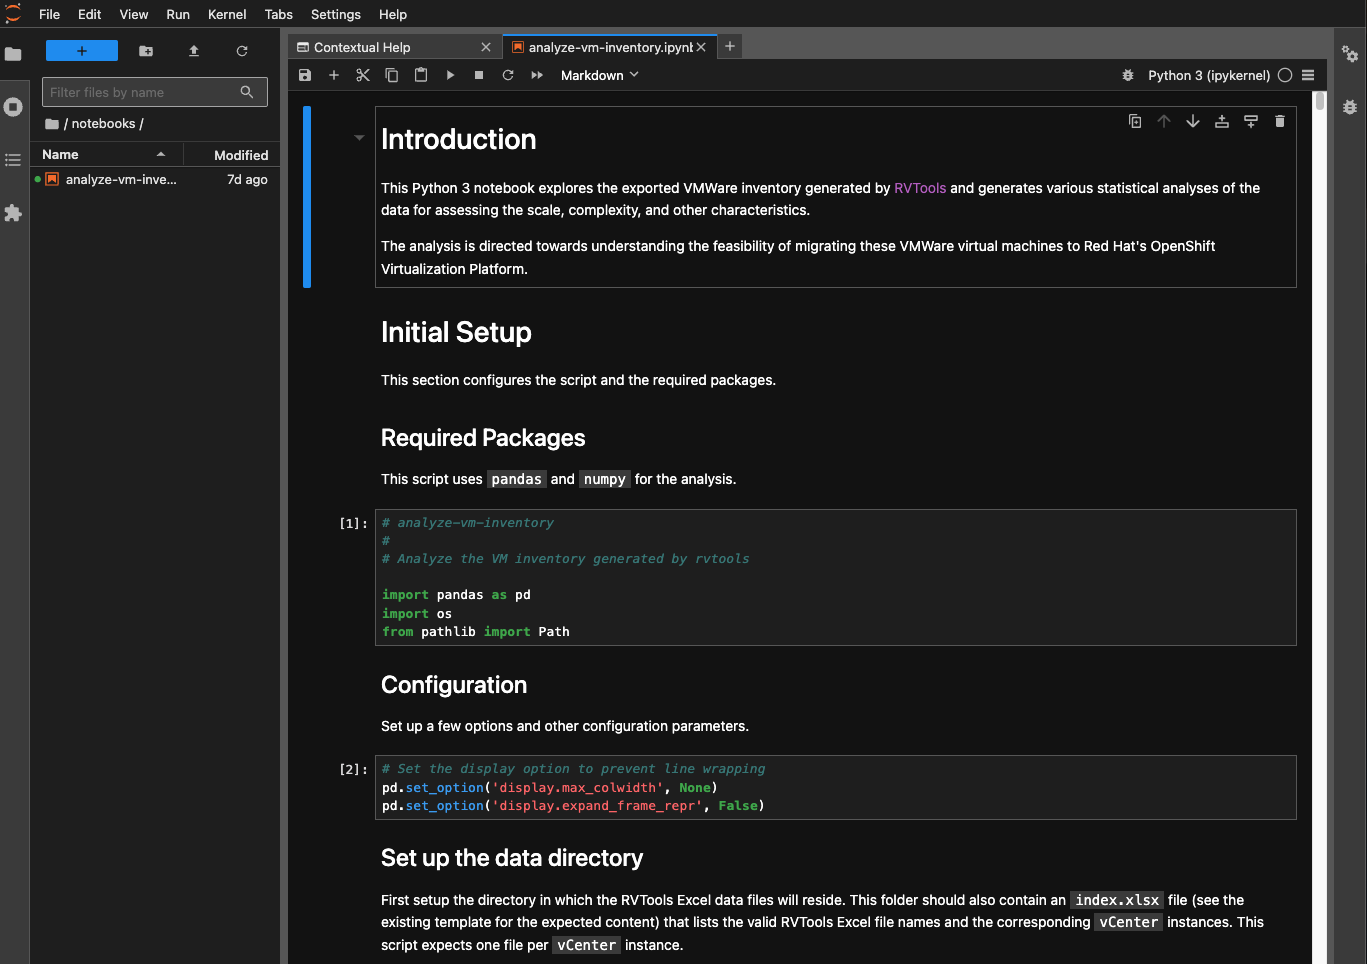 Figure 11.
-
-
Select the Notebook
-
In the file explorer pane on the left, open
analyze-vm-inventory.ipynb
-
-
Follow the Notebook Instructions
-
The notebook contains step-by-step guidance.
-
If the data has been prepared as described earlier, it should run automatically with minimal input.
-
-
-
Execute All Notebook Cells
-
Run all the cells in sequence.
-
The execution should take 60-90+ seconds, depending on the number of vCenter inventory files being processed.
 Figure 12.
-
-
|
These instructions assume the use of a Set nrows to the total number of files + 1 (to account for the header row in the index file). |
4.4. Interpreting the Data
Once the RVTools data has been processed using the VMA-ANALYSIS Jupyter Notebook, the resulting insights will help in understanding the virtual infrastructure and planning migration strategies.
The analysis will provide:
-
Data Ingestion Verification
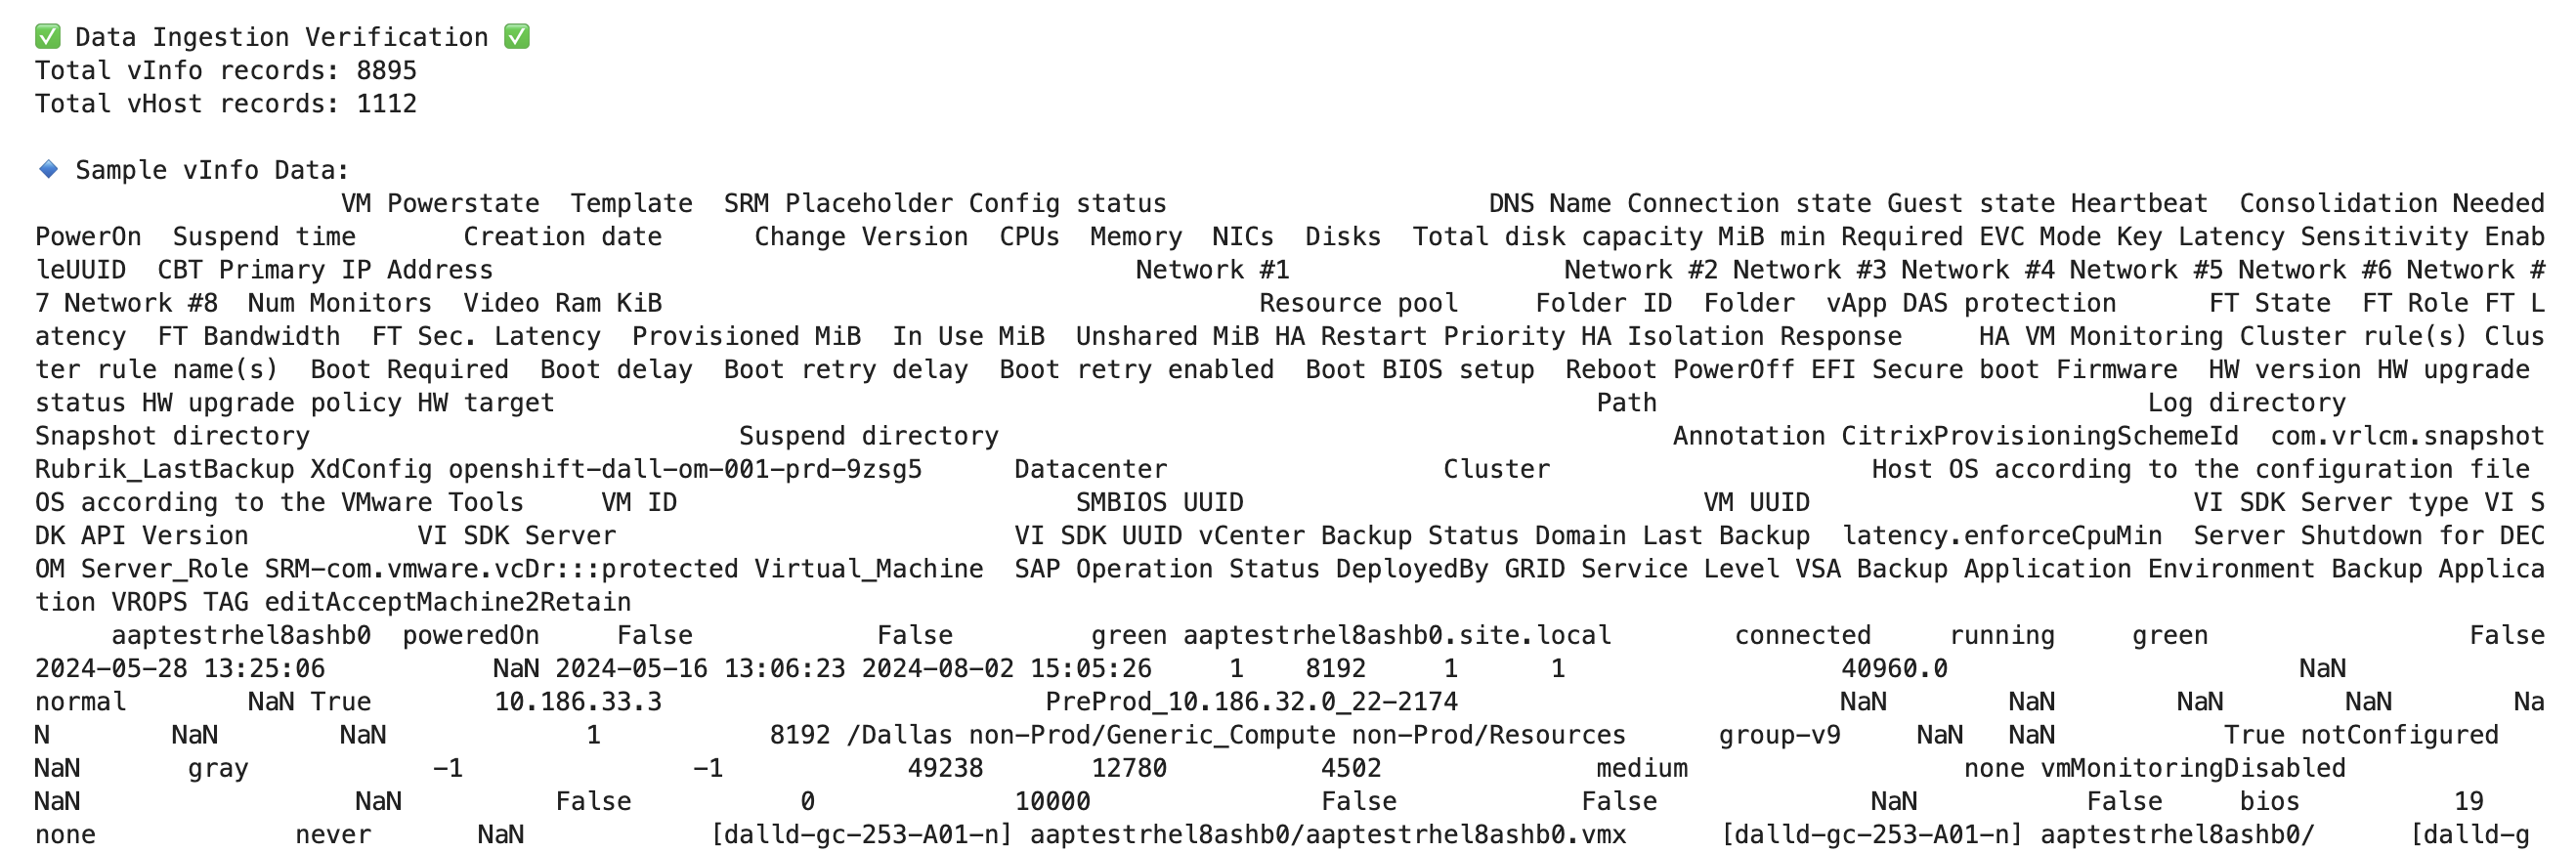 Figure 13.
 -
Distribution of VMs per vCenter
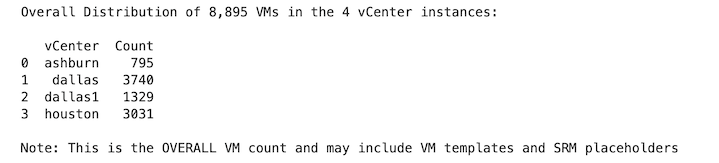 Figure 14.
 -
Insights on resource utilization (for AEs love this info)
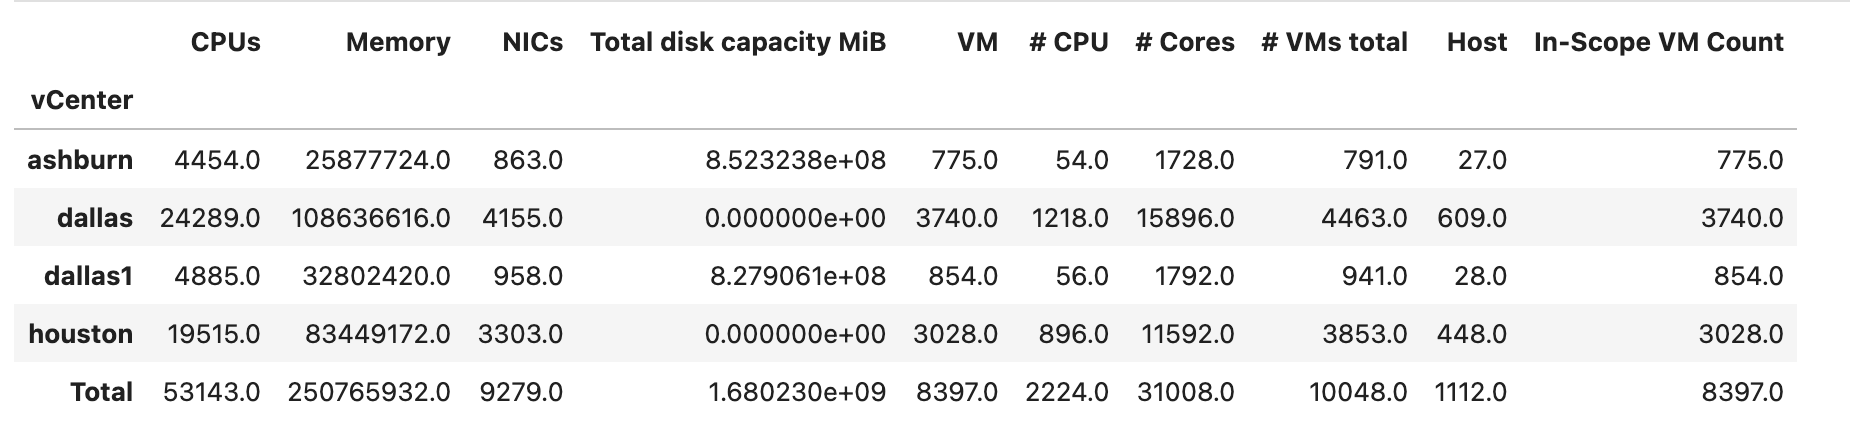 Figure 15.
 -
VM / Host Scope Summary
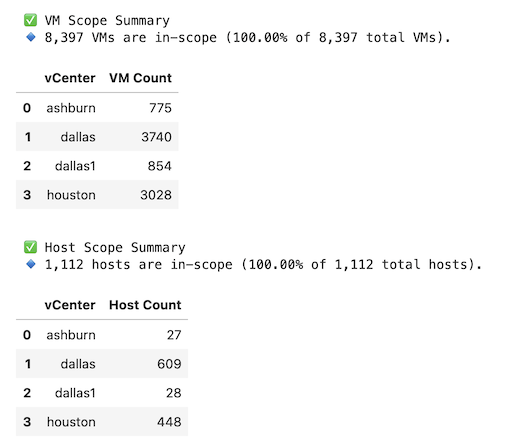 Figure 16.
 -
Host Model Summary
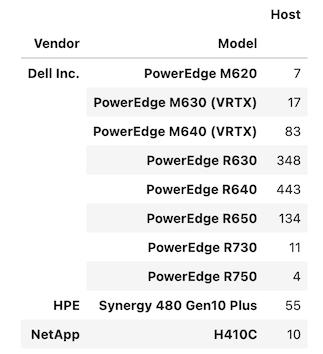 Figure 17.
 -
Disk Usage Summary
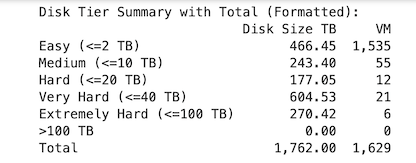 Figure 18.
 -
Supported vs NonSupported OSes
-
Estimated Migration Time
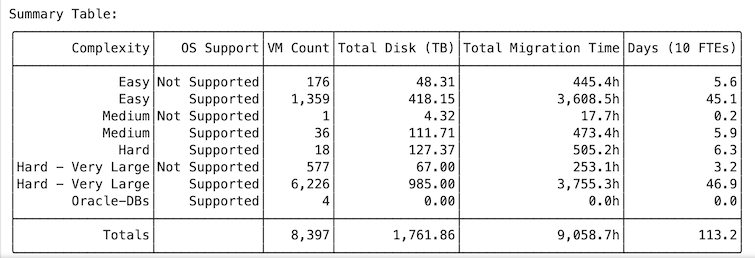 Figure 19.
 -
and much, much more…
Please explore the notebook and its outputs to gain a deeper understanding of the vSphere environment and contribute to the tool if possible.