Module 1: The developer experience
It is your first day at Parasol Insurance. You have been assigned to the claims processing team and given access to the company’s application platform. Your manager has asked you to add a new claims statistics API endpoint to the Parasol application — a feature that will help the business track claim volumes and categories.
You do not need to install anything. You do not need to file a ticket. Everything you need is already waiting for you on the platform.
| If the instructions panel loses its scroll position after toggling the layout view (Split / Instructions / Tabs), toggle the layout mode once more to restore it. |
Learning objectives
By the end of this module, you will be able to:
-
Navigate Developer Hub to discover applications, APIs, and documentation
-
Use self-service templates to create an isolated development environment
-
Write and test code in a cloud-based Dev Spaces IDE with AI assistance
-
Push code through an automated CI/CD pipeline and resolve quality gate failures
-
Verify a GitOps-driven deployment to production
Section 1: Meet the platform
Your first stop is Red Hat Developer Hub — Parasol’s internal developer portal. This is where developers discover services, explore APIs, read documentation, and get AI-assisted answers about the platform. Instead of asking colleagues where things are, you can find everything here.
Exercise 1: Explore Developer Hub
-
Select the Developer Hub tab on the right, or open Red Hat Developer Hub at https://backstage-developer-hub-rhdh.{openshift_cluster_ingress_domain}
-
Log in with your credentials using the OIDC provider:
Username:
{user}Password:
{password}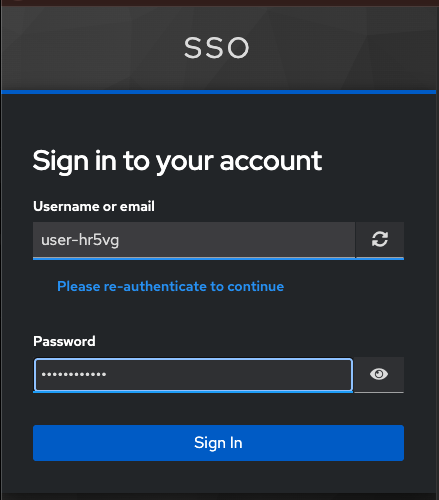
-
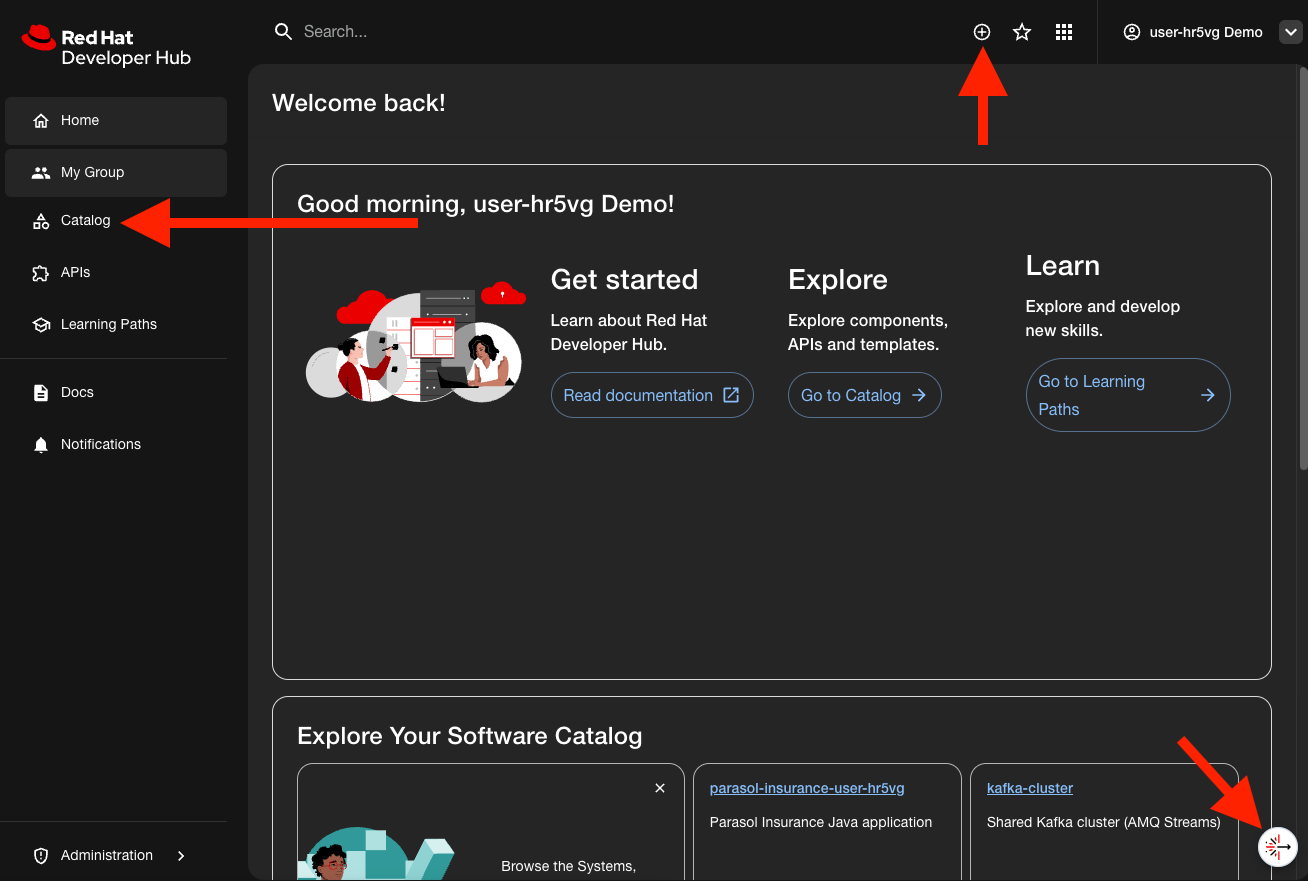
After logging in, you will see the Developer Hub home page. This is the starting point for all developer activity at Parasol.
-
Take a moment to look around the interface:
-
Catalog (left sidebar) — the software catalog where all applications, components, and APIs are registered
-
Self-Service (the + button at the top of the page) — templates for provisioning new projects and environments
-
Lightspeed (the hovering icon in the bottom-right corner) — an AI assistant that can answer questions about the platform
-
Exercise 2: Find the Parasol application in the software catalog
-
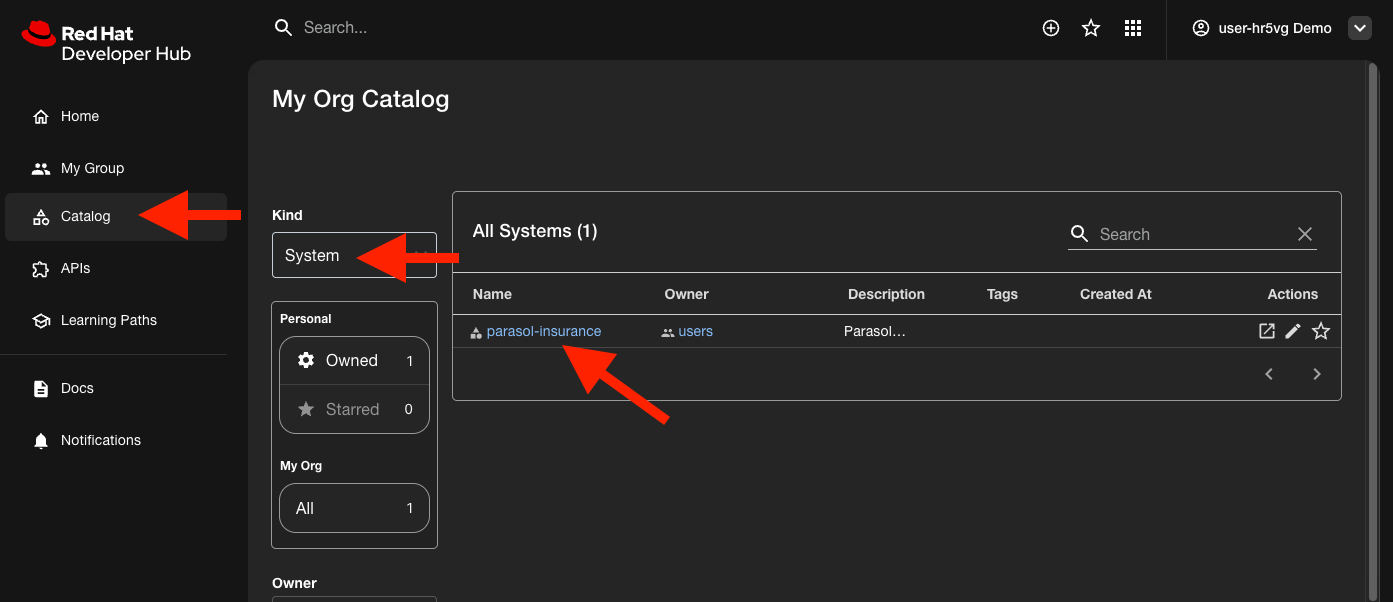
Click Catalog in the left sidebar.
-
Use the Kind dropdown to filter for System entities.
-
Find and click on parasol-insurance.
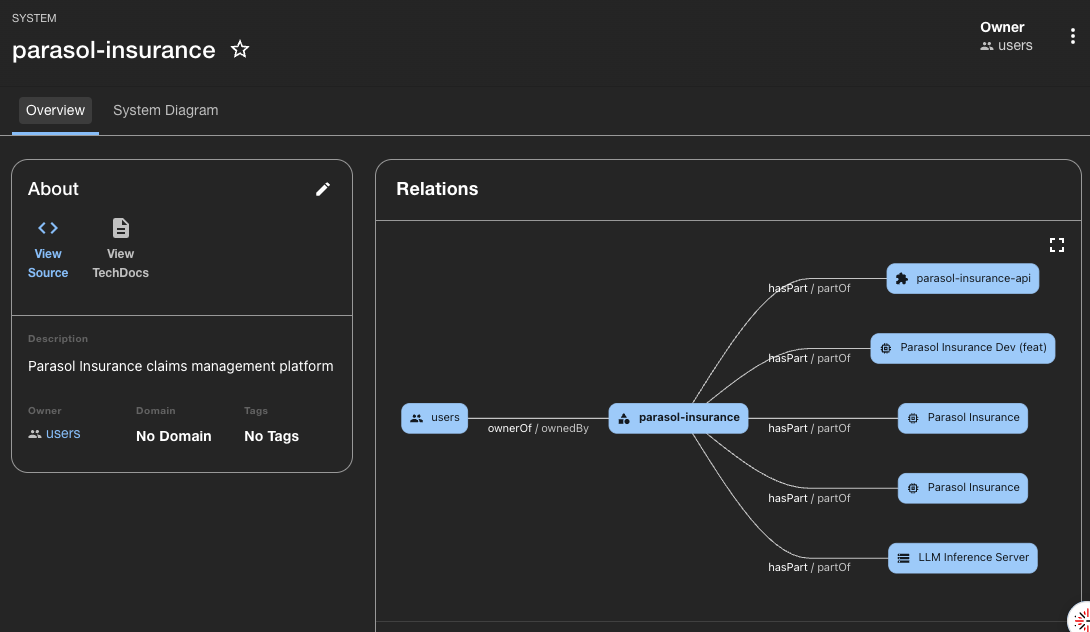
This is the Parasol Insurance application system. It groups all the components, APIs, and resources that make up the application.
-
Explore the system view:
-
Notice the components registered under this system
-
Look at the dependency relationships between components
-
Click on a component to see its detail page
-
-
On the component detail page, explore the tabs:
-
Overview — ownership, lifecycle, and system information
-
API — provided and consumed API definitions
-
Relations — what this component depends on and what depends on it
-
-
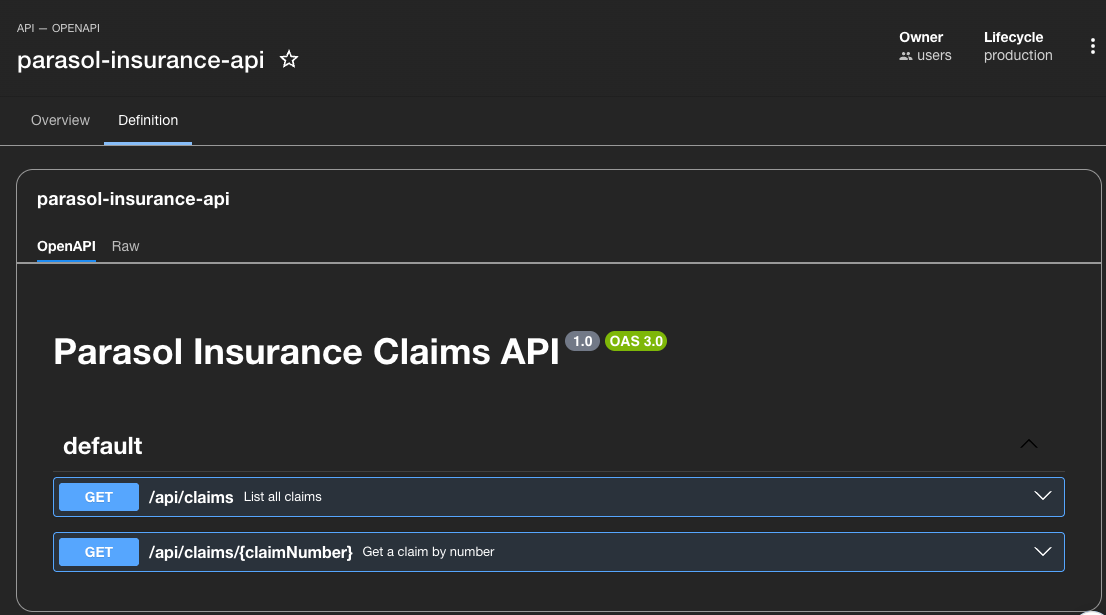
On the API tile, find the parasol-insurance-api. Click on it, then select the Definition tab.
The API documentation is rendered directly from the source repository. When the code changes, the docs stay current automatically — no separate wiki to maintain.
Exercise 3: Ask the AI assistant
Developer Hub includes an AI assistant called Lightspeed that can answer questions about your applications, APIs, and documentation.
-
Click the Lightspeed icon in the bottom-right corner of the Developer Hub interface.
-
Use the three dots menu in the top-right of the Lightspeed window to switch to full-screen view.
-
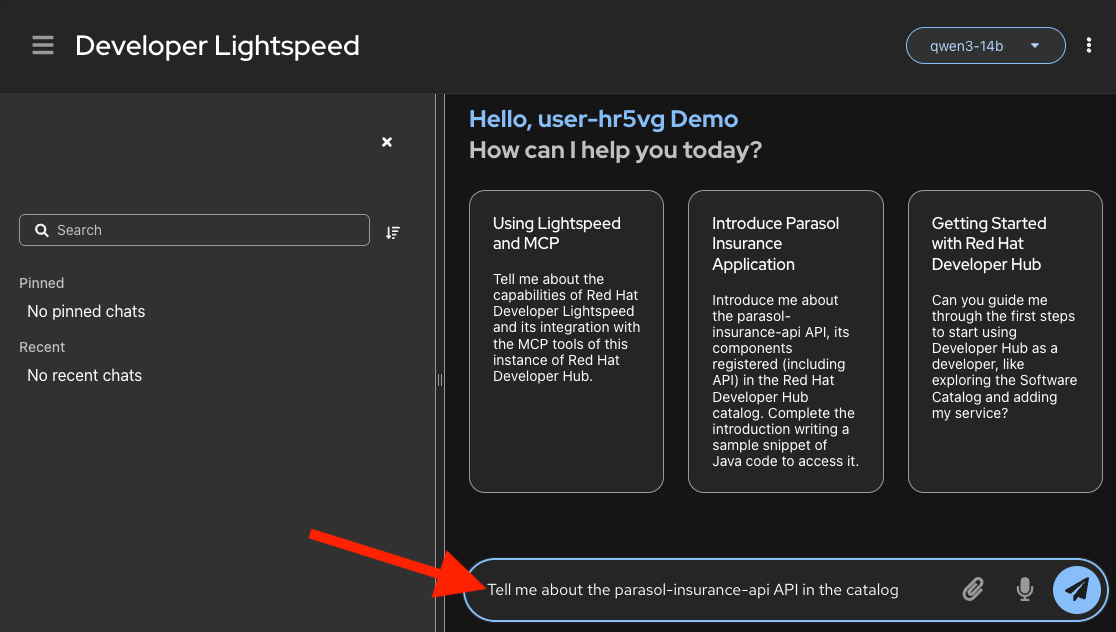
Try asking a question about the Parasol application:
Tell me about the parasol-insurance-api API in the catalog -
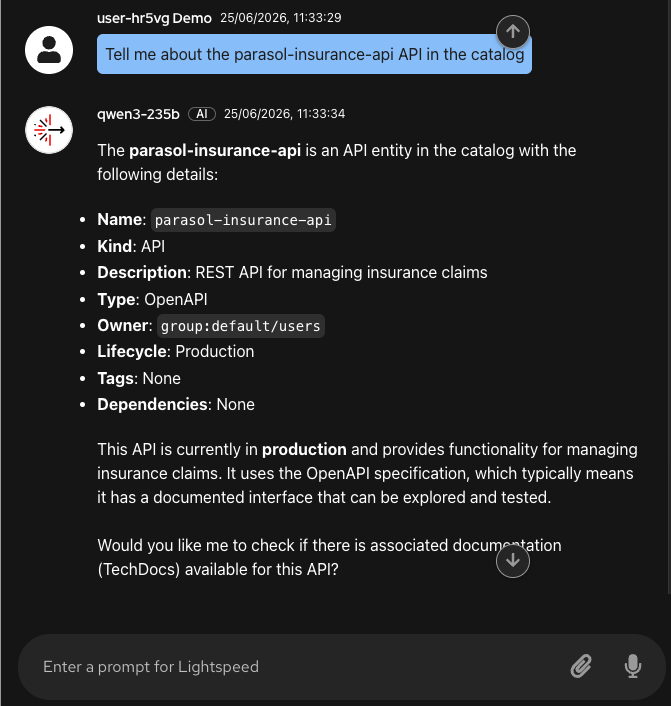
Review the response. Lightspeed pulls information from the software catalog and documentation to give you contextual answers.
-
Try another question:
What components make up the parasol-insurance system?
| Lightspeed responses may vary between attempts. If it does not find a specific entity on the first try, ask it to "list all APIs in the catalog" first, then re-ask your original question. |
Section 2: Your mission
Now that you know your way around, it is time to get to work. You have been assigned a task: add a claims statistics API endpoint to the Parasol application. Before you start coding, you need to set up an isolated development environment with its own CI/CD pipeline.
Exercise 1: Create a development environment
Developer Hub provides self-service templates that let you provision environments without filing tickets. The platform team has created a template that sets up everything you need: a feature branch, a dedicated pipeline, and a catalog entry to track your work.
-
In Developer Hub, click the Self-Service button (the + icon) at the top of the page.
If Lightspeed is still covering the interface, close it by clicking the small X icon in the bottom-right corner. The assistant is always available — you can reopen it at any time by clicking the same hovering icon. -
Browse the available software templates. These are golden path templates maintained by the platform team.
-
Select the Parasol Insurance Development Environment template (or similarly named template).
-
Fill in the template form:
-
Branch name: Enter a short name for your feature branch, for example:
claims-statsKeep the branch name short. It will be used to generate OpenShift Routes, which have length restrictions. 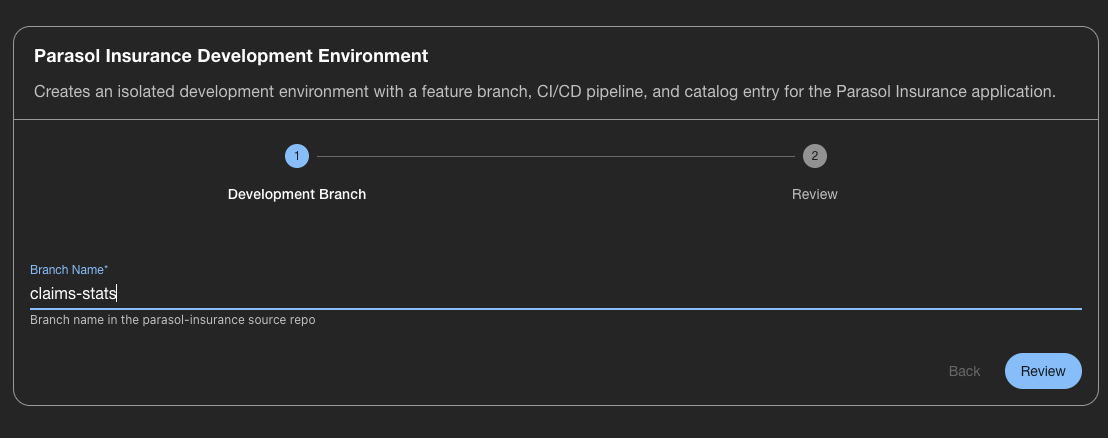
-
-
Click Review to review the details, and then click Create and watch the provisioning progress:
-
A feature branch is created in the source repository
-
A CI/CD pipeline is configured for your branch
-
A new component is registered in the Developer Hub catalog
-
-
When provisioning completes, click Open in Catalog to see your new component.
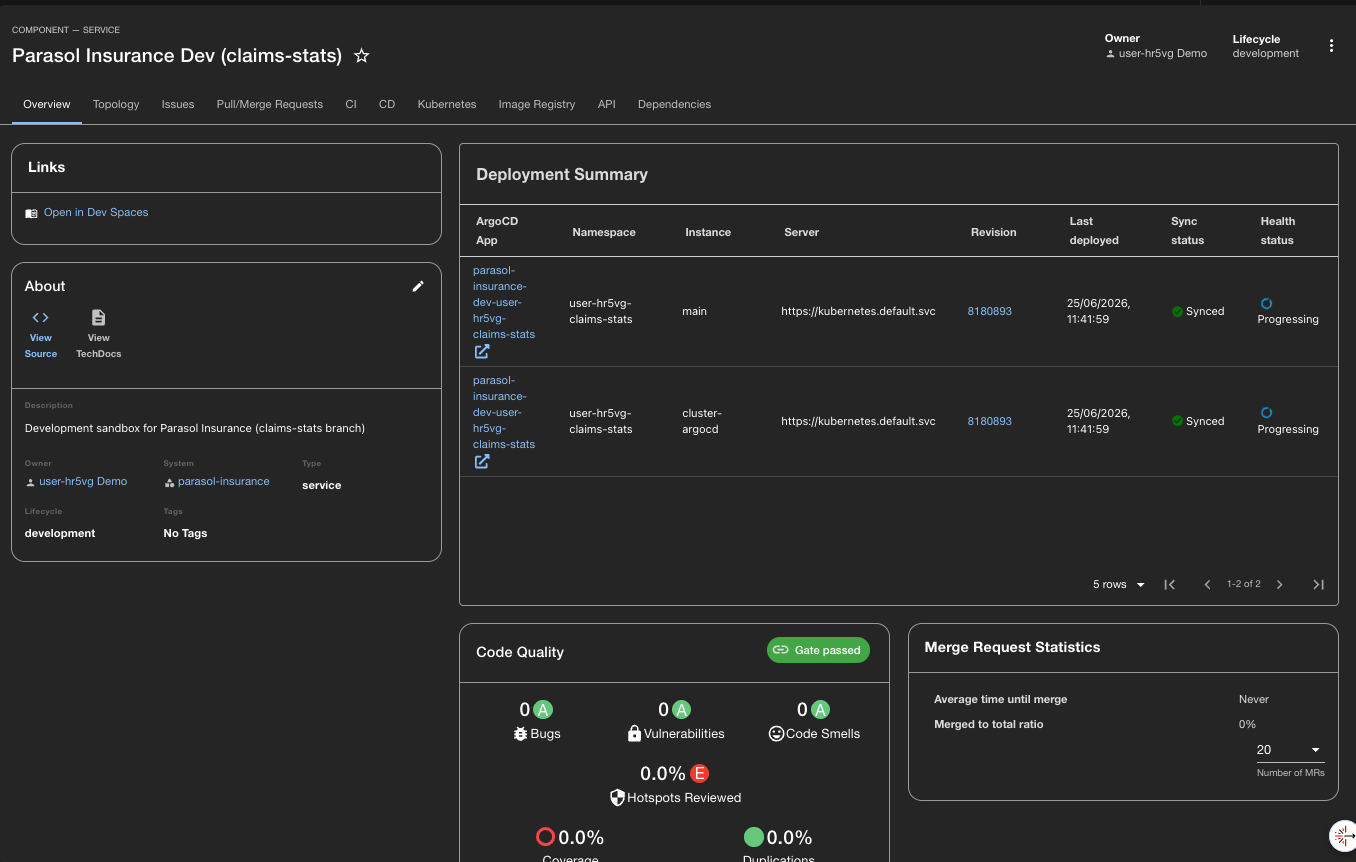
-
On the component page, click View Source to open the feature branch in GitLab.
You may be prompted to log in to GitLab. Use the same credentials:
Username:
{user}Password:
{password}Take a look at the repository — this is the branch where your changes will live until you merge them.
Section 3: Build the feature
With your development environment ready, it is time to write code. You will use Red Hat OpenShift Dev Spaces — a cloud-based IDE that runs entirely in the cluster. No local setup, no dependency conflicts, no "works on my machine" problems.
Exercise 1: Open Dev Spaces
-
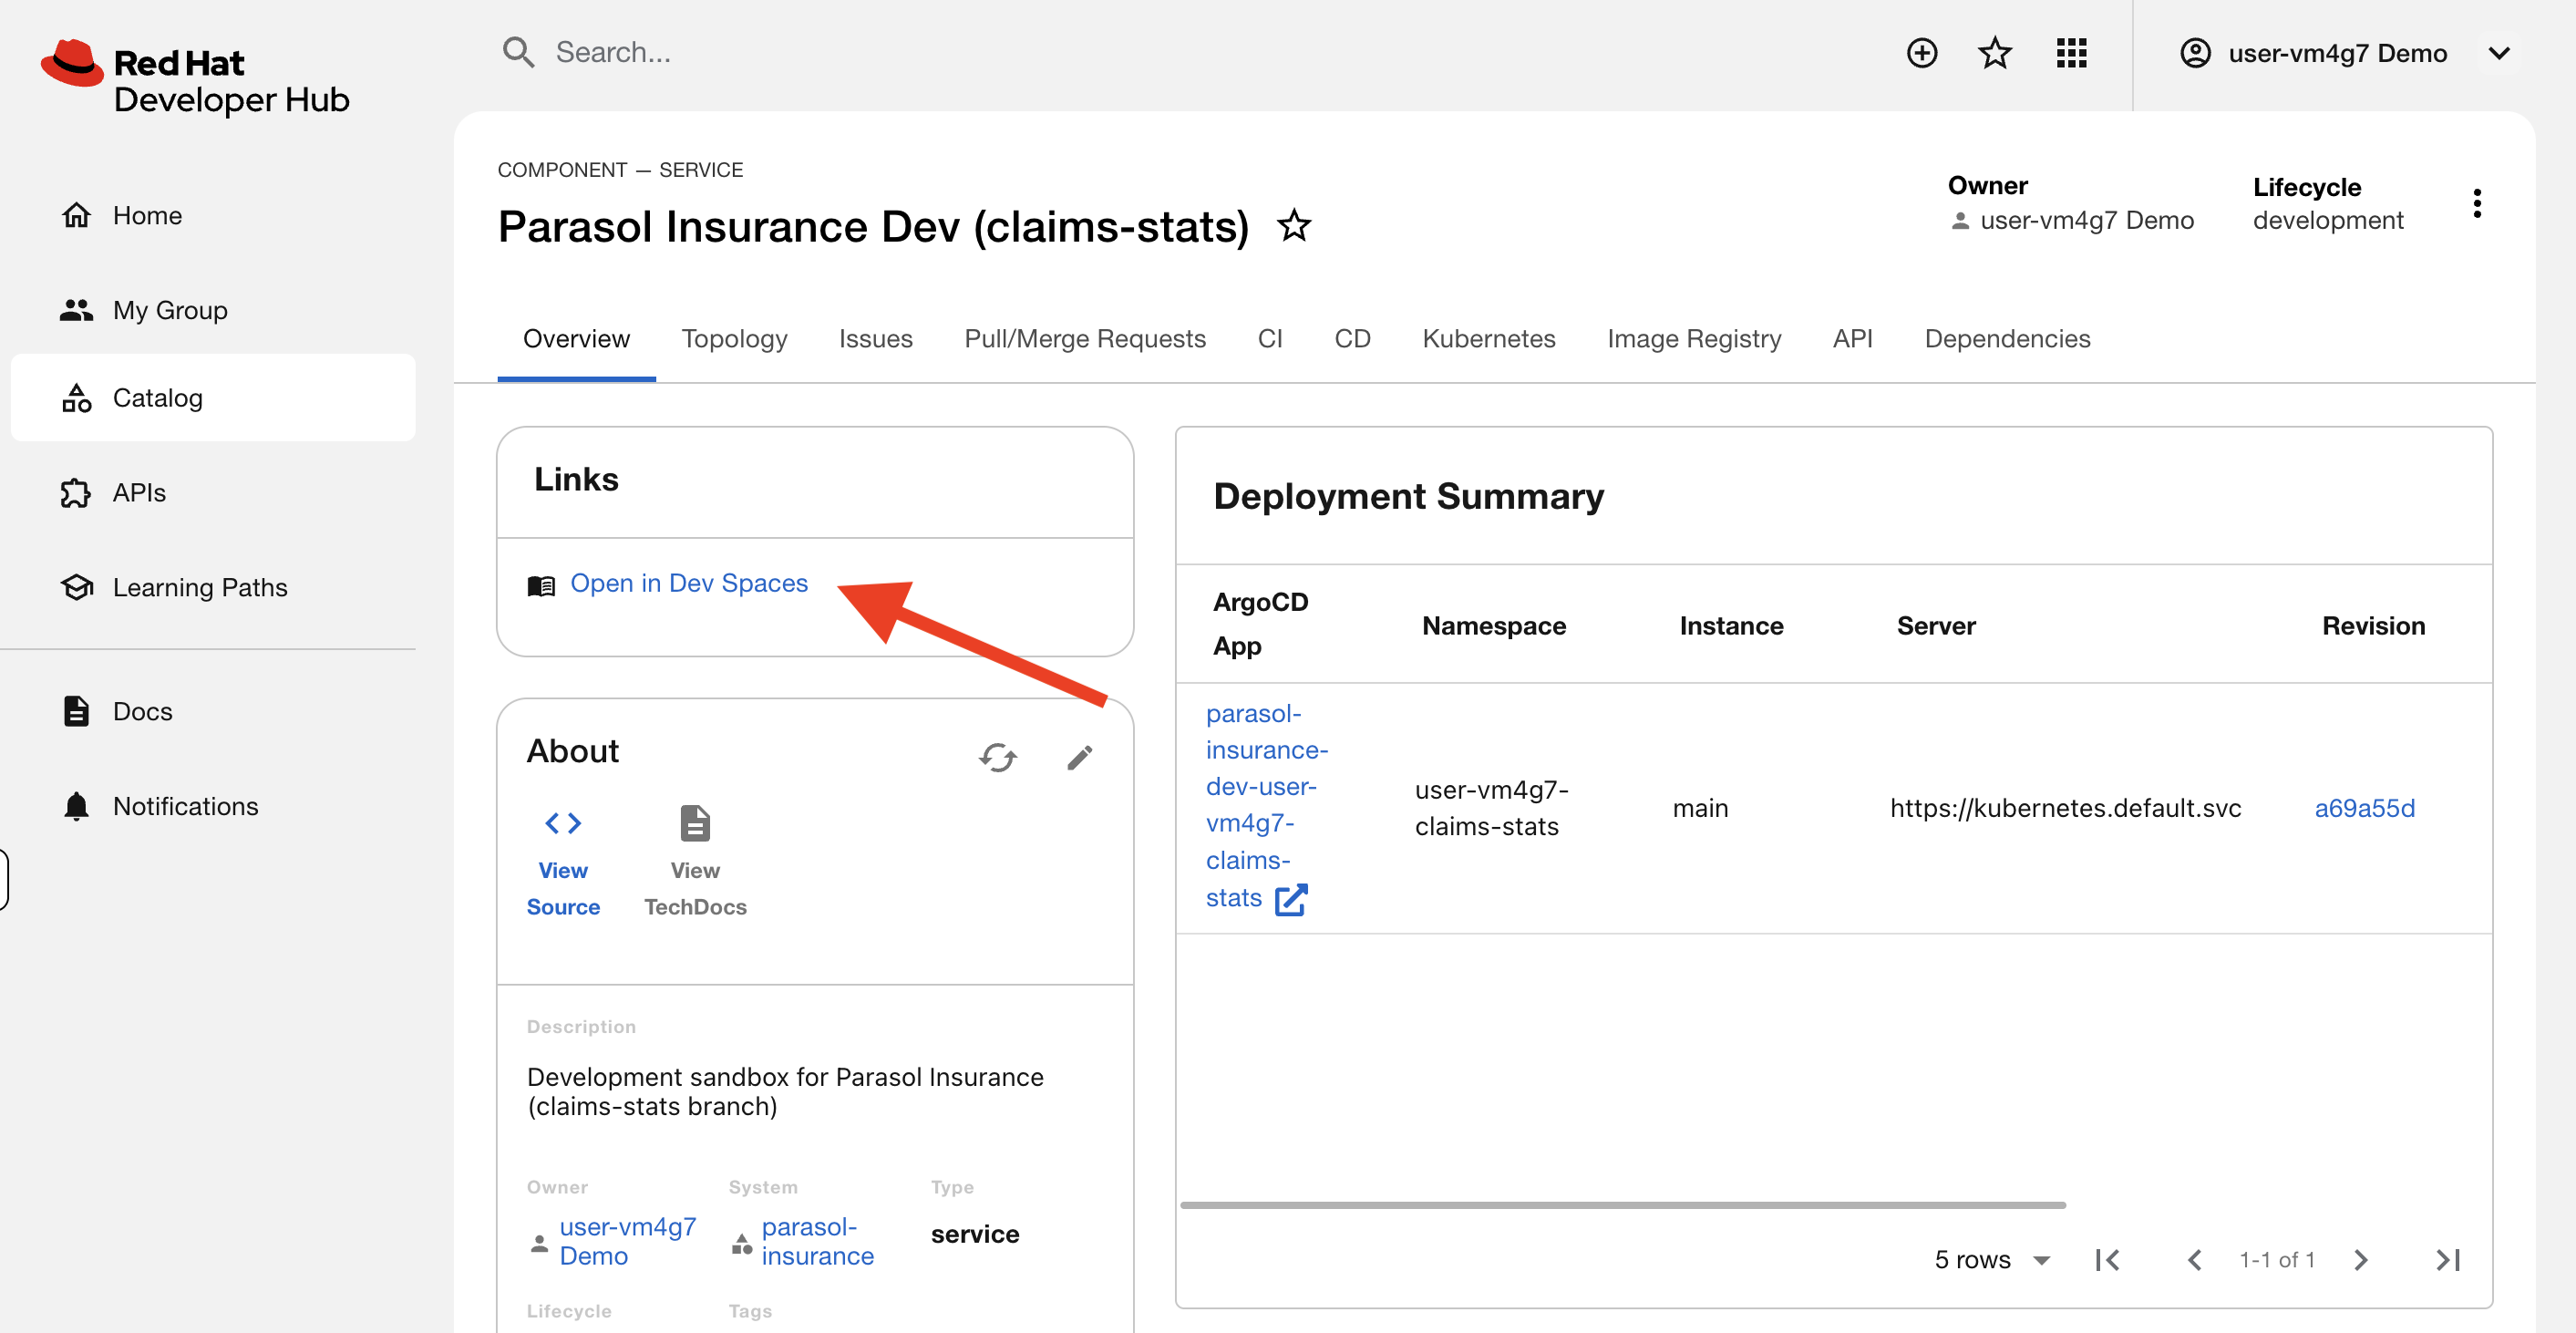
From your component overview page in Developer Hub, click the Open in Dev Spaces link to open a cloud workspace for your feature branch.
Alternatively, you can open Dev Spaces directly at https://devspaces.{openshift_cluster_ingress_domain} and create a workspace from your repository URL.
-
The first time Dev Spaces opens, click Log In With OpenShift. You will see several authorization prompts. These are security gates that ensure the IDE only acts with your explicit consent:
-
Authorize access to OpenShift — click Allow selected permissions
-
Do you trust the authors of this repository? — click Continue
-
GitLab login — log in with your credentials if needed (username:
{user}, password:{password}) -
GitLab Authorization — click Authorize to give DevSpaces permission to open your branch (if you wait too long here, you may need to click Retry to try again after giving permission)
-
-
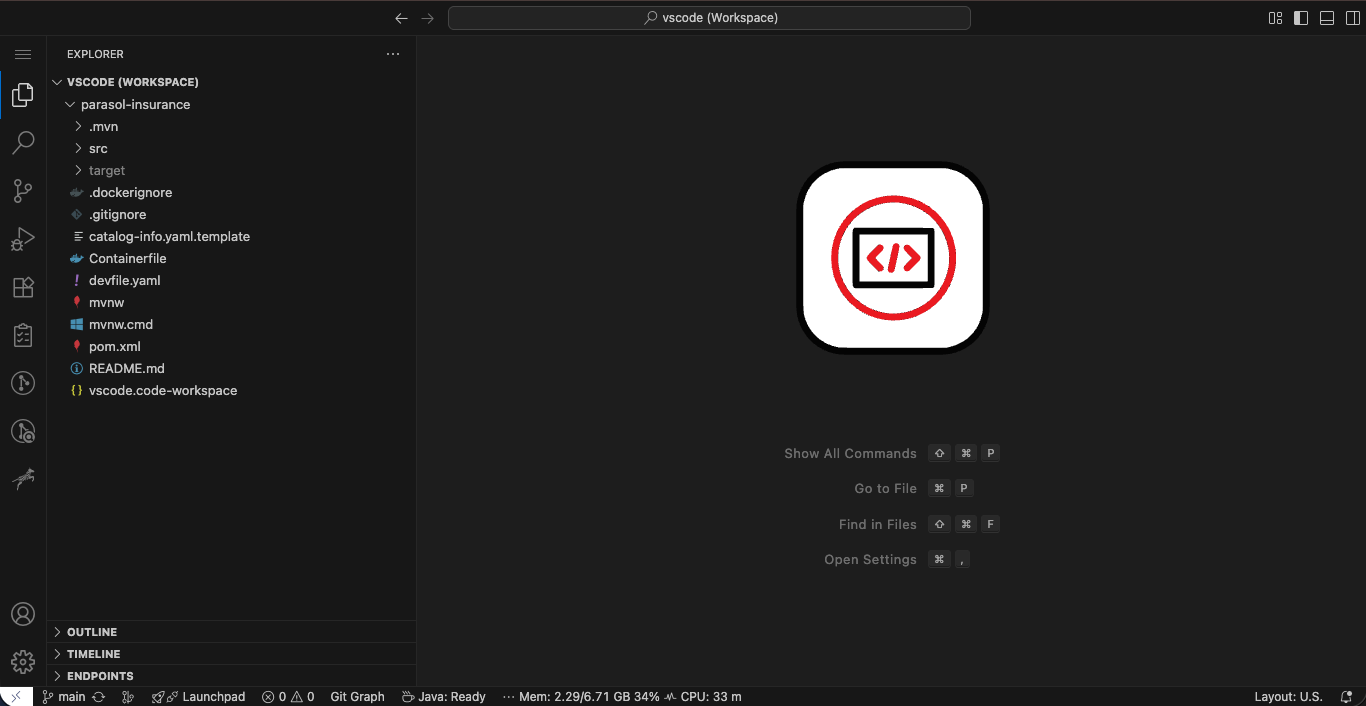
Once the workspace loads, take a moment to explore:
-
Trust the workspace files — click Yes, I trust the authors
-
Trust publishers and install — click to install the recommended extensions including the AI coding assistant
-
Dismiss any popups about MicroProfile or Dependency Analytics by clicking the X
If you miss the "trust the authors" prompt, Dev Spaces opens in Restricted Mode and you will see a highlighted banner at the bottom of the window. Click the banner to confirm trust so extensions load properly. -
The file explorer shows the complete project structure
-
The terminal has CLI tools pre-installed (
oc,mvn, etc.) -
Extensions for Java, Quarkus, YAML, and the AI coding assistant are already configured
-
Git is connected to your feature branch
-
-
Exercise 2: Start the application in development mode
Before writing new code, start the application to see what you are working with.
-
Press Ctrl+Shift+P (or Cmd+Shift+P on Mac) to open the command palette.
-
Type and select Tasks: Run Task.
-
Select the devfile task group.
-
Select Start Development Mode (Hot Reload + debug).
-
Wait for the application to start. When Dev Spaces shows a popup notification to open the application, click to Open In New Tab.
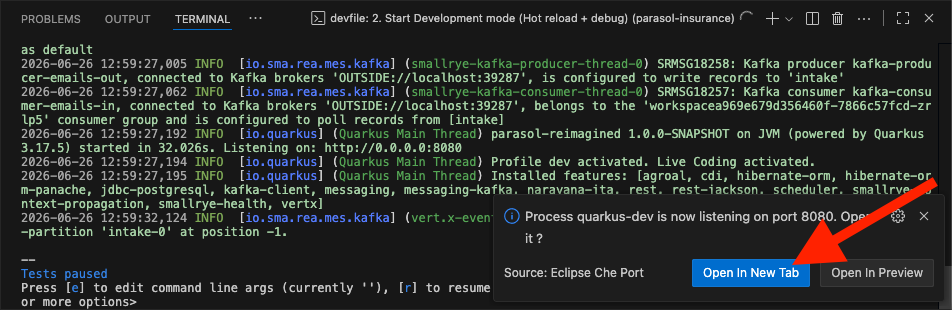
If you miss the popup, open the application from the ENDPOINTS panel in the lower left of the Dev Spaces window. Find quarkus-dev (8080/https) and click the arrow icon. -
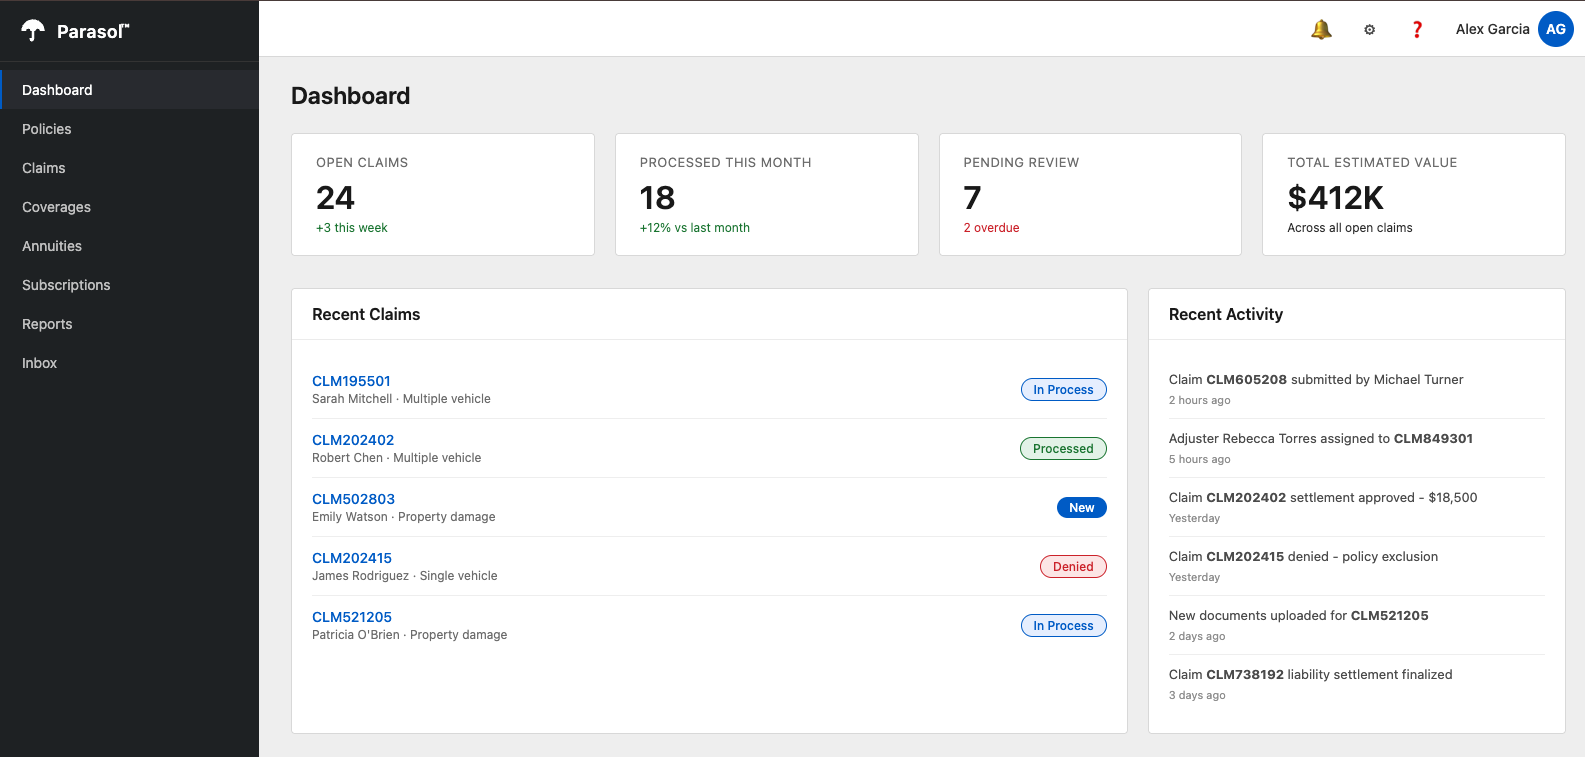
Browse the running Parasol Insurance application:
-
This is a claims and customer management platform used by Parasol’s agents
-
It handles insurance claims processing and customer communication
-
Behind the scenes, it uses Apache Kafka for message routing
-
Exercise 3: Add the claims statistics endpoint
Now implement the feature. You will create a new REST endpoint that returns claims statistics (totals, breakdowns by category and status).
-
Back in Dev Spaces, click the Explorer icon in the left sidebar. In the file tree, expand
src→main→java→com→parasol. -
Right-click on the
parasoldirectory and select New File. Name itClaimsStatsResource.java.The full path must be
src/main/java/com/parasol/ClaimsStatsResource.java.Make sure you create the file inside the parasolfolder — not incom, not injava, and not at the project root. Creating it in the wrong location will cause build and route failures later in the pipeline.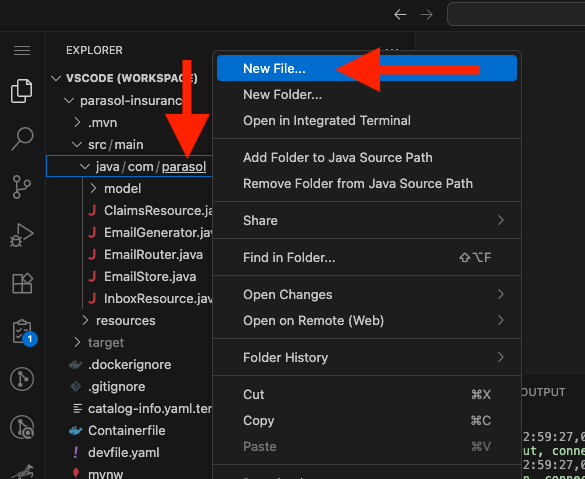
-
Copy and paste the following code into the new file:
package com.parasol;

import java.util.HashMap;
import java.util.Map;

import jakarta.inject.Inject;
import jakarta.ws.rs.GET;
import jakarta.ws.rs.Path;
import jakarta.ws.rs.Produces;
import jakarta.ws.rs.core.MediaType;

@Path("/api/claims/stats")
@Produces(MediaType.APPLICATION_JSON)
public class ClaimsStatsResource {

    @Inject
    ClaimsResource claimsResource;

    @GET
    public Map<String, Object> getStats() {
        Map<String, Object> stats = new HashMap<>();

        System.out.println("Fetching claim statistics");

        try {
            var claims = claimsResource.getAllClaims();
            stats.put("total", claims.size());

            Map<String, Long> byCategory = new HashMap<>();
            for (var claim : claims) {
                byCategory.merge(claim.getCategory(), 1L, Long::sum);
            }
            stats.put("by_category", byCategory);

            Map<String, Long> byStatus = new HashMap<>();
            for (var claim : claims) {
                byStatus.merge(claim.getStatus(), 1L, Long::sum);
            }
            stats.put("by_status", byStatus);
        } catch (Exception e) {
        }

        return stats;
    }
}
This code works, but it has some shortcuts. You used System.out.printlninstead of a proper logging framework, and thecatchblock silently swallows exceptions. These code smells are intentional — the CI/CD pipeline will catch them in Section 4. -
Save the file with Ctrl+S (or Cmd+S on Mac). Quarkus dev mode detects the change and reloads the application — no manual build step required.
If the application does not reload automatically, check the terminal in Dev Spaces for compilation errors. You can also restart dev mode by pressing Ctrl+Shift+P, selecting Tasks: Run Task → devfile → Start Development Mode (Hot Reload + debug). If you see a port conflict, stop the existing task first. -
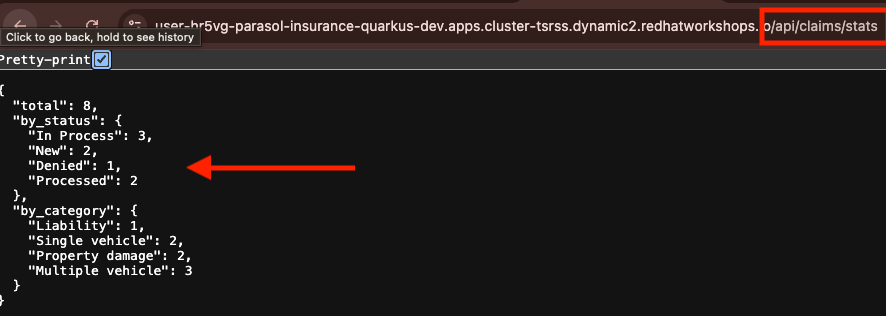
In your browser, switch to the tab for the Parasol running application, remove the
dashboard.htmlfrom the URL and add/api/claims/statsto the end of the URL in the browser’s address bar.You should see JSON data with claim totals and breakdowns:
{
  "total": 15,
  "by_category": {
    "auto": 5,
    "home": 4,
    "life": 6
  },
  "by_status": {
    "open": 8,
    "closed": 7
  }
}
The new endpoint is working. You wrote the code, saved the file, and the application reloaded in seconds. No build commands, no repackaging, no redeployment.
Section 4: Ship it
If you need to log in again at any point, your credentials are: username {user}, password {password}.
|
Your feature works locally. Time to push it through the platform’s CI/CD pipeline. A simple git push triggers an automated pipeline that builds, tests, and scans your code. No tickets, no manual triggers, no handoffs.
Exercise 1: Push your code
-
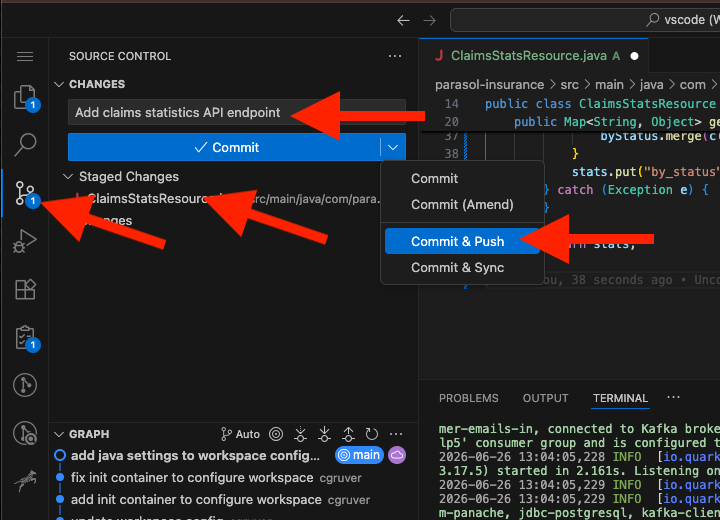
In Dev Spaces, click the Source Control icon in the left sidebar (the branch icon).
-
The new
ClaimsStatsResource.javafile appears under Changes. -
Click the + icon next to the file to stage it.
-
Enter a commit message in the text field:
Add claims statistics API endpointDo not skip the commit message. If you click Commit & Push with an empty message field, the editor will open a file called COMMIT_EDITMSGand wait for you to type a message and close the file tab (click the X on theCOMMIT_EDITMSGtab). A spinning progress indicator may make it look like something is happening — it is not. It is waiting for you to enter a message and close the file. If this happens, type your message on the first line, close the tab, and the commit will proceed. -
Click the dropdown arrow next to the Commit button and select Commit & Push.
Exercise 2: Watch the pipeline in Developer Hub
-
Switch back to Developer Hub in your browser. You may need to log in again if your session has expired:
Username:
{user}Password:
{password} -
Navigate to your component in the catalog.
-
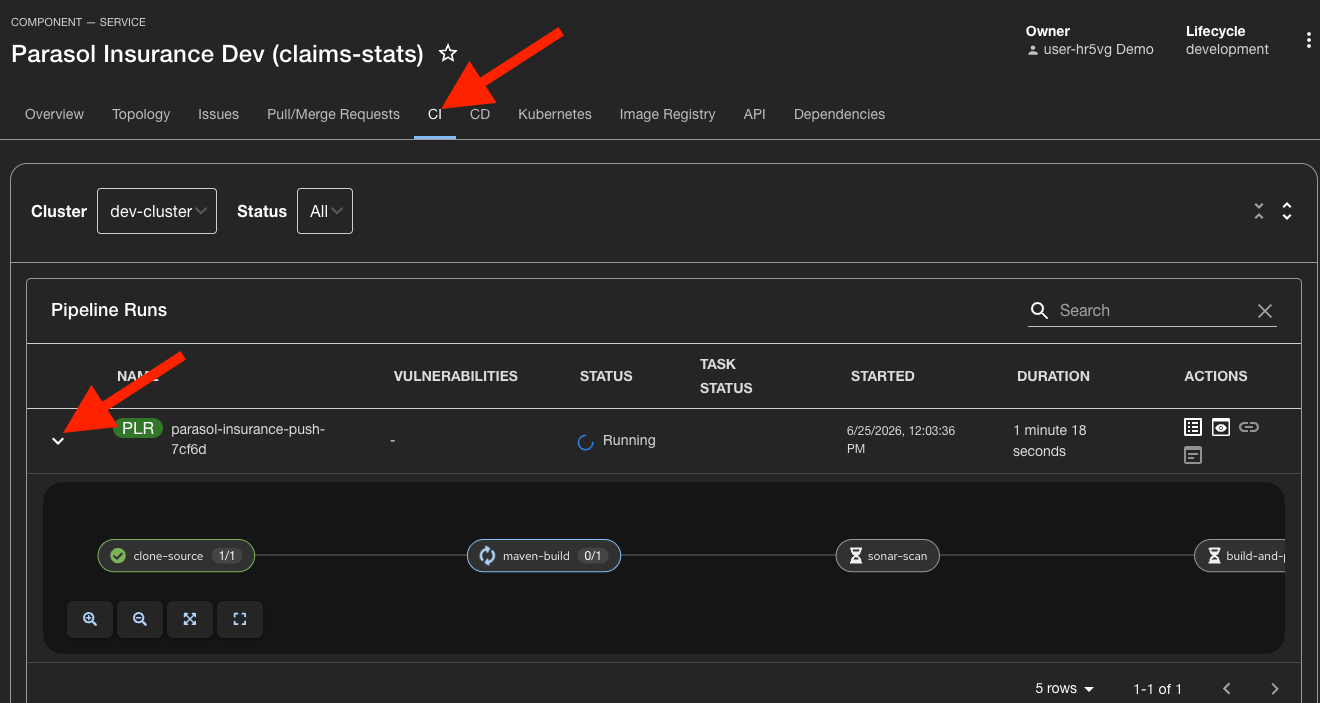
Click the CI tab to see the pipeline run that was triggered by your push. (you can ignore any failed GitLab pipelines shown - we are using OpenShift pipelines in this exercise)
-
Click to expand the pipeline run to see the that the pipeline runs several stages:
-
Clone — source code pulled from the Git repository
-
SonarQube SAST — static analysis and code quality scanning
-
Build and Push — application compiled, container image built and pushed to the registry
-
Re-rollout app — updated application deployed to the dev environment
-
-
Watch the pipeline progress. The sonar-scan stage will fail.
Exercise 3: Diagnose the pipeline failure
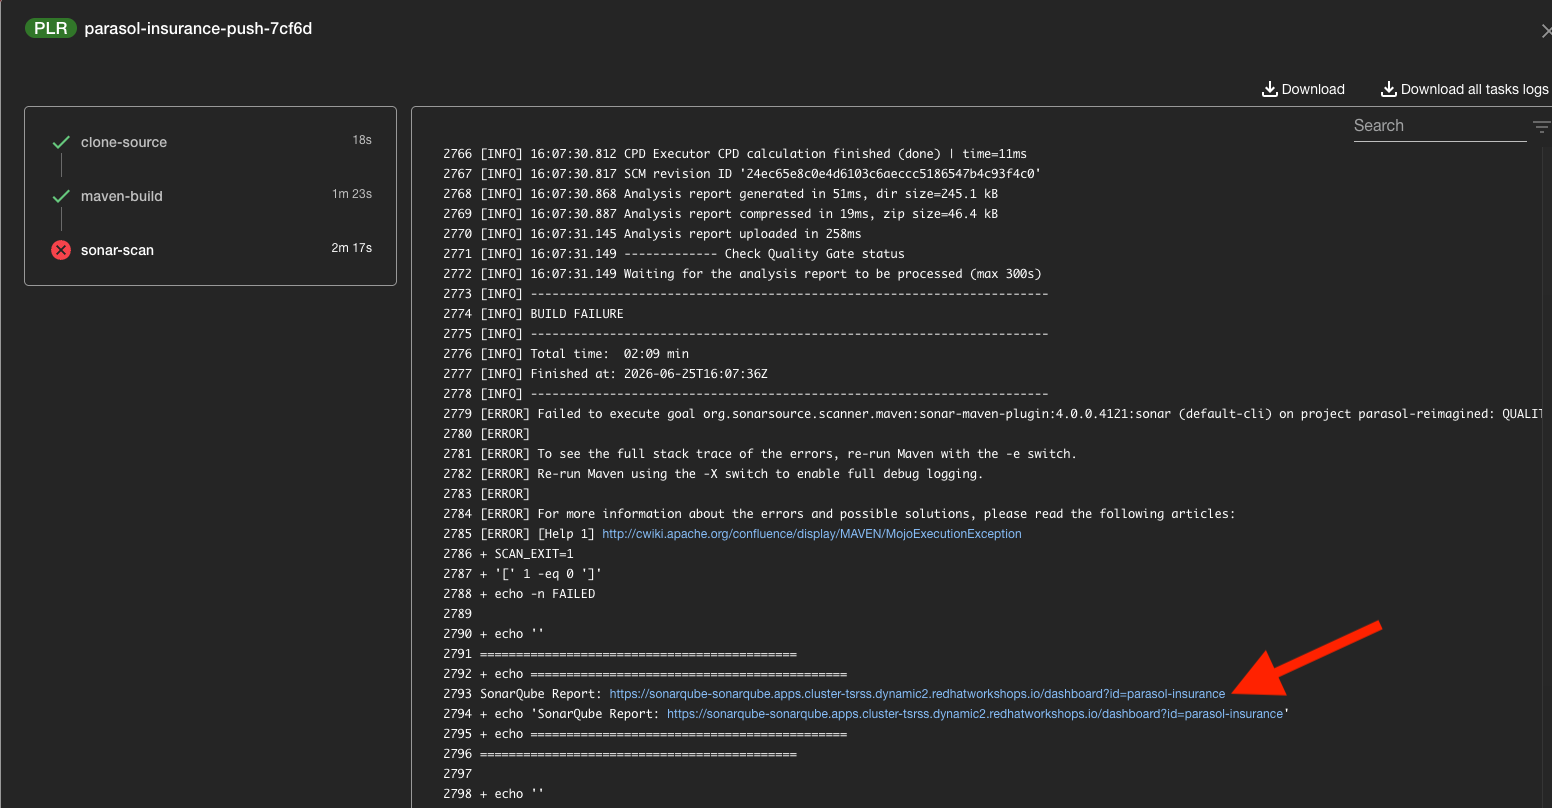
The pipeline caught something. The SonarQube quality gate failed because of the code shortcuts you took earlier.
-
Click on the failed
sonar-scanstep to see the details. -
Find the SonarQube report URL in the pipeline log output.
-
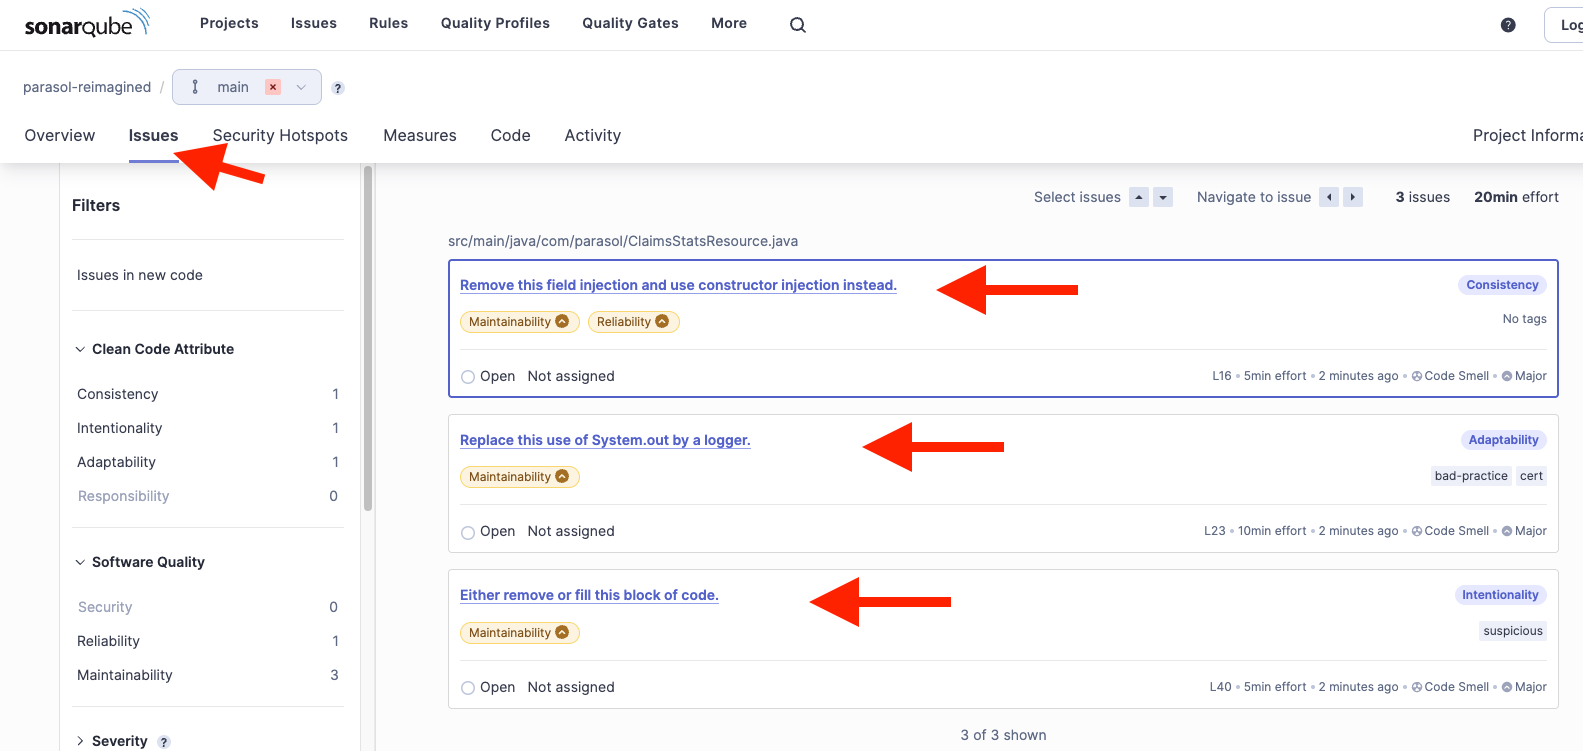
Open the SonarQube report to see the specific issues:
-
System.out.printlnusage — standard output should not be used for logging in production code -
Empty catch block — exceptions should not be silently swallowed
-
Field injection — SonarQube recommends constructor injection over
@Injectfield injection for better testabilityThese are not suggestions. They are hard quality gates. Code with these violations does not move forward.
-
Section 5: Call in the AI
You could spend time researching the Quarkus logging API, reading SonarQube remediation guides, and manually refactoring your code. Or you could ask your AI coding assistant to do it for you.
The platform engineering team has preconfigured a security team-approved agentic AI coding assistant (powered by Zoo Code) in every Dev Spaces workspace. This is not just a chatbot that suggests snippets. It is an AI agent that can read your entire project, understand the frameworks you are using, navigate across files to find patterns, and apply changes directly in your editor. You describe the problem in plain language, and it figures out the fix.
Exercise 1: Fix the code with AI assistance
Let’s use the AI assistant to resolve the SonarQube violations.
| We’re using the Zoo Code open-source AI coding assistant. We’ve configured it to work with a large language model (LLM) we’re hosting to facilitate this workshop. |
-
Switch back to Dev Spaces.
-
Click the AI assistant icon in the left sidebar.
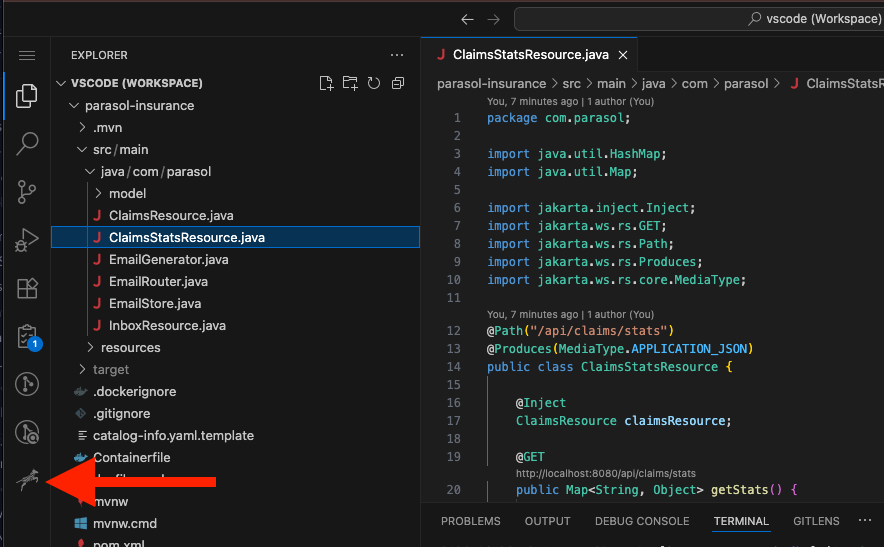
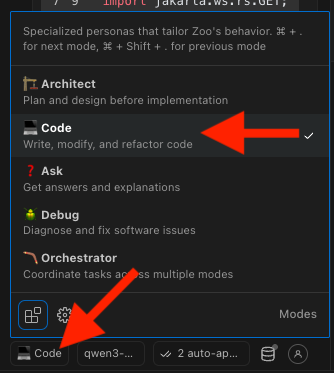
Notice the controls at the bottom of the chat panel. You can switch between personas — Architect for design guidance, Code for implementation, Ask for general questions, and Debug for troubleshooting. You can also select from the AI models that the platform and security teams have approved for use — no shadow AI here — and configure what types of actions the assistant can auto-approve (such as file edits or terminal commands). For this exercise, file edits require your approval — you will need to click Save after each edit the assistant proposes to keep the human in the loop. Once developers build confidence in the assistant, this can be switched to auto-approve for a faster workflow.
-
At the bottom of the chat panel, click the persona selector and choose Code — since we are editing implementation code, not architecting major changes.
-
In the chat panel, enter this prompt:
The existing ClaimsStatsResource class has
code smells according to SonarQube - please fix them. The
System.out.println, field injection, and empty catch block. Don't
throw any new exceptions, just log it using standard Quarkus logging.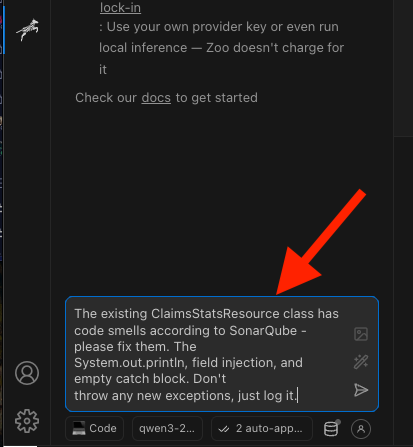
-
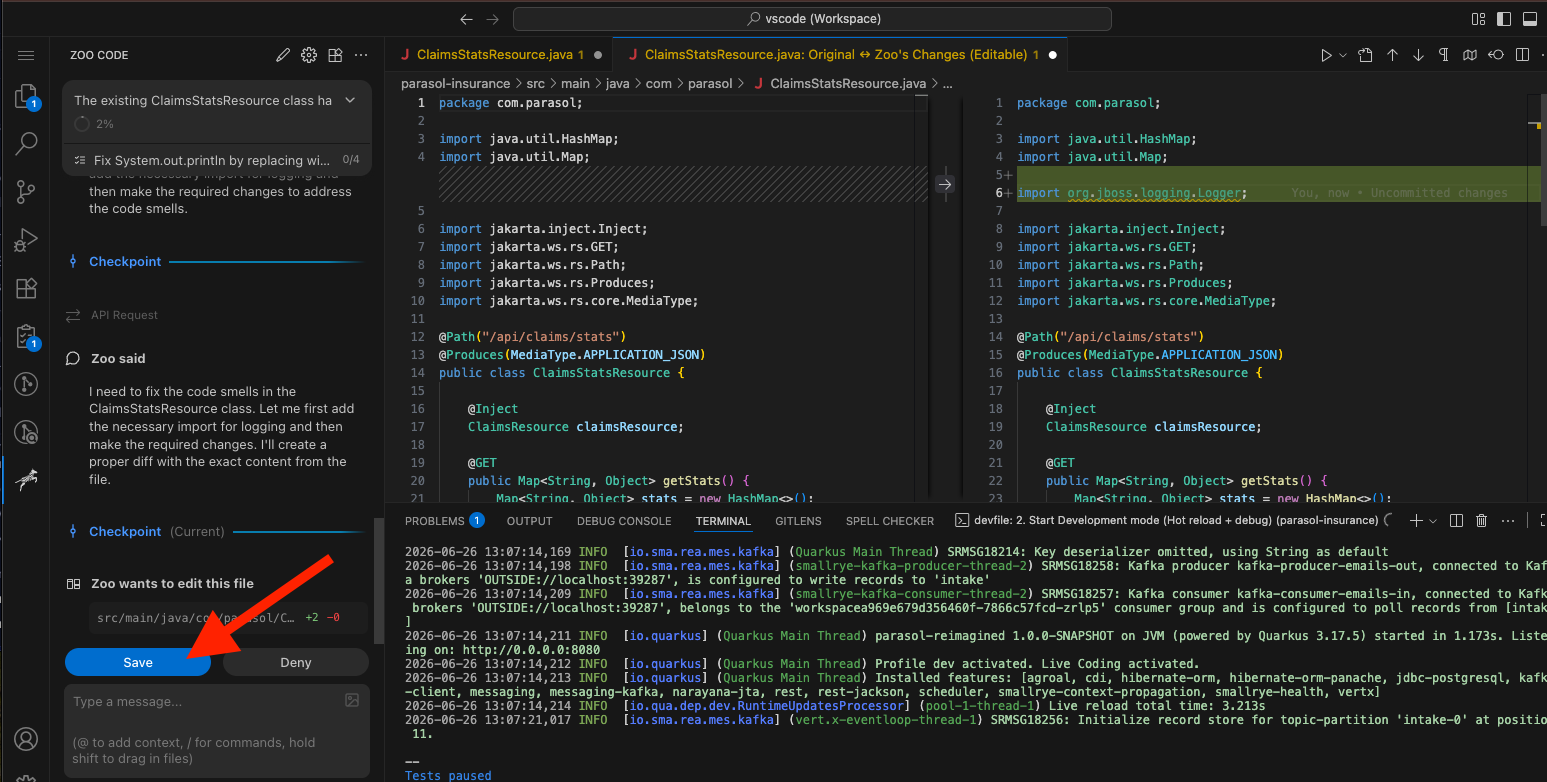
Watch the assistant work. It reads your file, understands that this is a Quarkus project, and applies the fixes directly:
-
System.out.printlnreplaced withLog.infofrom the Quarkus logging API -
Empty
try-catchremoved — exceptions propagate naturally -
Field injection replaced with constructor injection
-
-
As changes are made by the assistant, you will need to approve them. Click Save to approve each file edit. Remember, the assistant requires your explicit approval before modifying any file.
-
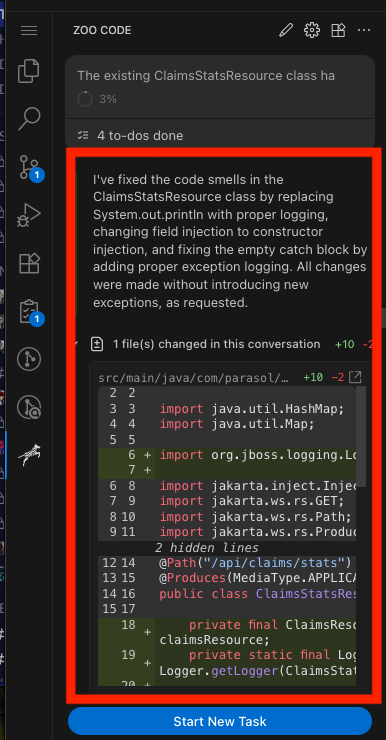
Once complete, the changes should be in the file. You can also look at diffs via the assistant:
If the AI assistant is unresponsive or does not apply the fixes correctly, you can manually replace the contents of ClaimsStatsResource.java with the corrected version below.
|
-
Since LLMs are not deterministic, verify the corrected code looks similar to this:
package com.parasol; import java.util.HashMap; import java.util.Map; import io.quarkus.logging.Log; import jakarta.ws.rs.GET; import jakarta.ws.rs.Path; import jakarta.ws.rs.Produces; import jakarta.ws.rs.core.MediaType; @Path("/api/claims/stats") @Produces(MediaType.APPLICATION_JSON) public class ClaimsStatsResource { private final ClaimsResource claimsResource; public ClaimsStatsResource(ClaimsResource claimsResource) { this.claimsResource = claimsResource; } @GET public Map<String, Object> getStats() { Map<String, Object> stats = new HashMap<>(); Log.info("Fetching claim statistics"); try { var claims = claimsResource.getAllClaims(); stats.put("total", claims.size()); Map<String, Long> byCategory = new HashMap<>(); for (var claim : claims) { byCategory.merge(claim.getCategory(), 1L, Long::sum); } stats.put("by_category", byCategory); Map<String, Long> byStatus = new HashMap<>(); for (var claim : claims) { byStatus.merge(claim.getStatus(), 1L, Long::sum); } stats.put("by_status", byStatus); } catch (Exception e) { Log.error("Error fetching claim statistics", e); } return stats; } } -
Before committing — you don’t push untested code, right? — switch to the browser tab where the Parasol application is still running and press Ctrl+R (or Cmd+R on Mac) to reload. Quarkus dev mode has already picked up the changes, so you should see the same JSON response at
/api/claims/statsas before. If you closed that tab, click the Explorer icon in the left sidebar, then find the ENDPOINTS panel at the bottom and click quarkus-dev (8080/https) to reopen it. If the endpoint returns an error, check the Dev Spaces terminal and adjust the code before continuing. -
Commit and push the fix using the Source Control view:
-
Stage the modified
ClaimsStatsResource.java -
Commit message:
Fix code smells: use proper logging and remove empty catch block -
Click the dropdown arrow next to Commit and select Commit & Push
-
Section 6: Go live
If you need to log in again at any point, your credentials are: username {user}, password {password}.
|
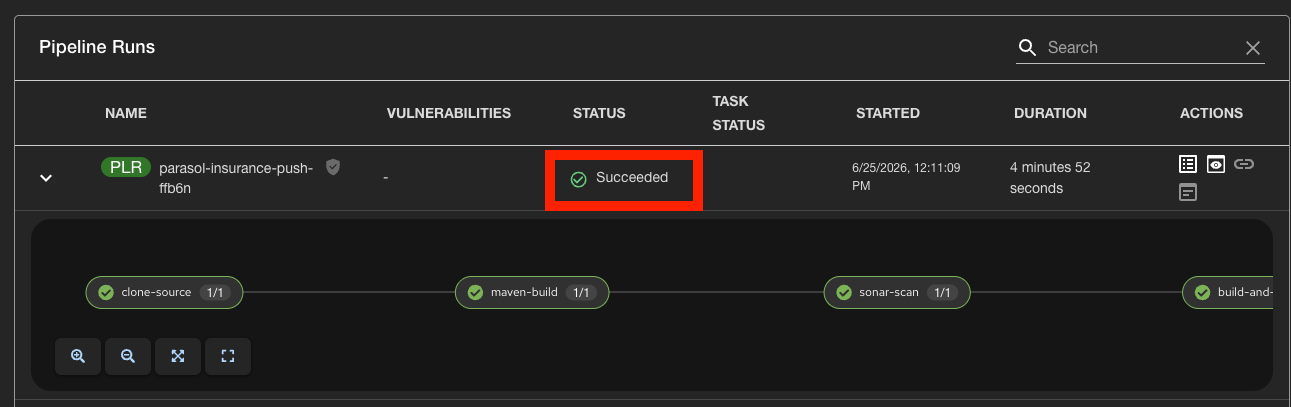
The pipeline passed. Your code has been built, tested, scanned, and packaged. Now it is time to merge your changes and see them deployed to production through GitOps.
Exercise 1: Merge your feature branch
-
In Developer Hub, navigate to your component and click View Source to open the repository in GitLab.
-
You should see a prompt at the top to Create merge request from your feature branch. Click it.
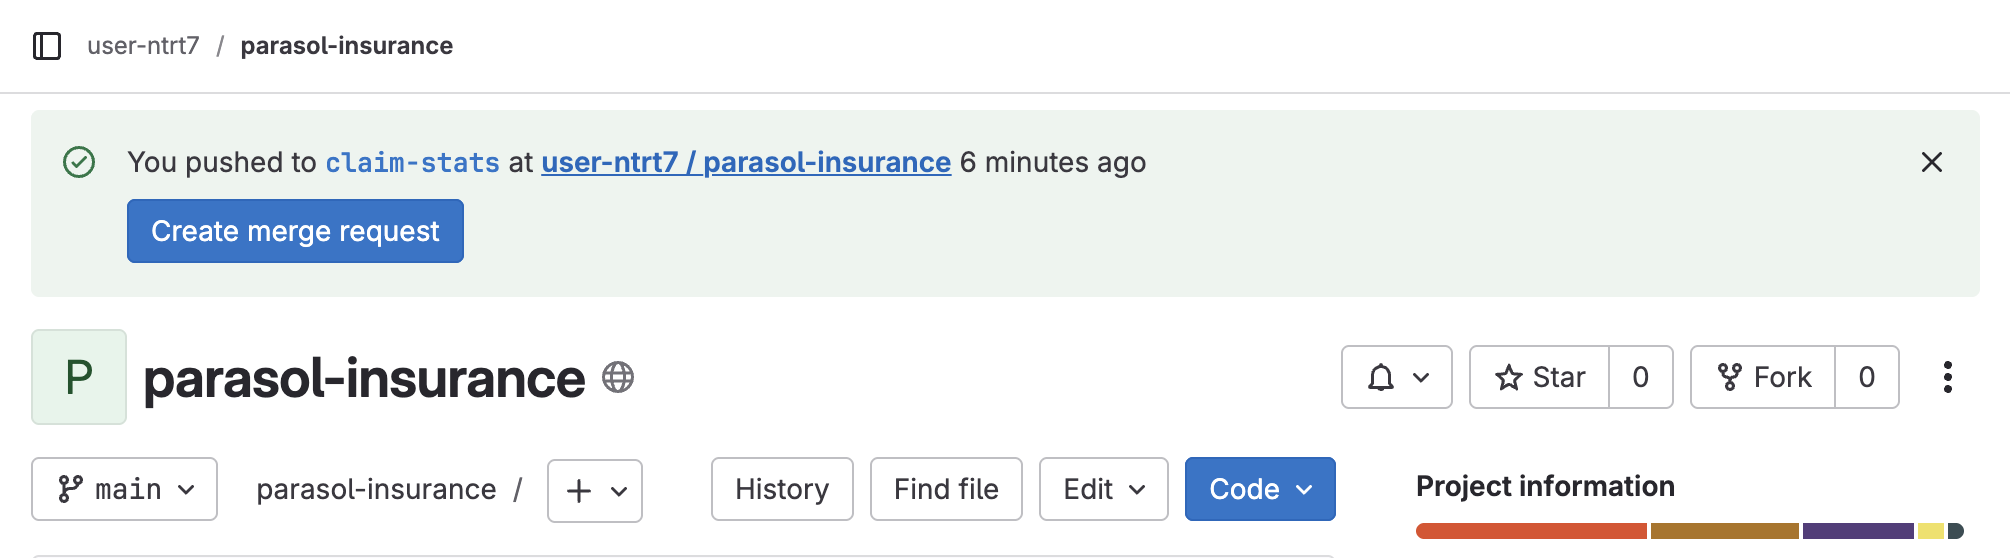
If no prompt appears, click Merge Requests in the left sidebar, then New Merge Request, and select your branch. -
Review the merge request:
-
Each commit on the Commits tab near the bottom shows your two commits above the initial one created by this environment
-
The Changes tab shows your new
ClaimsStatsResource.javafile with the corrected code
-
-
Click Create merge request at the bottom to create the new request. The new request is created and opened for you and others to review.
-
At this point, the code would normally be reviewed and approved by others, but for now, to merge your changes into the main branch, just click Merge.
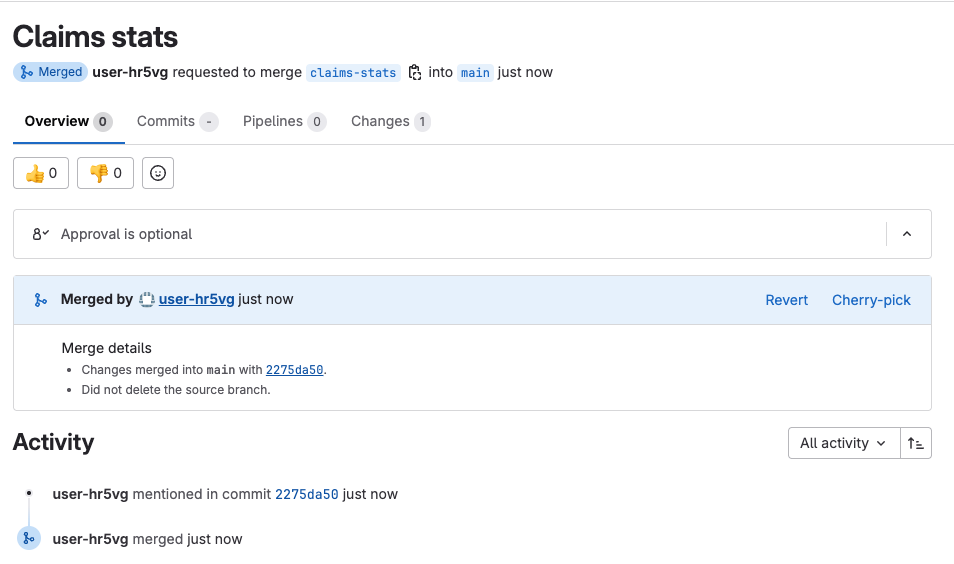
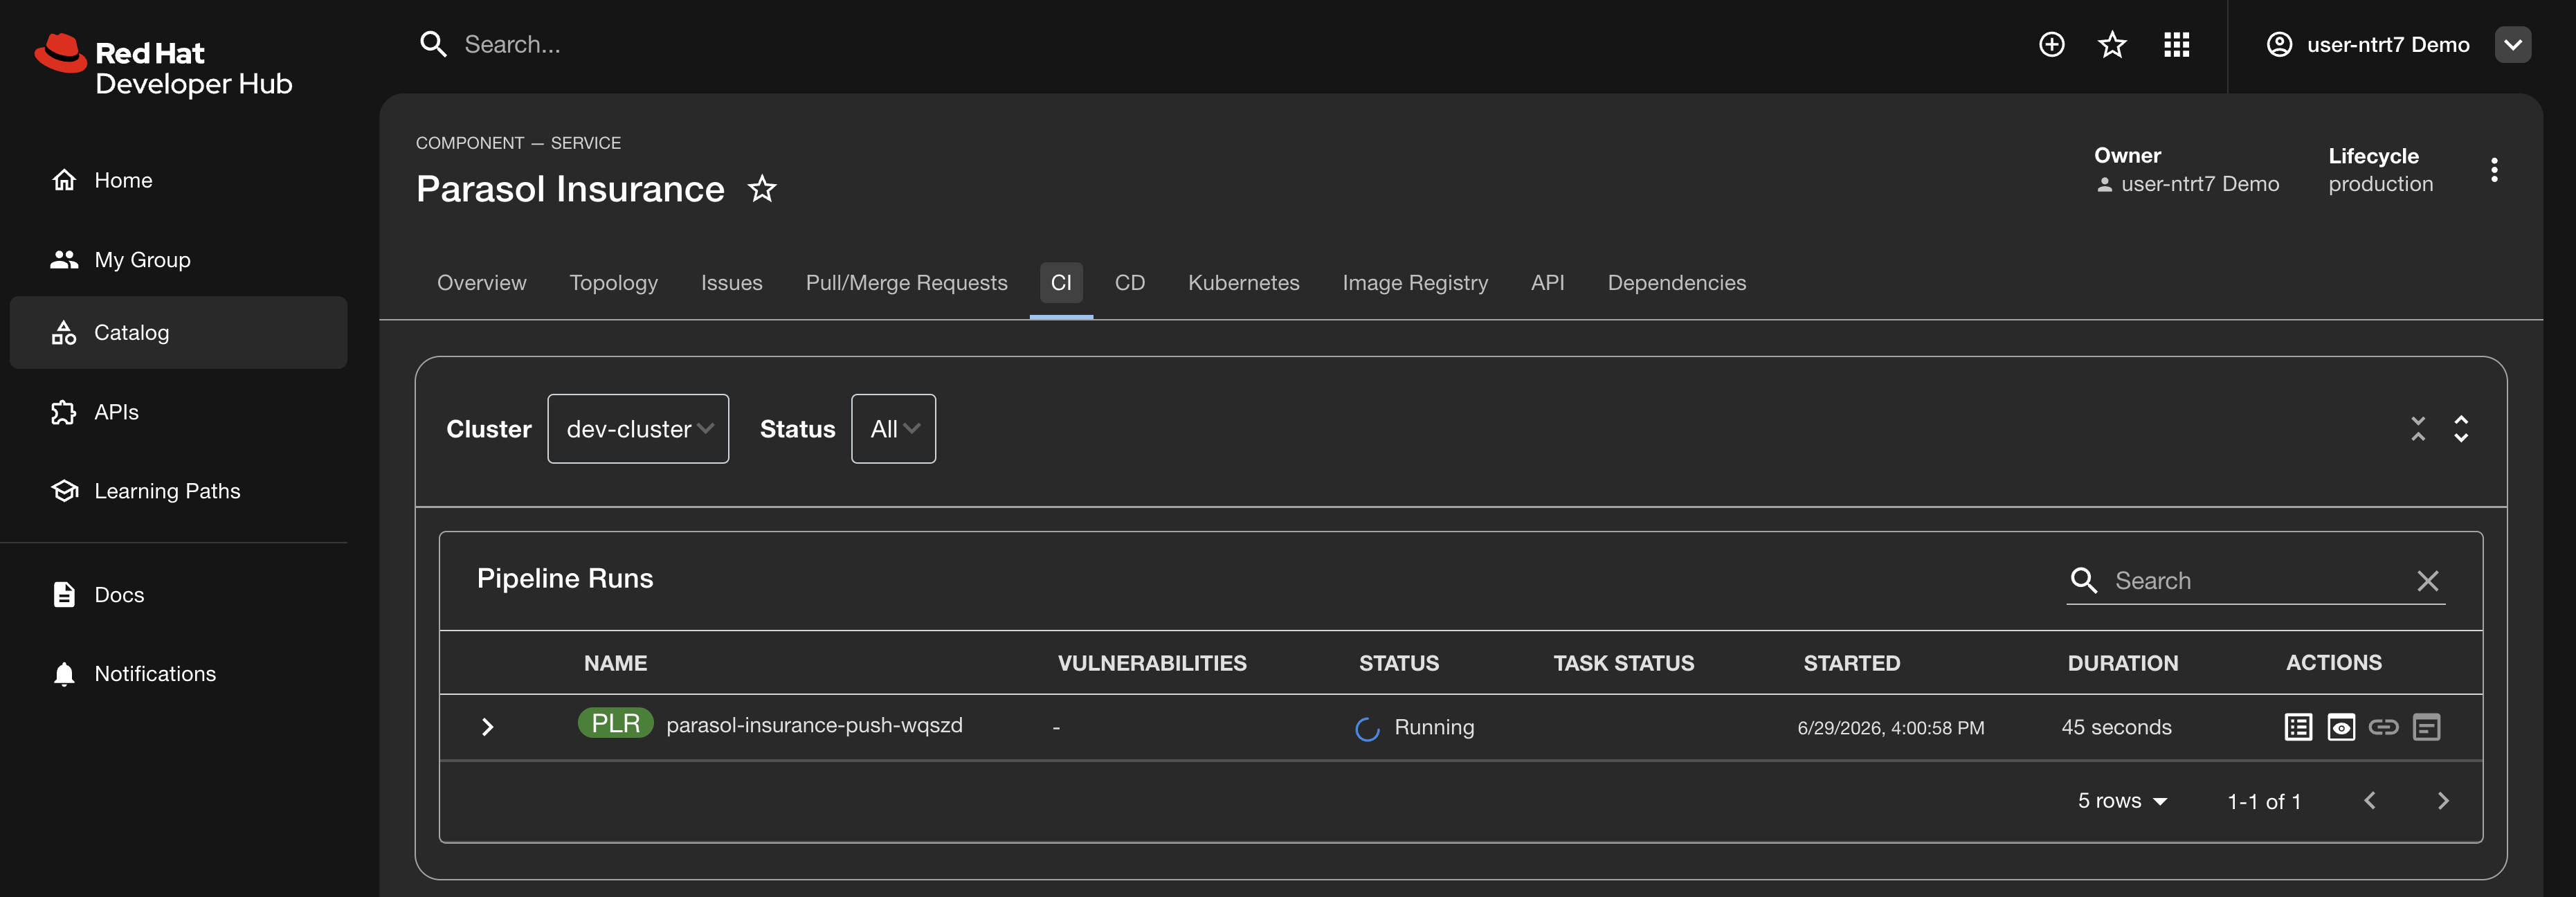
Your changes are now merged into the main branch. The dev environment pipeline, as seen in the primary Parasol Insurance Component in Developer Hub, will pick this up and redeploy automatically. But to promote to production, you need to create a release.
Exercise 2: Create a release tag
In a real organization, promoting code to production is typically handled by platform engineers or release managers. For this workshop, you will perform this step yourself to see the full end-to-end flow.
-
In GitLab, navigate back to your parasol-insurance repository (use the project name in the breadcrumb at the top, it should be
{user} / parasol-insurance. You can click the GitLab icon at the upper left to see all your repos). -
In the left sidebar, click Code, then Tags.
-
Click New tag.
-
Fill in the tag details:
-
Tag name:
1.1 -
Create from:
main -
Message:
Add claims statistics API endpoint
-
-
Click Create tag.
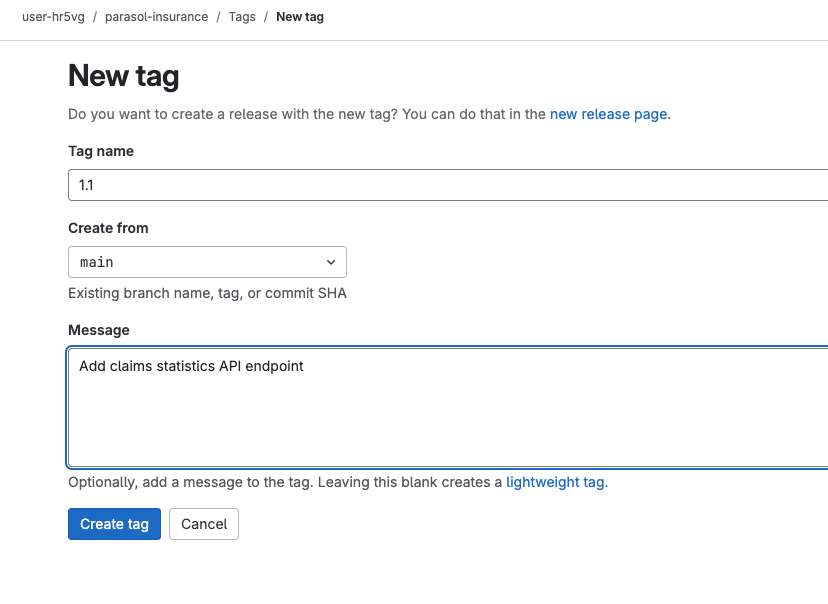
Creating this tag triggers a pipeline behind the scenes. When the pipeline completes (it will take a few minutes), it generates a merge request against your {user}/parasol-insurance-manifests repository — this is the GitOps manifests repo that drives production deployments through Argo CD.
Exercise 3: Approve the GitOps promotion
This step uses a different repository than the one you have been working in. You need to navigate to your manifests repository (parasol-insurance-manifests), not the source code repository (parasol-insurance). The manifests repo contains the Argo CD/GitOps configuration that controls what gets deployed to production.
|
-
In GitLab, navigate to the
{user}/parasol-insurance-manifestsrepository.You can find it by clicking the GitLab logo in the top-left to go to the home page, then selecting parasol-insurance-manifests from the project list (not
parasol-insurance). -
Click Merge Requests in the left sidebar.
-
Find the merge request that bumps the Argo CD values to your new tag (
1.1). Click on it.If the merge request has not appeared yet, wait a minute — the tag pipeline needs to complete first. Refresh the page to check again. -
Review the changes — you will see the image tag being updated to reference your new release.
-
Click Merge to approve the promotion to production.
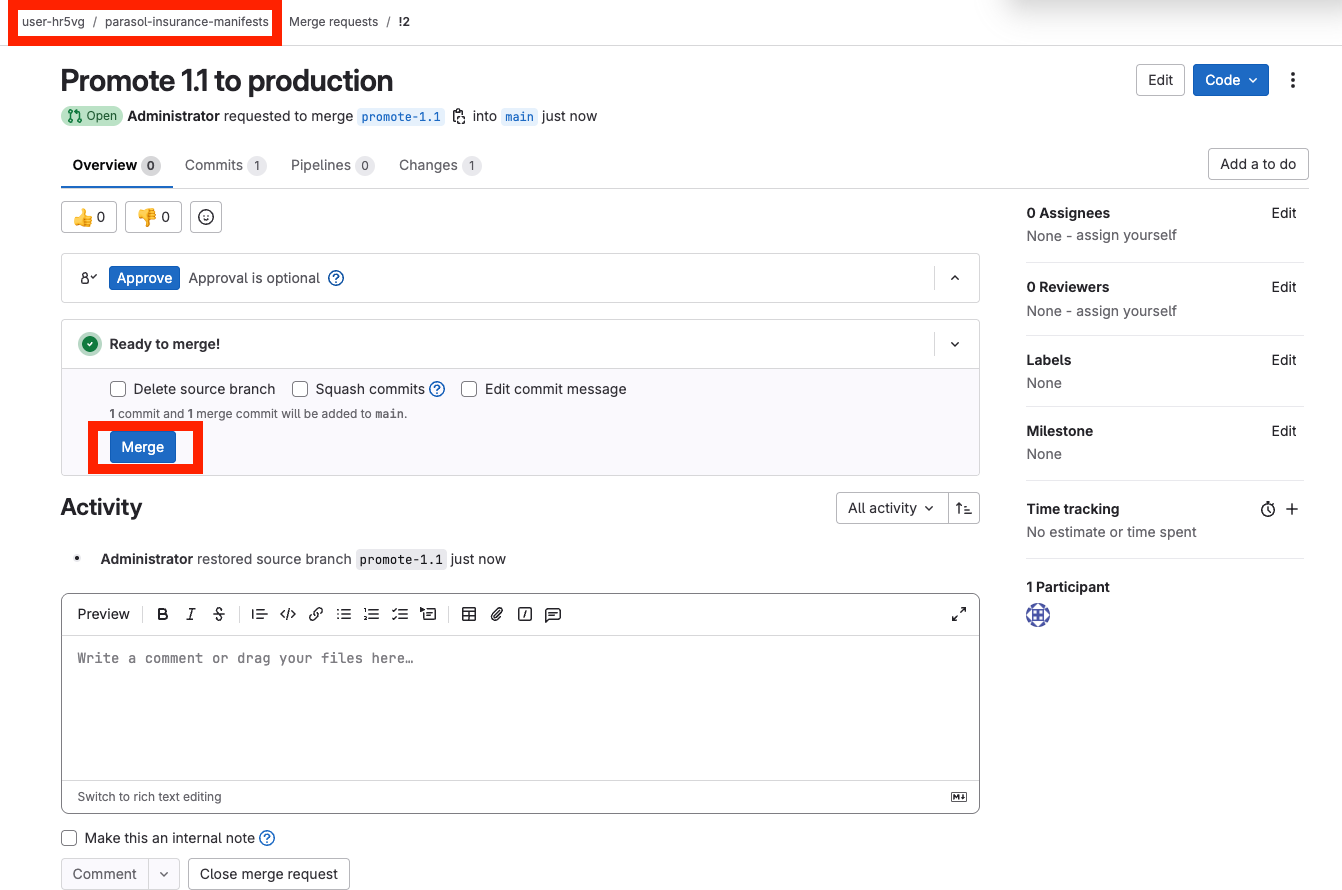
Argo CD watches this manifests repository. Once the merge completes, it detects the change and begins rolling out the new version to production.
Exercise 4: Verify the feature in production
-
Switch back to Developer Hub.
-
Navigate to the Catalog and find the main Parasol Insurance component owned by your user — not the
claims-statsbranch component. You can click the Owned filter to narrow the list. -
Click on the component, then select the Topology tab.
The topology view shows both the dev and prod environments for the application.
-
Watch the production environment. It may initially appear red while the new version rolls out. Once the deployment completes, it will turn blue indicating the application is healthy.
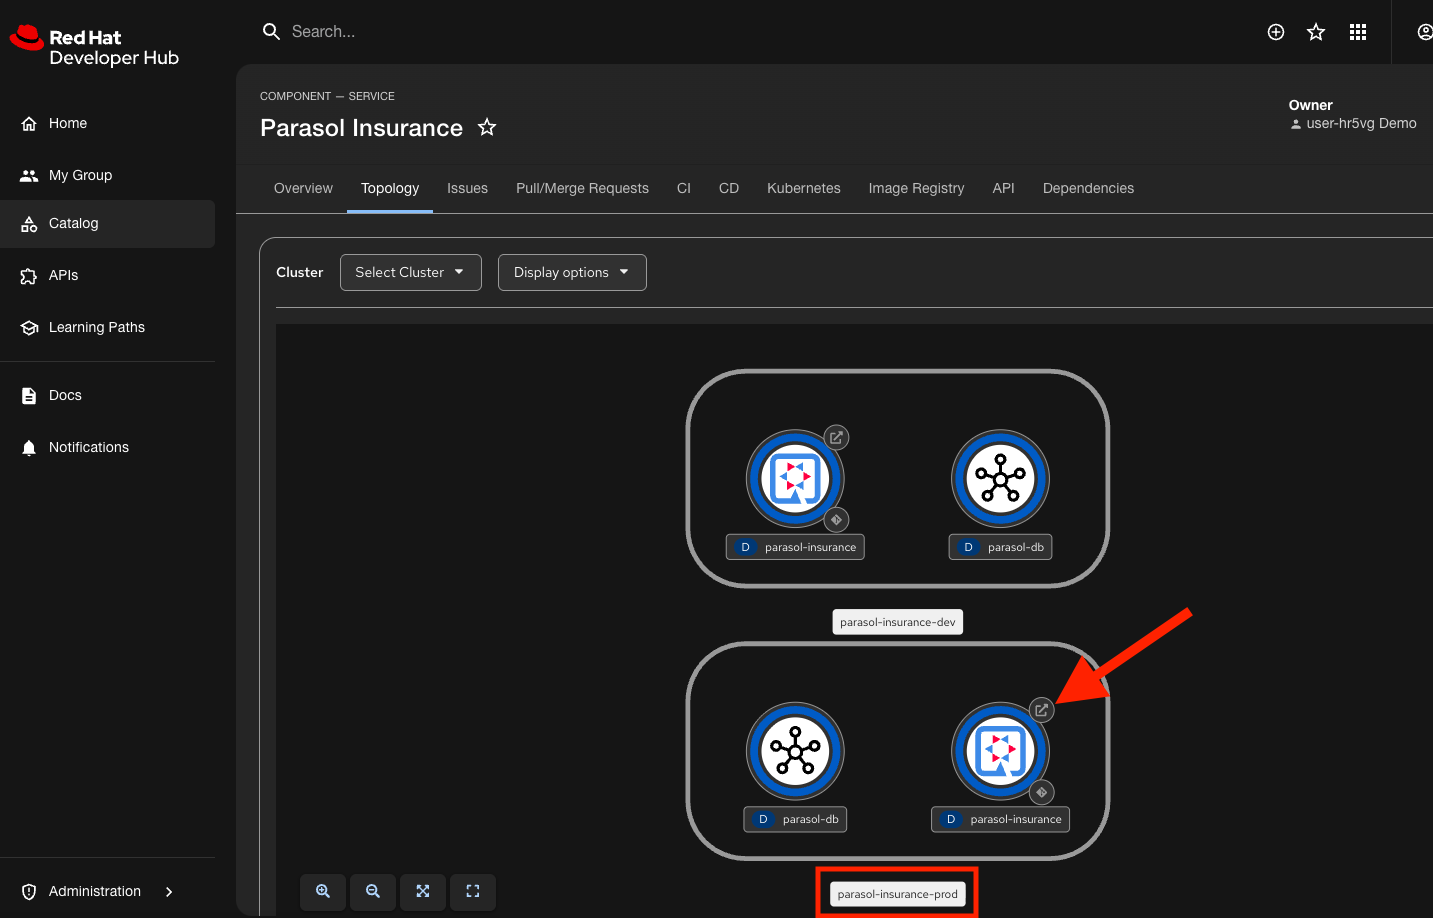
You can switch from the Topology tab to the CD tab to see when the prodArgo CD application has detected the new commit to use the 1.1 tag. The Pod in the Topology view will become healthy soon after. -
Click the small Open icon (the arrow at the upper right of the production application) to open it in a new tab.
-
Remove the
dashboard.htmland append/api/claims/statsto the URL and confirm the claims statistics endpoint is returning data in the production environment.
The feature you wrote, tested, fixed, and merged is now live in production — without a single deployment ticket.
Module summary
You just completed the full developer journey at Parasol Insurance — from onboarding to production deployment — without filing a single ticket, installing any tools, or waiting for anyone.
What you accomplished:
-
Discovered applications, APIs, and documentation through Developer Hub’s software catalog
-
Used Lightspeed to get AI-powered answers about the platform
-
Created an isolated development environment with a self-service template
-
Wrote and tested code in a preconfigured cloud IDE with Dev Spaces
-
Used an AI coding assistant to fix code quality issues
-
Pushed code through an automated CI/CD pipeline with quality gates
-
Created a release tag and approved a GitOps promotion to deploy to production
-
Verified the feature in production through Developer Hub’s topology view
Key takeaways:
-
Developer Hub is the single pane of glass — catalog, templates, CI/CD visibility, and AI assistance in one place
-
Dev Spaces eliminates local environment setup — every developer gets the same preconfigured workspace
-
Pipelines enforce quality automatically — code smells and security issues are caught before production
-
GitOps makes deployments repeatable and auditable — Git is the single source of truth
-
The platform handles the undifferentiated heavy lifting so developers can focus on writing code
This is what a cohesive application platform looks like. Everything you need, from code to production, available on-premises, in any cloud, or at the edge.