GUI System Mgmt (webconsole)
Skill Level: Fundamental
1. Overview
Web Console is a Red Hat Enterprise Linux 10 web-based graphical user interface designed for managing and monitoring your local system. The Web Console can also be extended to manage multiple servers located in your network.
Features of the Web Console include:
-
Managing user accounts
-
Managing and monitoring system services
-
Configuring network interfaces
-
Configuring firewall rules
-
Reviewing system logs
-
Managing virtual machines
-
Creating diagnostic reports
-
Setting kernel dump configuration
-
Configuring SELinux
-
Installing and Updating software
-
Managing System Subscriptions
-
more…
The following exercises will cover some of the capabilities of the Web Console on RHEL 10, as well as basic installation and set up.
2. Getting Started
The following instructions to install and configure the webconsole are only provided as informational. All of the exercises will actually be performed using a dedicated web browser.
3. Installation and Configuration
For your convenience, the webconsole has already been installed and configured on node3. The steps for installation and setup are pretty simple and outlined below. Remember that this is provided as reference only.
|
Native command(s) to install and enable the Web Console dnf install -y cockpit firewalld tuned systemctl enable --now cockpit.socket firewall-cmd --add-service=cockpit --permanent firewall-cmd --reload |
That completes the installation and configuration of the Web Console.
4. Webconsole Login
| Please note that by default, the webconsole is configured to use port 9090. Thus you would normally add :9090 to the end of the URL. However for the purposes of this lab and to provide the greatest degree of internet compatability the webconsole has been additionally enabled on port 443. |
Your instructors (or workshop portal) may provide you with a unique link and special instructions to access the web-console on node3. It is PREFERRED that you use your local web browser.
Accept the various notifications about insecure certificates, and then login.
Use the following URL:
And the following UserID and Password:
ASK-INSTRUCTORASK-INSTRUCTOR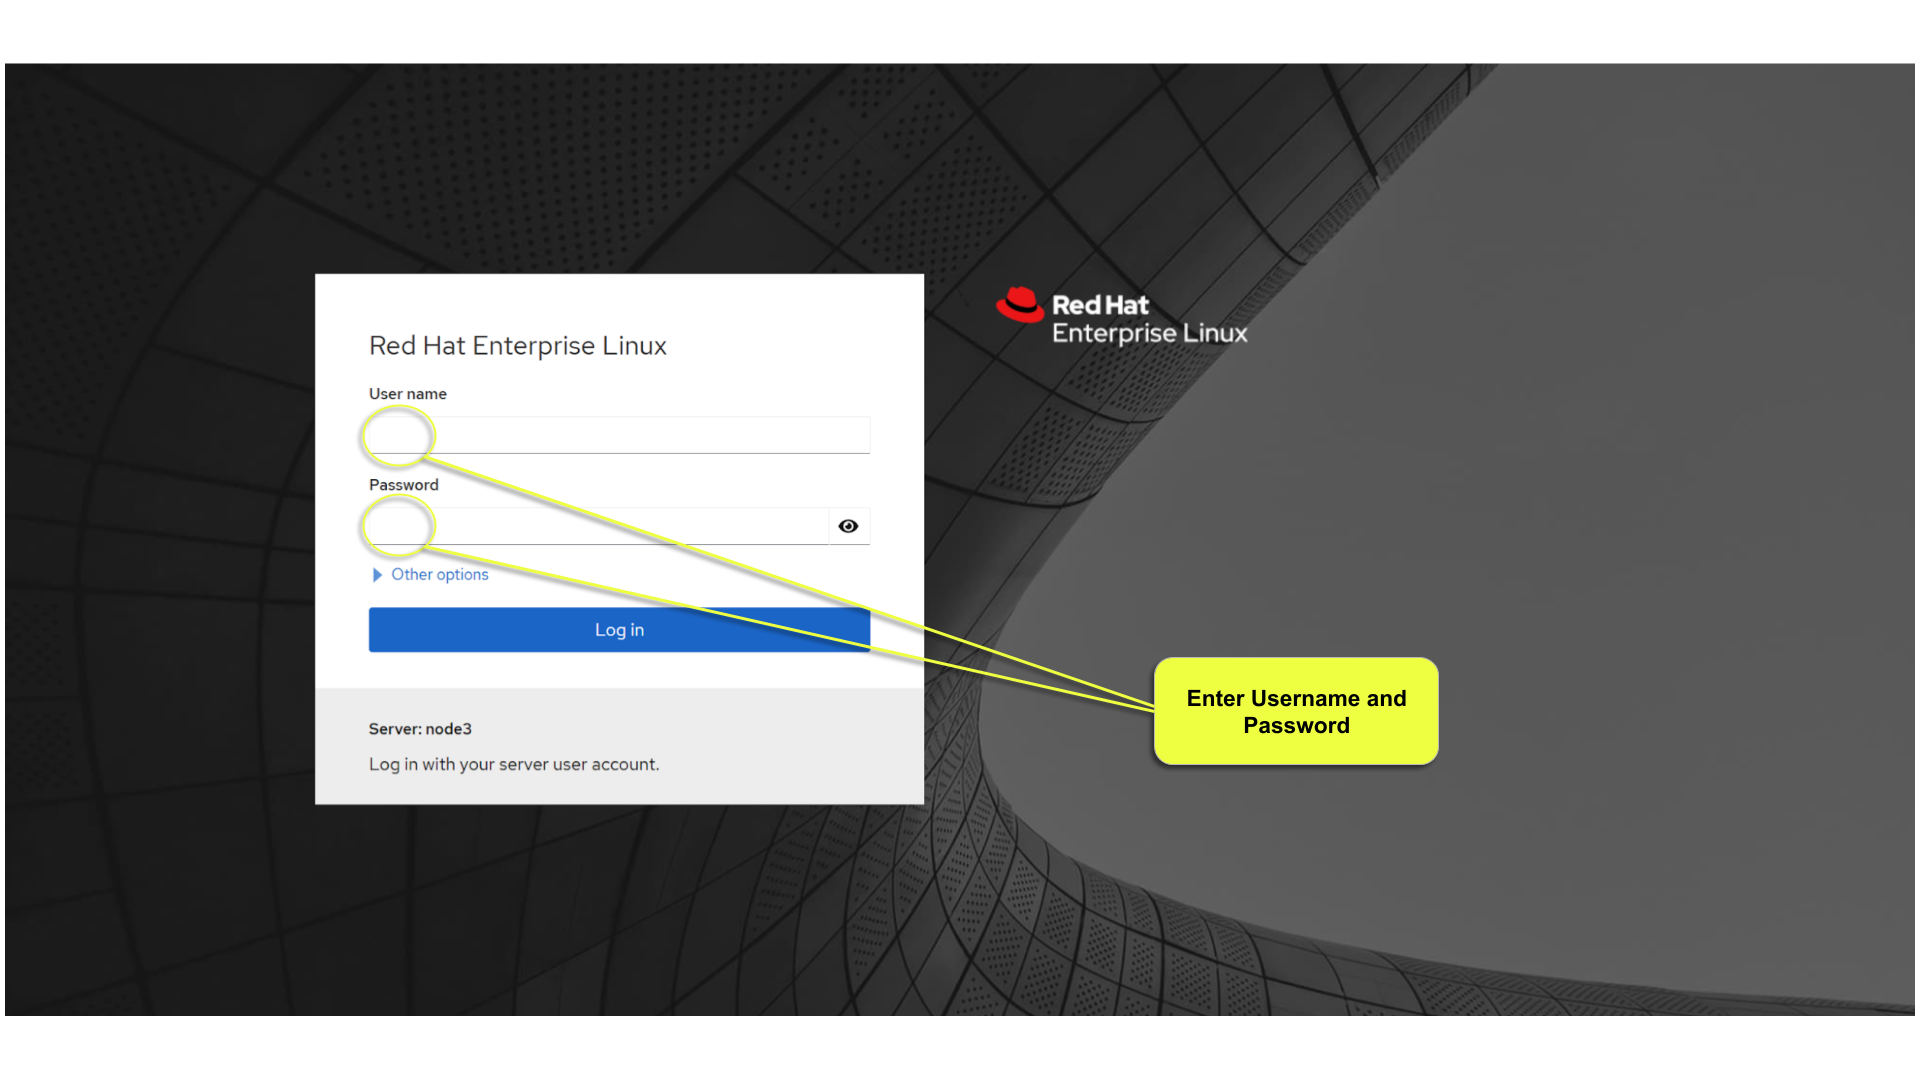
5. Webconsole Overview
After you successfully sign-on, you will land on the overview page which presents various artifacts about your system including:
-
CPU utilization
-
Memory utilization
-
Disk I/O
-
Network traffic
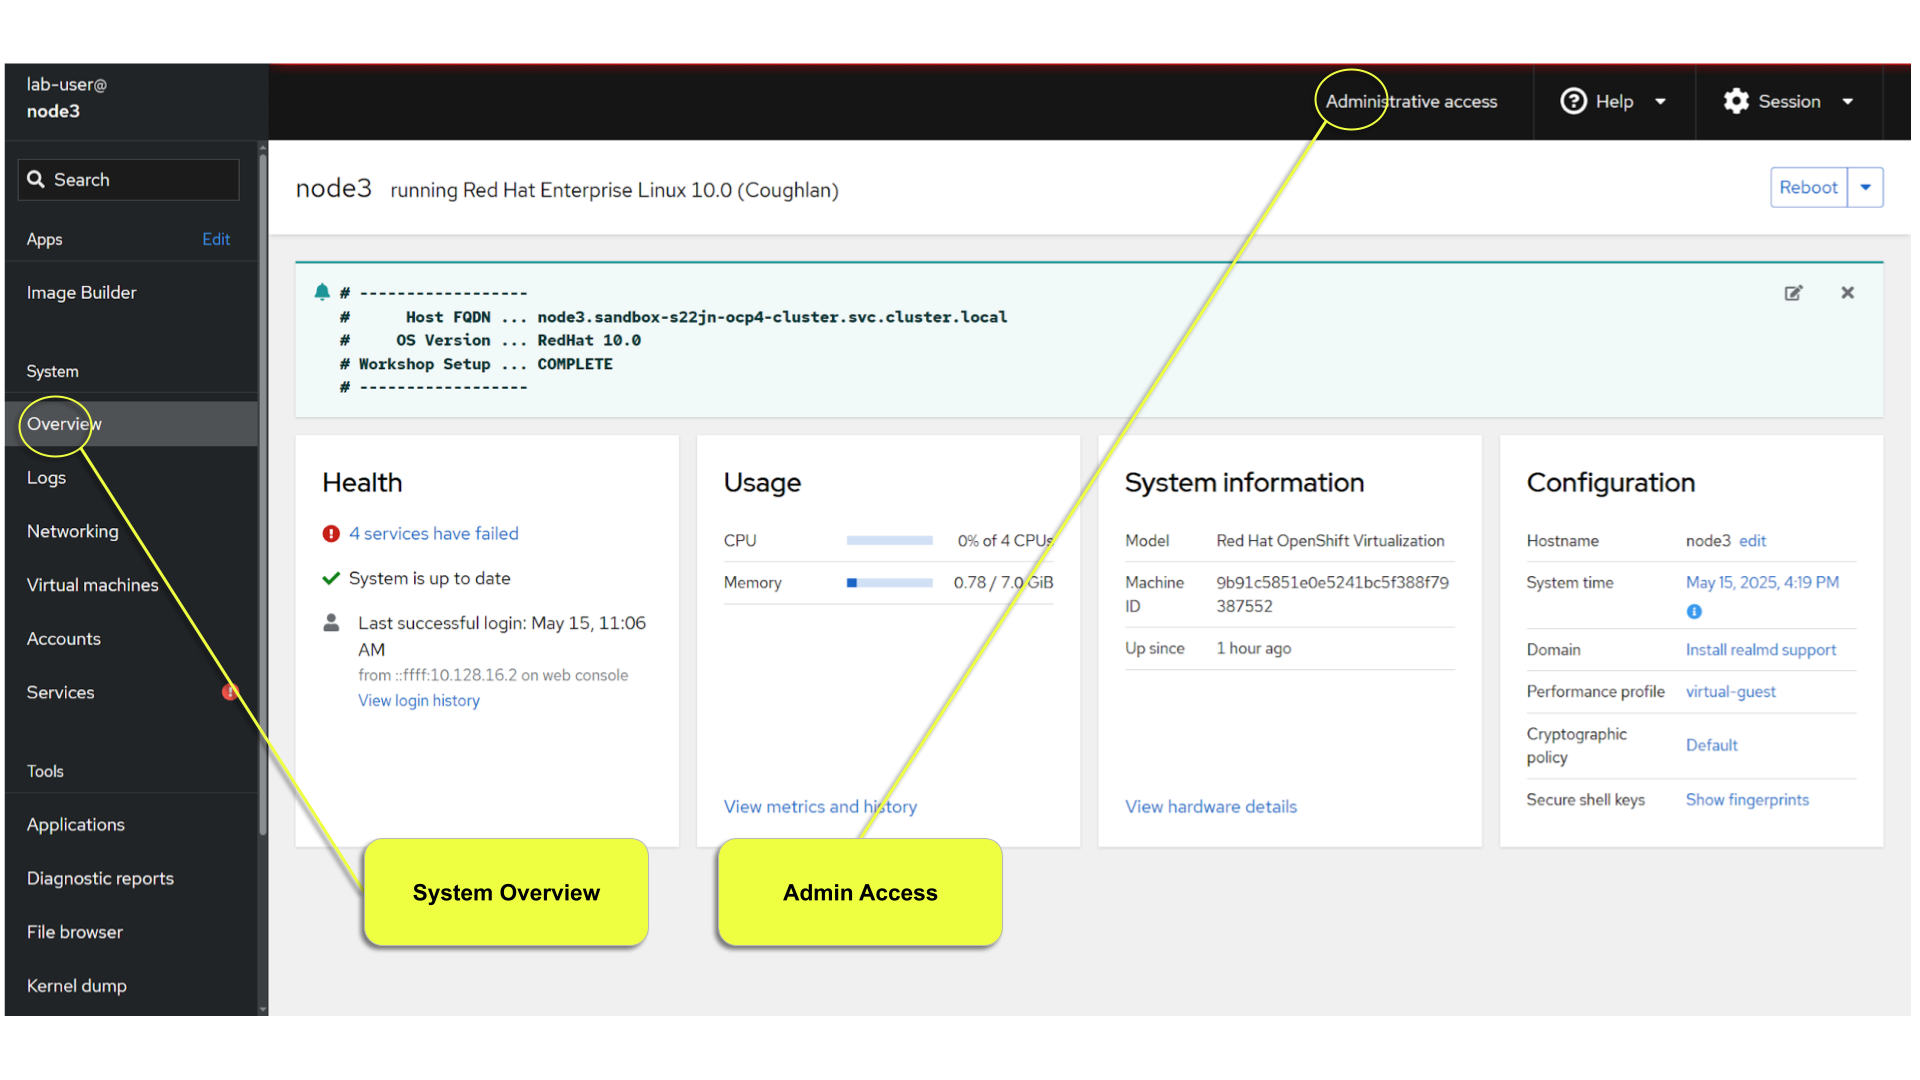
Also make note that your userid needs "Administrative Access", and since the userid is configured on the host as part of the "wheel" security group you are presented with the option to turn administrative access on.
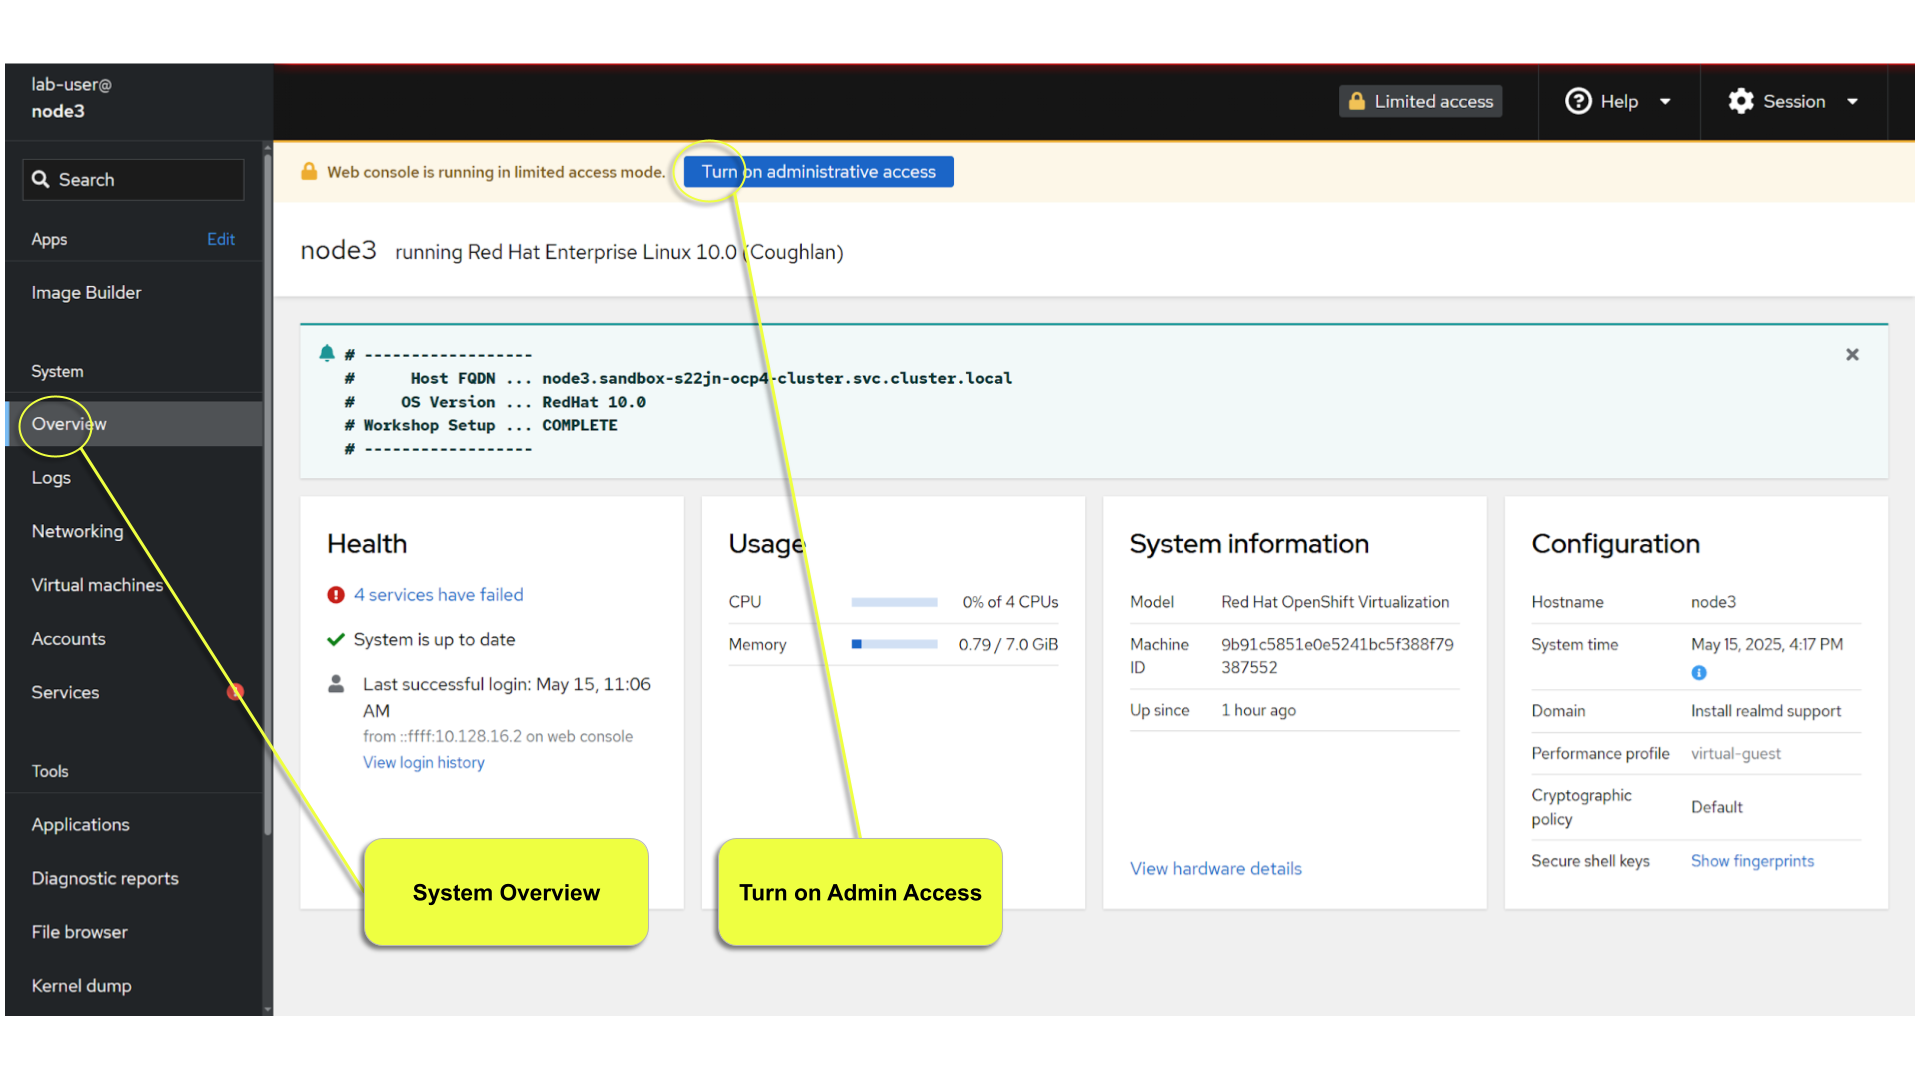
Please proceed to enable administrative access and then verify.
6. Enable Persistent Metrics
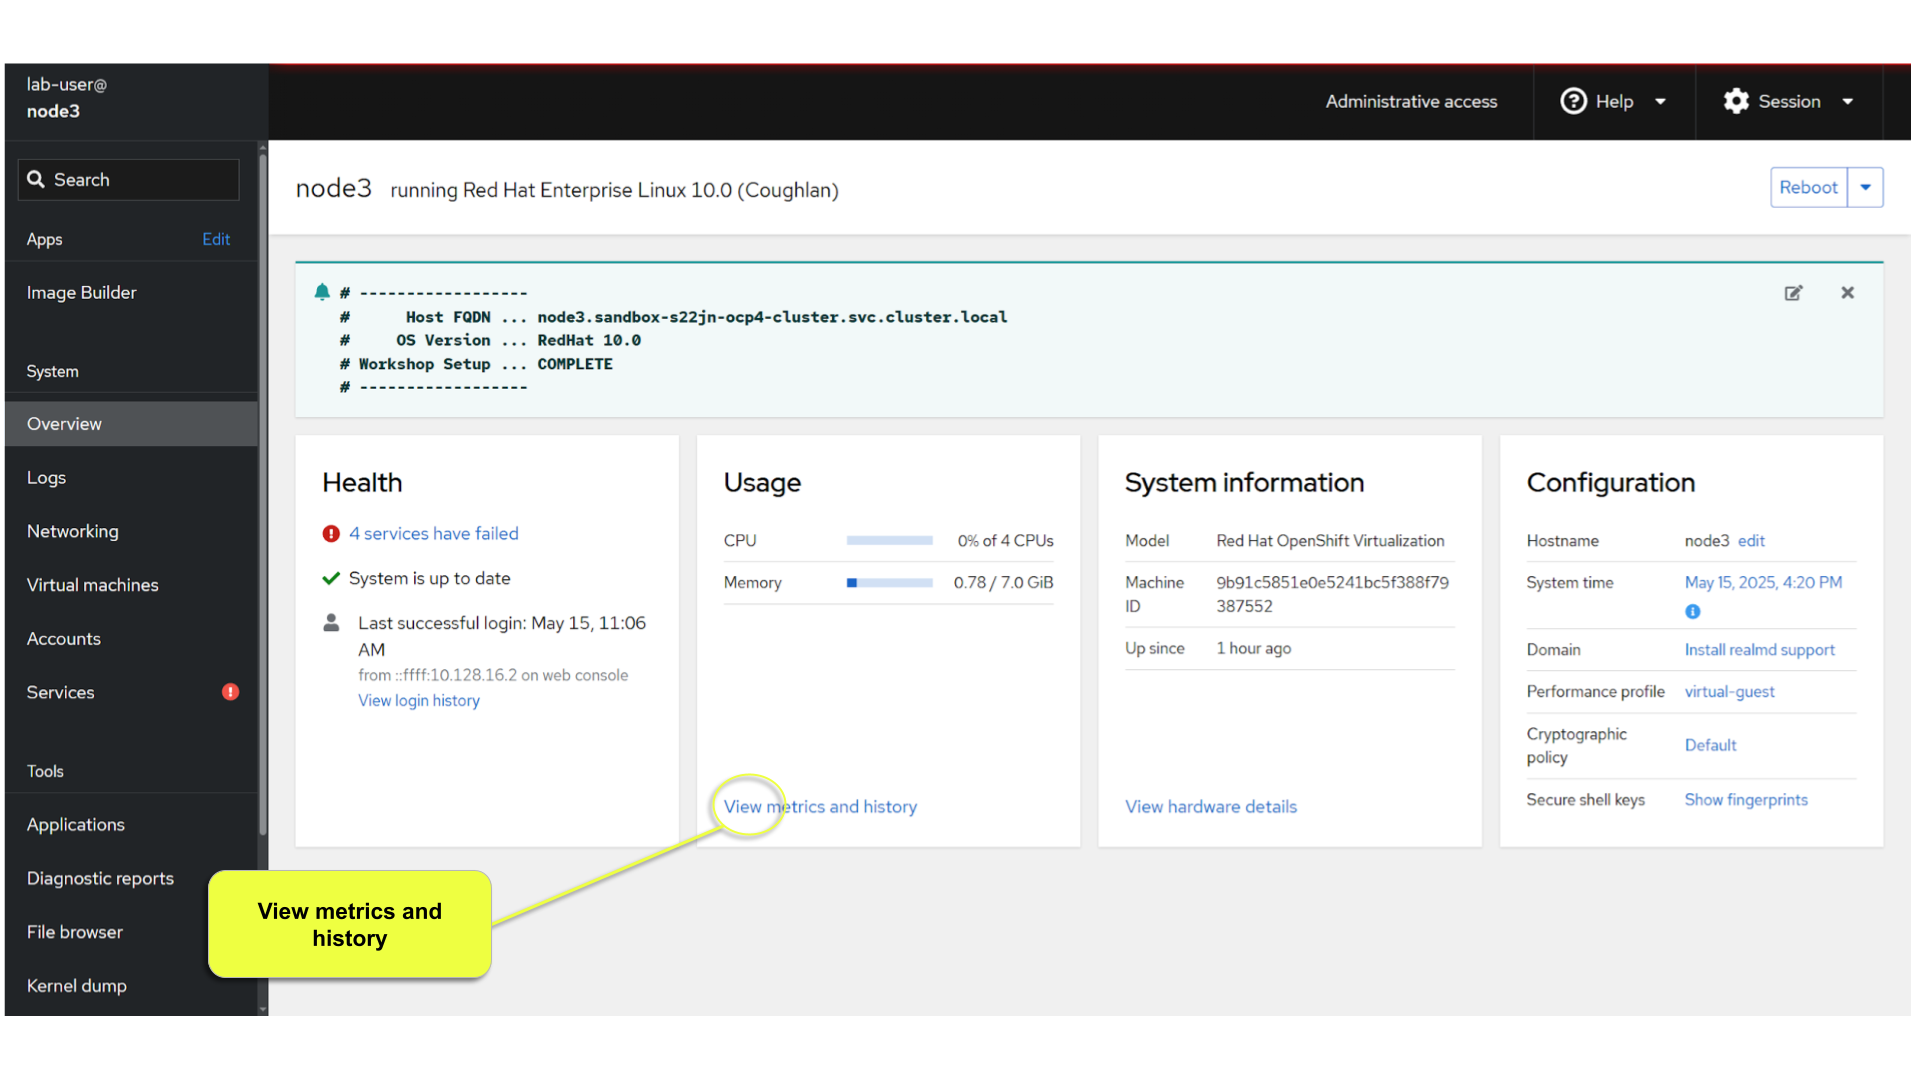
It’s nice that certain statistics about your system are available for inspection, but by default the webconsole does NOT store statistics long term. For this, you need to install “Performance Co-pilot (pcp)”, the cockpit-pcp plugin and lastly enable "persistent metrics collection" in the webconsole.
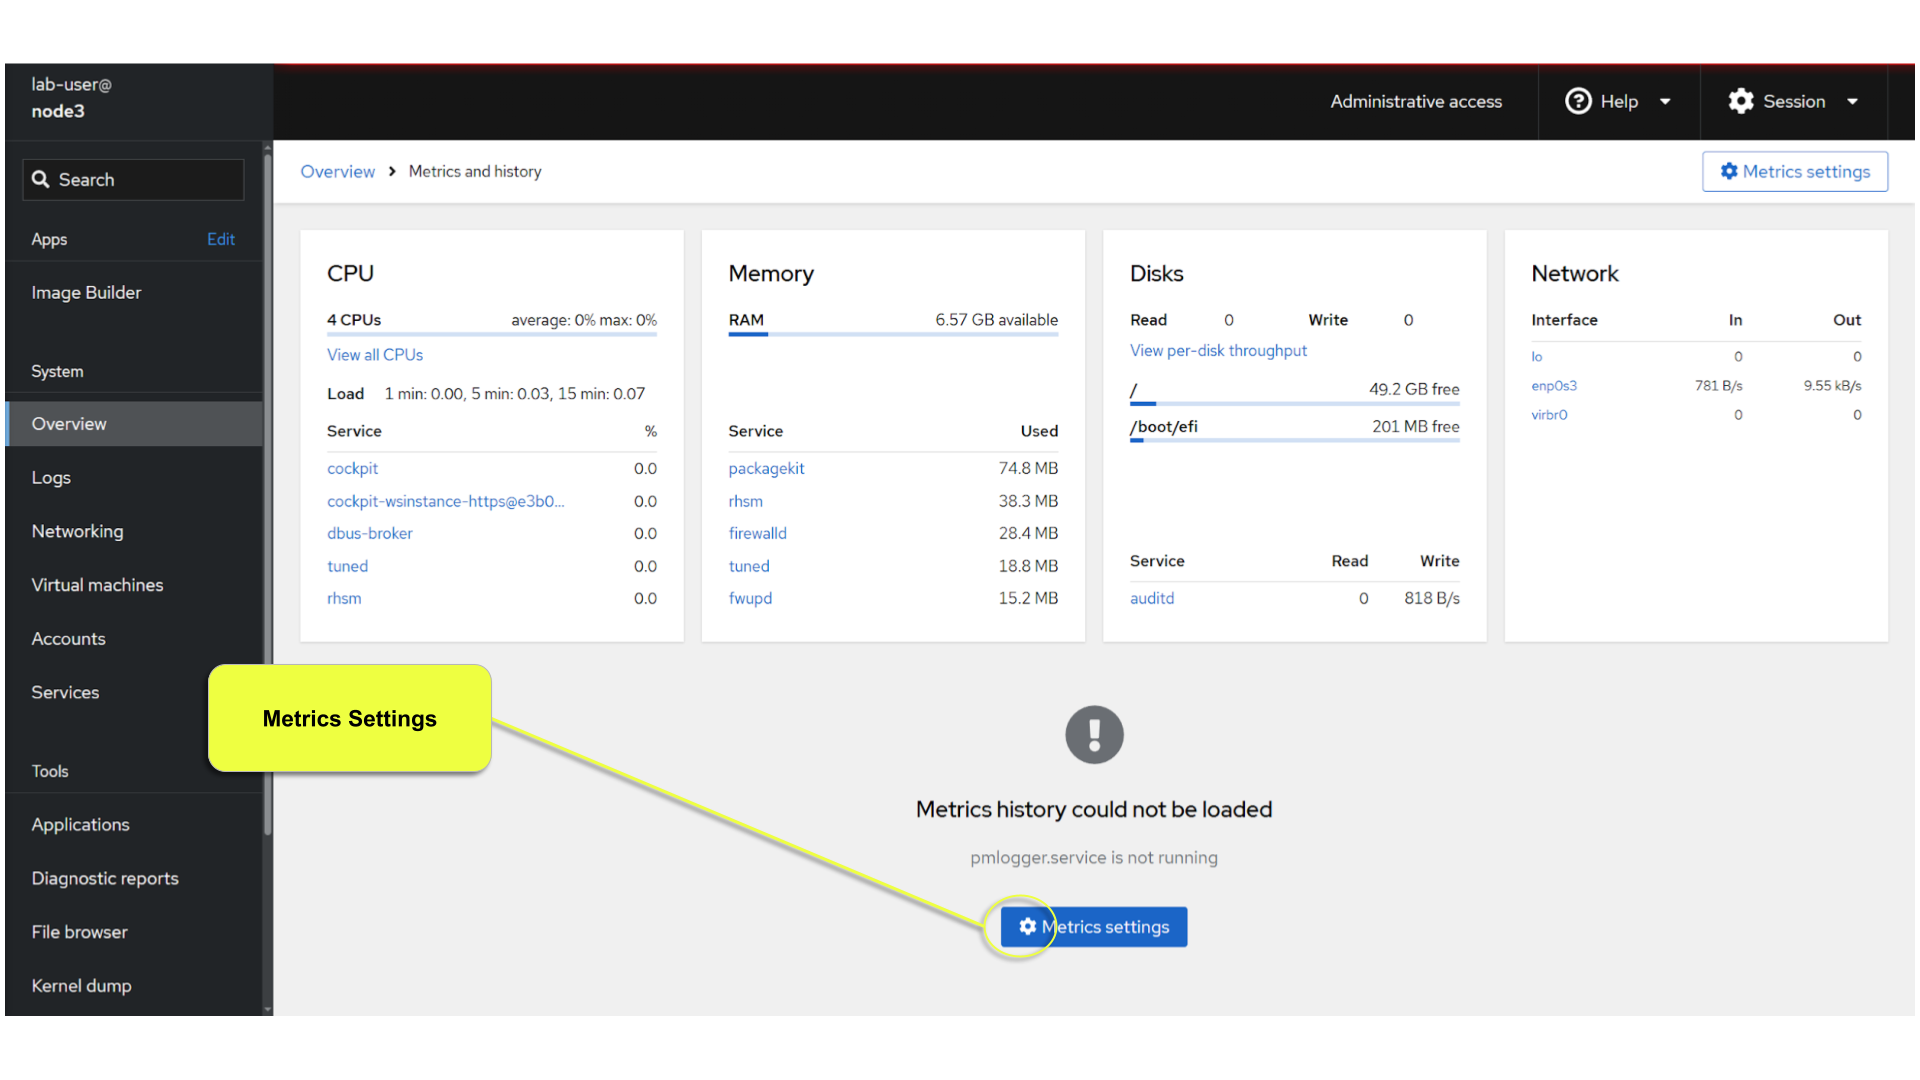
Start by clicking on the link "View metrics and history" on the "Usage" tile.
Next, we need to enable the collection of metrics data.
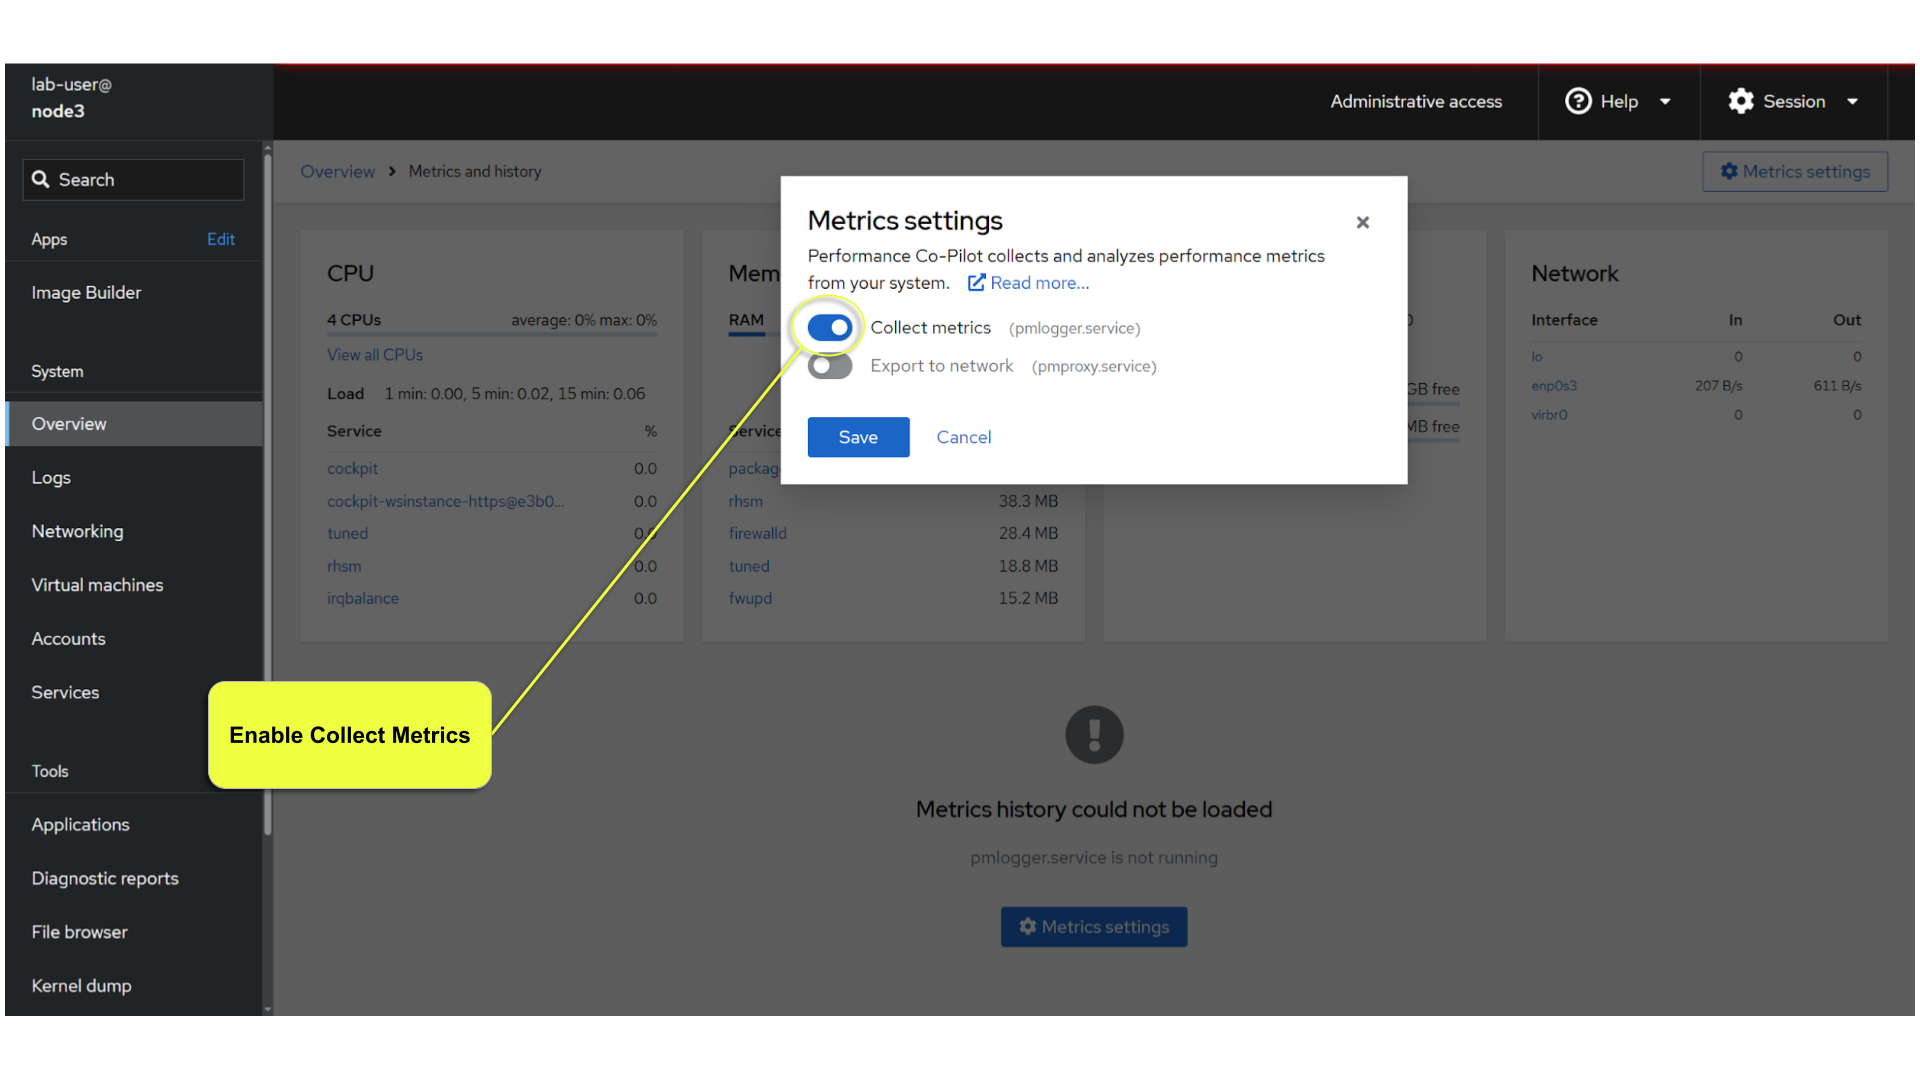
If your system has not already had the Performance Copilot packages installed, a dialog box should have appeared to confirm the automatic install. In our case, the software is already installed and you can proceed to view some performance data.
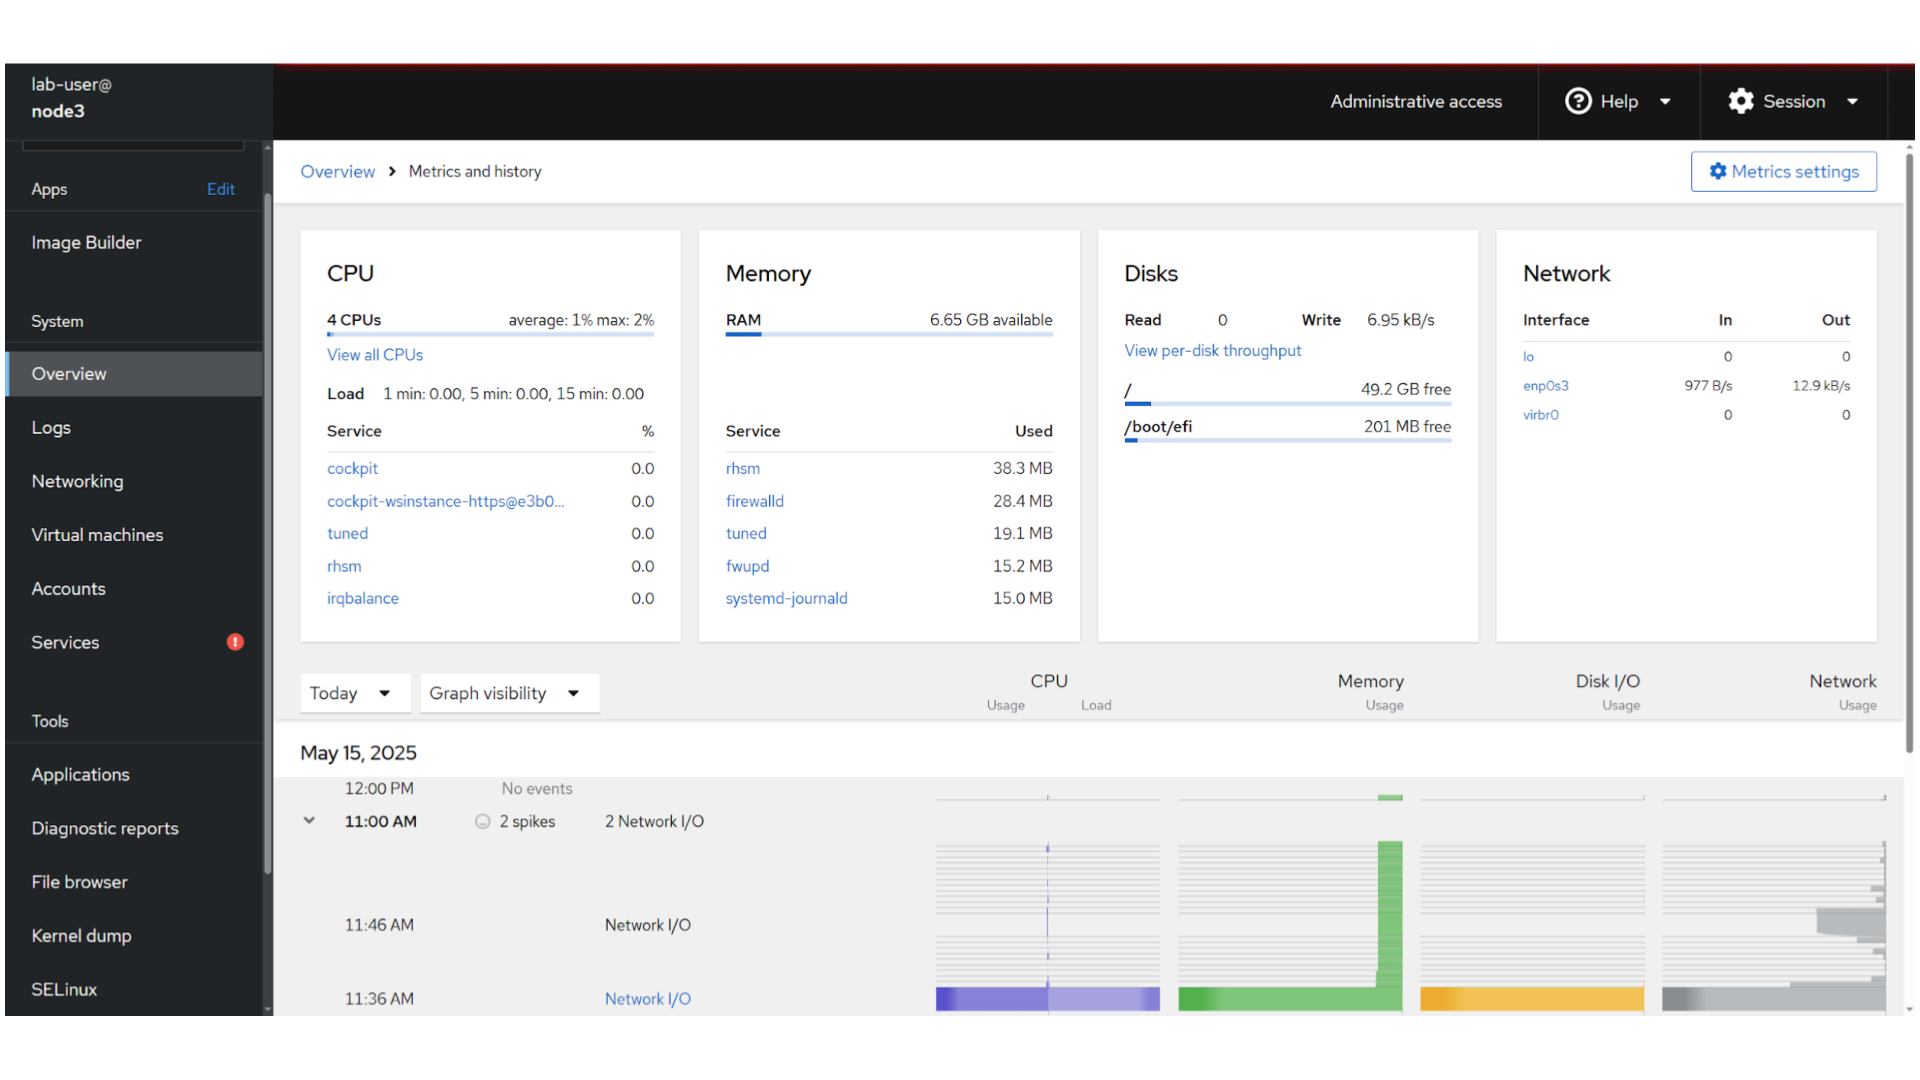
Take a moment to review the available performance information. Since the workshop likely has not be up for very long, there is probably nothing interesting to see yet. Towards the end of the workshop, return to this page and see your performance data.
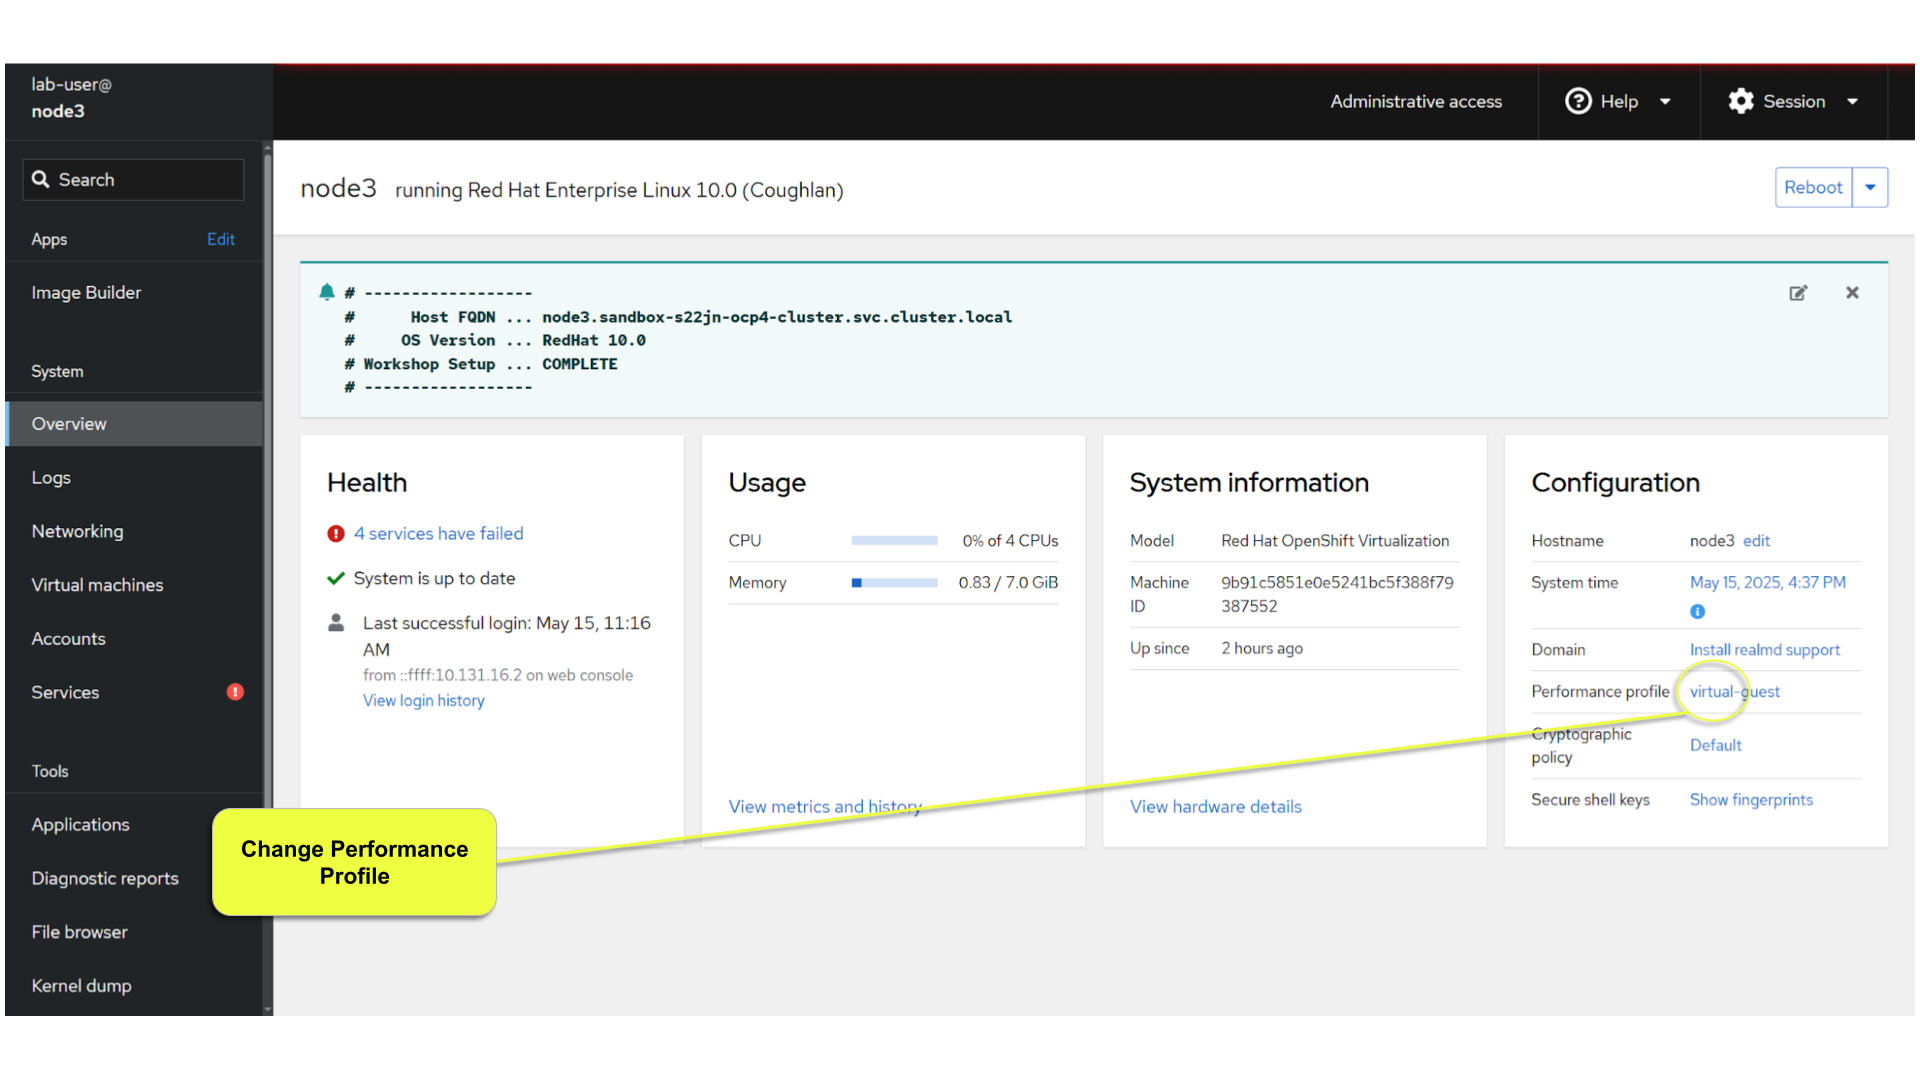
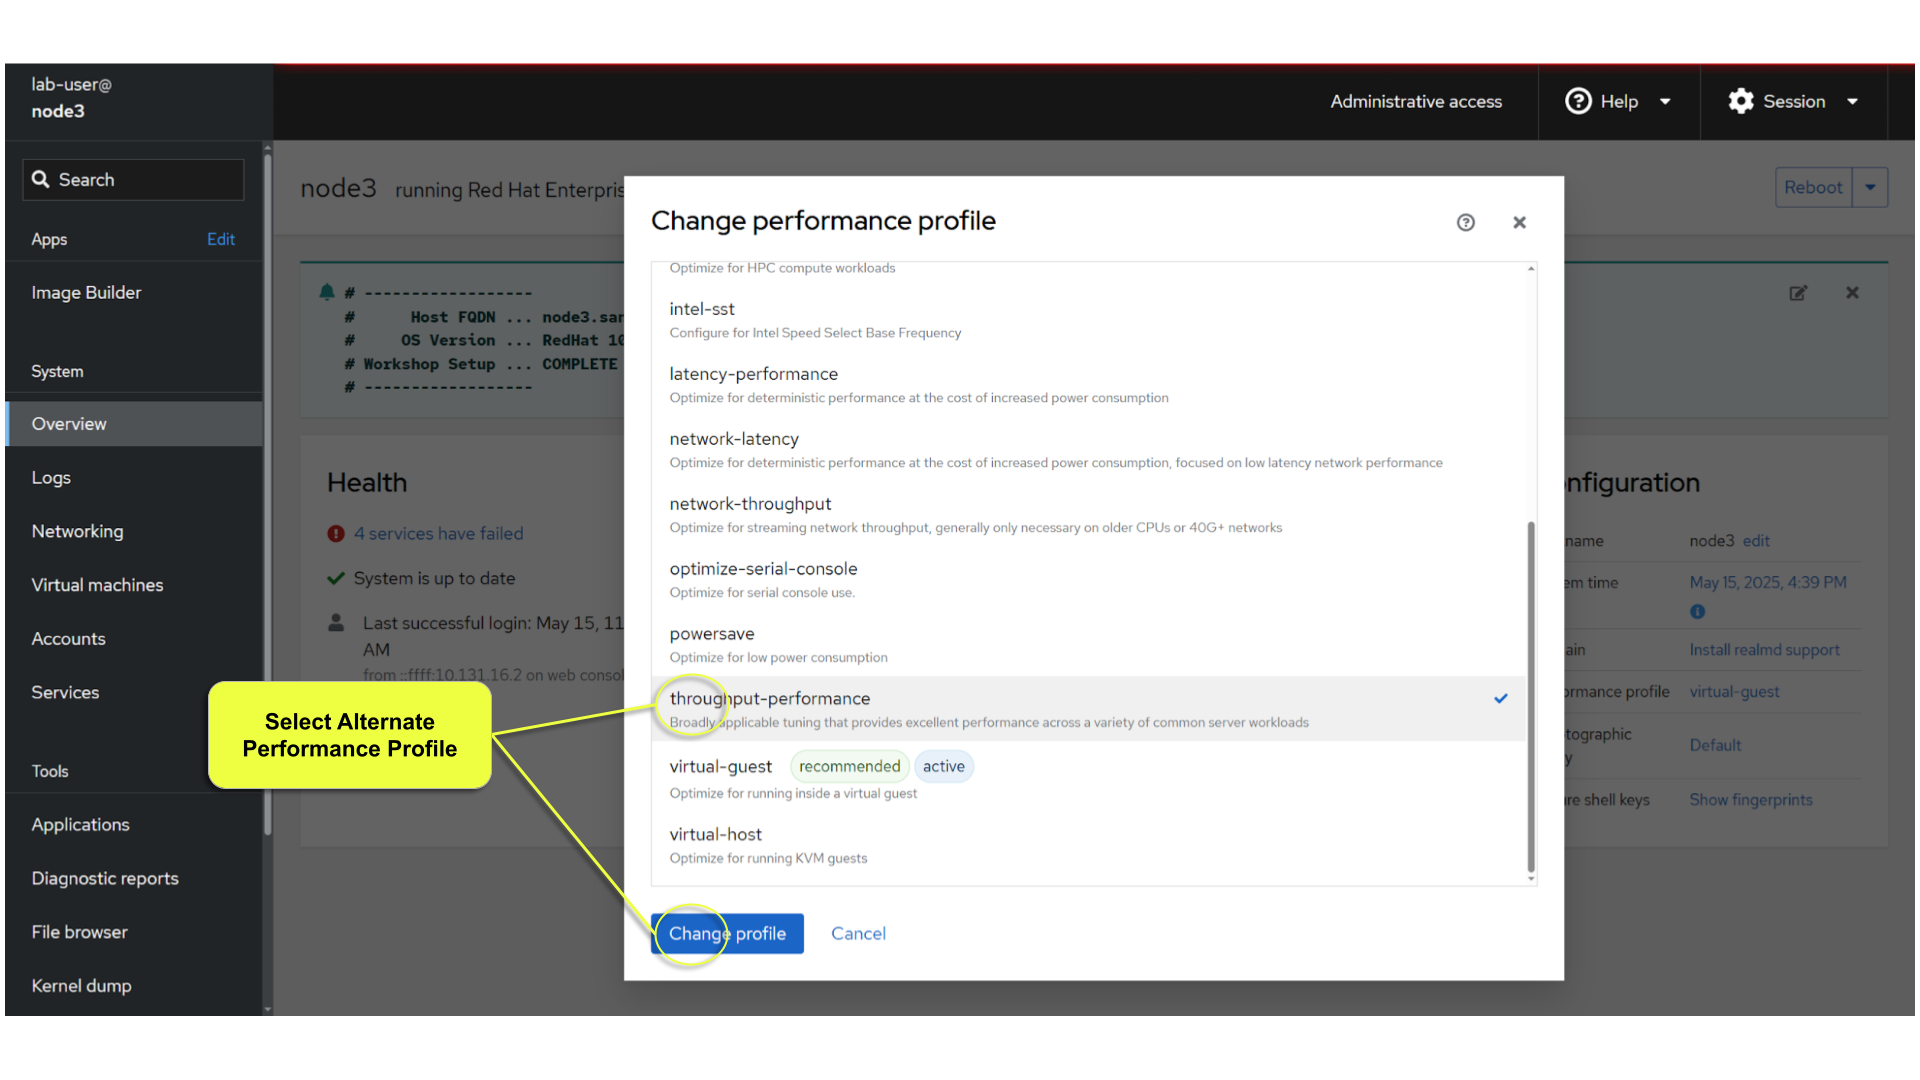
7. Change Performance Profile
RHEL 10 comes with several pre-canned performance tuning profiles from Tuned. Since this is a virtual machine, the default profile “virtual-guest” was selected. You can easily switch profile via the Web Console web UI. In this exercise, we will change the profile to “throughput-performance”
A dialog box will appear. Scroll and find "throughput-performance" and select.
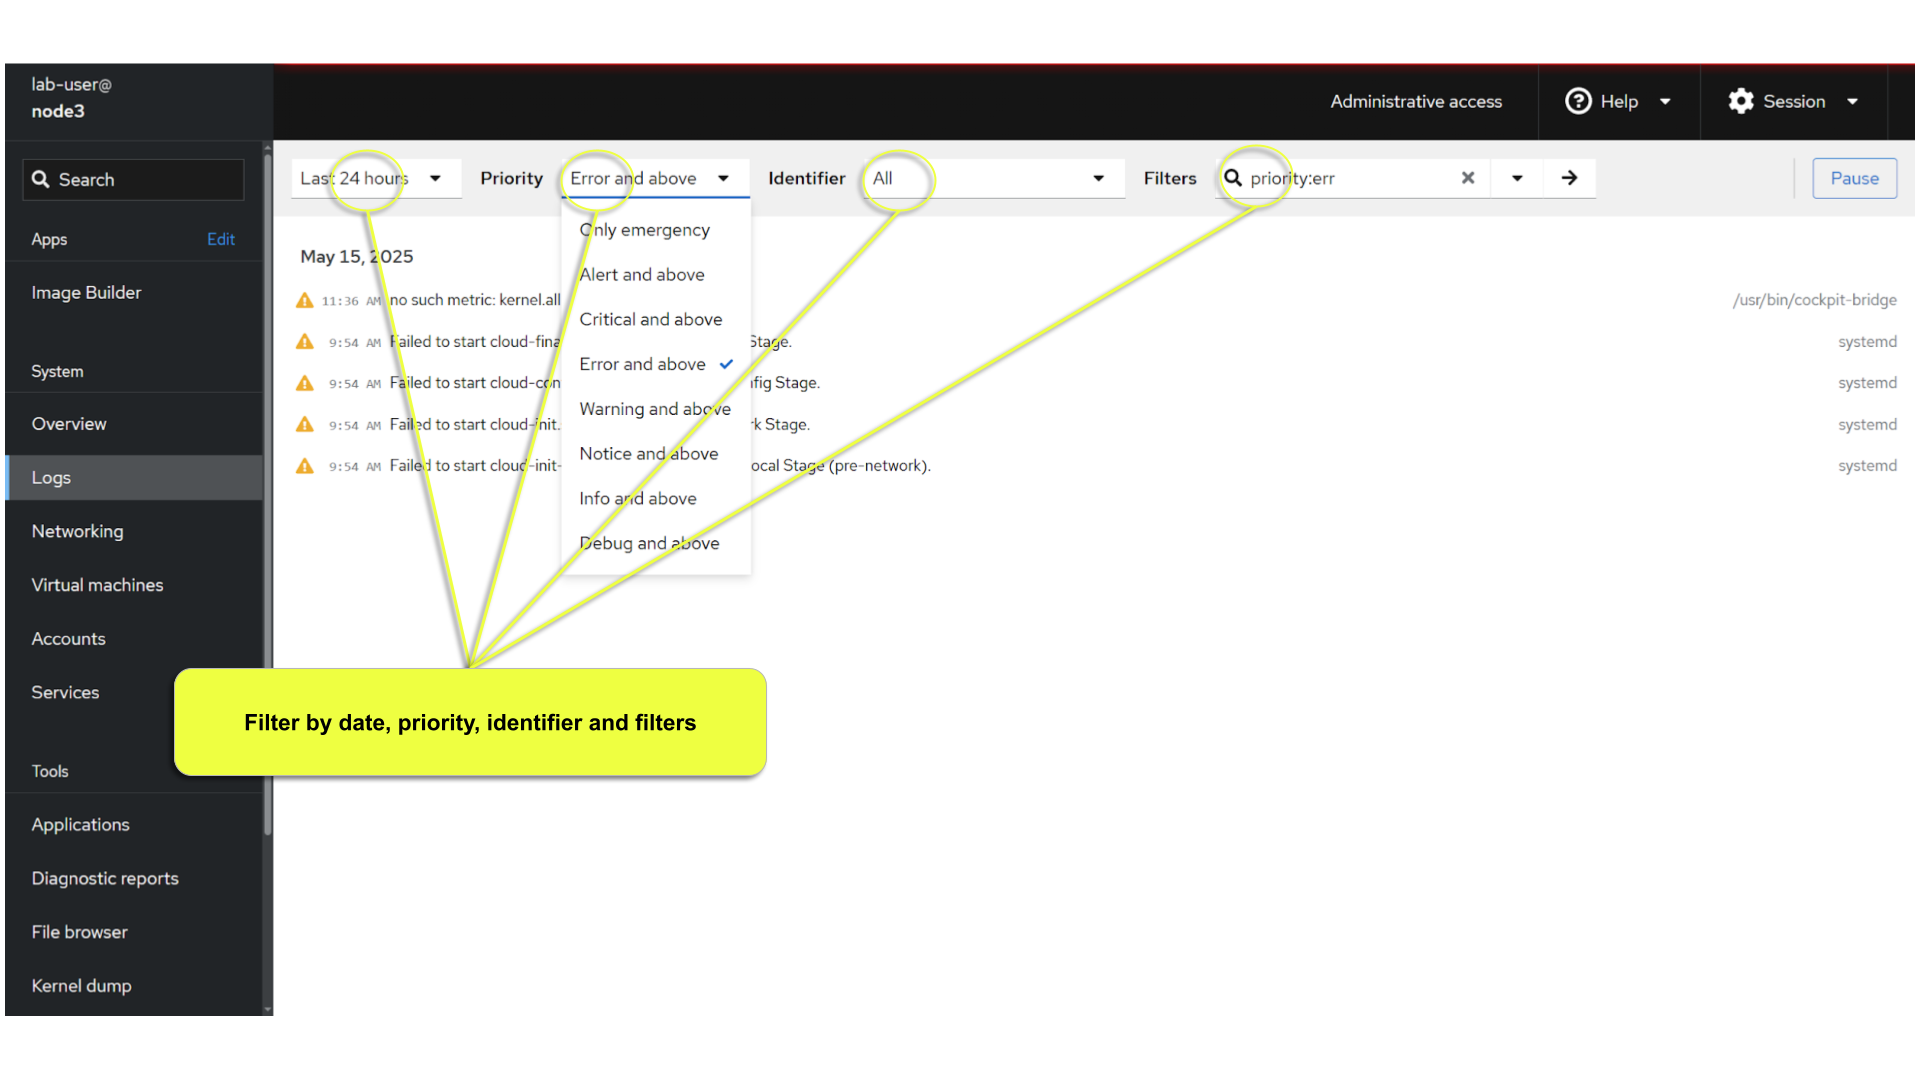
8. View Logs
Under the log section, you can inspect the system’s logs.
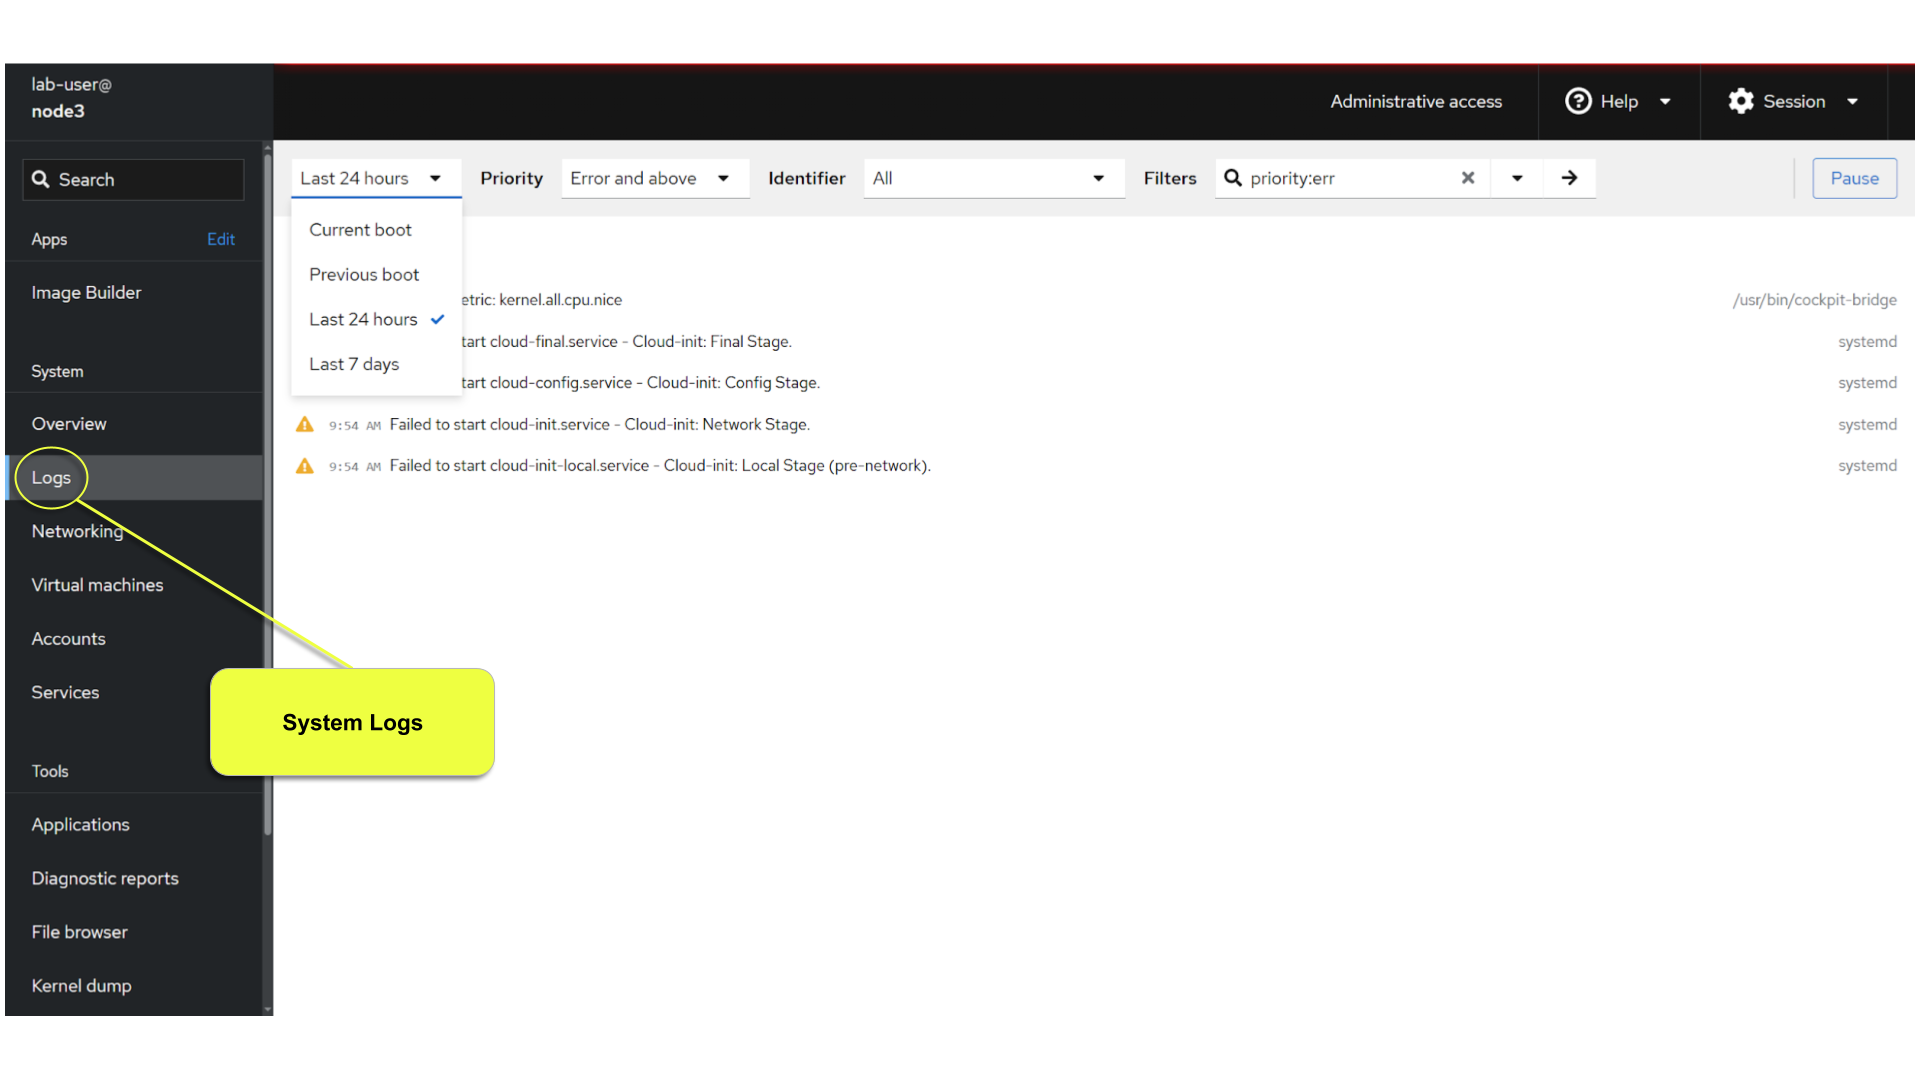
Have a look at the search capabilities and notice that you can set criteria by:
-
Date
-
Priority
-
Identifier
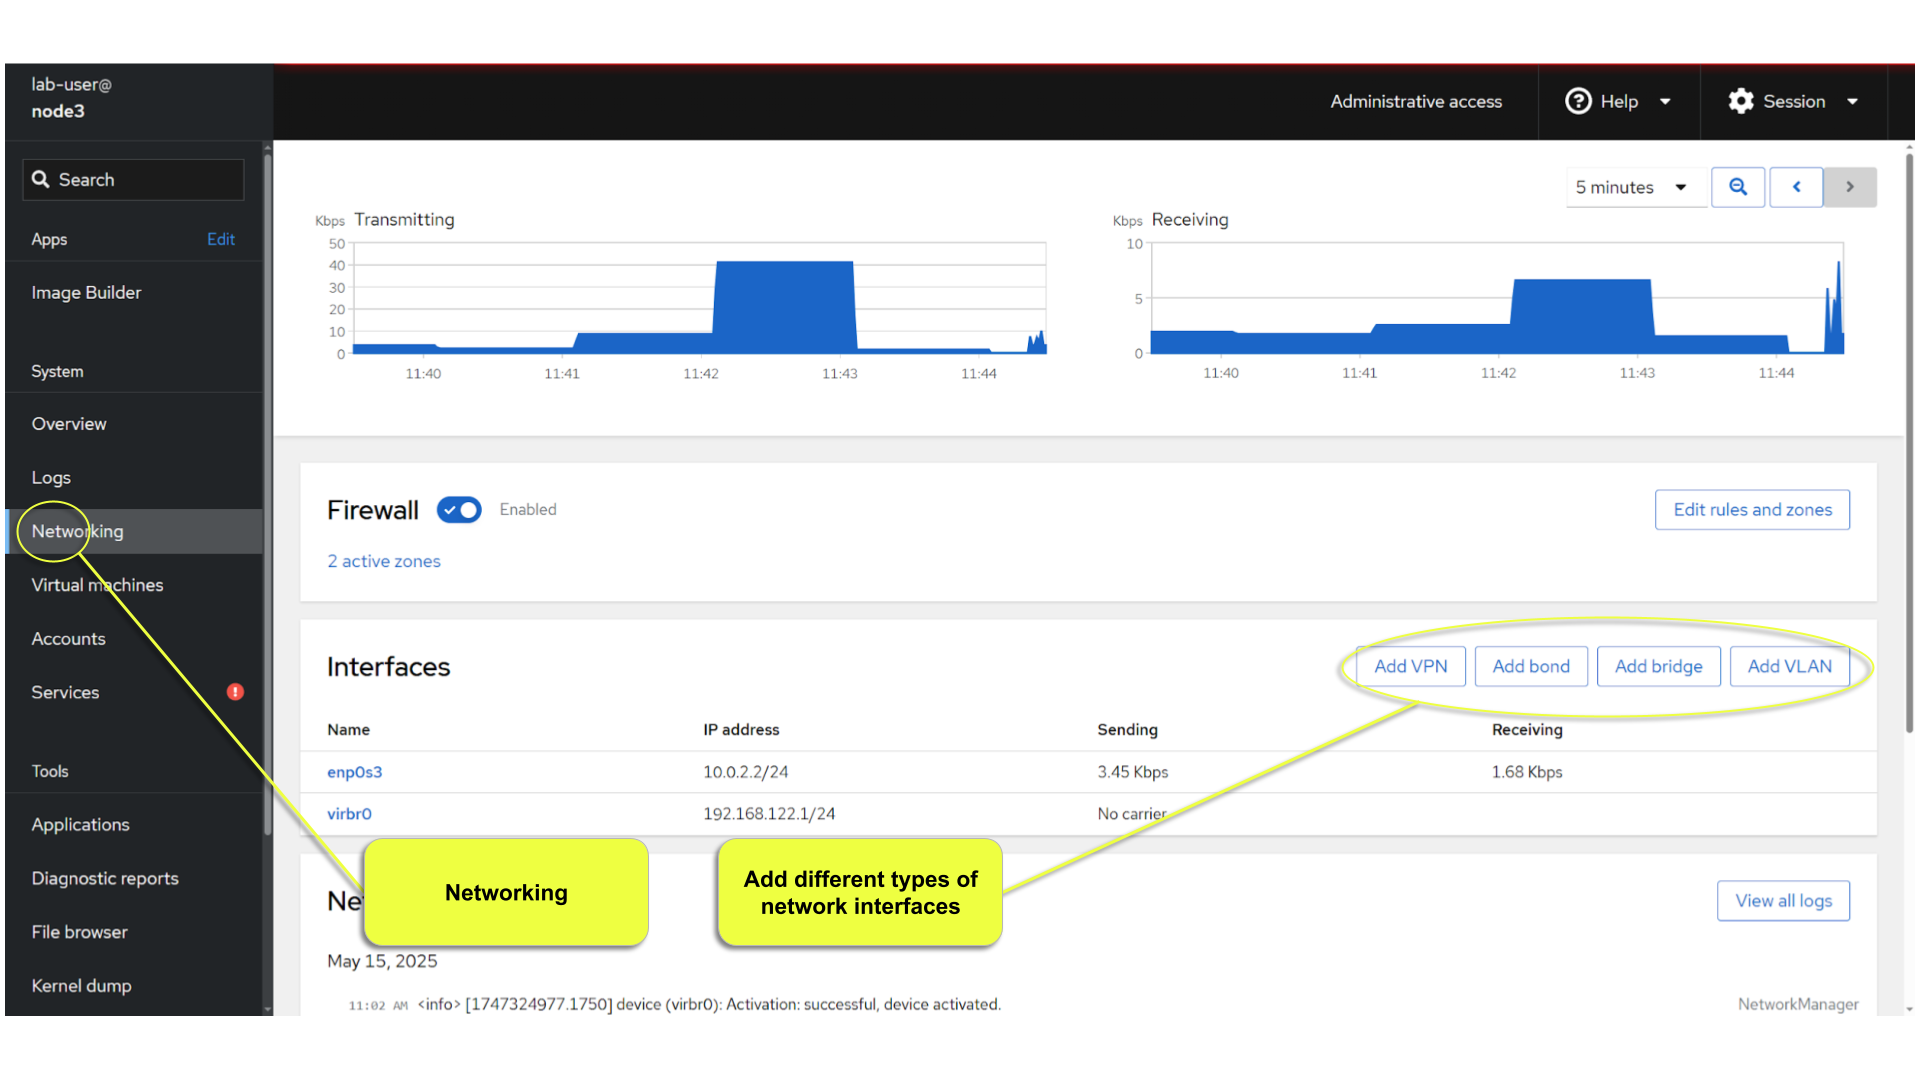
9. Network Management
Under the networking section, you can monitor and manage current networking activities and devices. You can create a network VPN, bond, bridge, and VLAN all driven by the webconsle GUI.
Due to the nature of workshops, we refrain from making and saving changes to the network at this time but feel free to explore.
10. Firewall Management
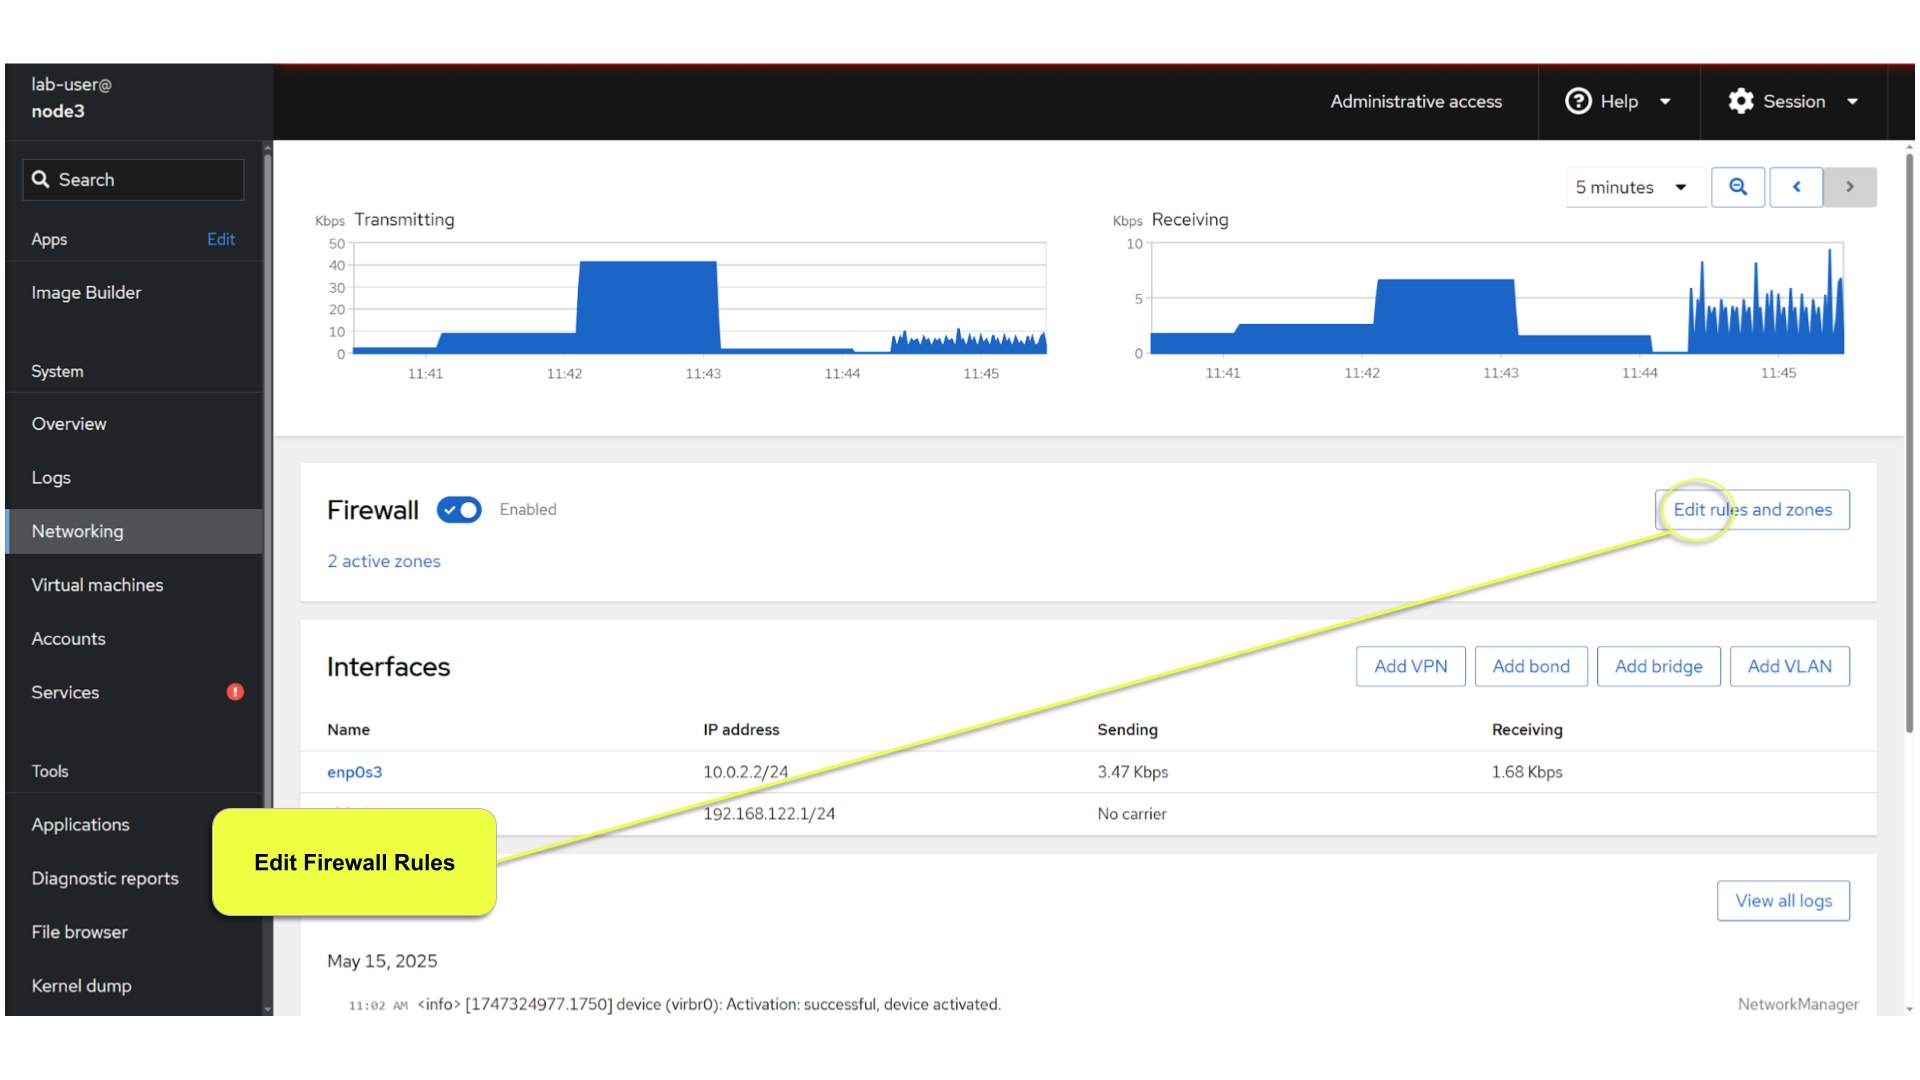
Also under the networking section, you can configure your firewall rules.
For the next exercise, let’s enable a rule for NTP (Network Time Protocol). You would enable this rule if you wish to configure chronyd as an authoritative time server. Begin by selecting the Networking category and "Edit rules and zones".
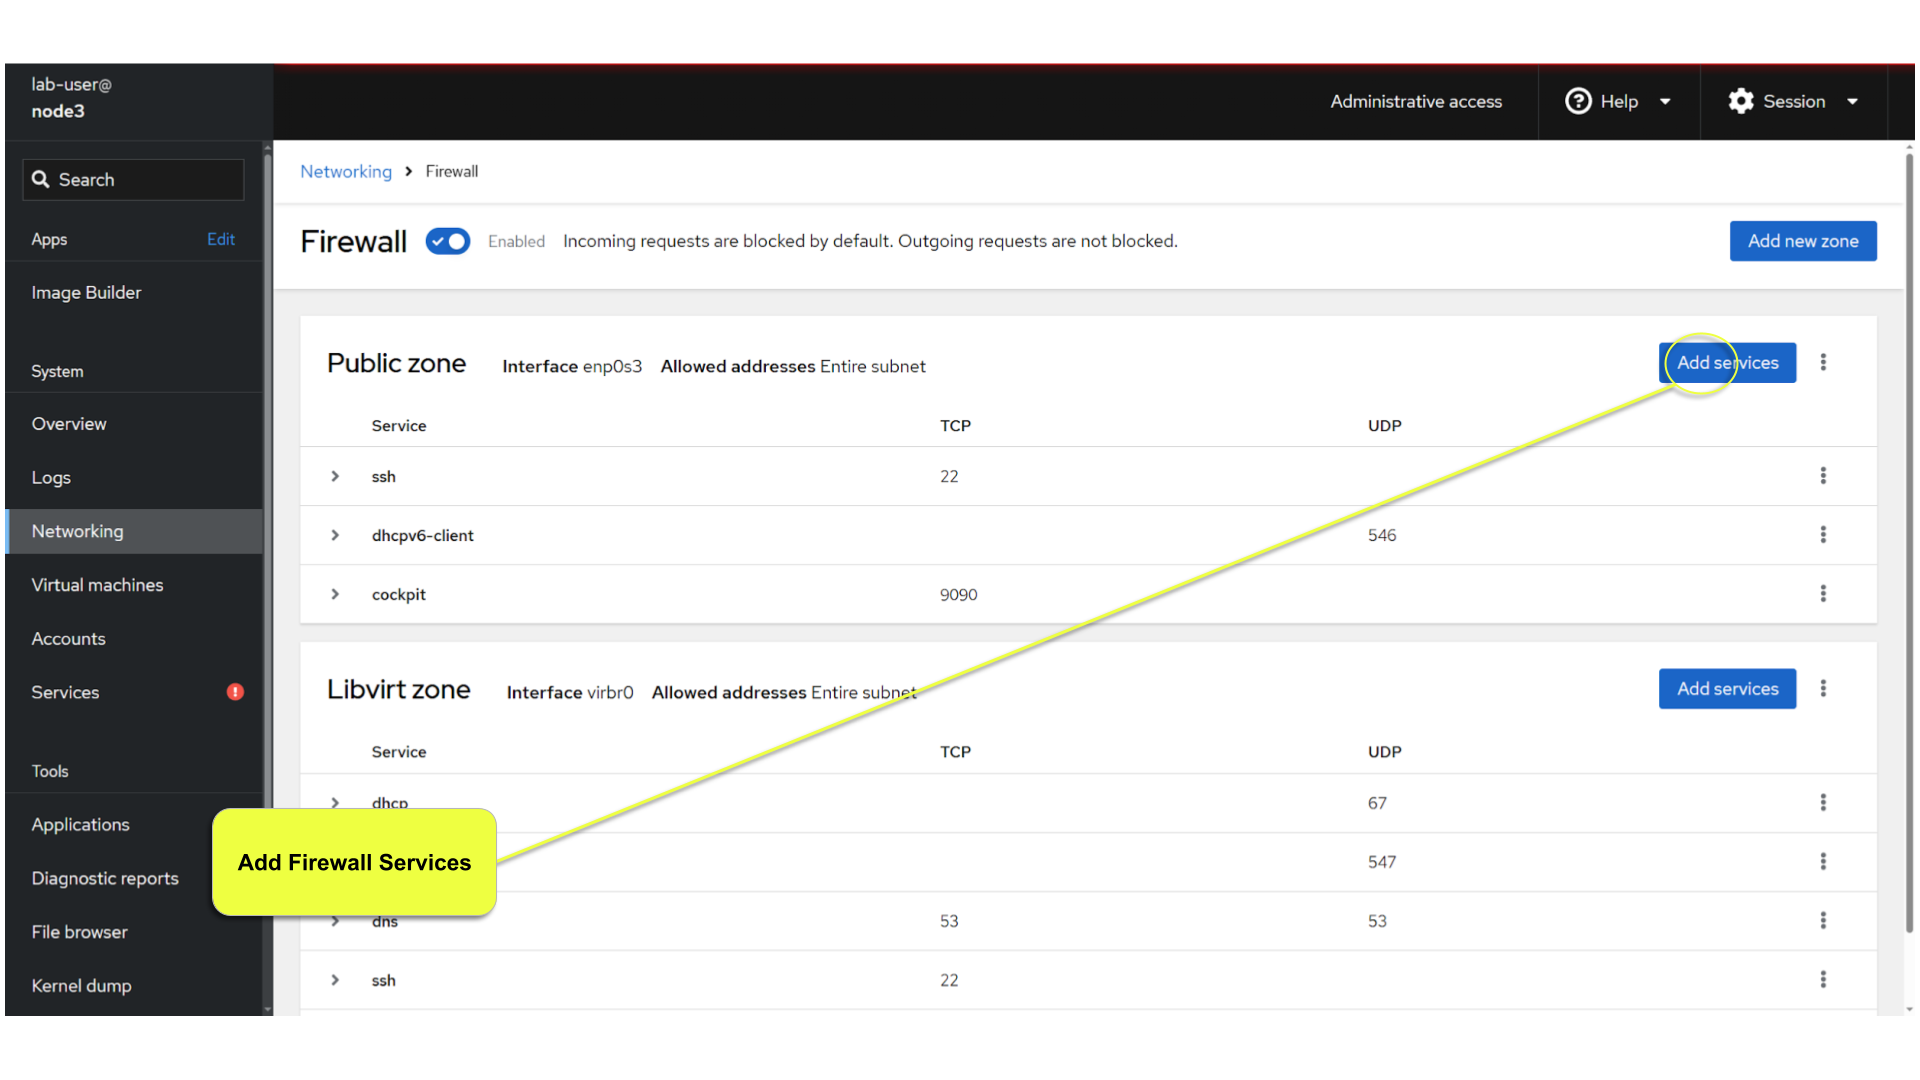
Now you should see a list of active services and ports. Proceed to select "Add services"
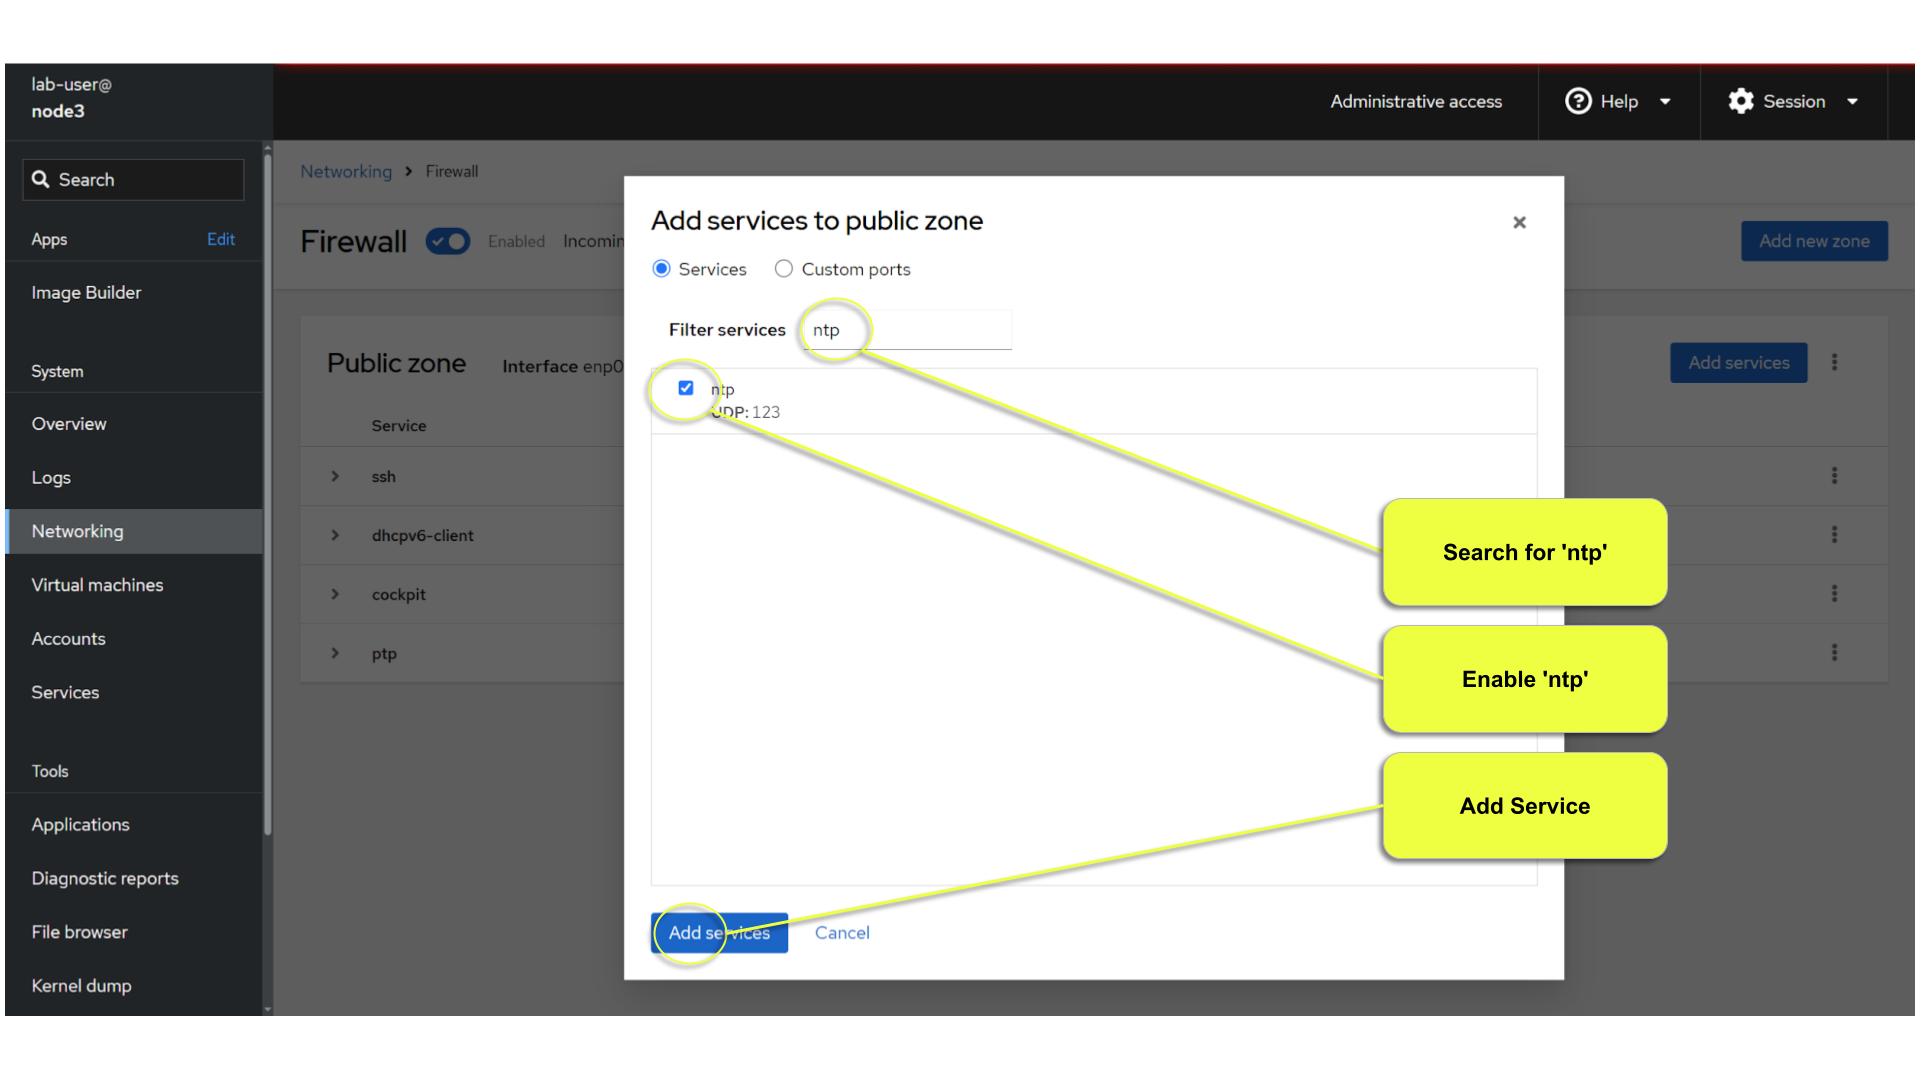
In the dialog box enter 'ntp' as the filter, select 'ntp' and hit "Add services".
11. Service Management
Now that you enabled an NTP firewall rule, let’s make sure an NTP service is enabled and running under the Web Console Services section.
Remember that RHEL 10 uses a provider called 'chrony' for ntp. So you can search for either 'chrony' or 'ntp'.
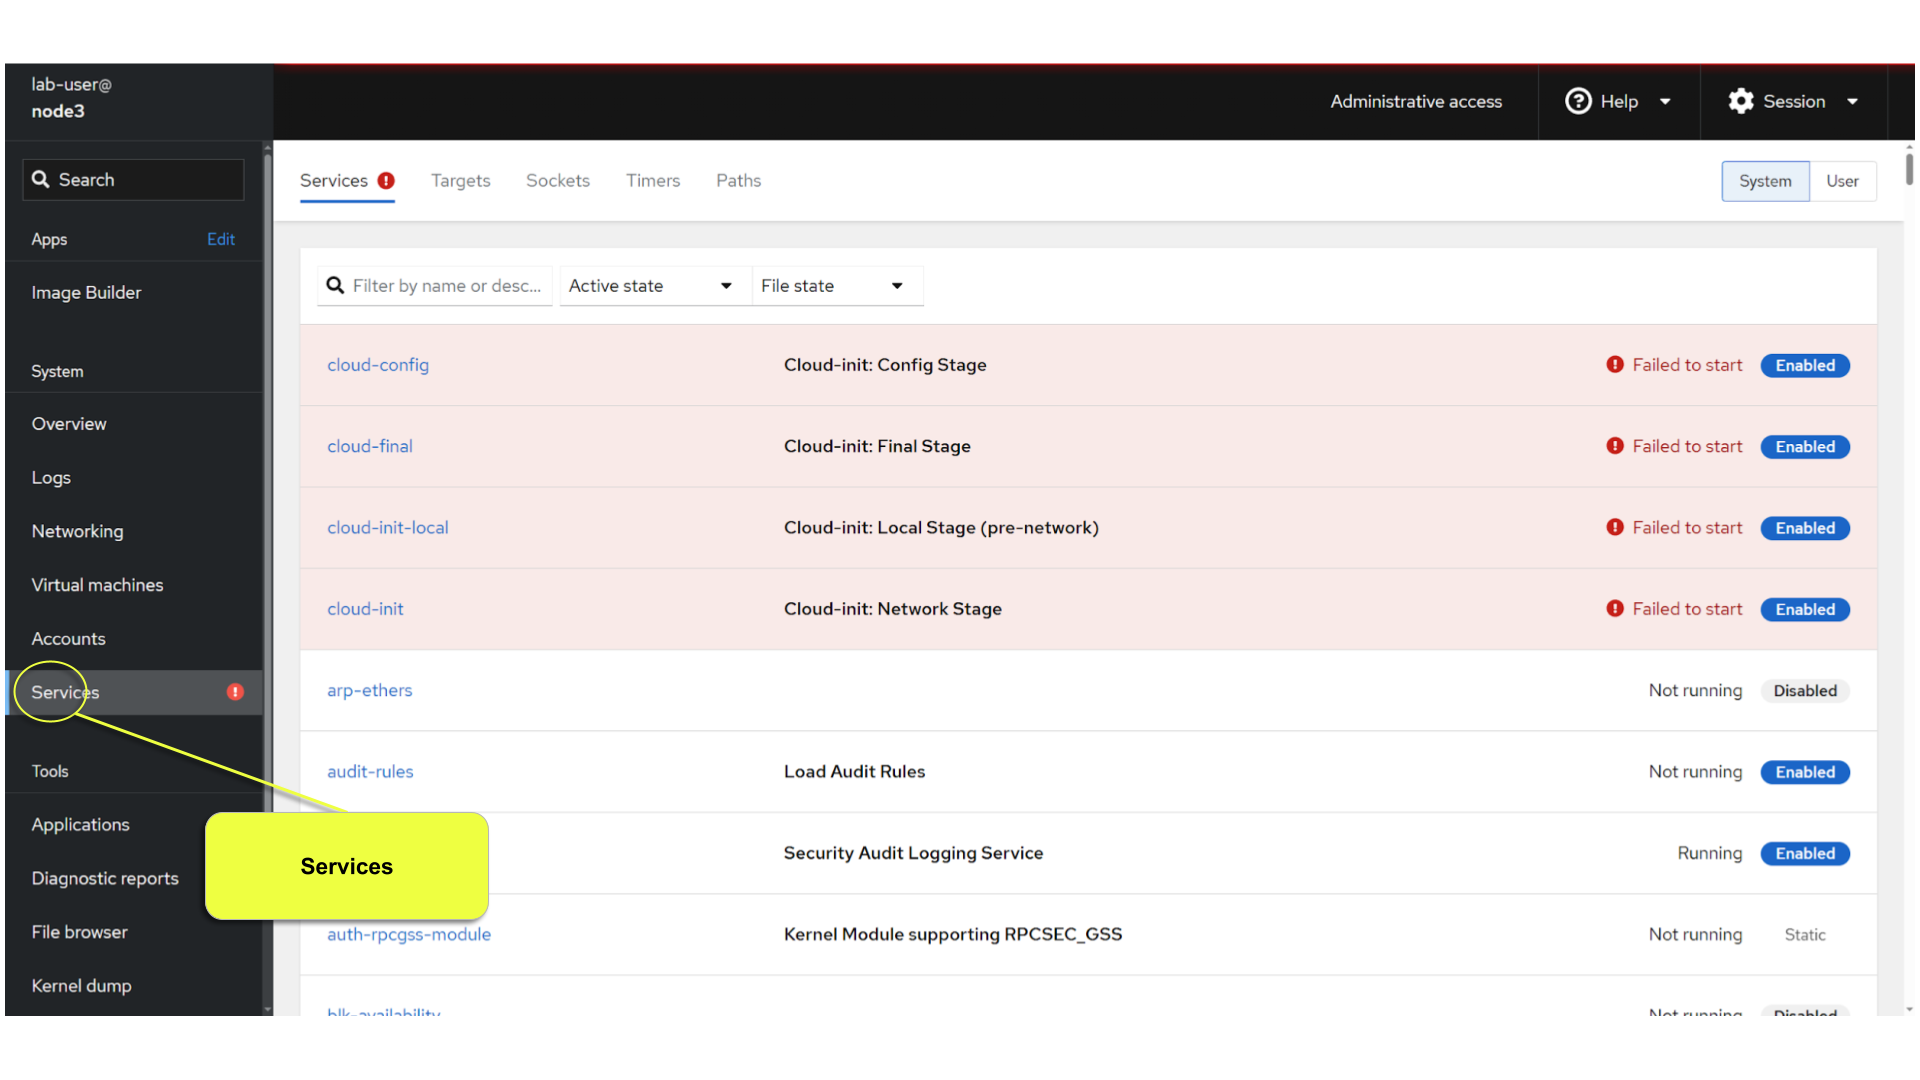
Turns out, chronyd is already enabled and active. This is because chronyd is already acting as the default NTP client. With some minor configuration changes to /etc/chrony.conf, chronyd can also serve as an authoritative time server.

12. File Browser
A new feature to the Web Console is the 'File Browser'. This powerful tool gives you access to navigate the filesystems (with appropriate permissions of course), make changes and even edit simple files.
So let’s take a quick look at some of its capabilities.
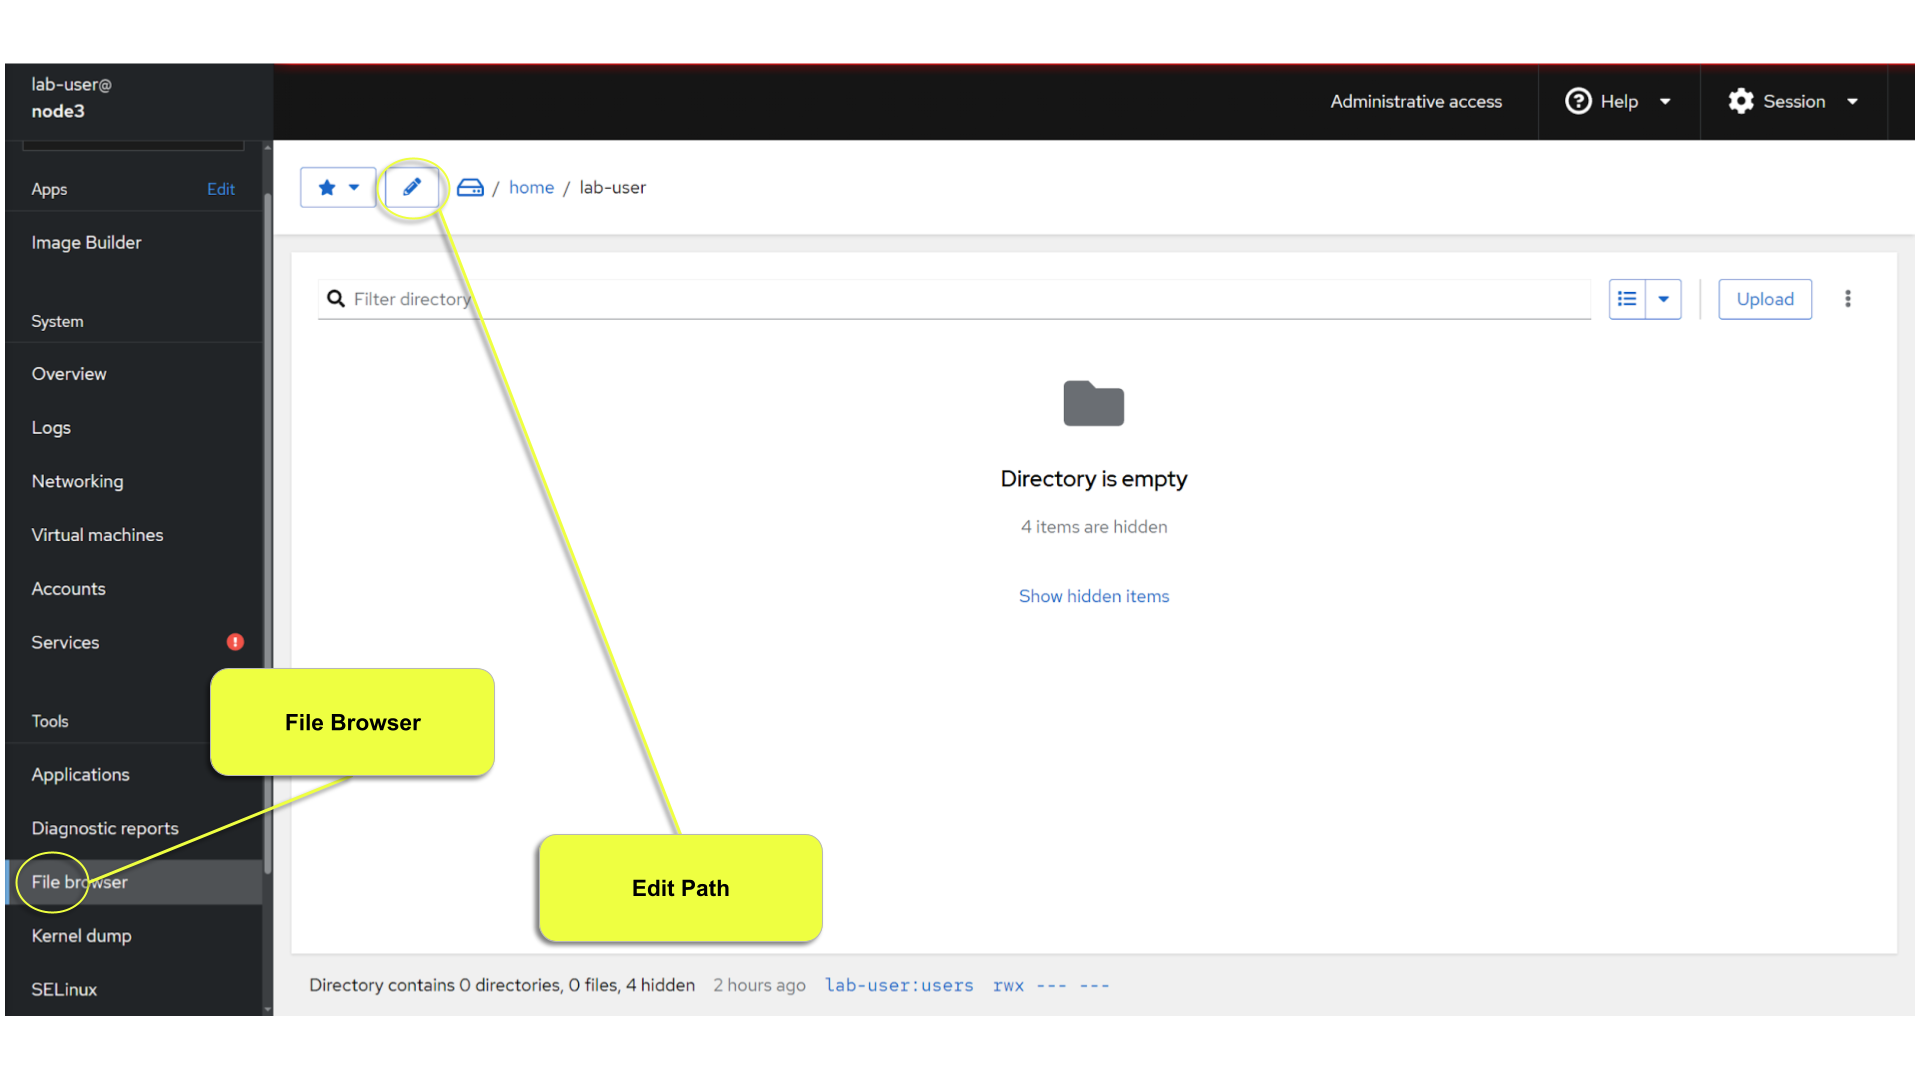
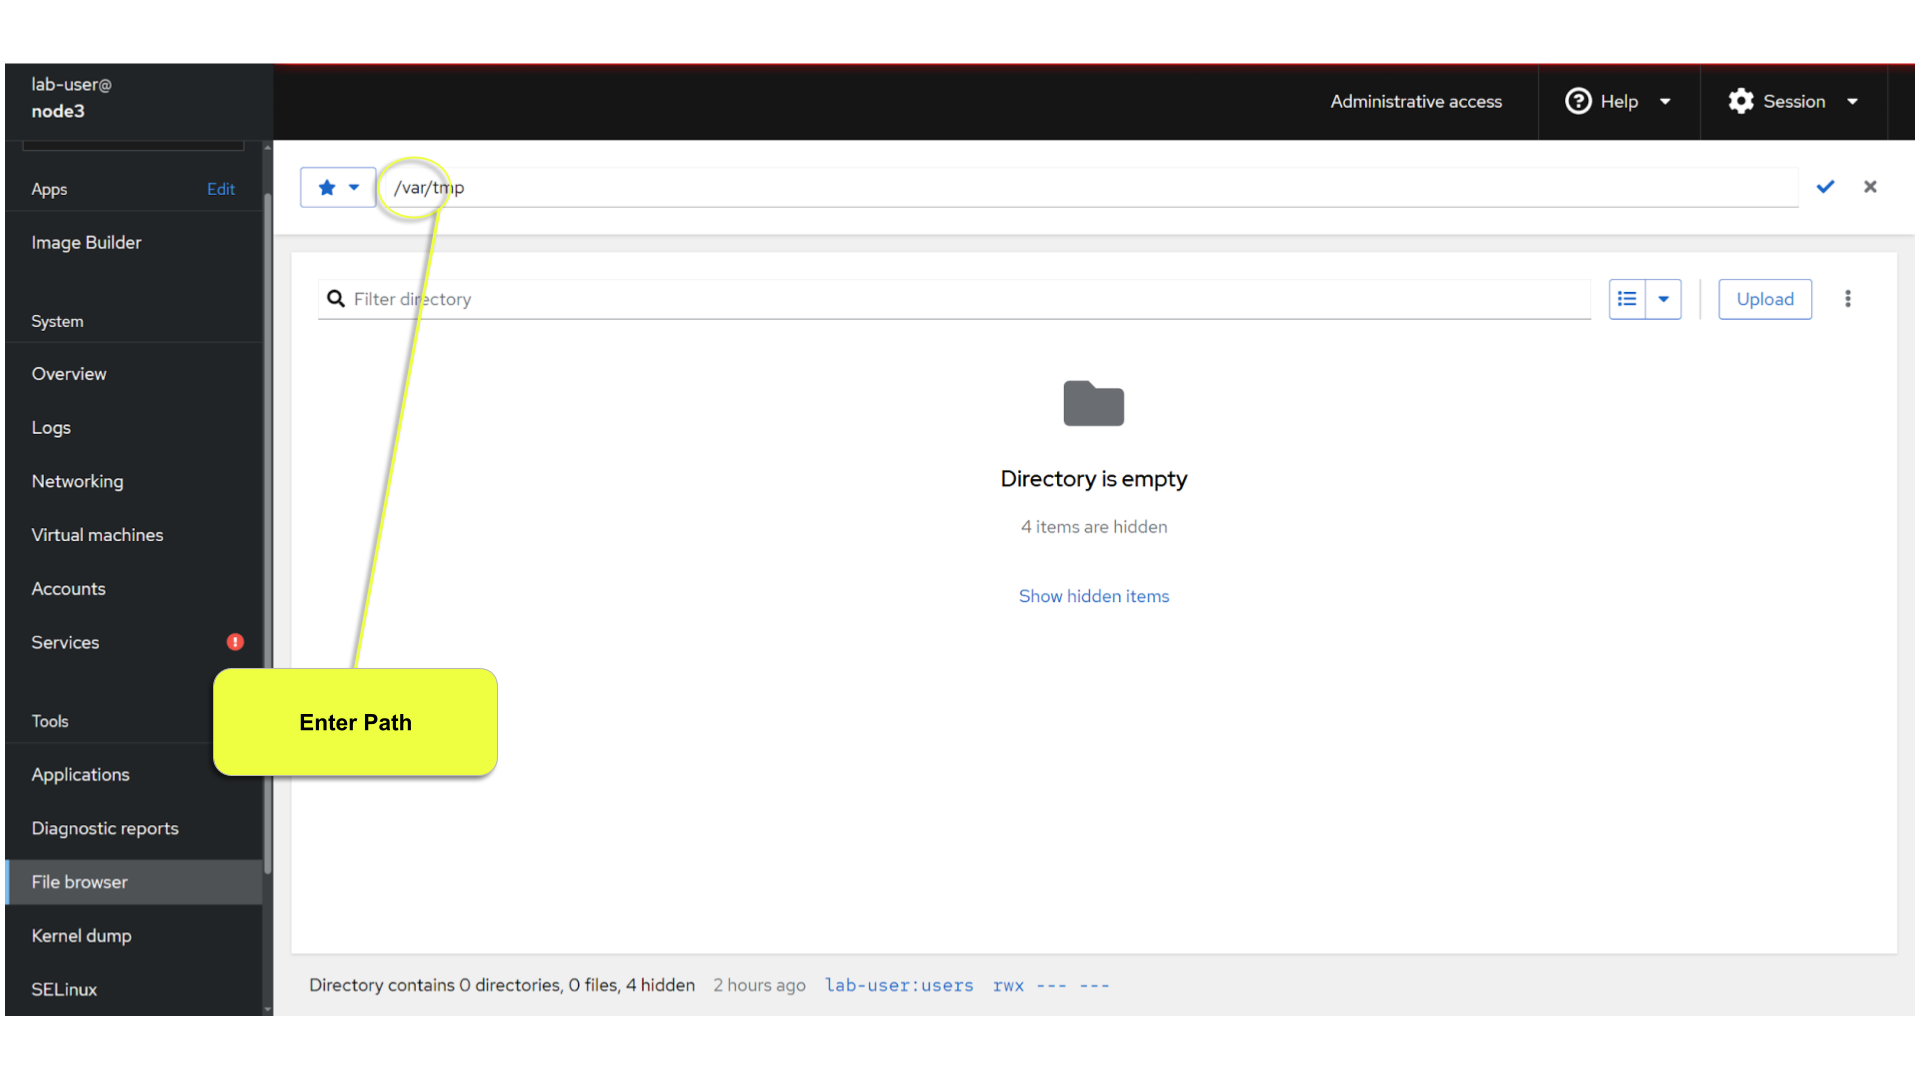
Change your directory to /var/tmp/ either by navigating or editing the shown path.
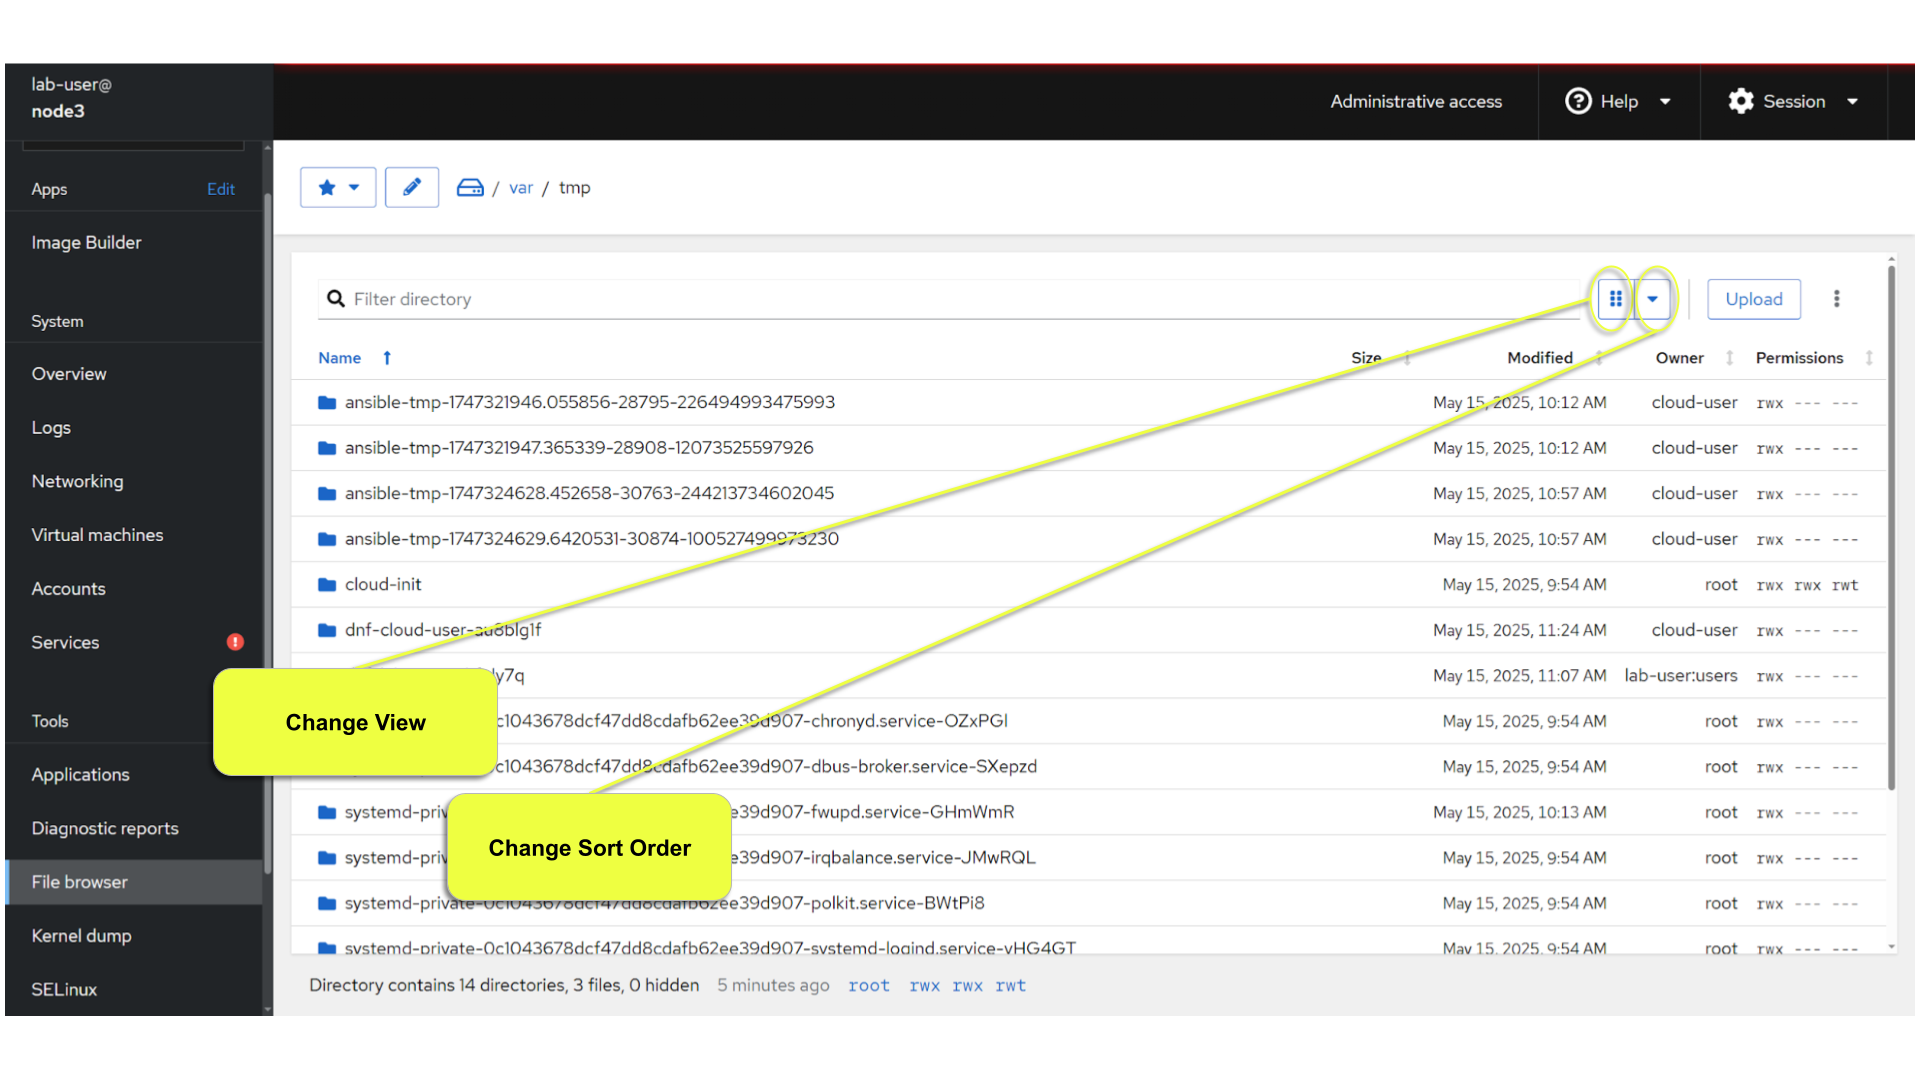
Change the view to a 'detailed list' instead of the 'icon view', or maybe an alternative sort order.
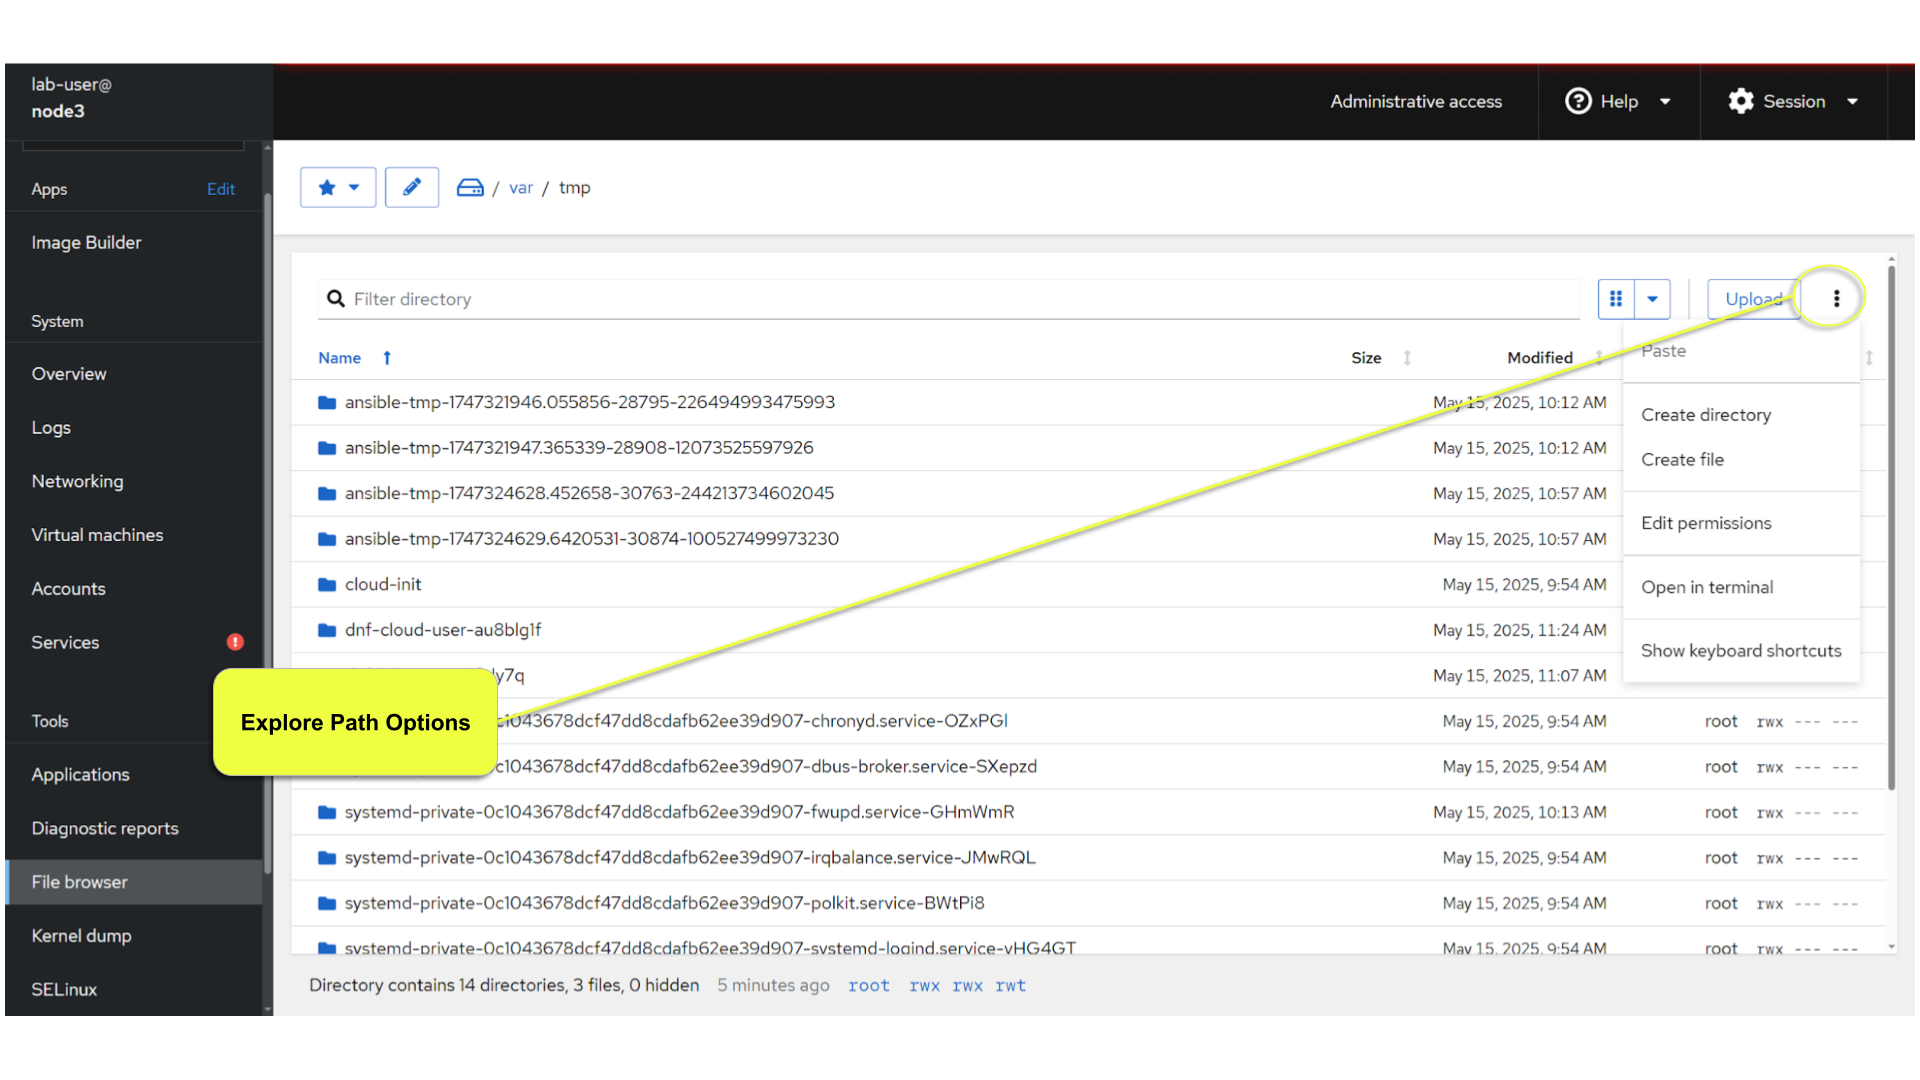
Explore actions you can take on the current directory.
Explore the actions you can take by right-clicking on a file.
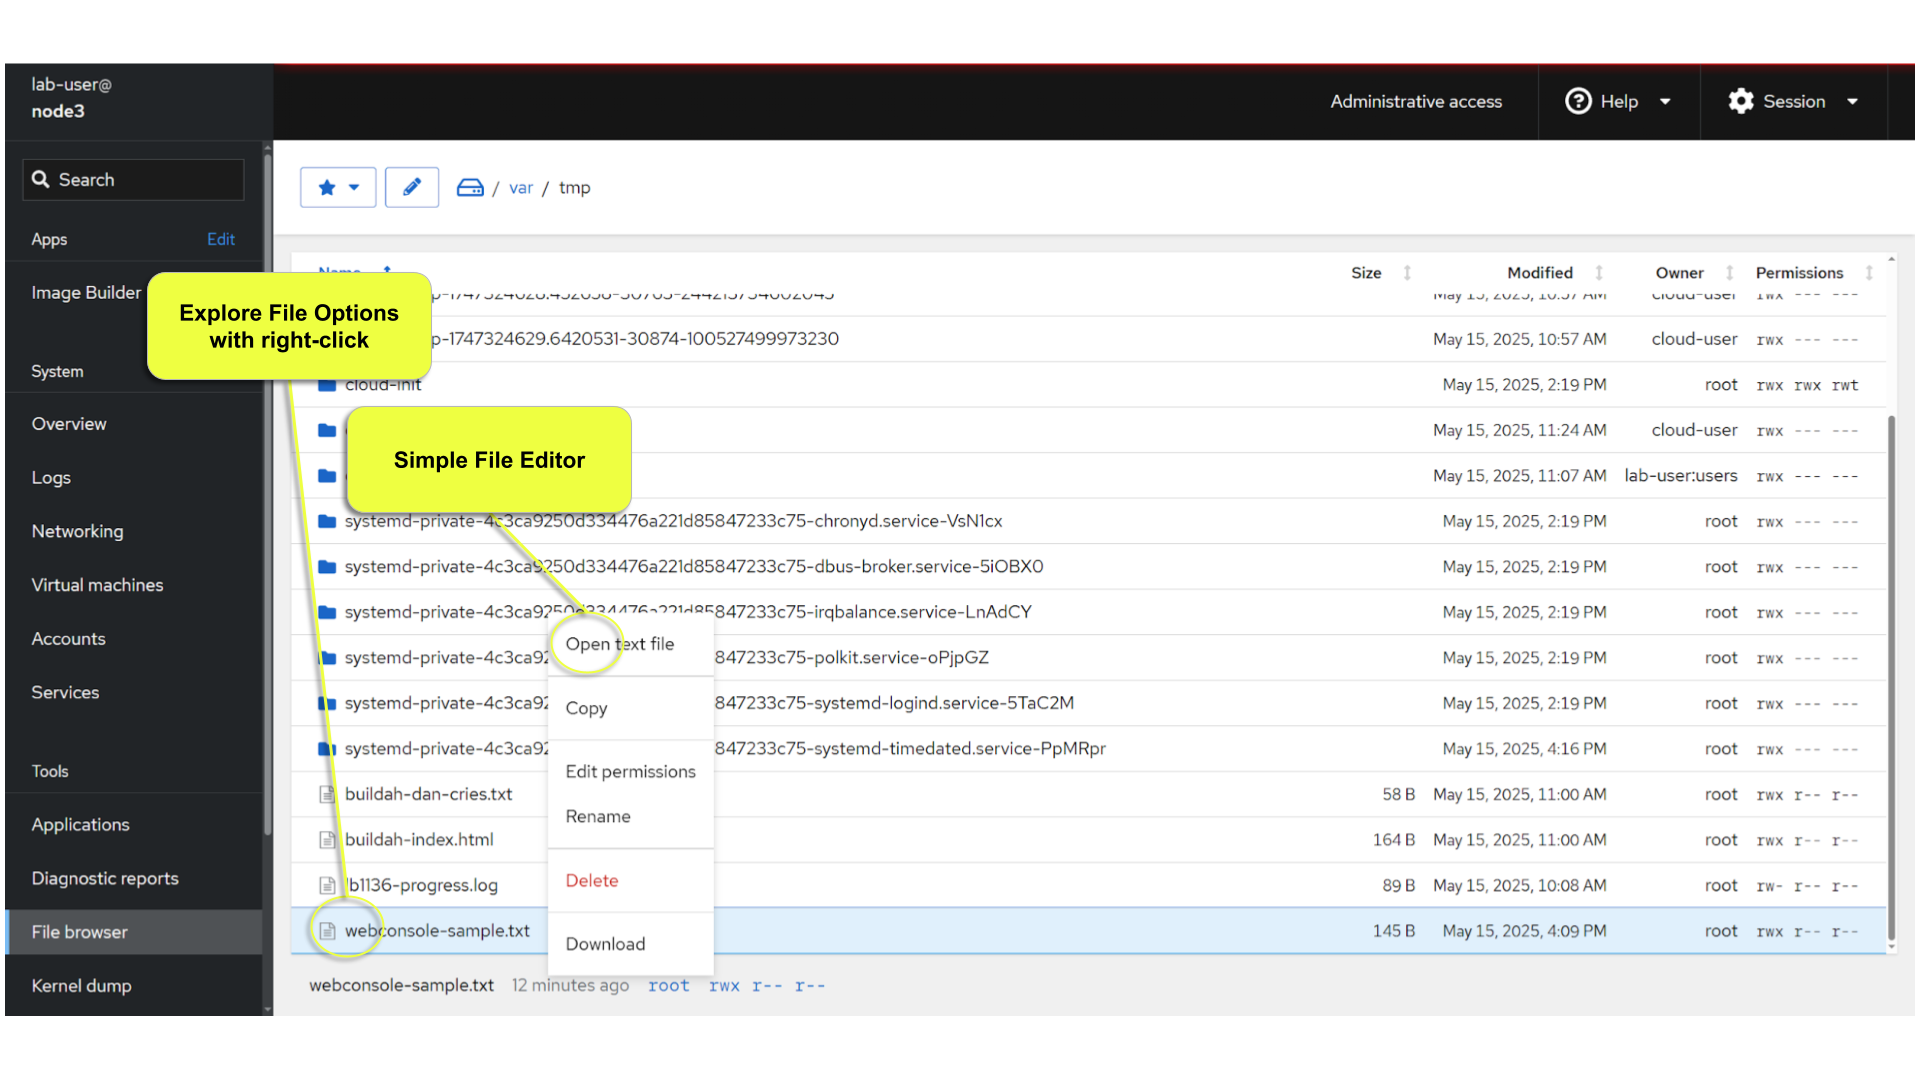
Using a right click, select 'Open Text File' and try editing the provided sample file 'webconsole-sample.txt'.
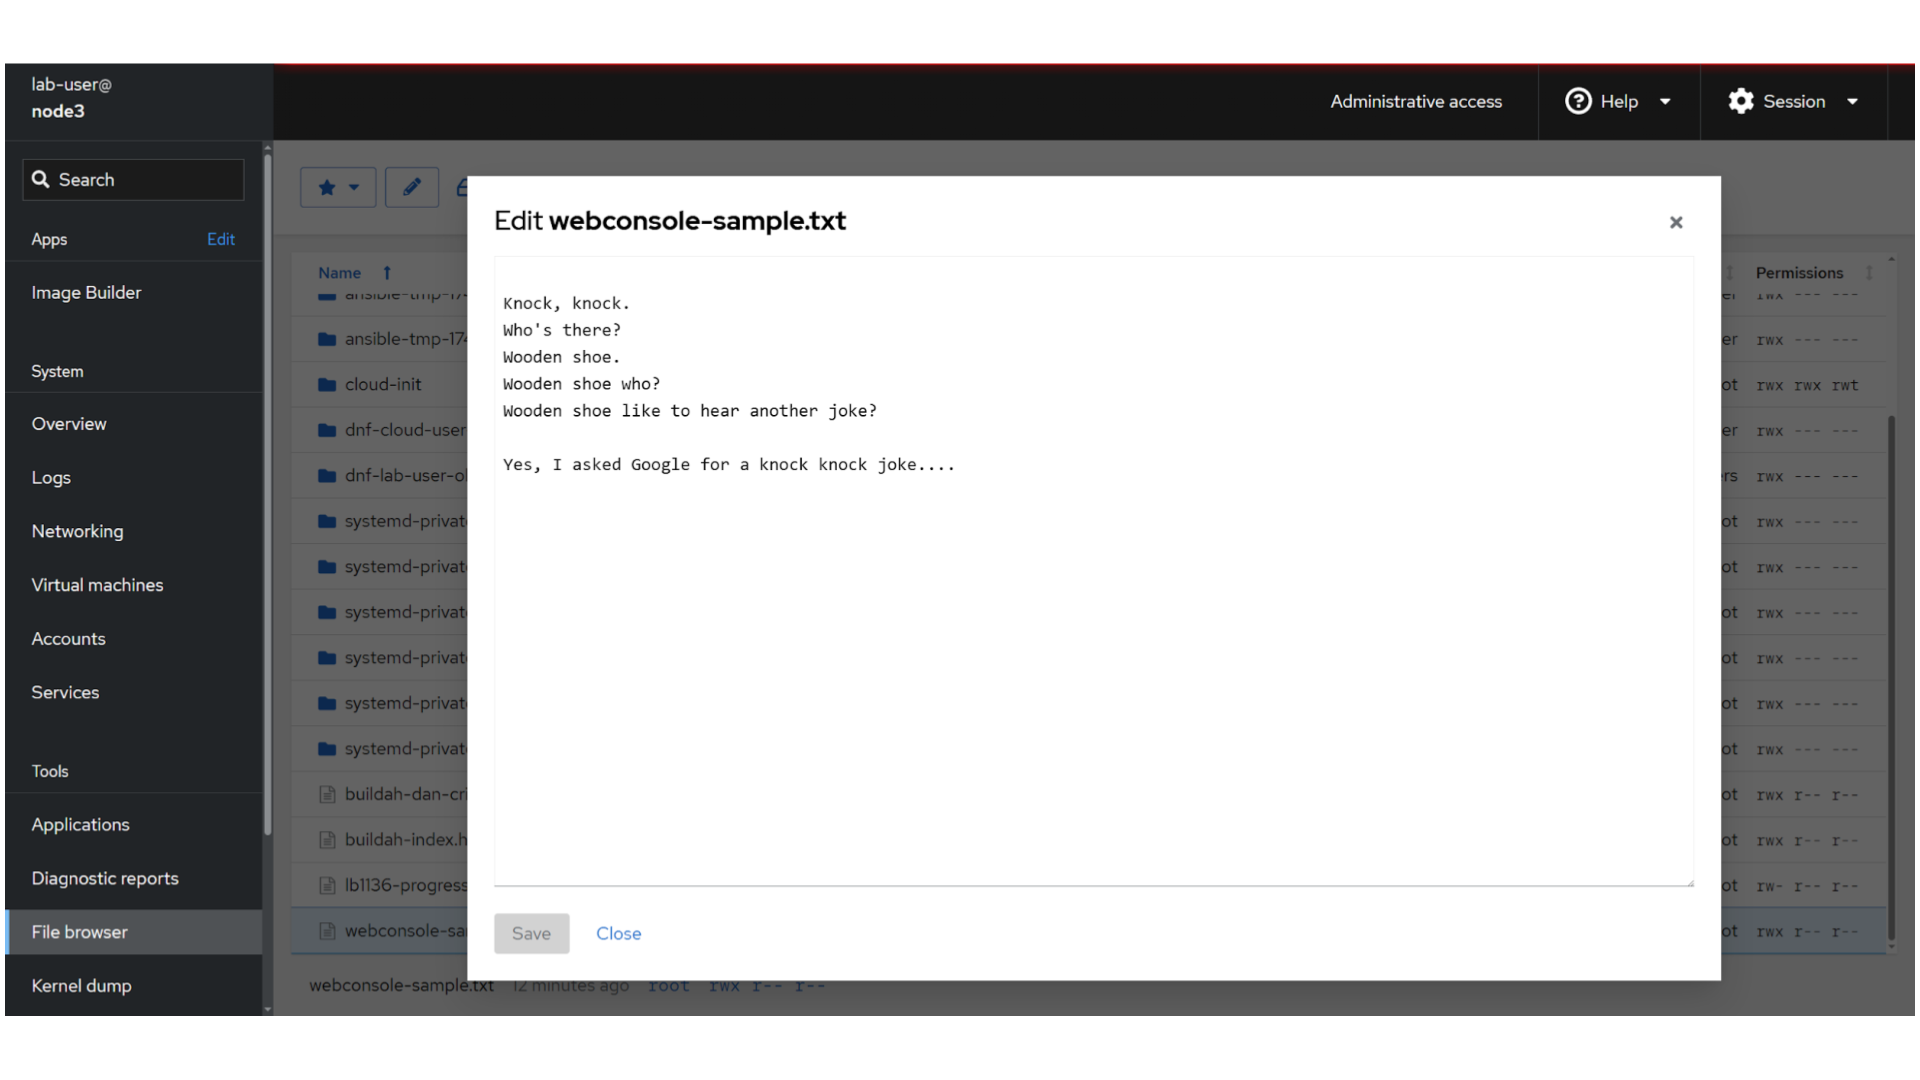
You can 'Save' or just 'Cancel' your changes. Either way, proceed to close the editor dialog.
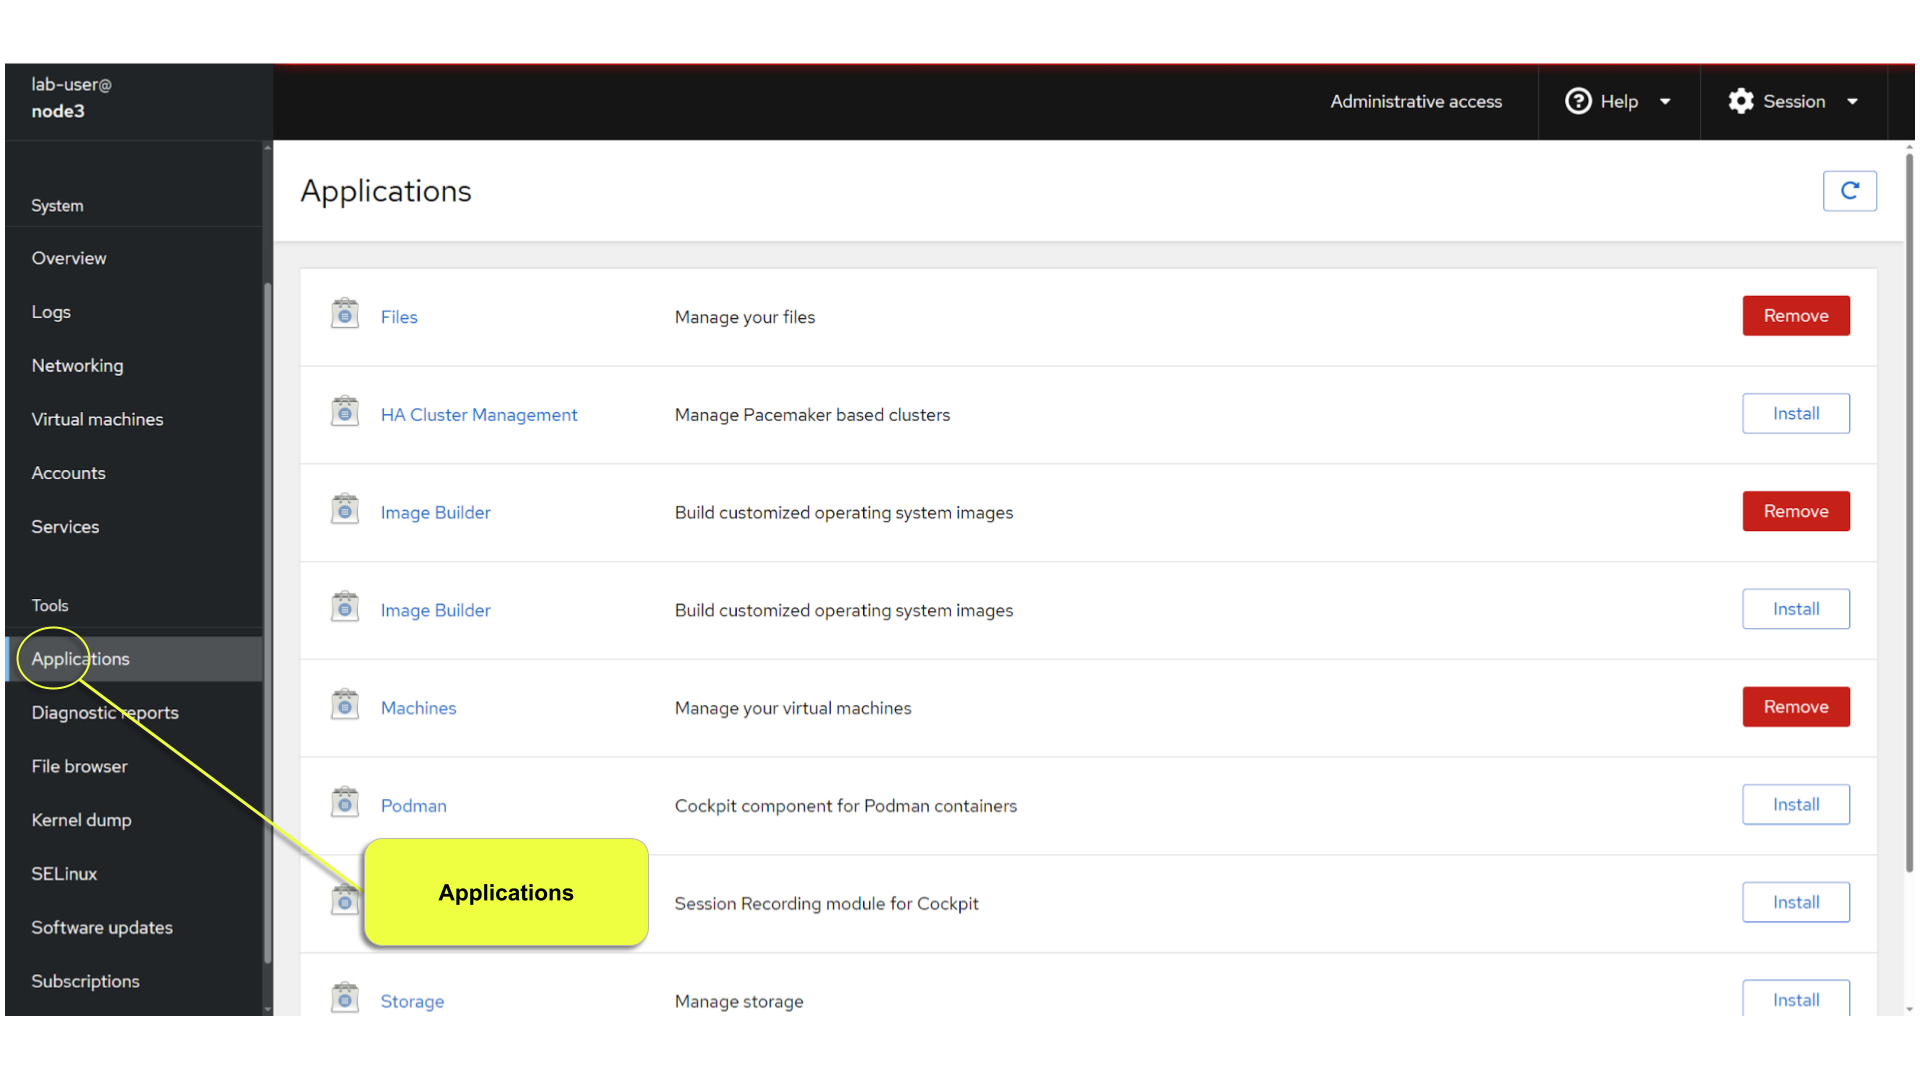
13. Applications
Another new feature of the Web Console is the introduction of "Applications". These are optional modules you can install and enable to extended the capabilities of the web interface. Just take a look and you’ll see some additional capabilities you will take advantge of in later parts of this workshop.
14. Conclusion
This concludes a short exercise with Web Console. Feel free to click through and explore other sections:
-
Under Accounts section, you can manage user accounts
-
Diagnostic Reports allows you to create a sosreport for Red Hat support
-
Under Kernel Dump, you can enable/disable kdump
You will get an opportunity to manager Virtual Machines and Build System Images in later exercises.