Module 1: The Problem Domain
Who you are
You are a senior SRE at Meridian Financial, a financial services firm running hundreds of Ansible Automation Platform jobs per week across hybrid VM and OpenShift infrastructure.
Overnight job failures are piling up, compliance deadlines are looming, and the on-call team is stretched thin. The gap between a failure occurring and a human investigating it is where MTTR accumulates — and where an AI-powered assistant can add immediate value.
Your mission in this workshop: build and evolve an AI-driven incident response assistant that can triage, investigate, and help resolve infrastructure failures — so your team can focus on what matters.
Explore AAP2 — Ansible Automation Platform
In the AAP2 tab (log in with user-12345 / deeper-agents if prompted)
This is where Meridian Financial’s automation runs — and where failures originate. Your AI assistant will receive webhooks from AAP2 whenever a job fails.
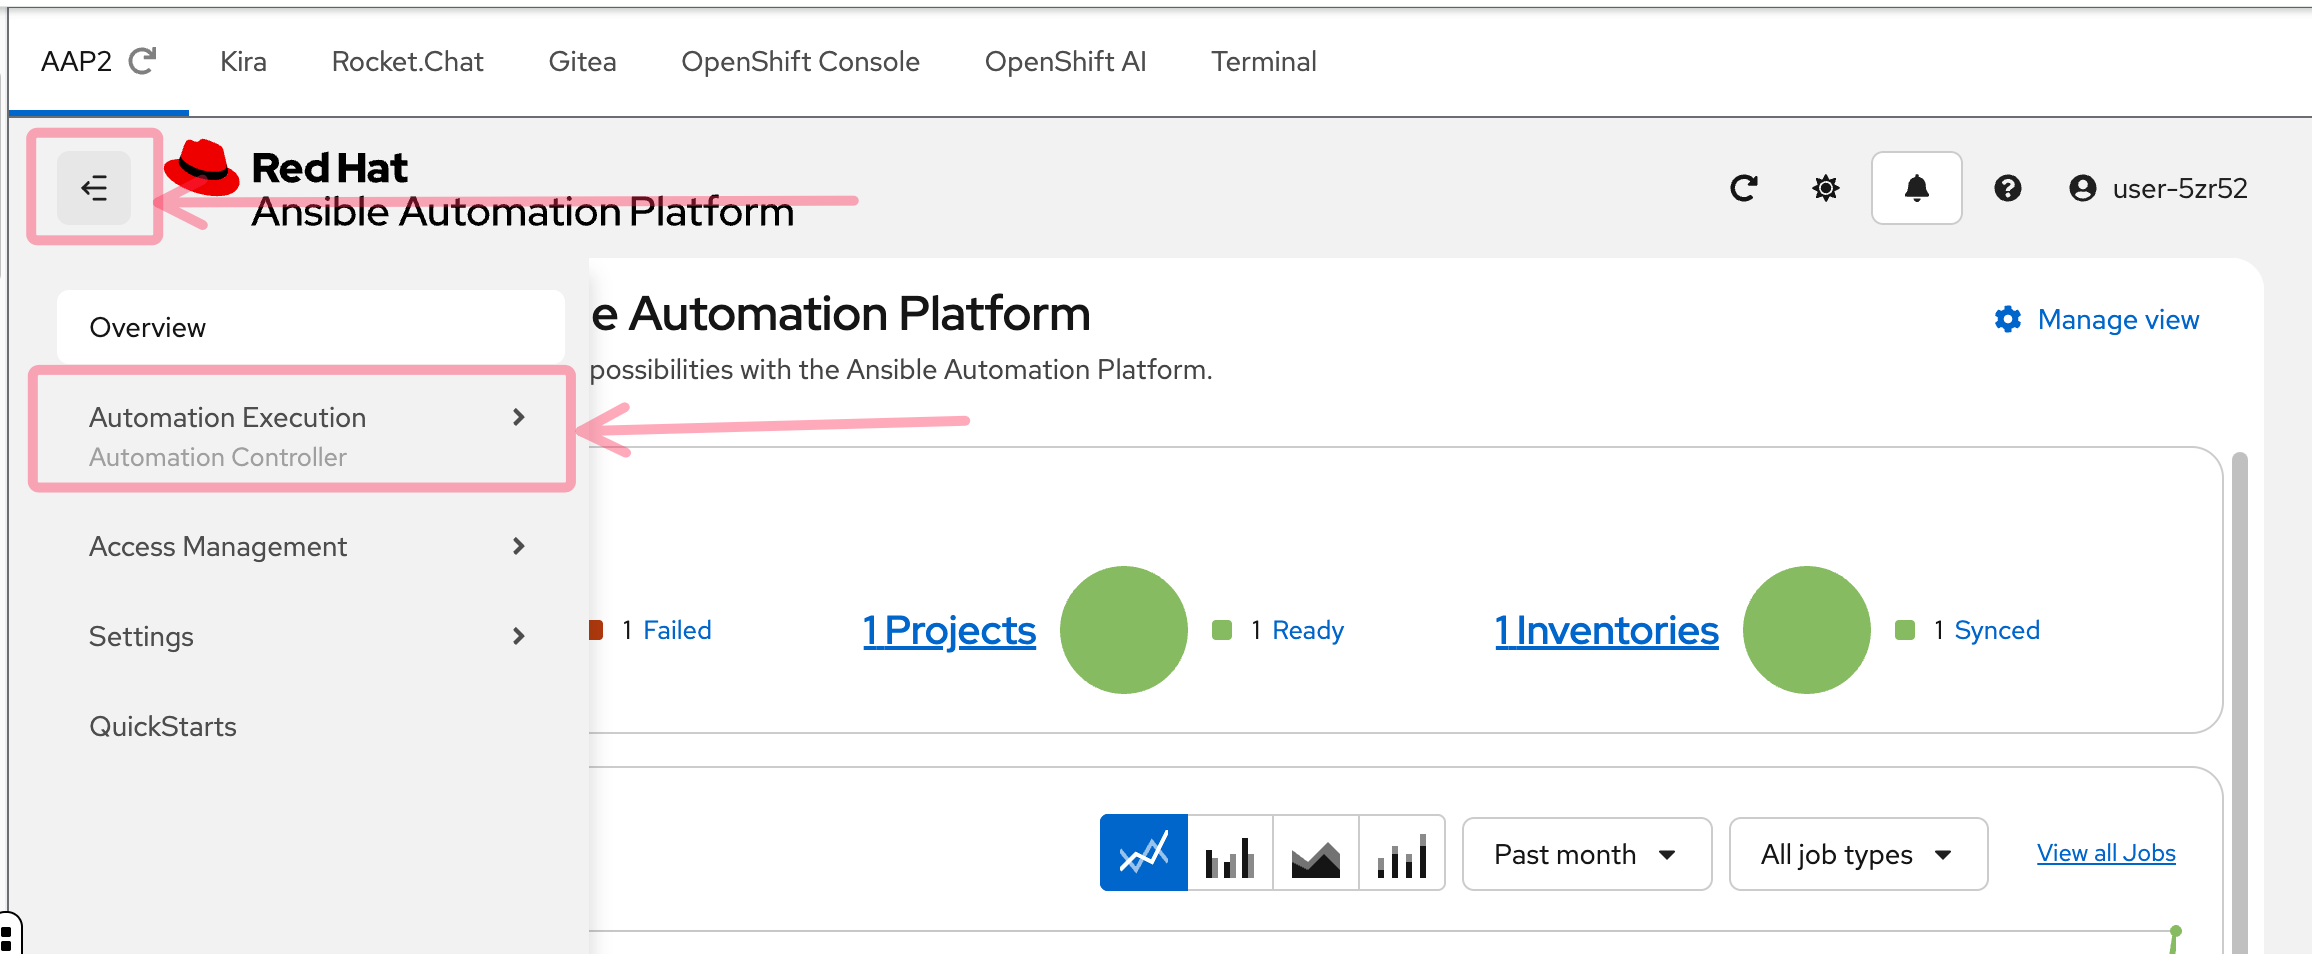
Step 1: Open the sidebar
After logging in, you’ll see the AAP2 dashboard. If the left sidebar is collapsed, click the hamburger menu (three horizontal lines) in the top left to expand it. Then click Automation Execution to reveal the navigation options.
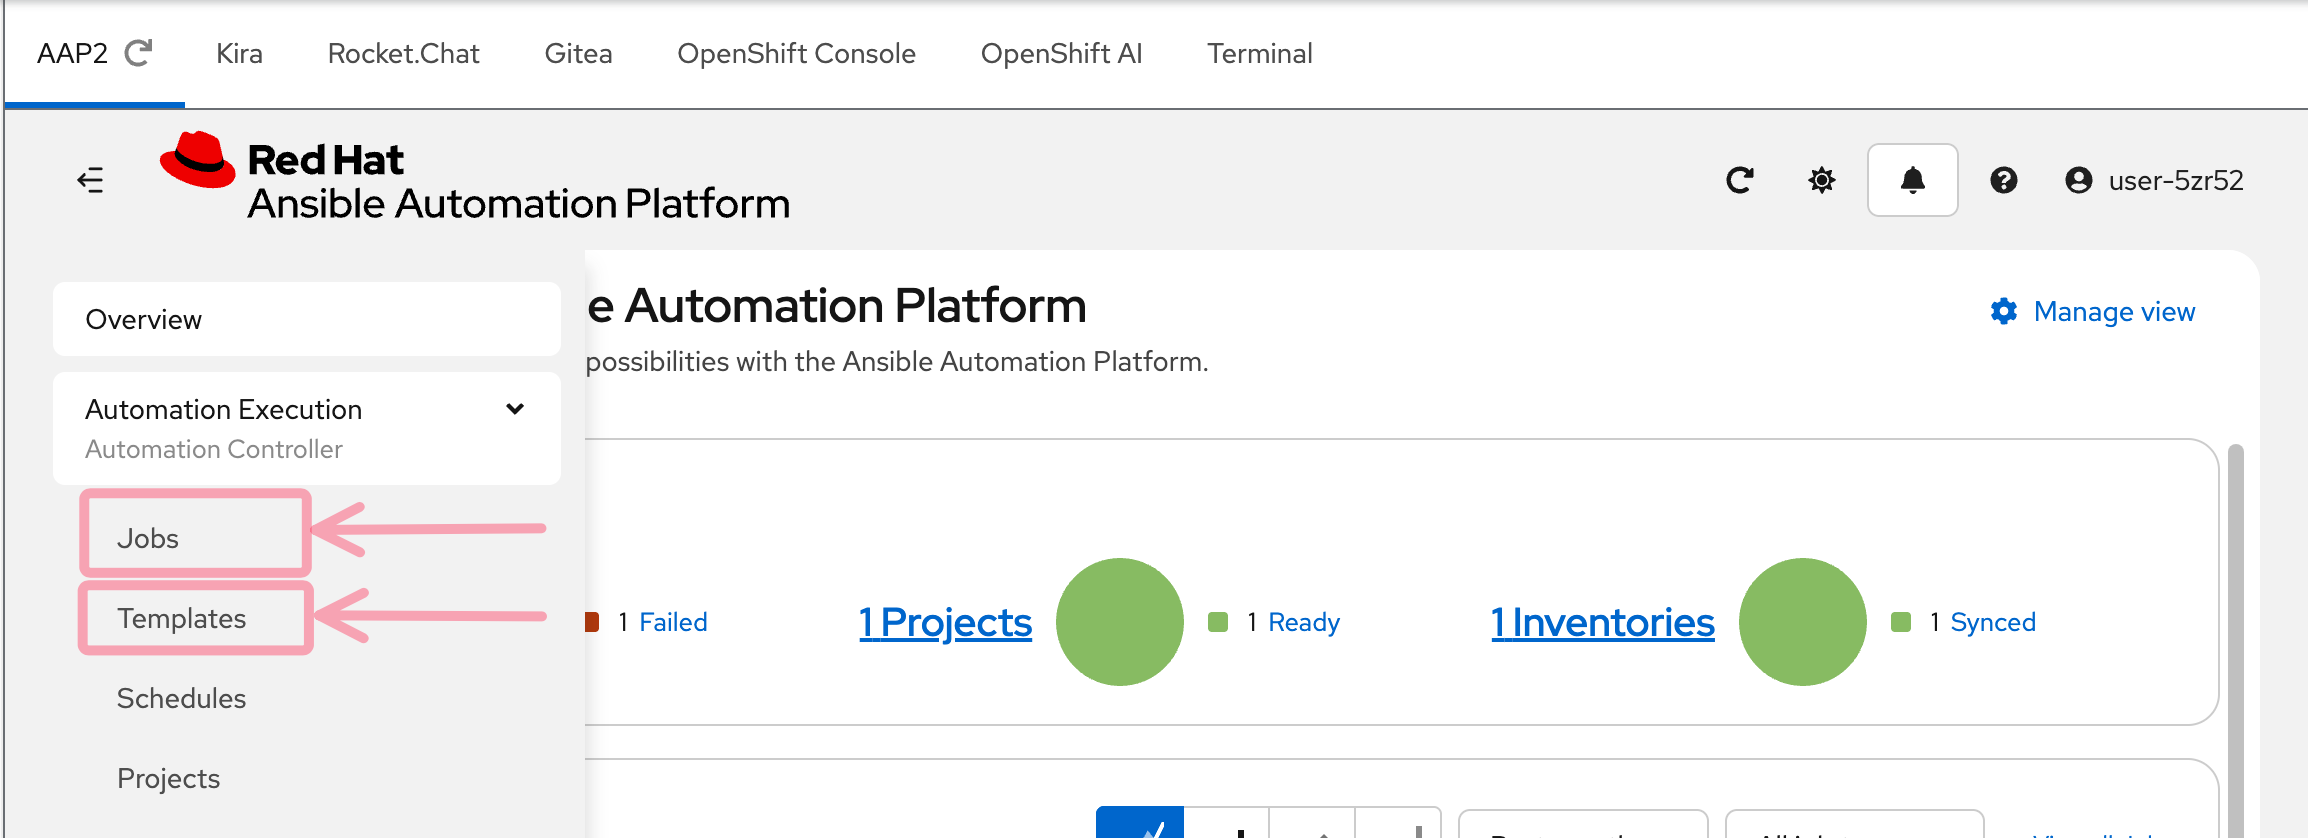
Step 2: Find Jobs and Templates
With the Automation Execution section expanded, you’ll see two key menu items:
-
Jobs — the execution history of every job that has run
-
Templates — the job templates that define what automation can be launched
These are the two screens you’ll use most in this workshop.
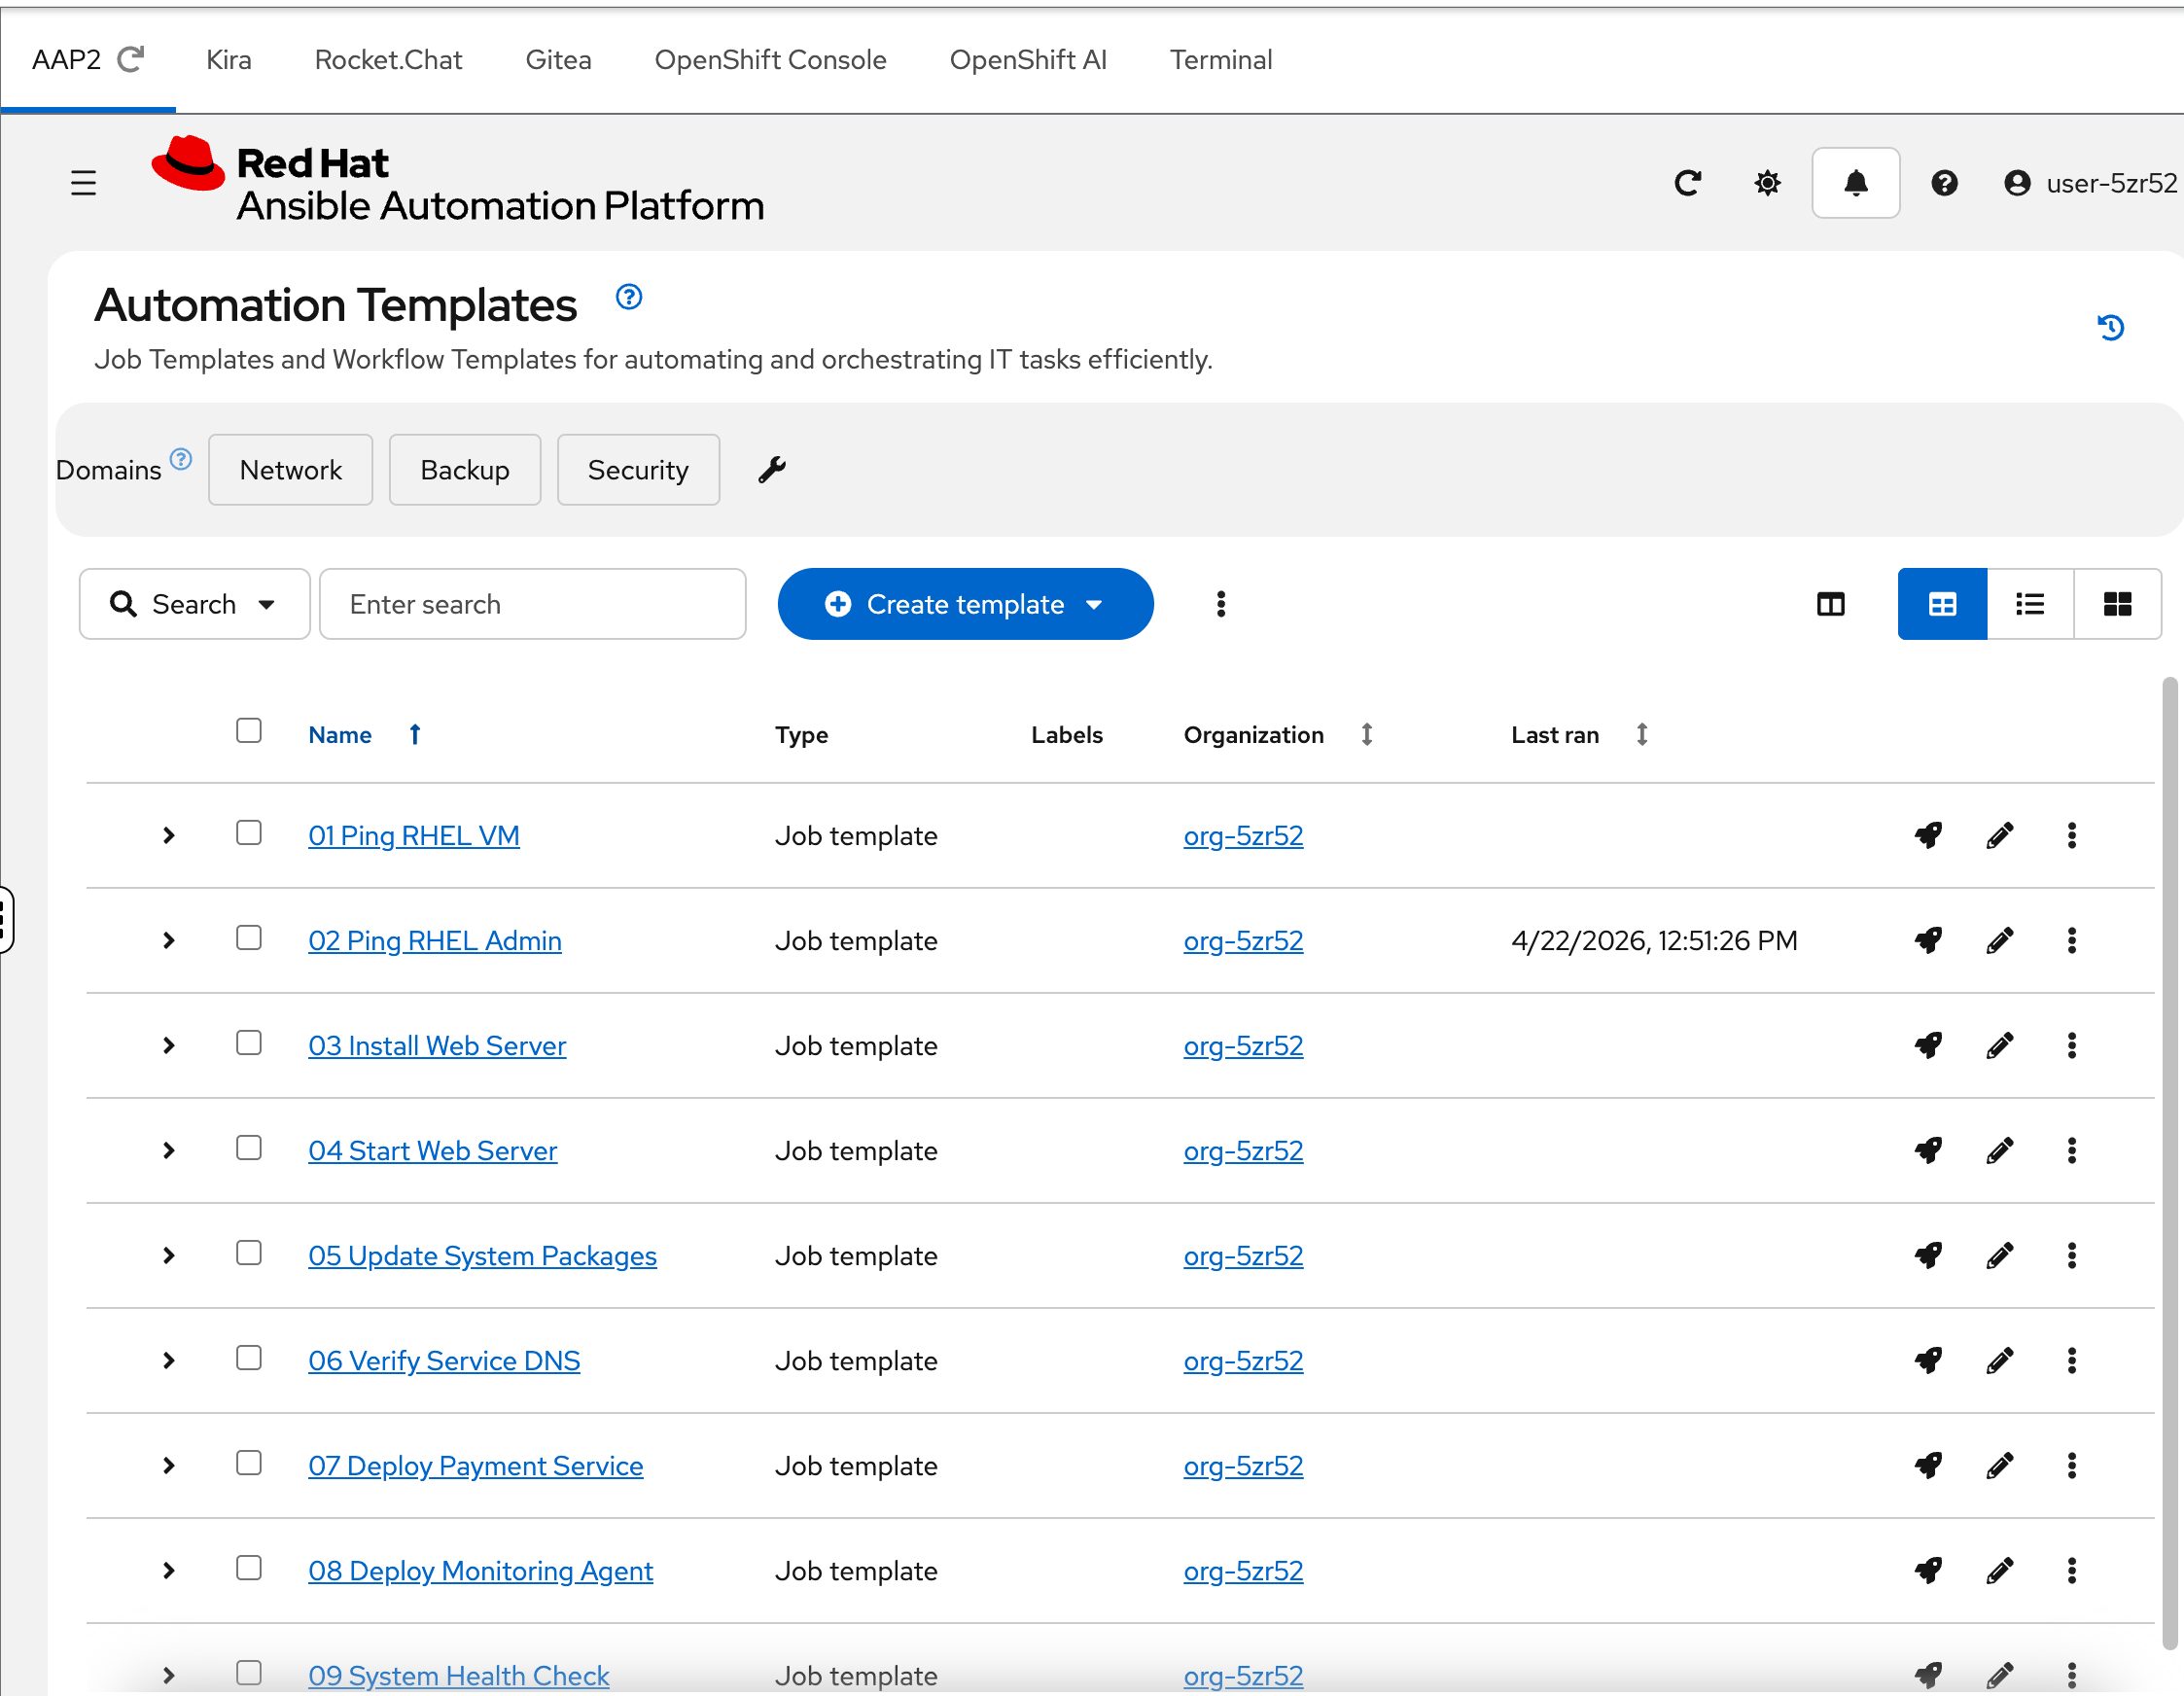
Step 3: Explore Job Templates
Click Templates in the sidebar.
You’ll see 10 numbered job templates — 01 Ping RHEL VM through 10 Install Python 3.14. These represent the day-to-day automation that Meridian’s SRE team runs against their infrastructure: health checks, package updates, application deployments, and compliance scans.
Each template is wired to a playbook in Gitea. Some will succeed. Some will fail in specific, diagnosable ways — and those failures are what your AI assistant needs to handle.
Notice the ordering — they progress from simple (a basic ping) to complex (a health check using a custom execution environment). You’ll work through these failures throughout the workshop.
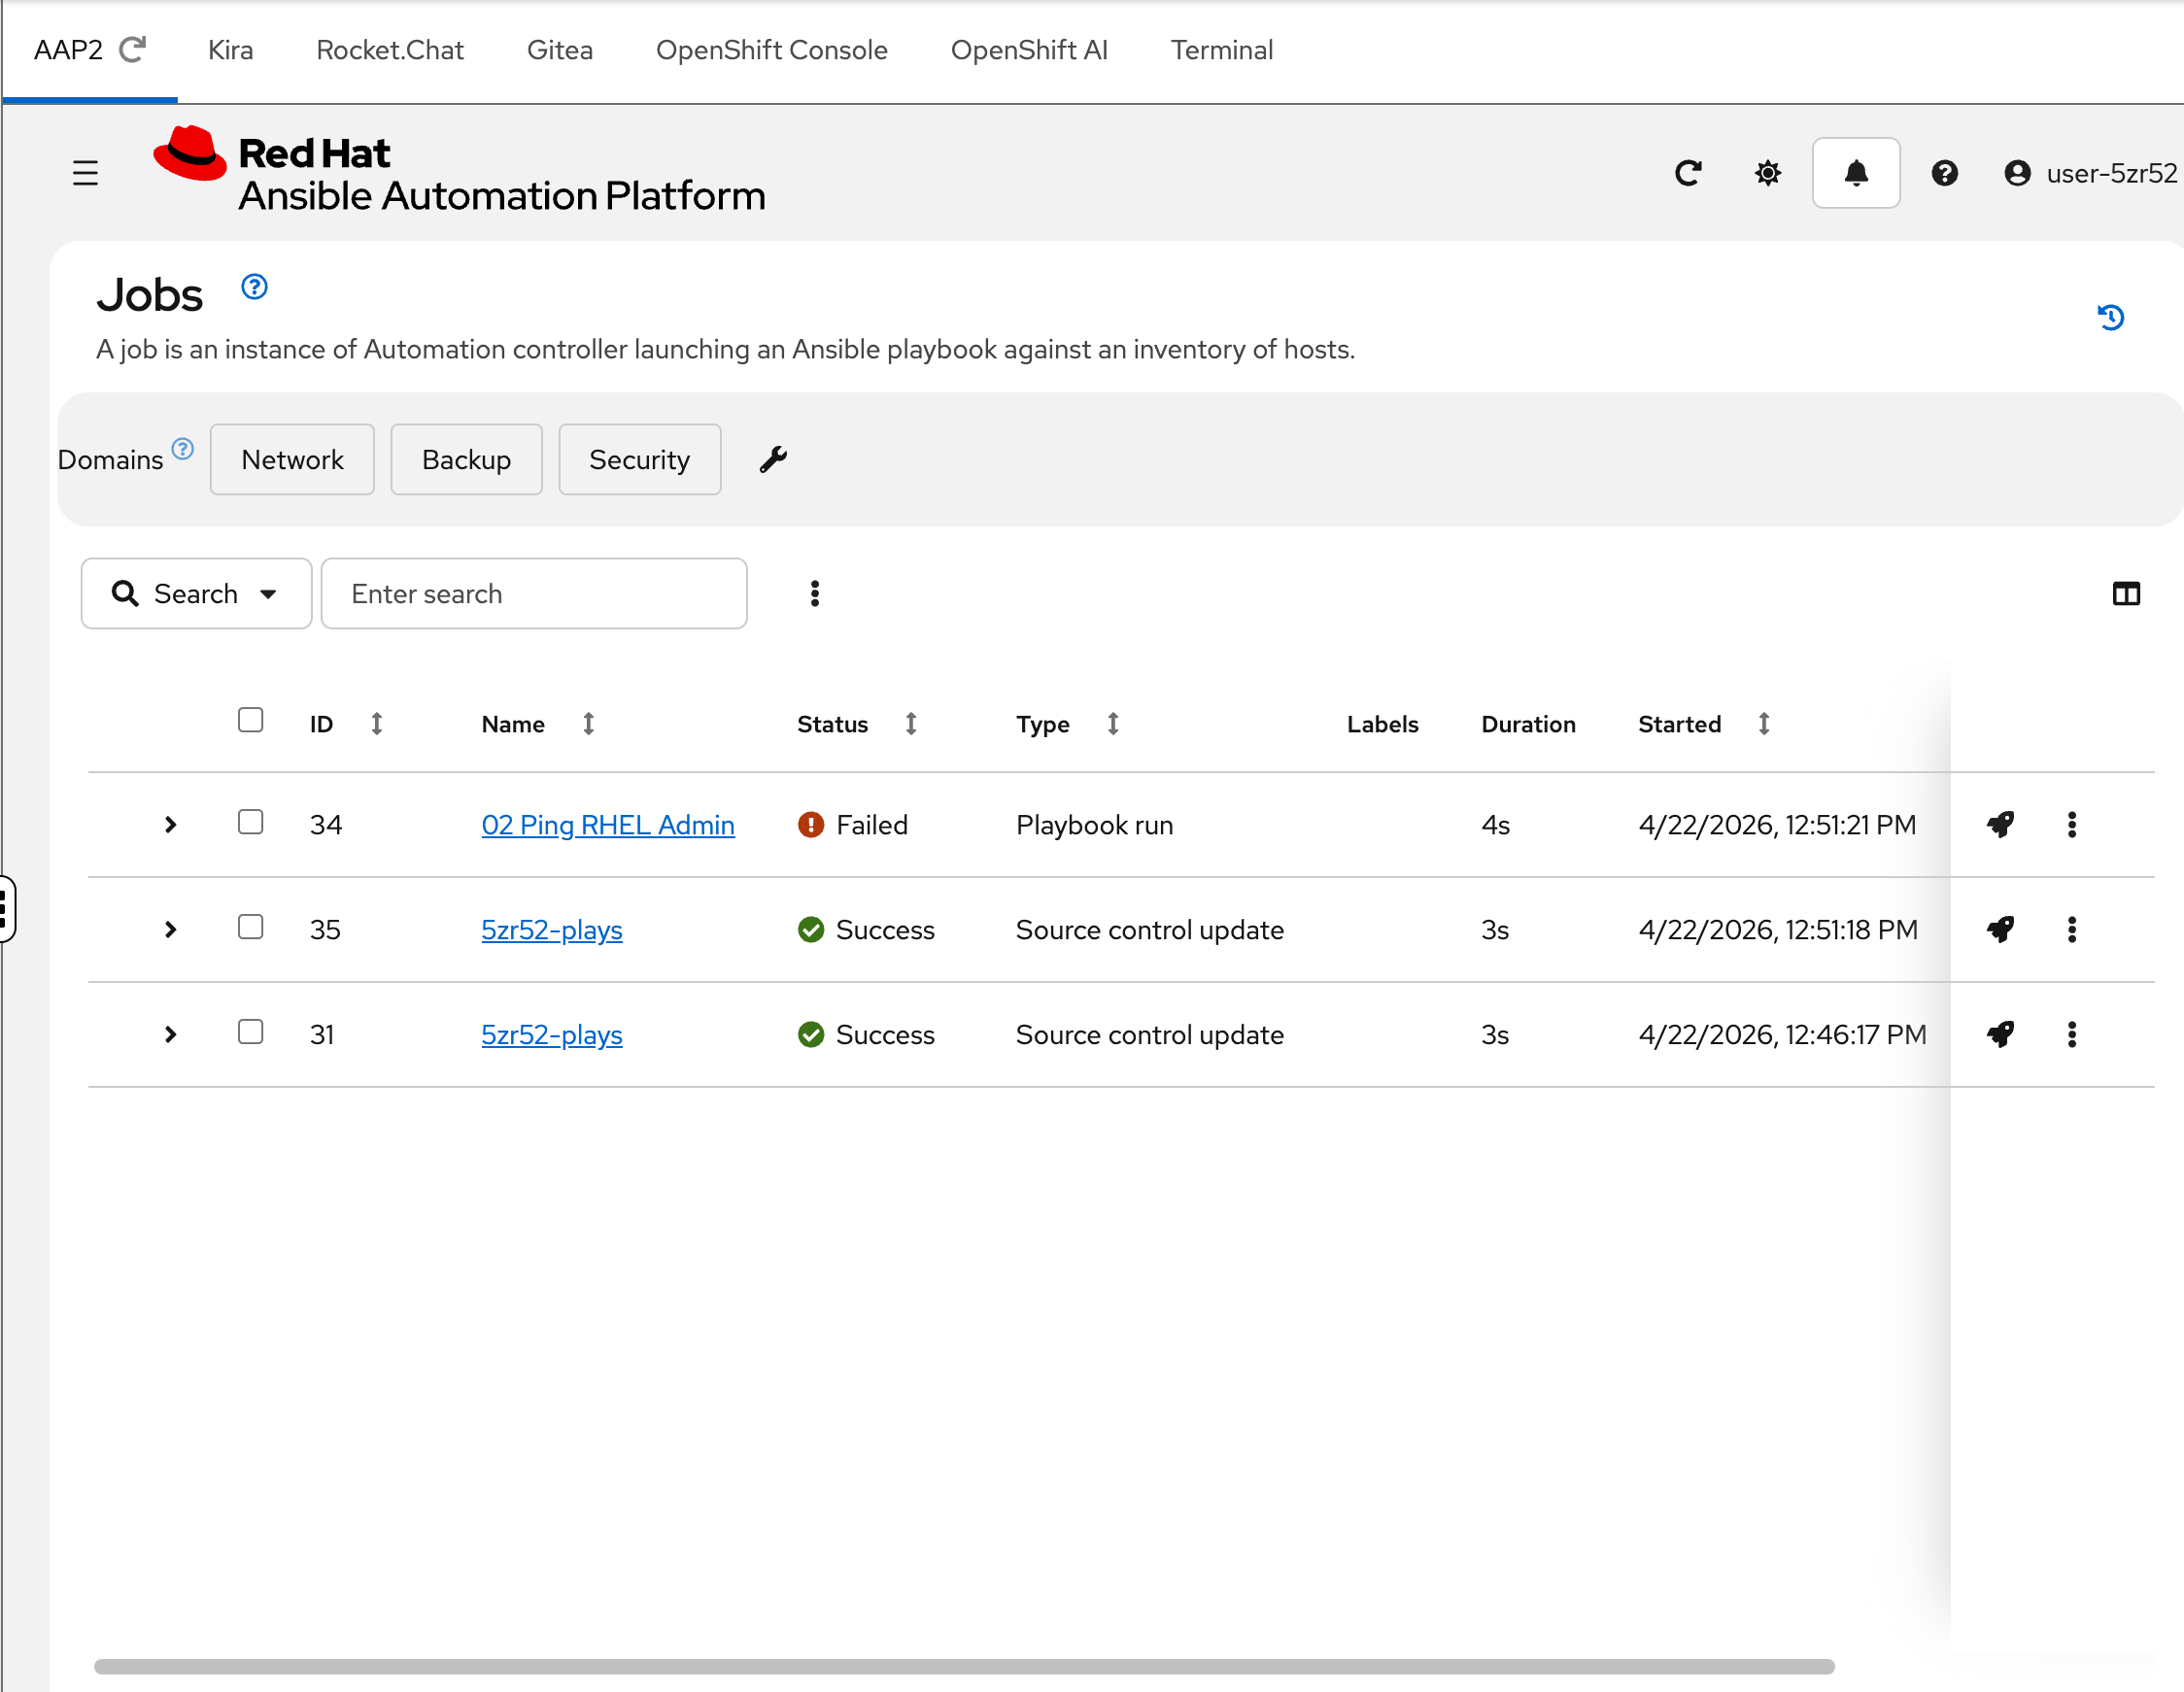
Step 4: Check the Jobs history
Click Jobs in the sidebar.
This is the execution history — every time a job template runs, it appears here. Notice that one job has already failed (shown with a red "Failed" status). This is not an accident — the environment automatically ran a job during provisioning so you’d have something to investigate.
That failed job triggered a chain of events that you’re about to trace through Kira and Rocket.Chat.
Explore Kira — Trouble Ticketing
In the Kira tab (log in with user-12345 / deeper-agents if prompted)
Kira is the ticketing system where your AI assistant creates structured incident tickets. Think of it as a purpose-built Jira for infrastructure operations.
| The AI agent uses a conservative "temperature" setting optimized for the deterministic behavior desired in AIOps. Your ticket content may differ slightly from the screenshots — this is expected. |
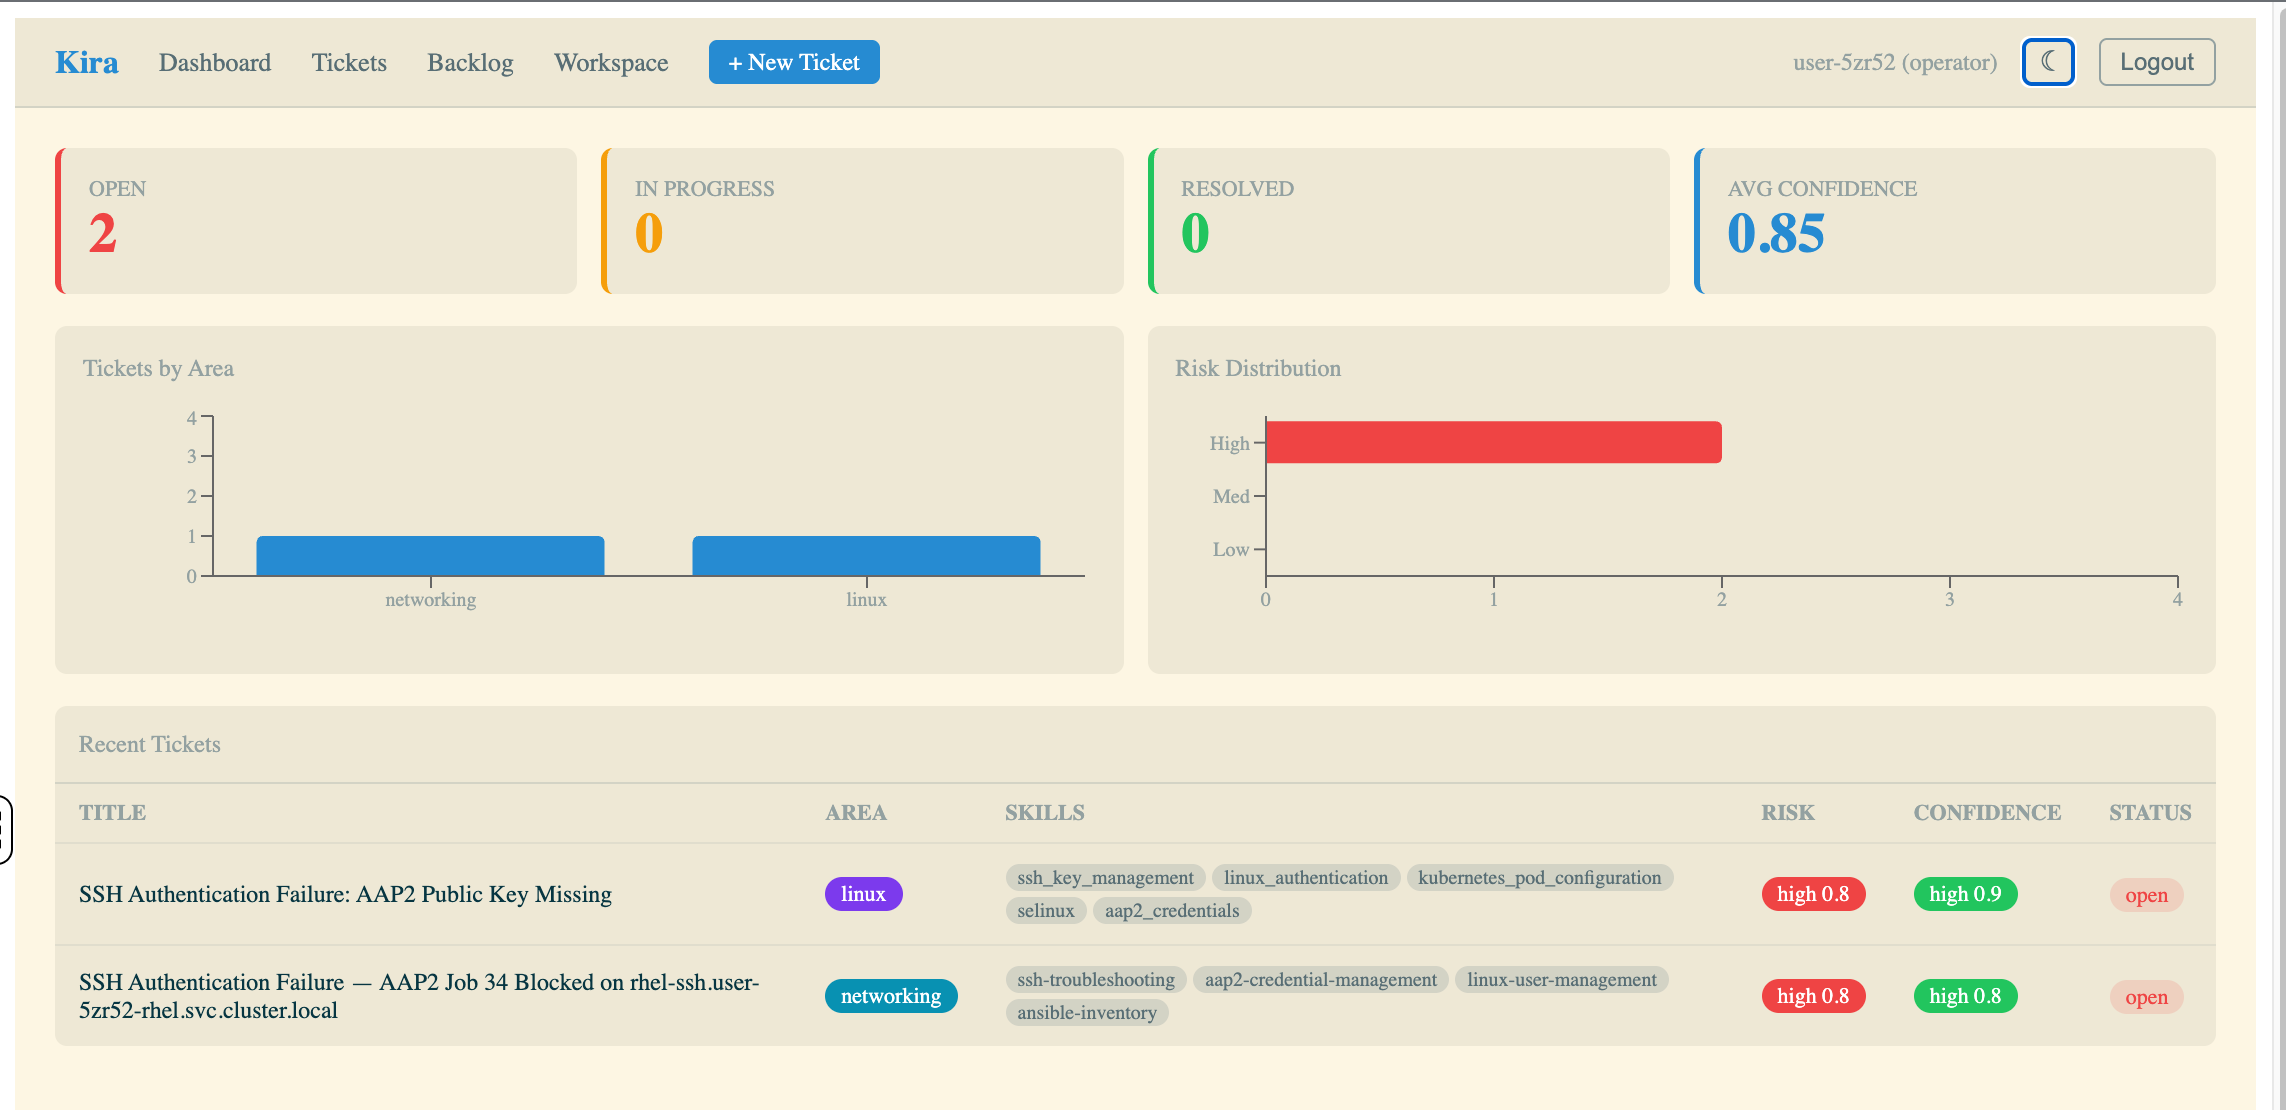
Step 1: Review the Dashboard
The dashboard gives you the operational overview at a glance:
-
Open / In Progress / Resolved — ticket lifecycle counts
-
Avg Confidence — how confident the agent is across all analyses
-
Tickets by Area — categorized by domain (linux, kubernetes, networking, application)
-
Risk Distribution — how severe the AI agent assessed each failure to be
-
Recent Tickets — the latest tickets with title, area, skills, risk, confidence, and status
You should see at least one open ticket from the seed job that ran during provisioning.
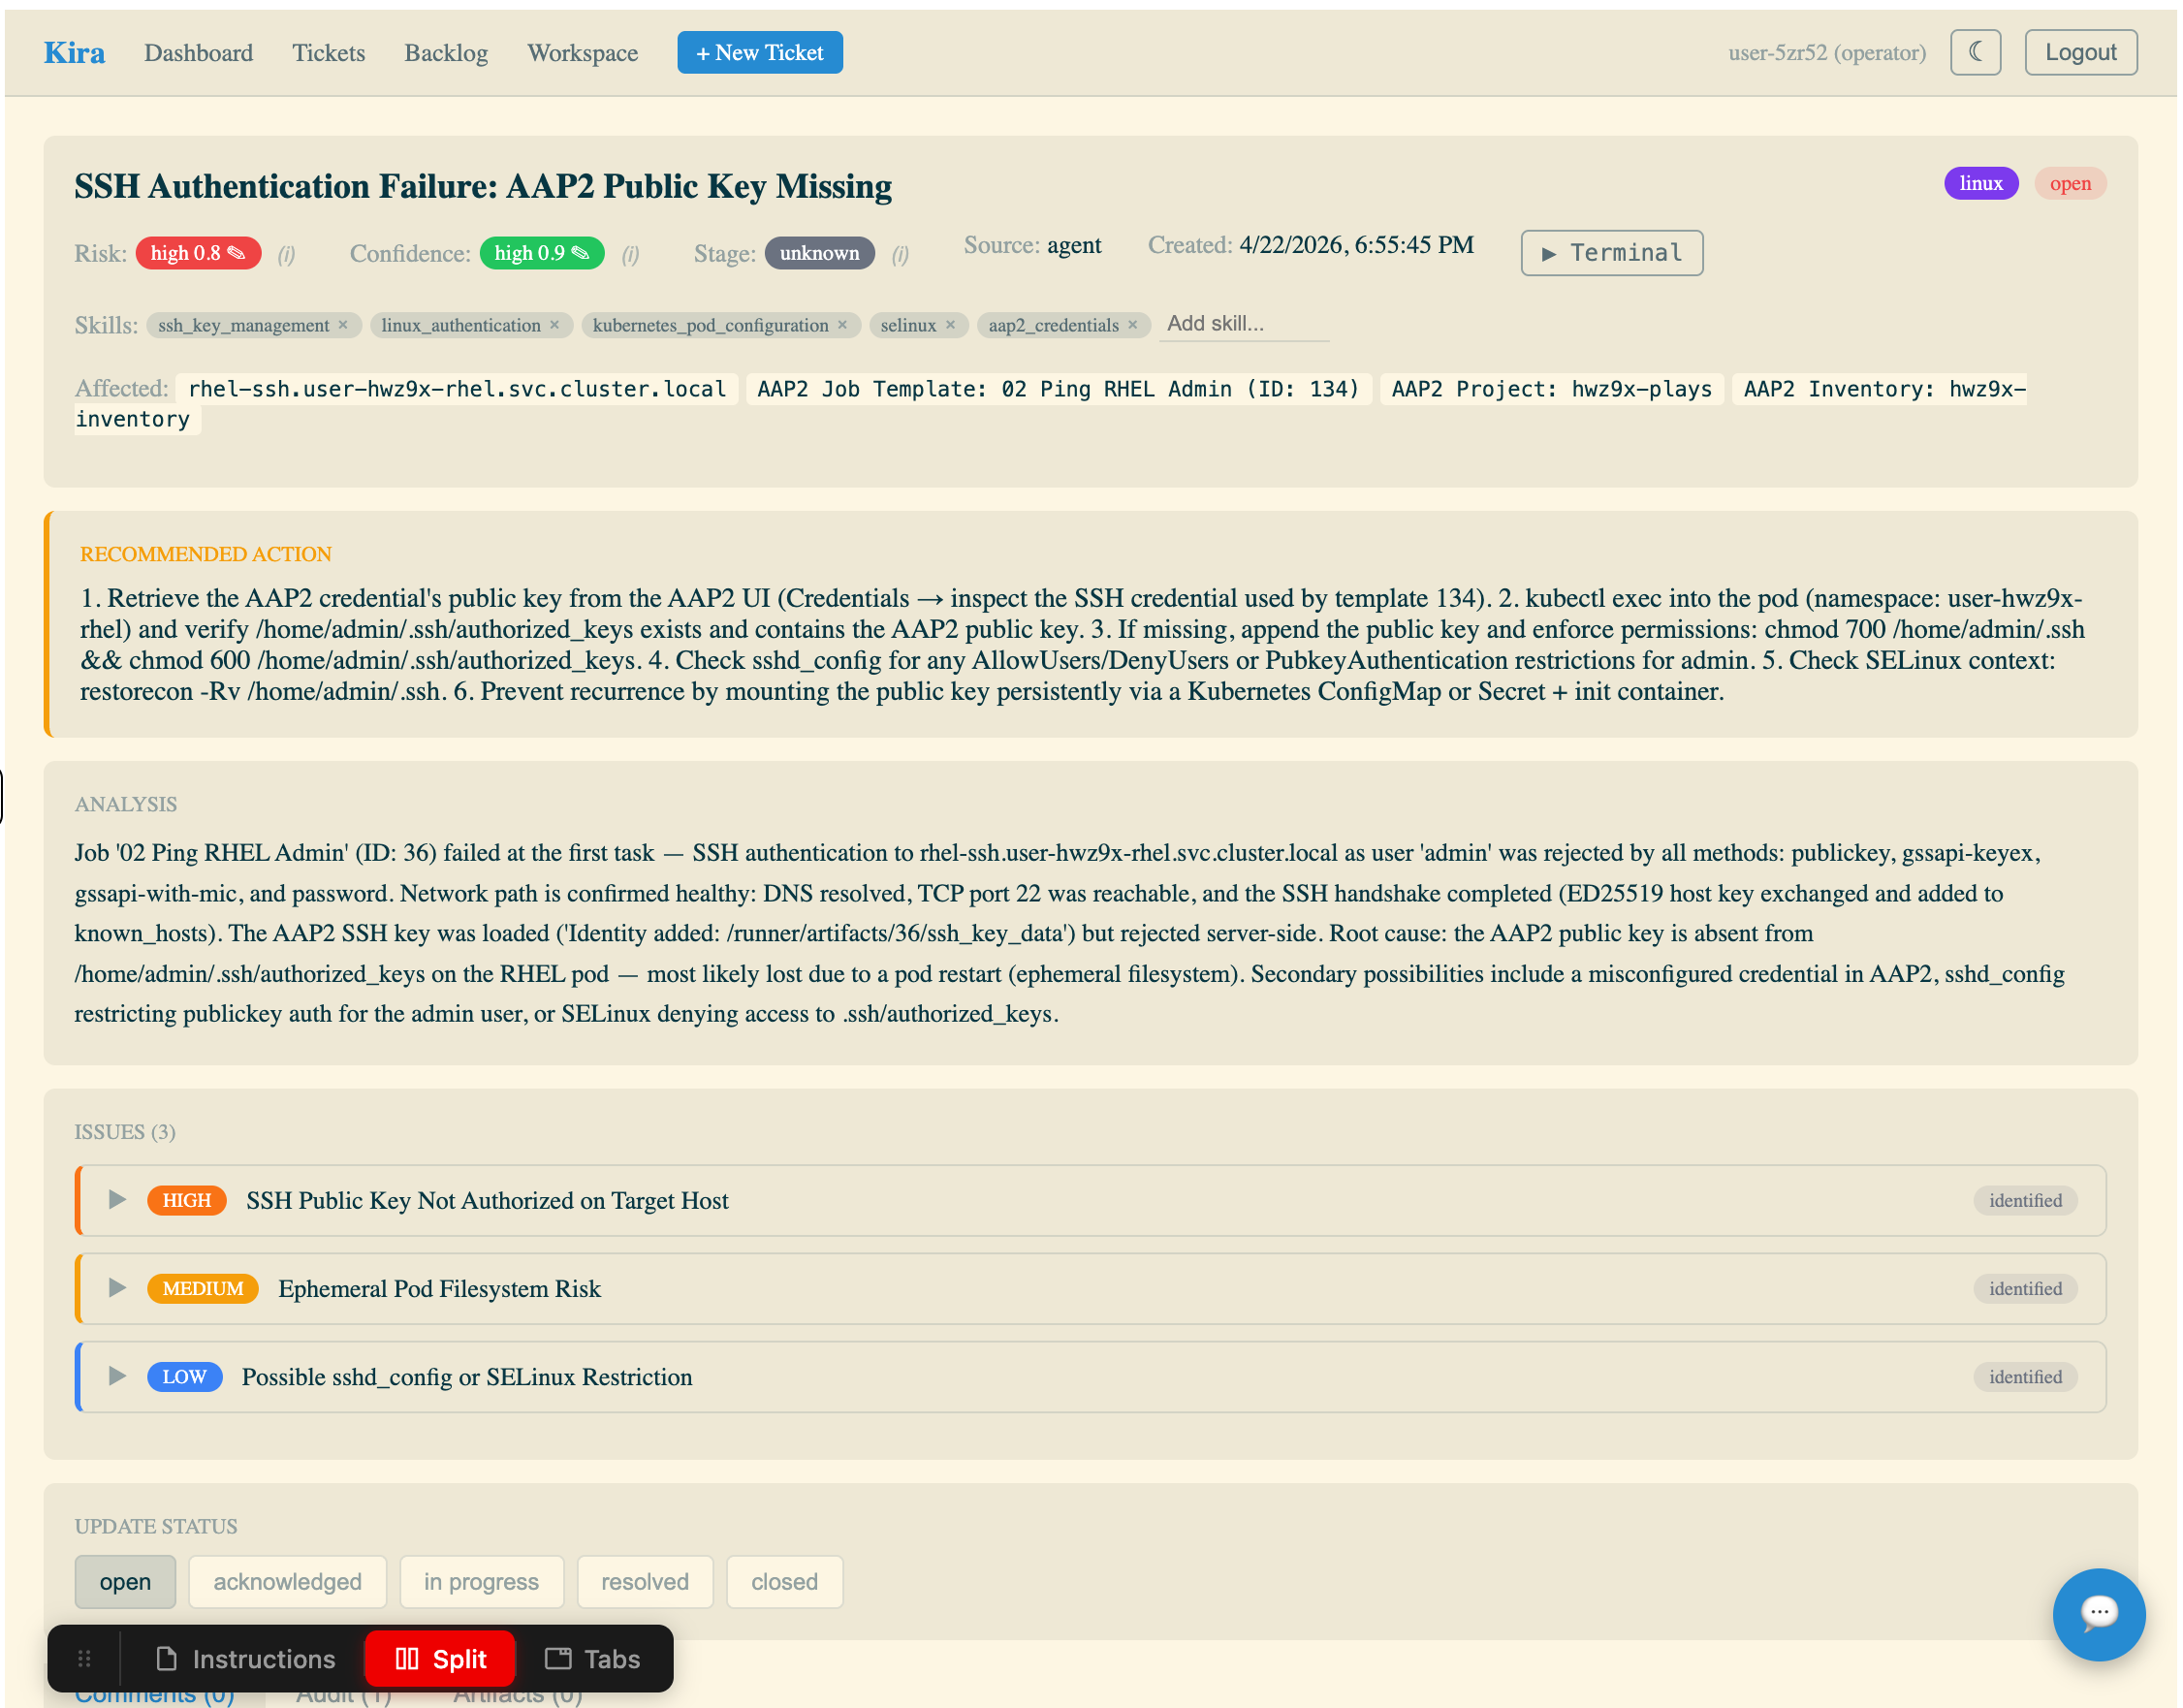
Step 2: Open a ticket
Click into an open ticket in the Recent Tickets table.
This ticket was created automatically by the Athena AI agent running in your namespace. Examine the fields:
-
Title — a human-readable summary of the failure
-
Risk / Confidence / Stage — the agent’s assessment of severity, certainty, and environment
-
Skills — the expertise areas the agent identified as relevant
-
Affected systems — specific hosts or services involved
-
Recommended Action — numbered steps to fix the issue
-
Analysis — the agent’s root cause analysis with evidence from the job output
-
Issues — sub-issues broken down by severity (high, medium, low)
This is what an AI-generated incident ticket looks like. Your job in this workshop is to understand how it got here — and how to make it better.
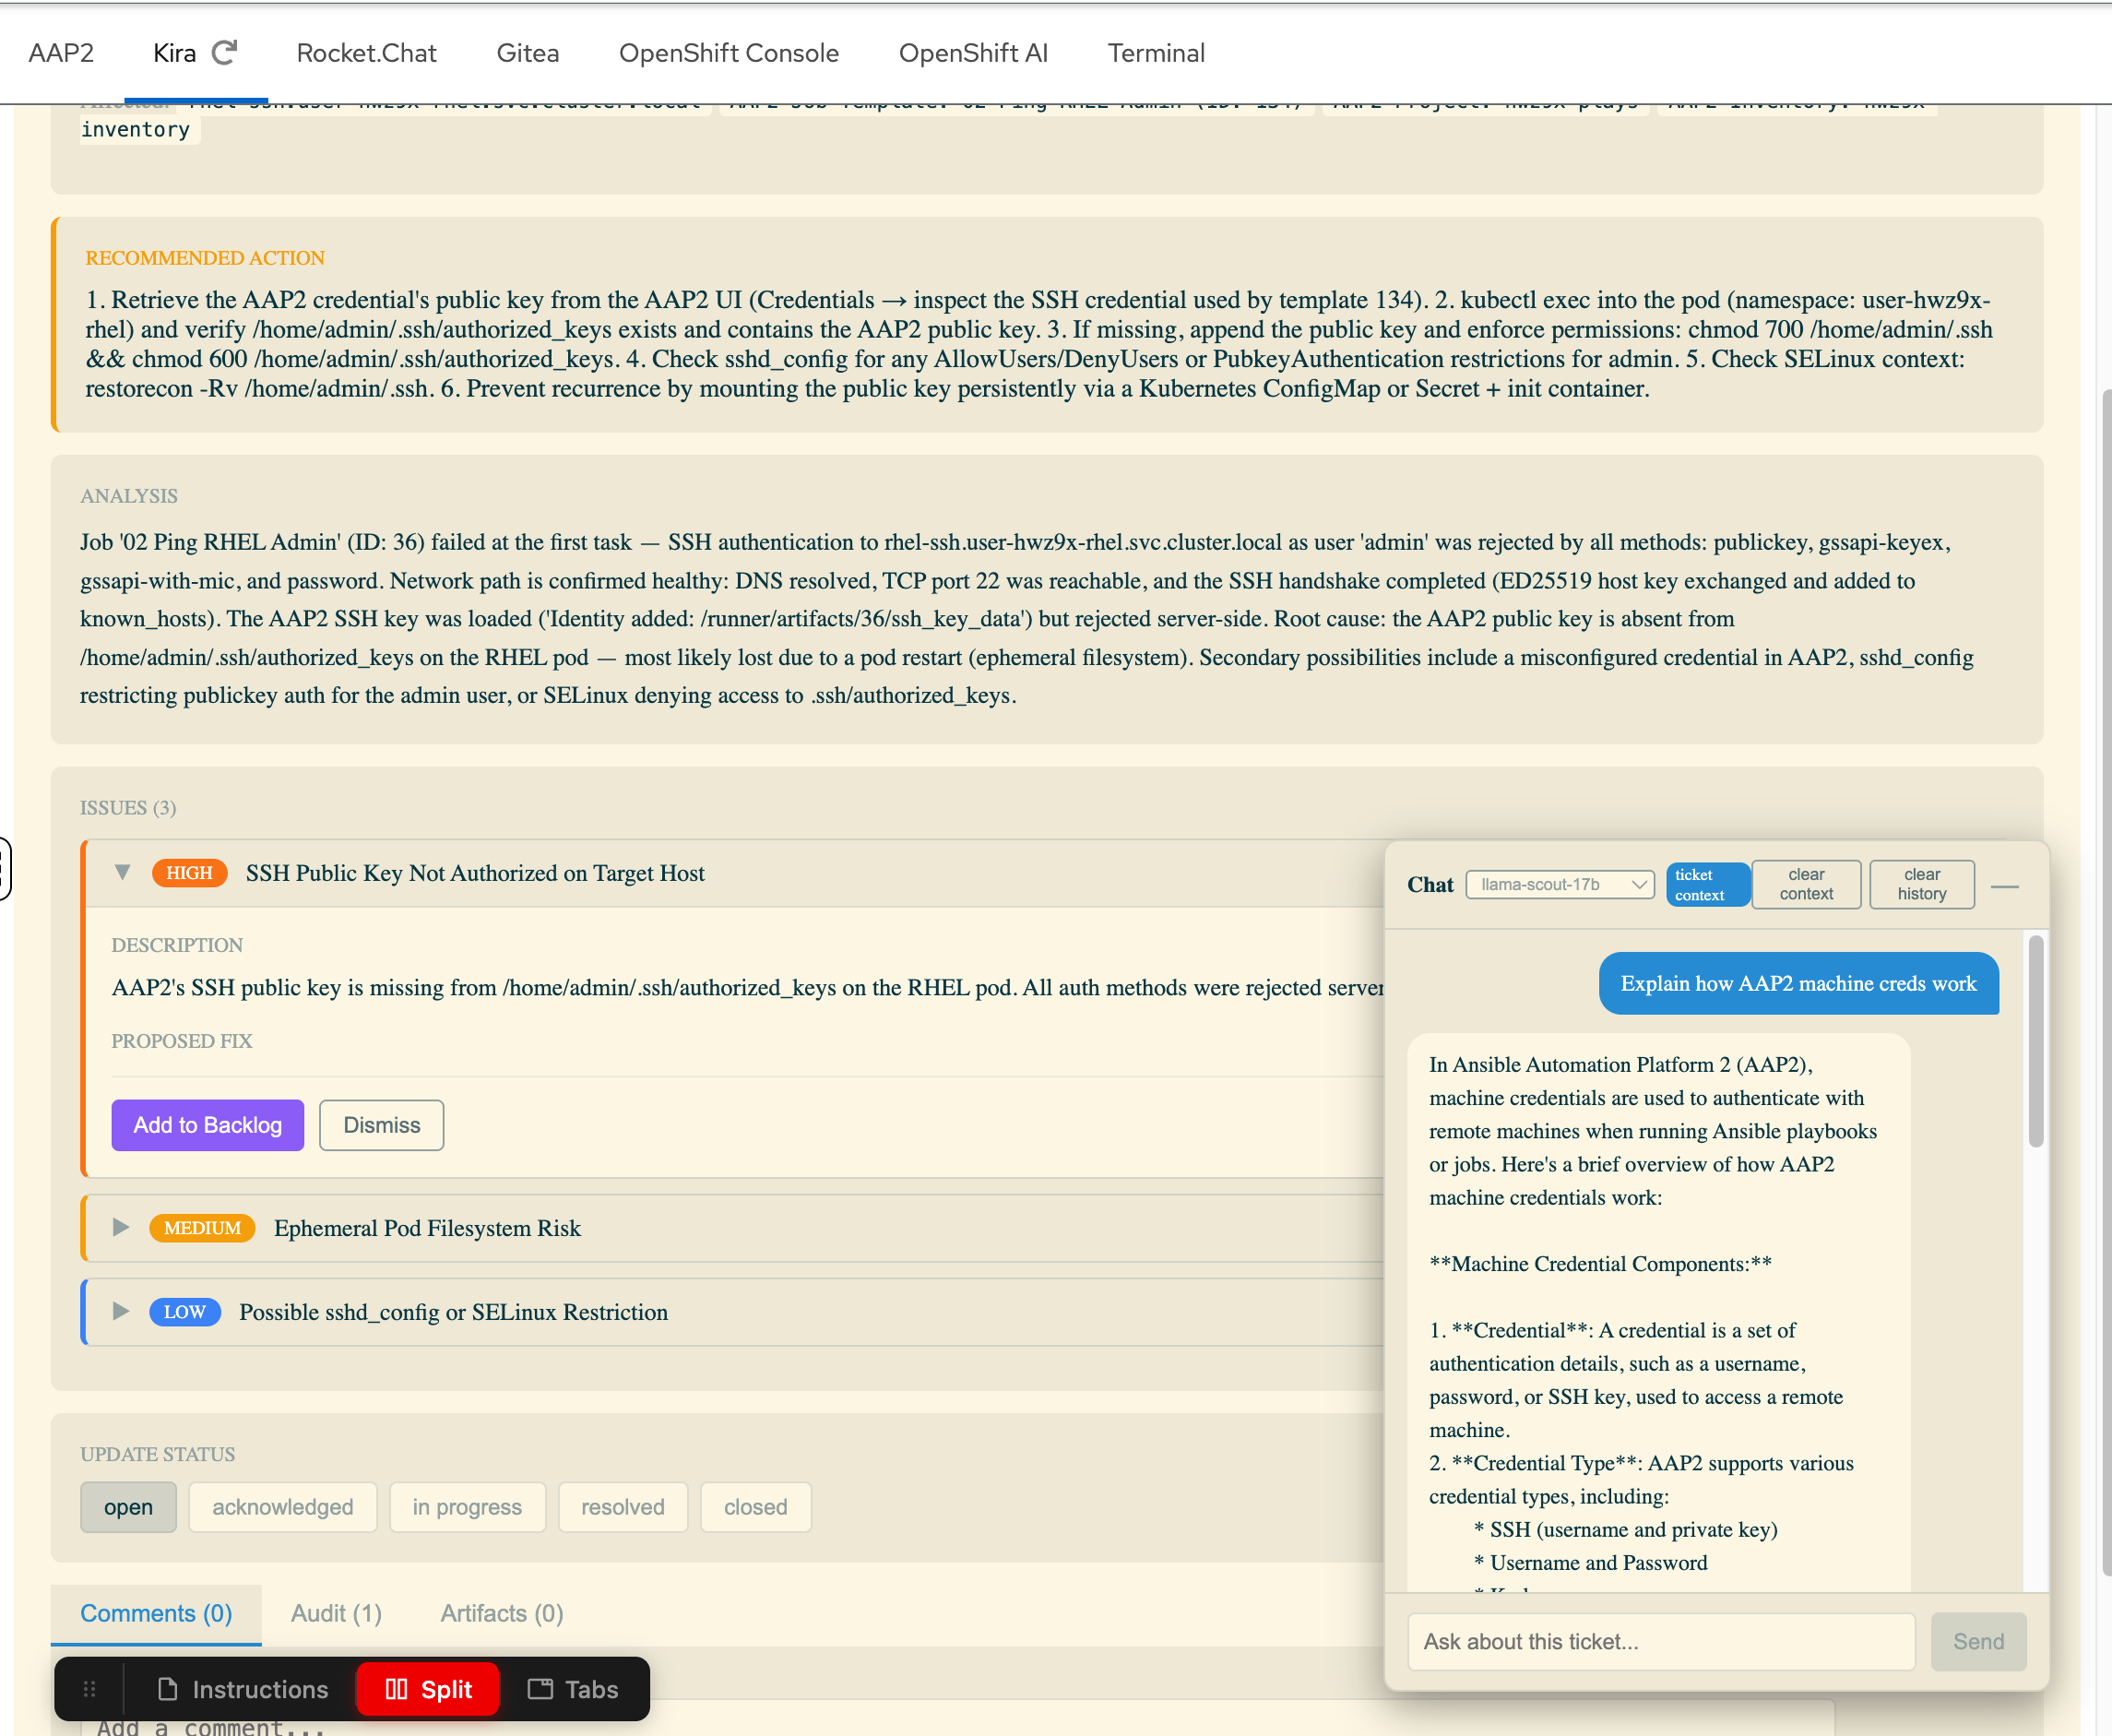
Step 3: Try the AI Chatbot
Notice the chat icon in the bottom right corner of the ticket screen. Click it to open the AI Chatbot.
This chatbot is connected to Red Hat OpenShift AI MaaS (Model as a Service) and can answer questions about the ticket in context. Try asking it something like "Explain how AAP2 machine credentials work" — it will respond using the LLM with the ticket context available.
Explore Rocket.Chat — ChatOps
In the Rocket.Chat tab (log in with user-12345 / deeper-agents if prompted)
Rocket.Chat is the ChatOps notification sink — where the AI assistant posts summaries of failures it has analyzed. In Meridian’s environment, this is how the on-call team stays informed without watching dashboards.
| In your environment, this is Rocket.Chat. In production, this could just as easily be Slack, Microsoft Teams, or any webhook-capable messaging platform. The pattern is the same — the AI agent posts structured notifications to a channel that humans monitor. |
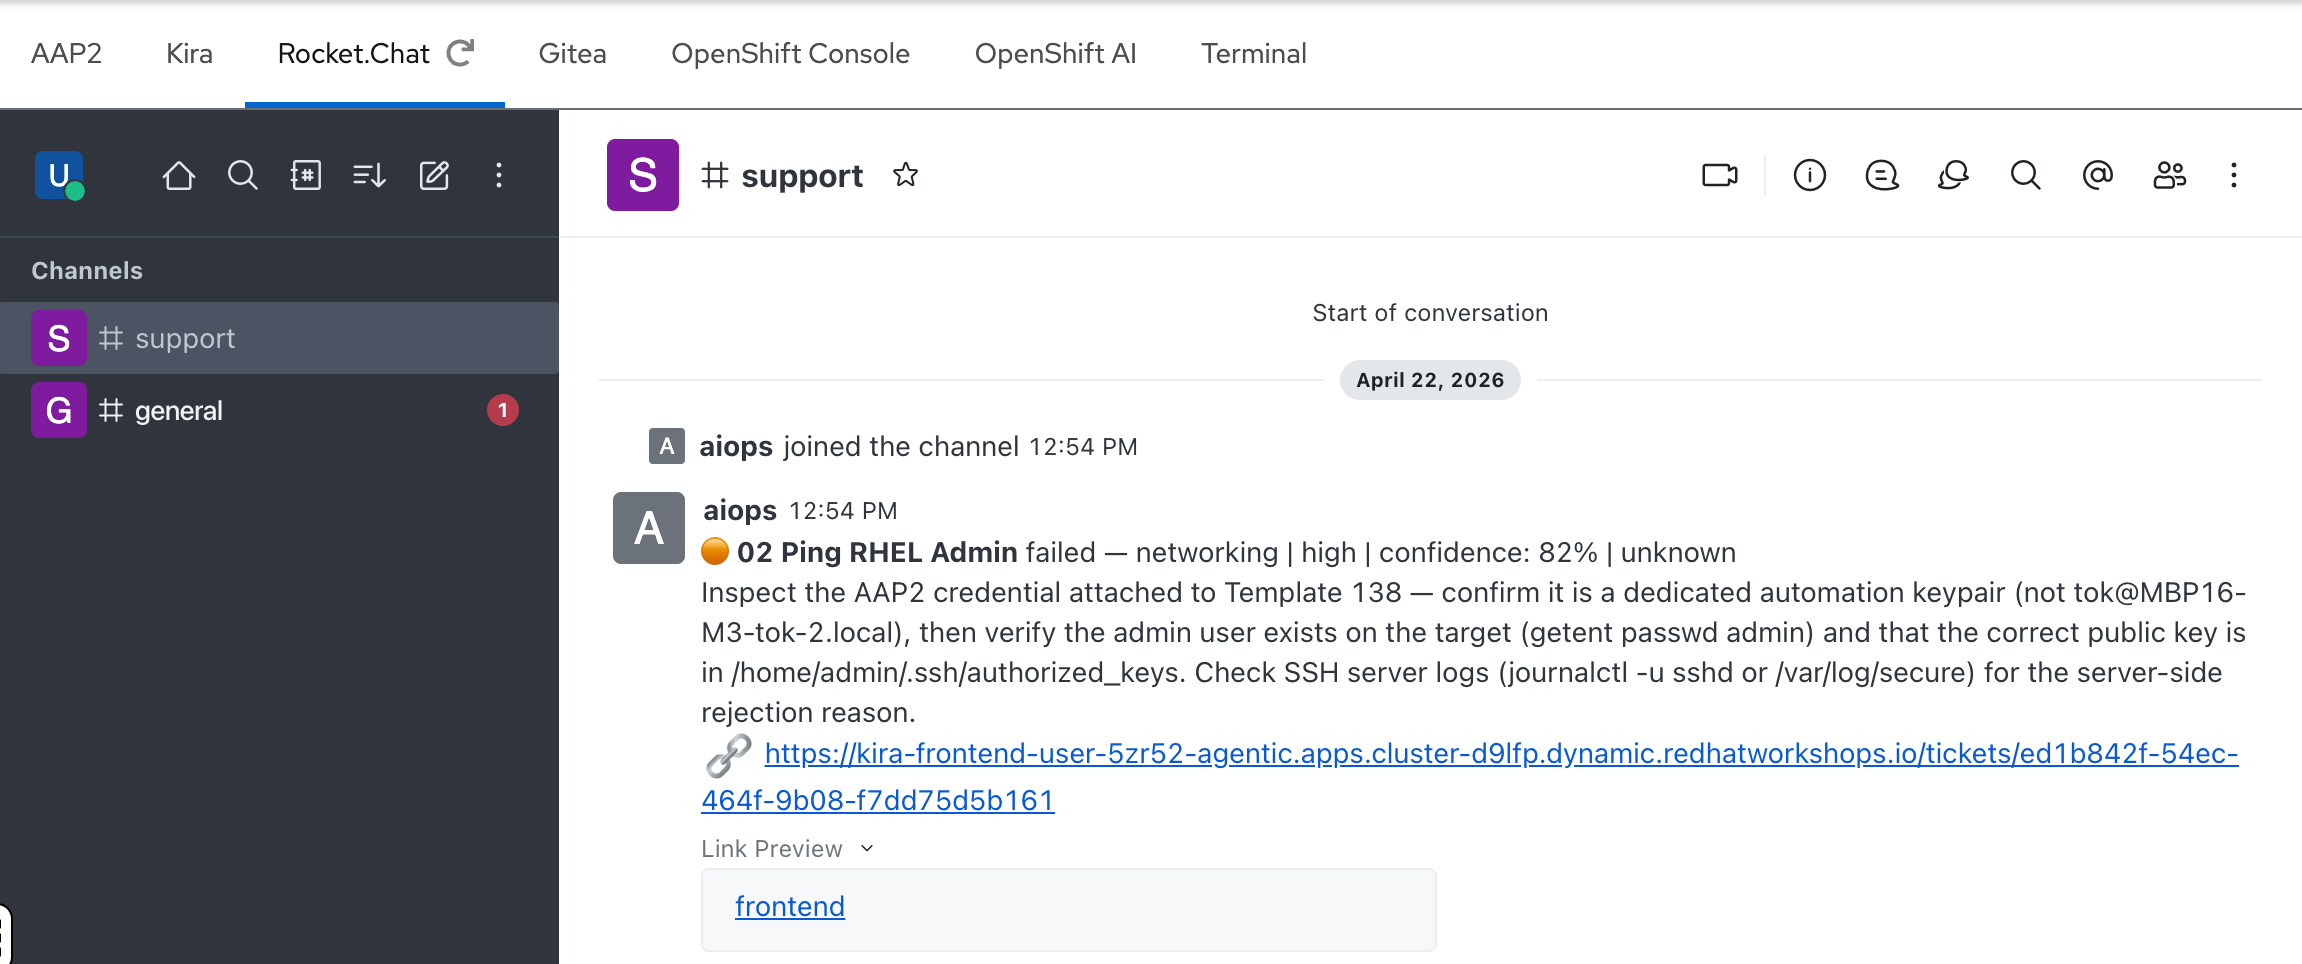
Step 1: Find the #support channel
After logging in, you’ll see the Rocket.Chat home screen. In the left sidebar, click the #support channel.
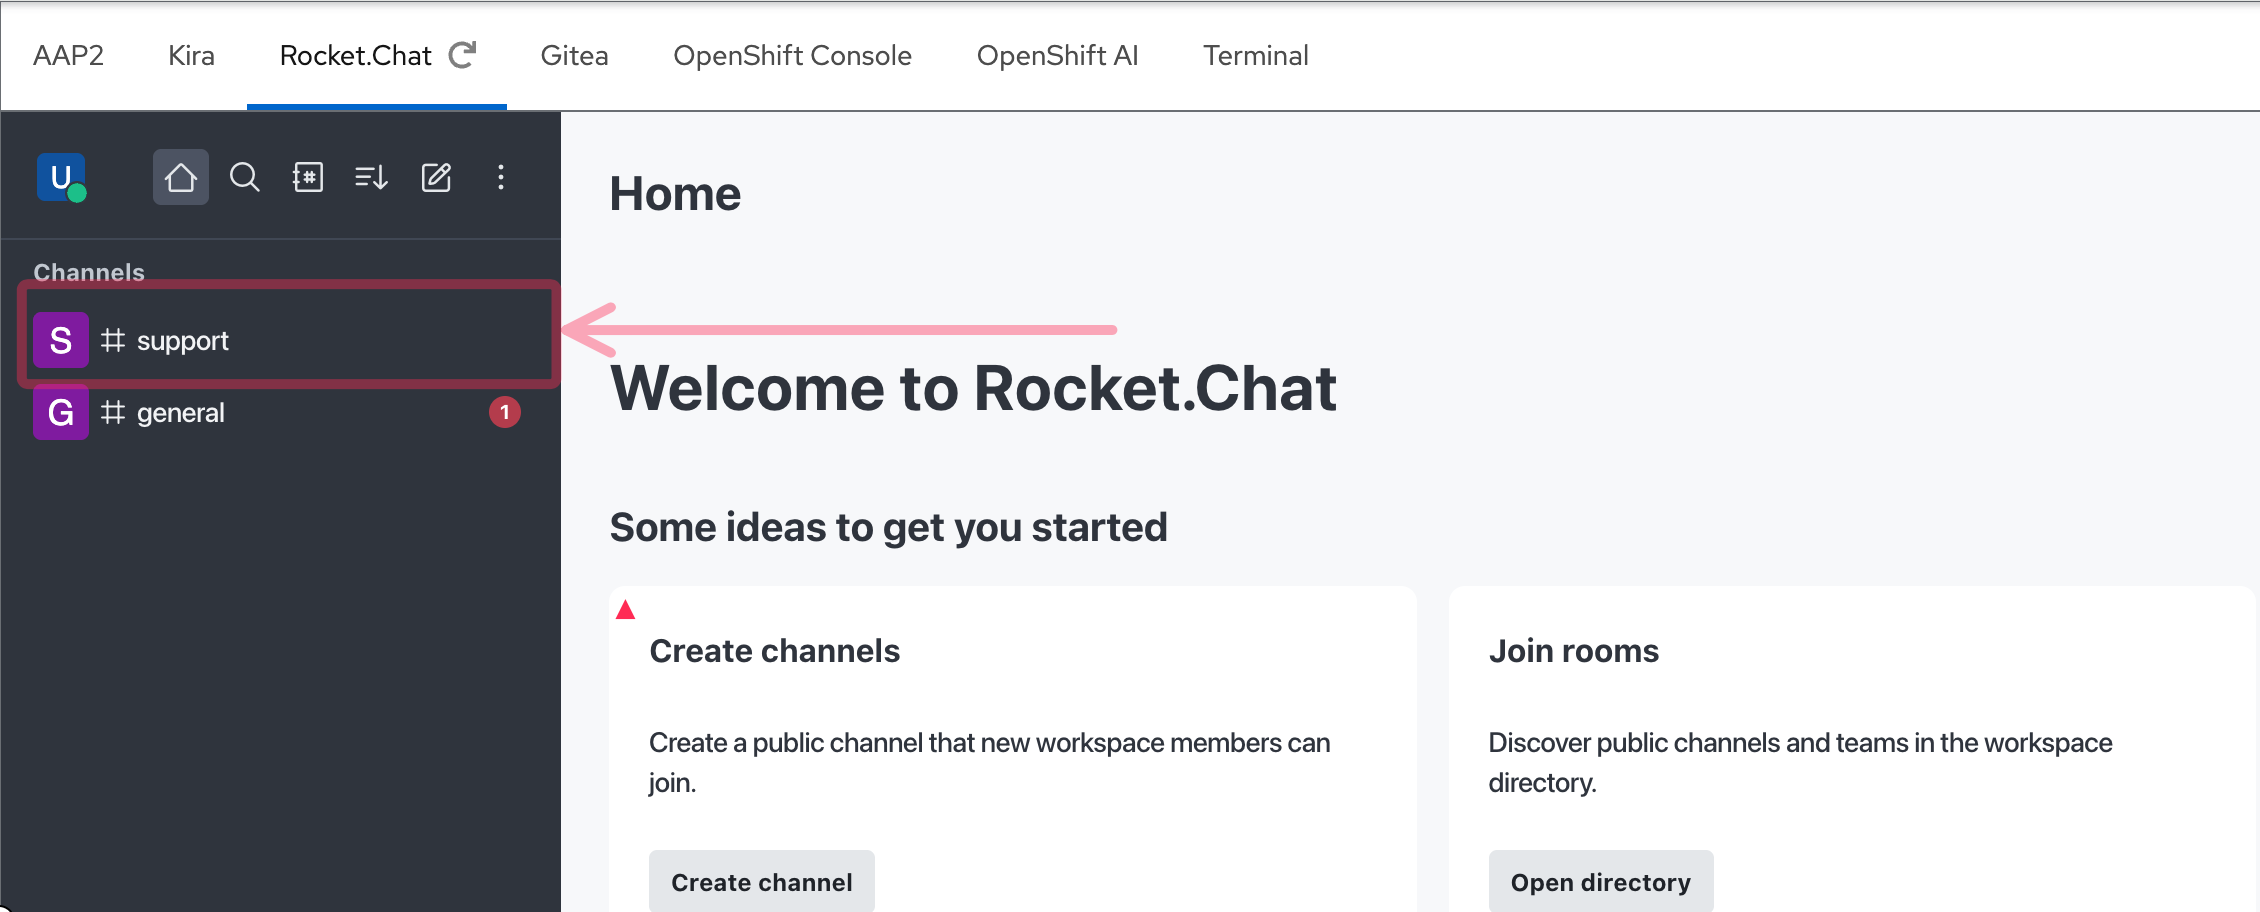
Step 2: Review the AI notification
In the #support channel, you should see a notification from the aiops bot. This matches the ticket you just saw in Kira — the same failure, summarized for ChatOps:
-
The job name and failure classification
-
Risk level and confidence score
-
A brief recommended action
-
A direct link to the full ticket in Kira
This is the end of the automated pipeline — the AI agent analyzed the failure, created a ticket, and notified the team, all without human intervention.
How it all connects
You’ve now seen three pieces of the puzzle: a failed job in AAP2, a ticket in Kira, and a notification in Rocket.Chat. But how did that happen? Here’s the flow:

This is the Deep Agents pattern in action:
-
AAP2 job fails — a playbook encounters an error during execution
-
Webhook fires — AAP2 sends a failure notification to Athena’s webhook endpoint
-
Athena catches the webhook — retrieves the full job output and error details from the AAP2 API
-
Classifies the failure — determines whether this is an Ansible, Linux, OpenShift, or Networking issue
-
Delegates to a specialist — spins up the appropriate
sre_subagent (e.g.,sre_linuxfor a package issue) -
Root cause analysis — the specialist agent analyzes the error, reads the playbook, and identifies the cause
-
Creates a ticket — structured ticket in Kira with title, area, confidence, risk, and recommended action
-
Notifies the team — posts a summary to the Rocket.Chat
#supportchannel
Everything you saw in AAP2, Kira, and Rocket.Chat was produced by this automated pipeline — no human intervention required.
The Compliance Angle
At Meridian Financial, every action taken on a production failure must be traceable. Auditors from the Financial Conduct Authority review change management and incident response records regularly. Missing an SLA window doesn’t just mean a late fix — it triggers regulatory penalties and mandatory remediation reports.
Today, those reports are written manually — 2 to 3 hours per major incident, often reconstructed after the fact from memory and chat logs. An AI agent that acts without logging is a compliance liability. An agent that logs everything it does — the classification rationale, the specialist analysis, the confidence score, the reviewer’s verdict — becomes a compliance asset.
This is a theme that runs throughout the workshop:
-
Module 2: You’ll see the structured
TicketPayloadthat every agent produces — title, evidence, root cause, risk, confidence, recommended action. This is audit-ready output by design. -
Module 4: You’ll explore data sovereignty — why sending job output to external LLM providers creates regulatory risk, and how open source models on Red Hat OpenShift AI keep your data within your controlled infrastructure.
-
Module 5: You’ll configure human-in-the-loop gates and evaluate when the agent can act autonomously vs when it needs human approval — the governance layer that regulators want to see.
You will build an agent that is not just fast, but auditable.
Data Sovereignty
There is another dimension to compliance that goes beyond audit trails: where does your data go when an AI agent processes it?
Every API call to a frontier model sends your job output — error messages, hostnames, IP addresses, credential names, system topology — to an external provider. In a regulated environment like Meridian Financial, this creates real data residency risk under frameworks like GDPR and DORA.
This is not a niche concern. 63% of large enterprises across EMEA cite sovereignty concerns as the greatest barrier to cloud adoption, and over two-thirds have identified it as a top IT priority for the next 18 months.
Red Hat’s position is that open source is the foundation of sovereign AI. Open source models running on your own infrastructure — via Red Hat OpenShift AI — give you the control that regulated industries require: you choose where inference runs, your data never leaves the platform, and you maintain full auditability of the AI supply chain.
In Module 4, you’ll switch the entire agent team from a frontier model to an open source model running on MaaS — same pipeline, same skills, same prompts, but with your data staying entirely within your controlled environment.
Takeaways
-
You are an SRE at Meridian Financial, responsible for investigating and resolving infrastructure failures
-
AAP2 job templates represent your automation — Jobs shows the execution history, including failures
-
Kira tickets are created automatically by the Athena AI agent with structured root cause analysis
-
Rocket.Chat (or any ChatOps platform) is the notification sink for the on-call team
-
The Deep Agents pipeline connects all three: failure → classification → specialist analysis → ticket + notification
-
Everything your agent does must be traceable for compliance — this is a constraint, not a nice-to-have
-
Data sovereignty matters — open source models on your own infrastructure keep sensitive operational data out of external APIs