VM Monitoring with Advanced Cluster Management
In this module, we will demonstrate how to monitor virtual machines using Advanced Cluster Management (ACM) on a managed OpenShift cluster, utilizing bare metal instances running OpenShift Virtualization.
SAY:
In this demo, we will use ACM to monitor virtual machines on a managed cluster that includes bare metal instances running OpenShift Virtualization.
Overview of ACM and the Managed Cluster
DO:
-
Navigate to the OpenShift Console.
-
If you haven’t already, login:
-
User: {openshift_cluster_admin_username}
-
Password: {openshift_cluster_admin_password}
-
-
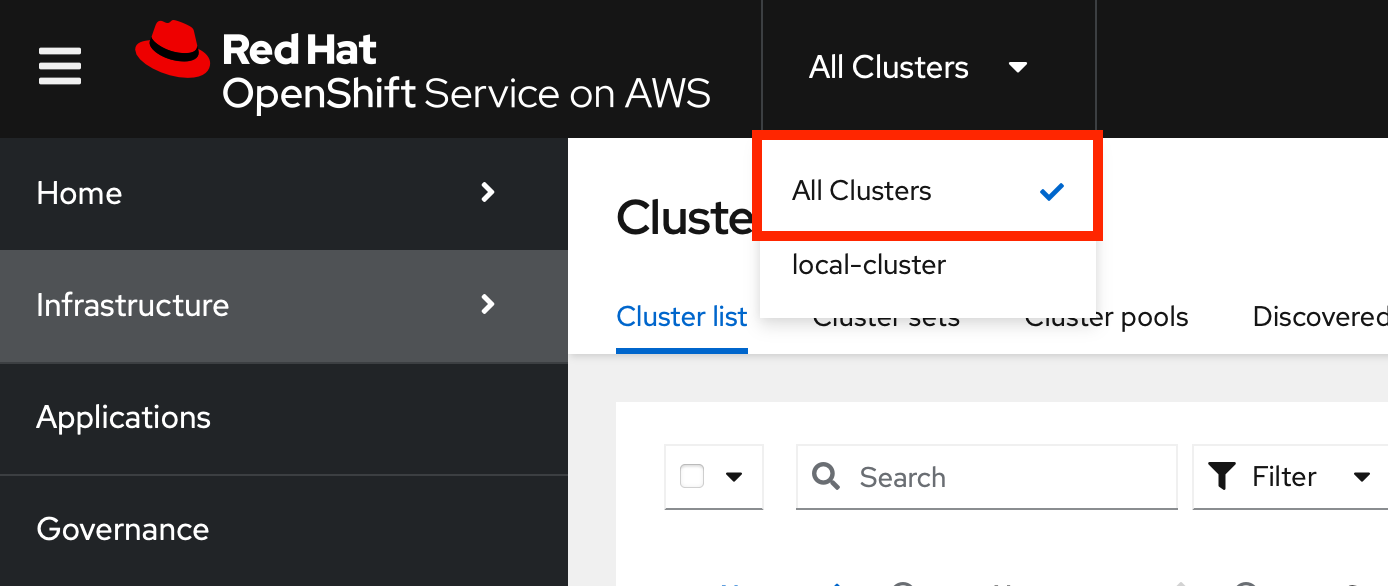
Ensure All Clusters is selected at the top left to activate the ACM Console.
-
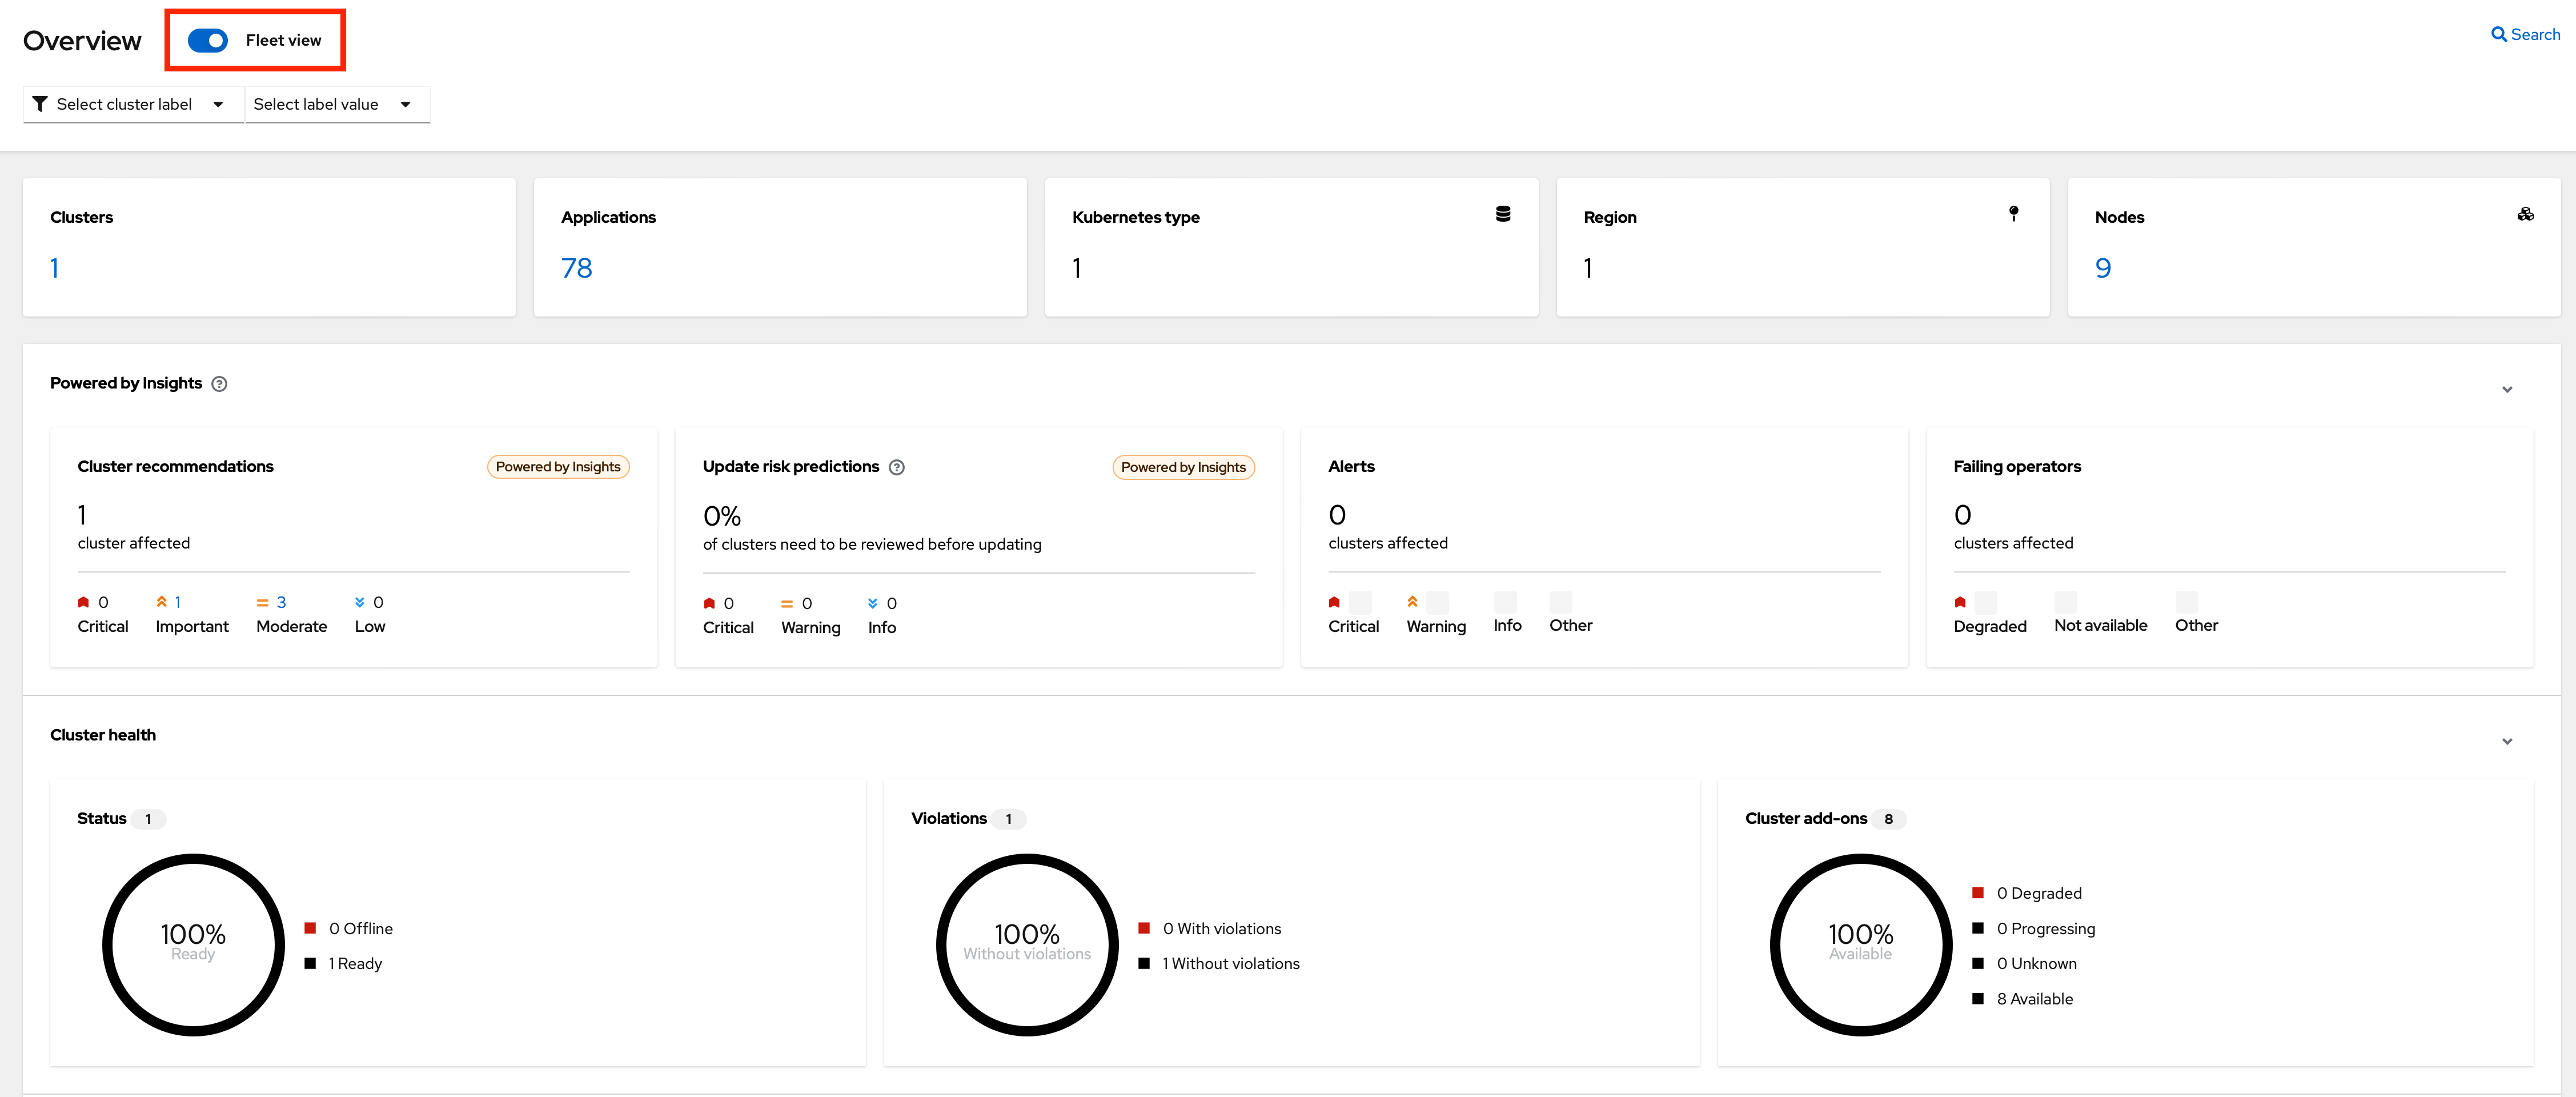
Click Home and then Overview to see the ACM dashboard.
-
Select fleet view at the top left.
SAY:
In previous screenshot, you could see ACM, which provides a centralized view of our clusters. We can have several clusters across different providers and infrastructures.
DO:
-
Go to Infrastructure and then Clusters at the left menu.
-
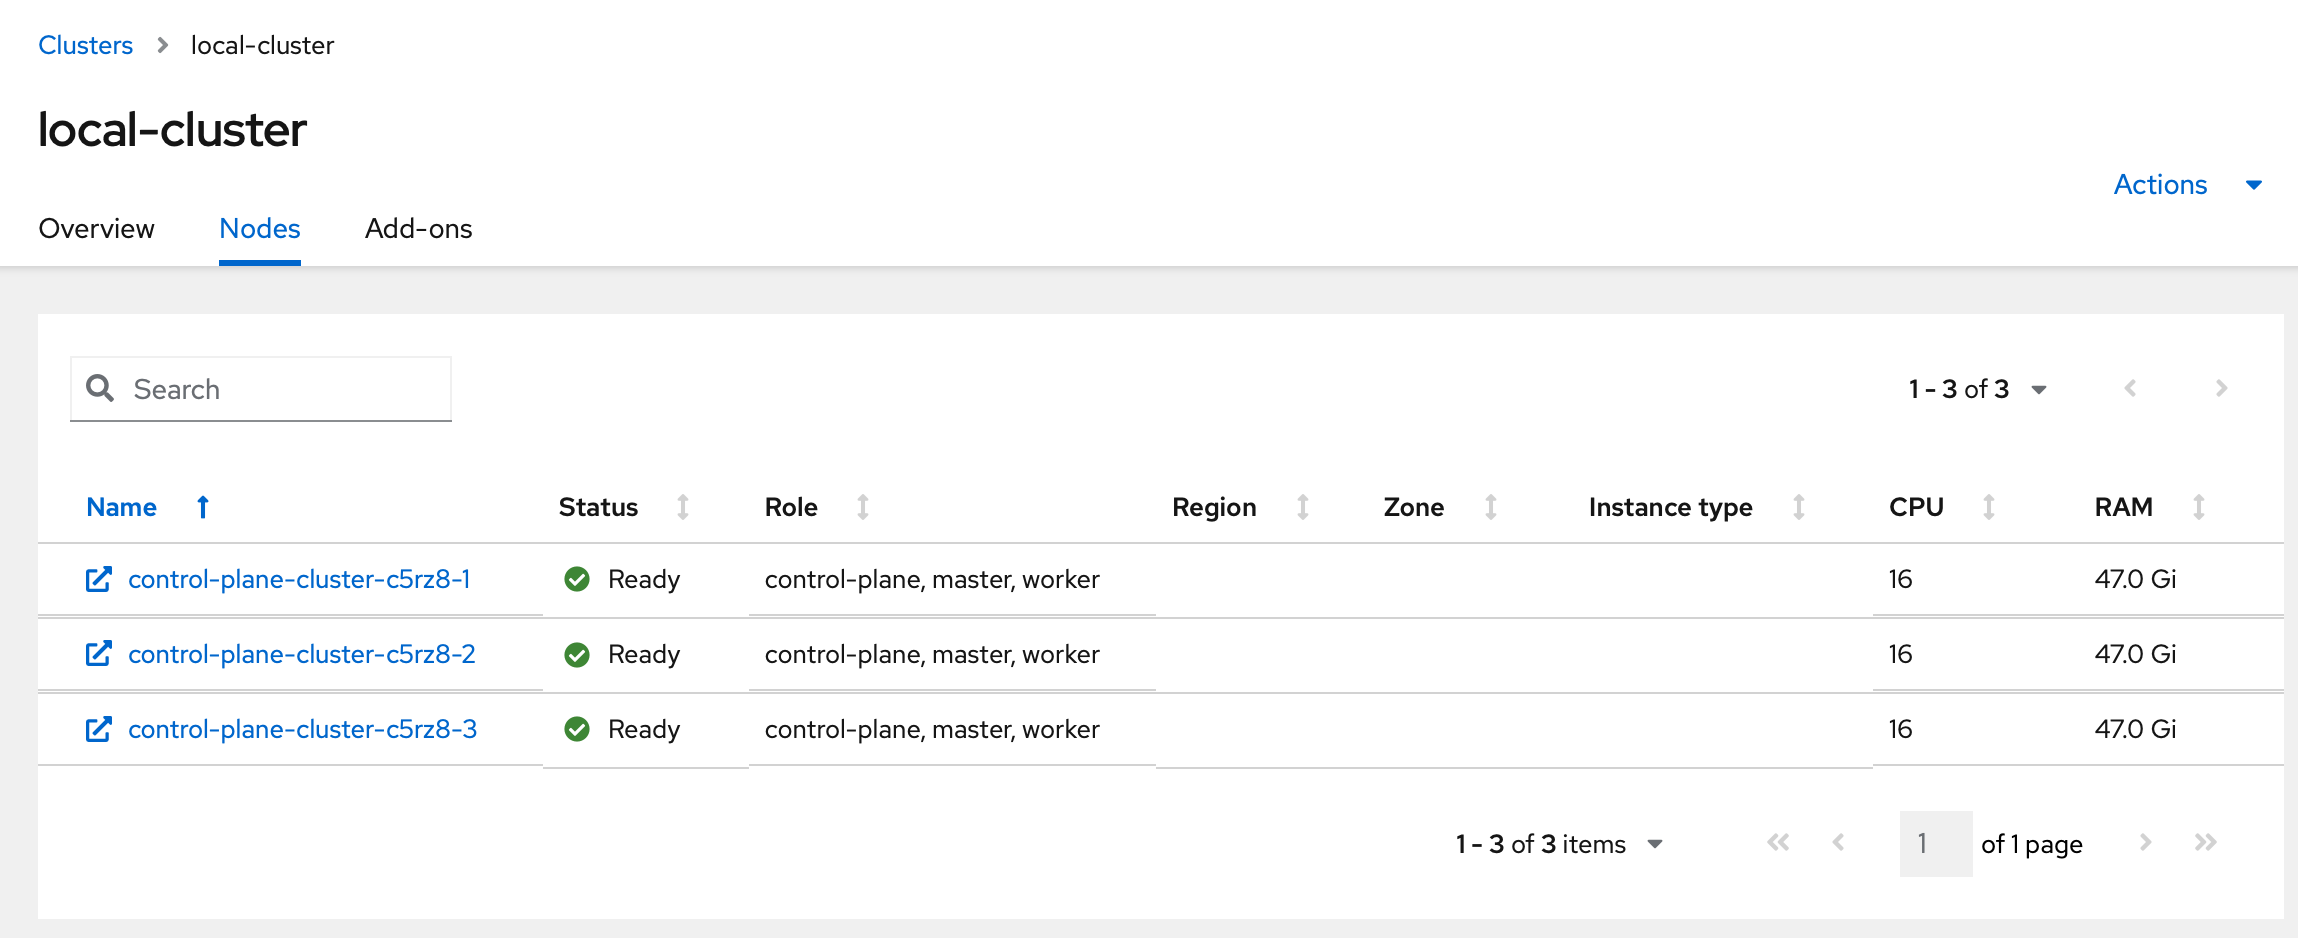
Click on the local-cluster to view its details.
-
Navigate to the Nodes tab.
SAY:
Here, we can see information about the our managed cluster, including its nodes.
This particular cluster runs on bare metal with Container-native Virtualization (CNV).
DO:
-
Switch to the managed cluster (local-cluster) view.
-
Navigate to the Compute and Nodes section.
-
Click on a node to view its details.
-
Look for pods running in the
openshift-cnvnamespace.
SAY:
Within the managed cluster, we can see the bare metal node and the various pods in the openshift-cnv namespace.
This is where all OpenShift Virtualization and host provisioning pods are running.
Existing Virtual Machines
DO:
-
Click on the Virtualization and then VirtualMachines.
-
Select "All Projects" at the top.
-
Highlight the existing VMs.
SAY:
The search engine within Red Hat Advanced Cluster Management for Kubernetes enables rapid troubleshooting and resource discovery across your Kubernetes clusters, including virtual machines, by providing a centralized and powerful search capability.
With this feature, users can quickly locate specific resources, such as pods, nodes, and VMs, by using intuitive search queries and filters.
This streamlined search functionality reduces the complexity of navigating large, multi-cluster environments, allowing administrators to efficiently identify and address issues, optimize resource usage, and maintain a robust and well-managed Kubernetes infrastructure.
Let’s showcase how the Search engine operates in ACM.
Using ACM for Monitoring and Troubleshooting
DO:
-
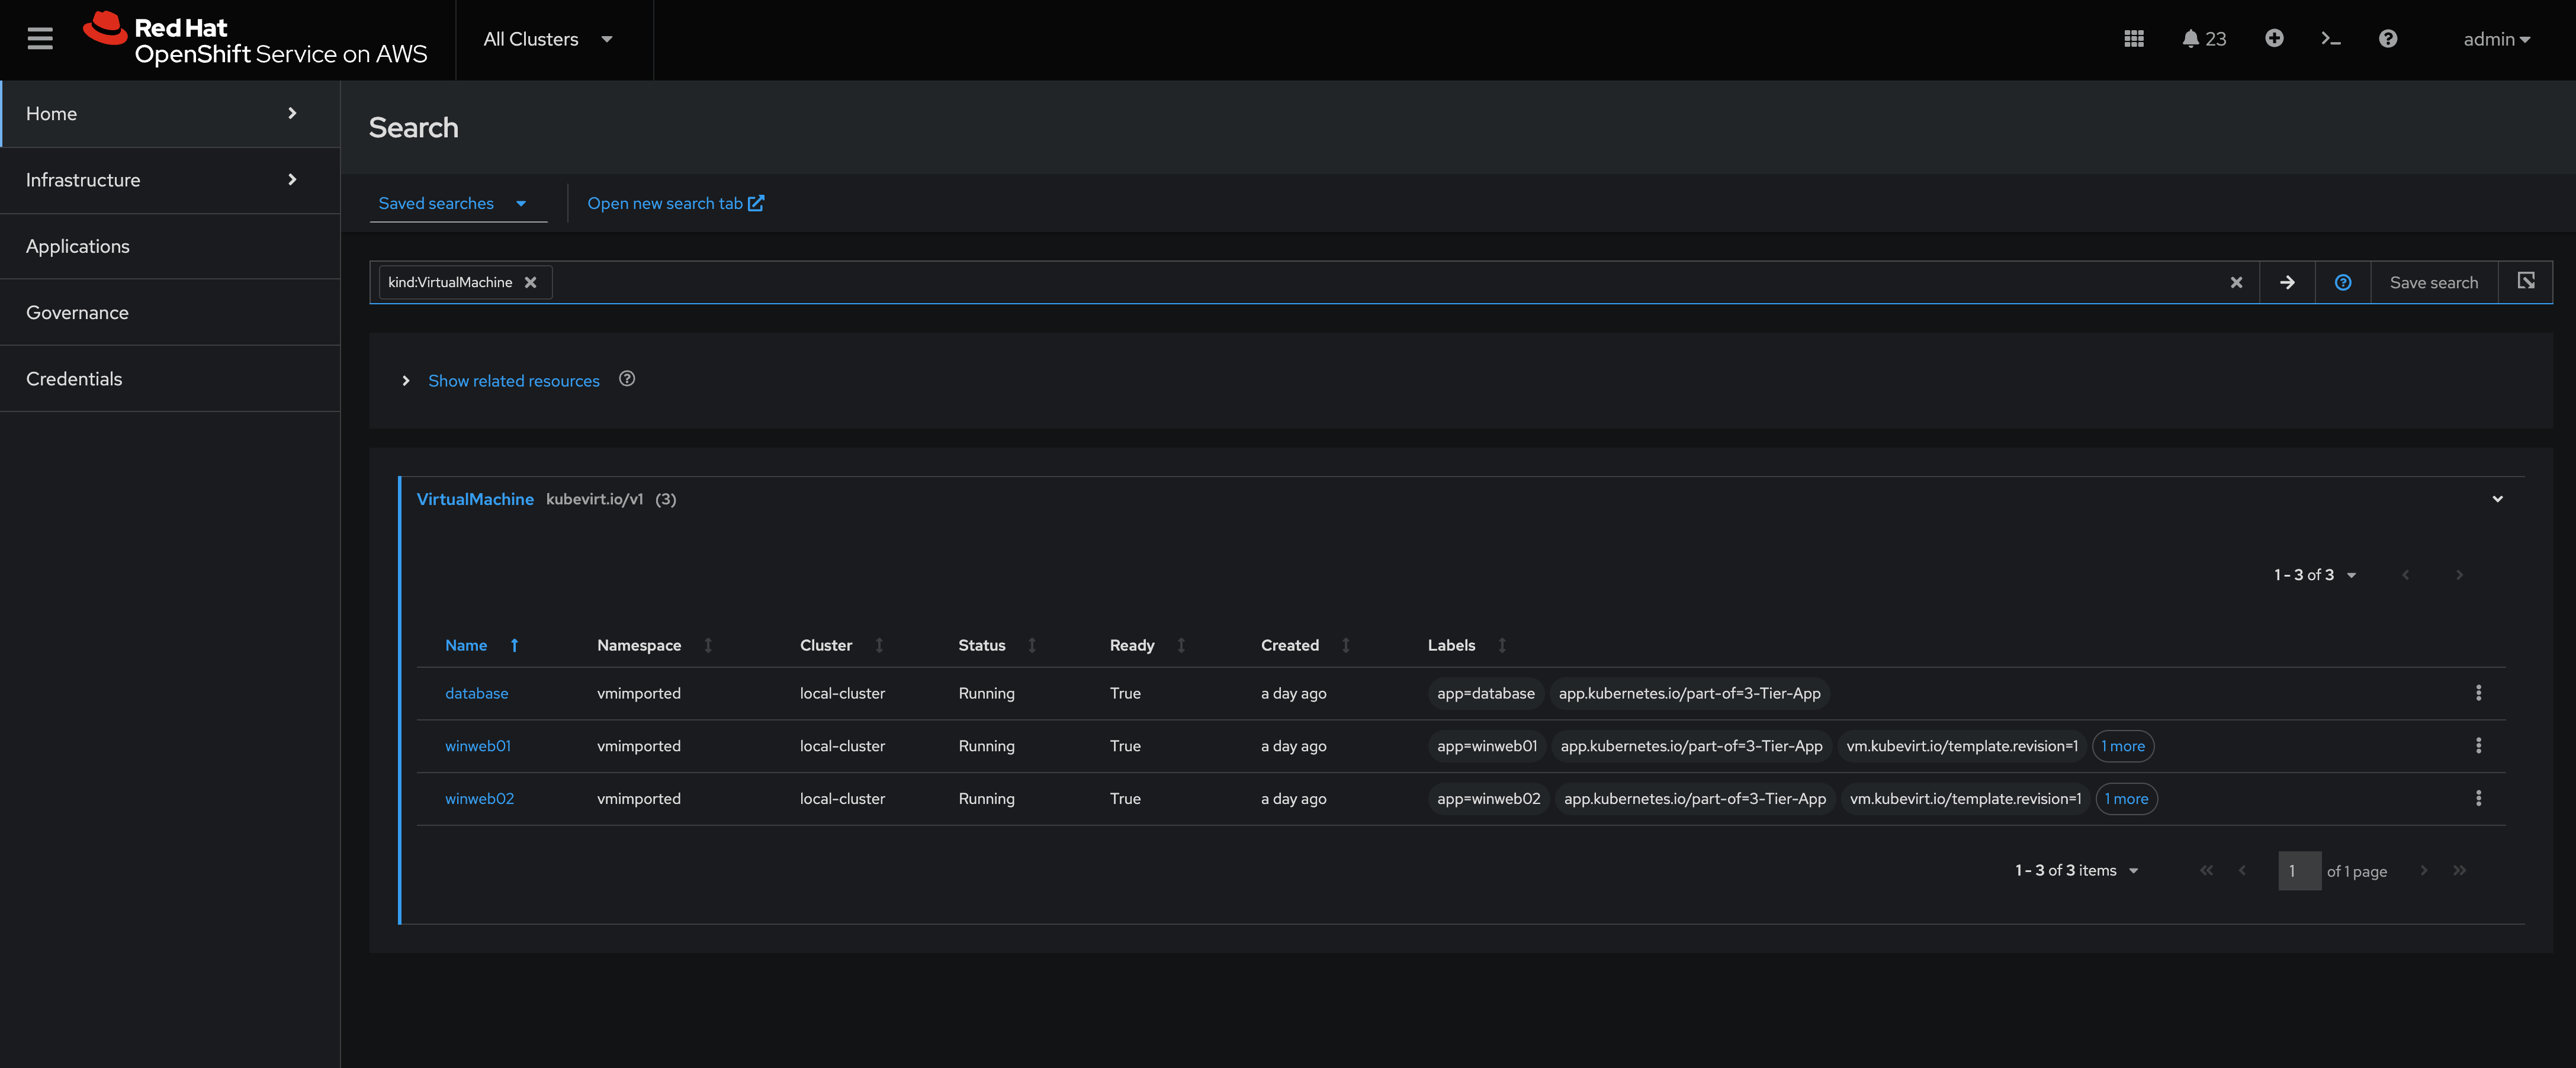
Navigate to the Search screen in ACM.
-
Setup the following filters in your search kind:VirtualMachine.
-
You should see the Virtual Machines, including those you imported in the earlier steps (if applicable).
-
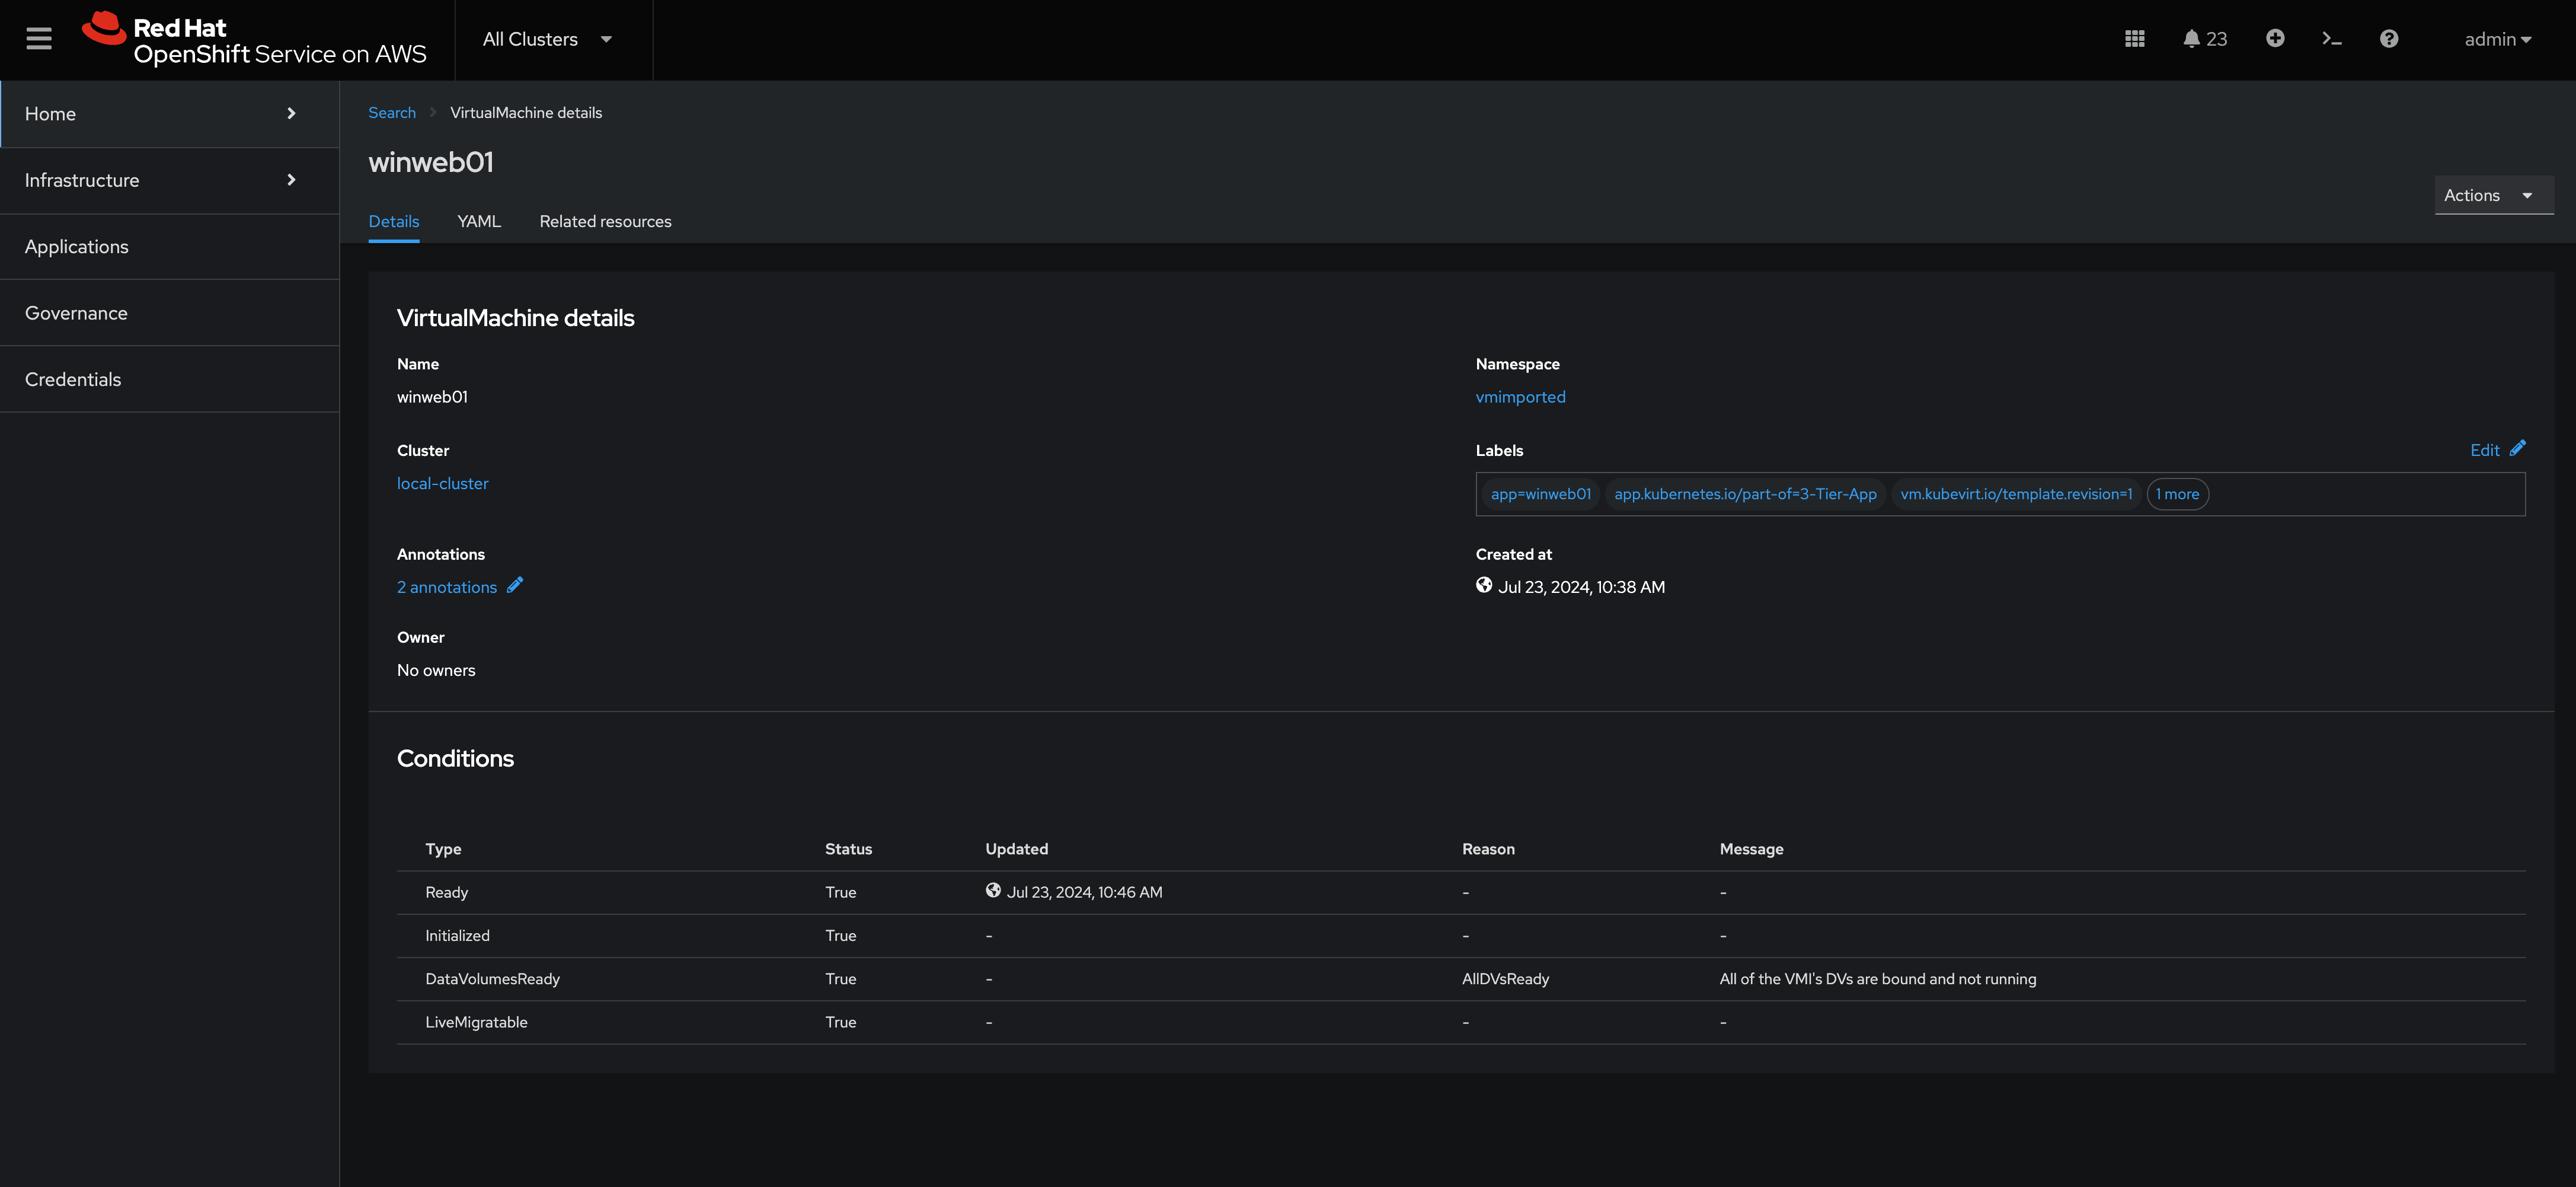
Let’s navigate deeper. Click on the winweb01-placeholder_guid.
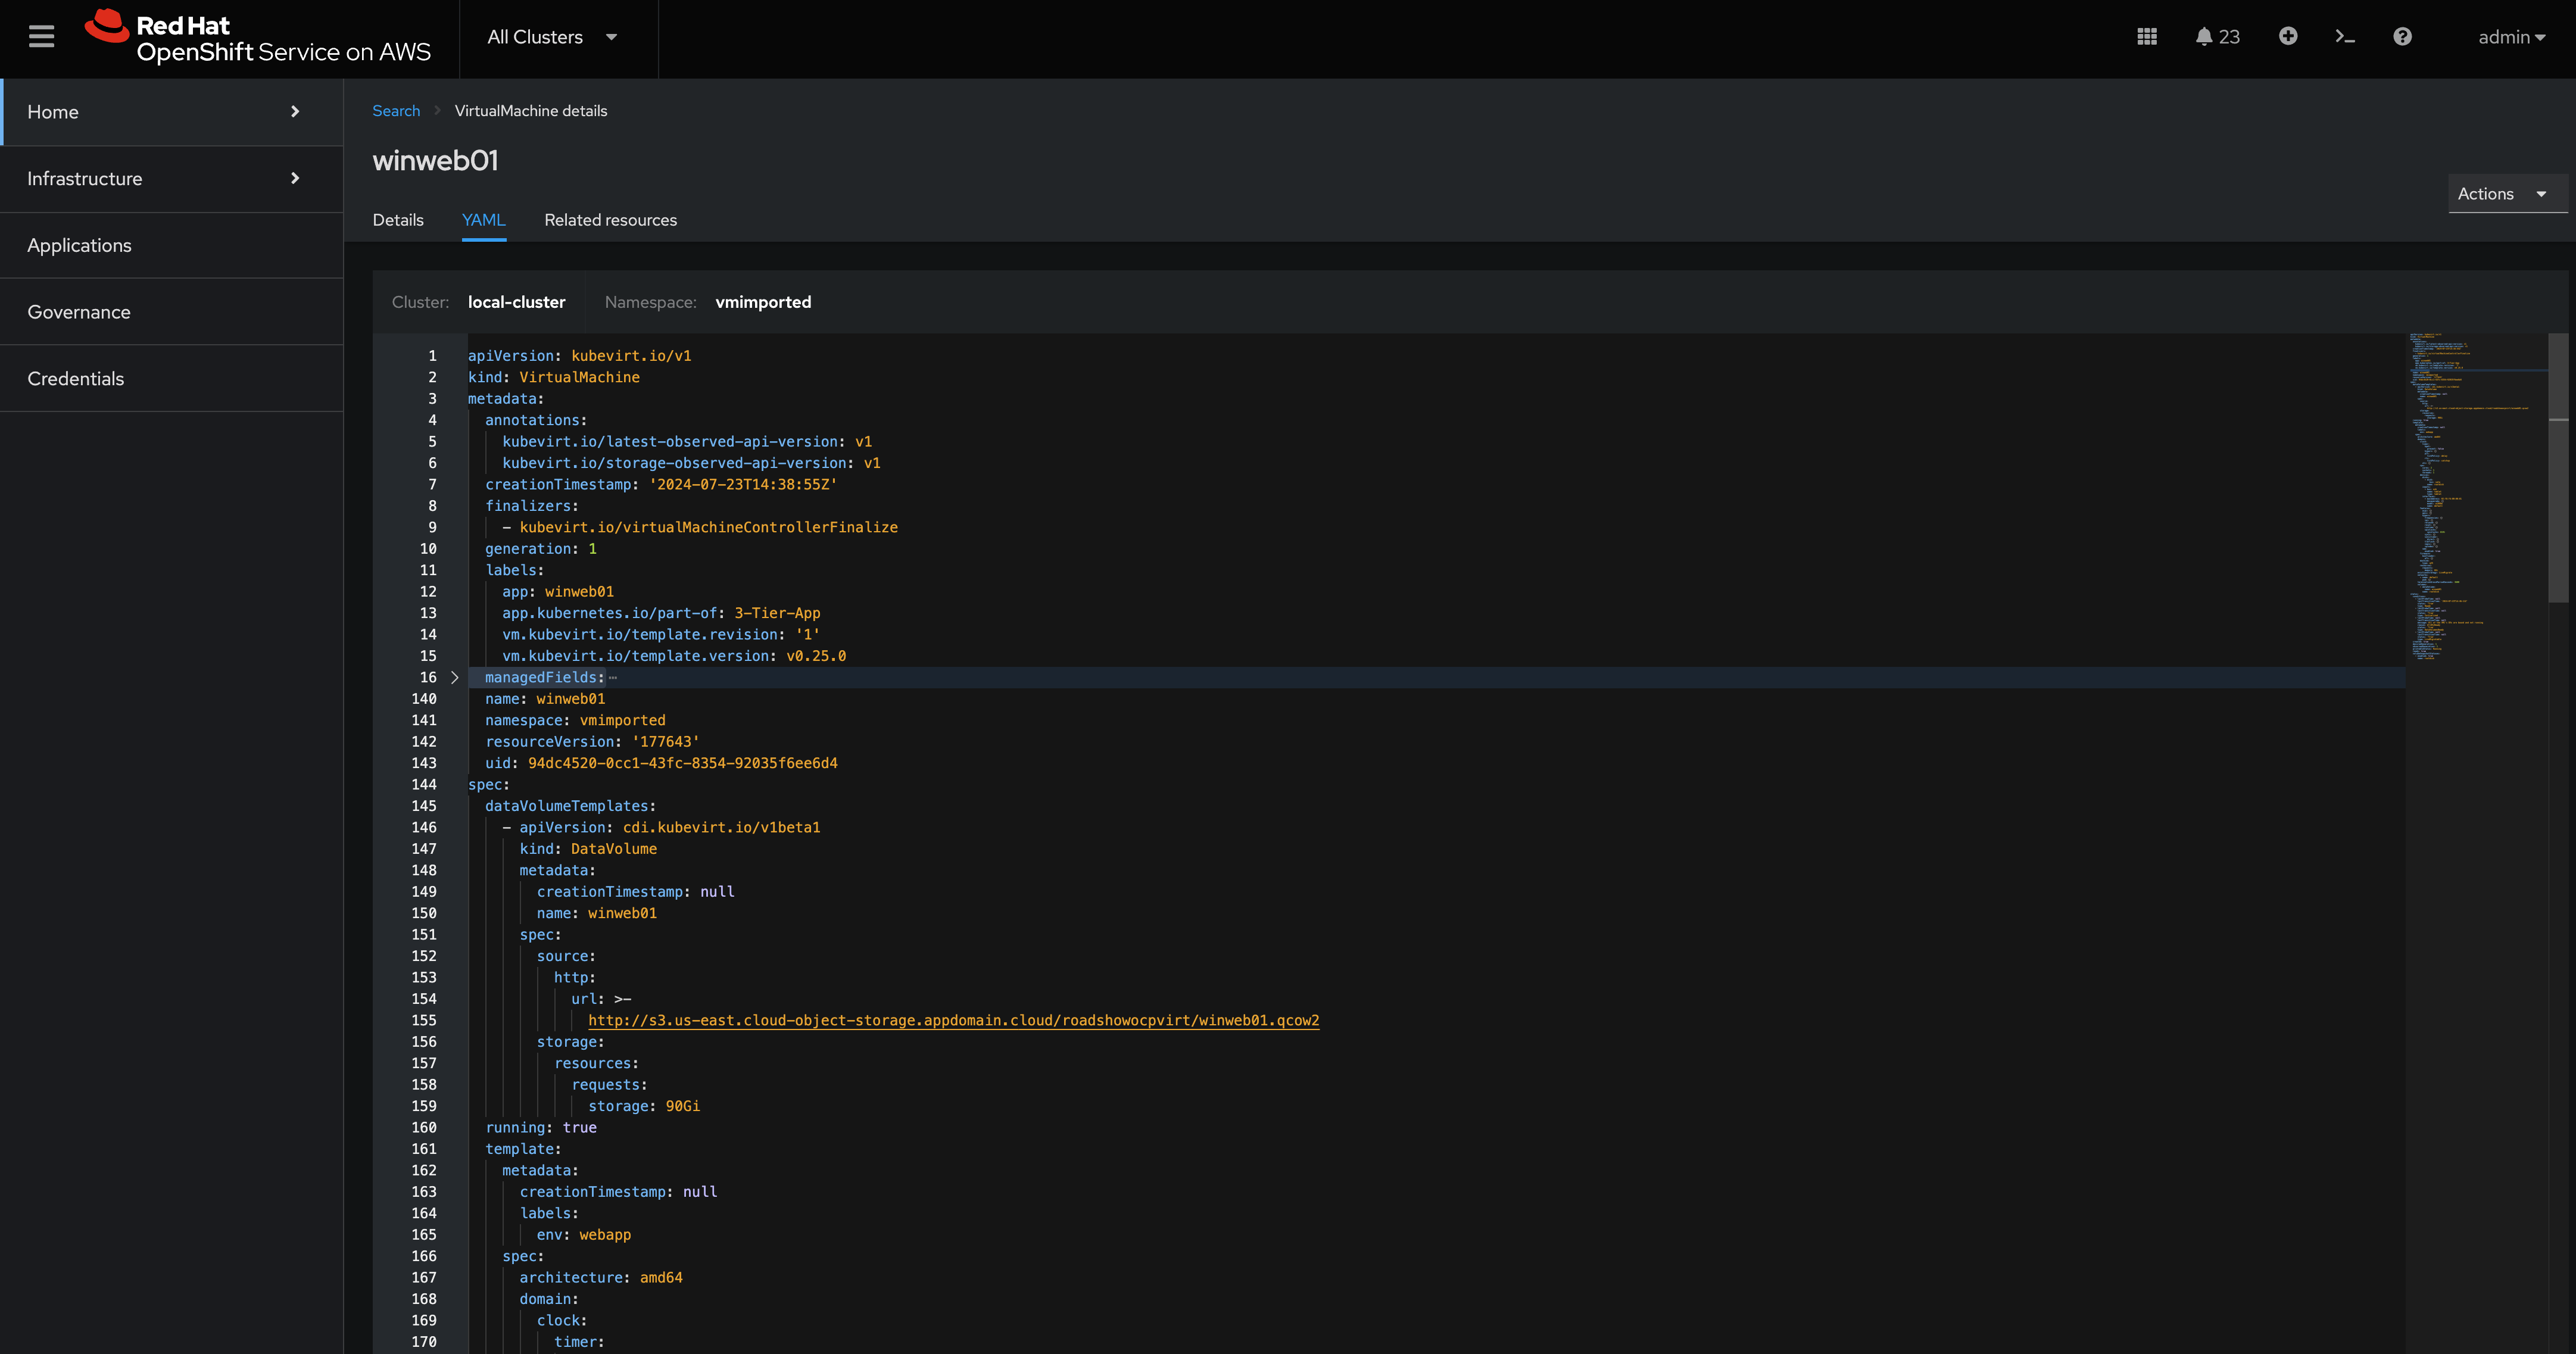
Notice all of the details of the Virtual Machine, here we can see when it was created, what Labels are appiled, what features of this virtual machine are enabled. If you navigate to the YAML tab you can see all of the details of the machine as code, you can use this to deploy VMs as code from within ACM, making it super easy to scale out your environment.
-
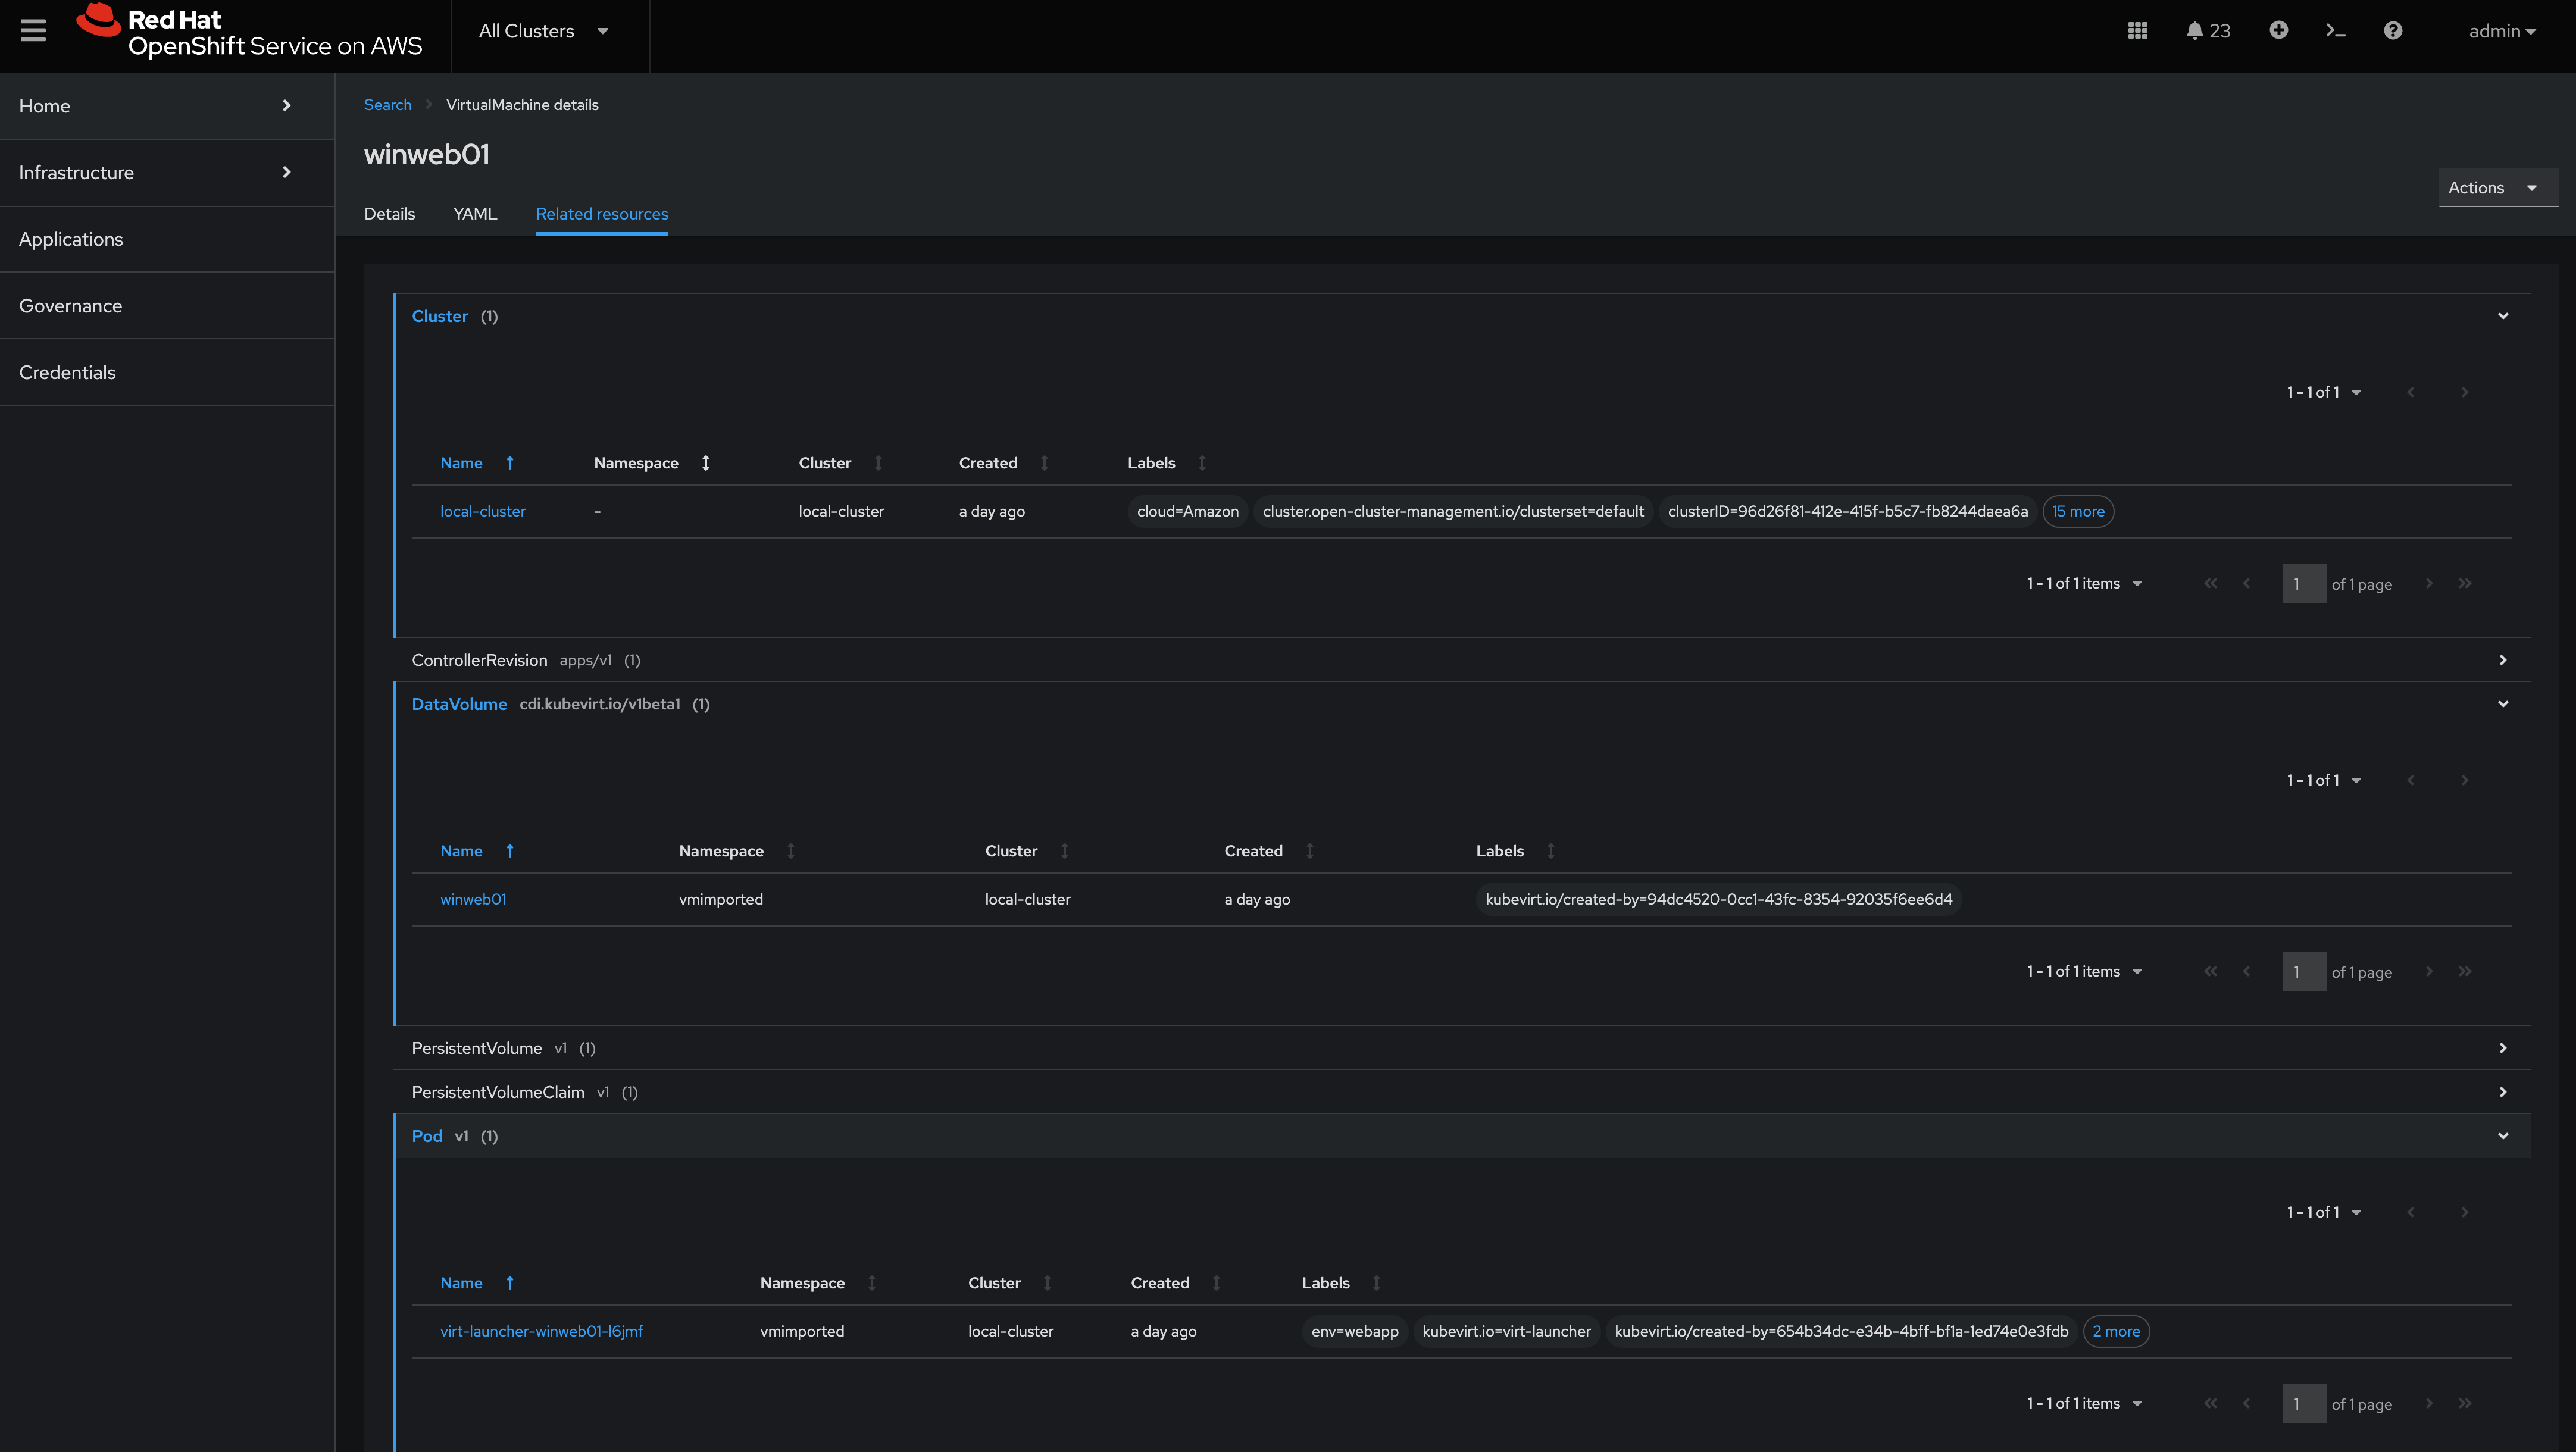
Navigate to the Related Resources tab to showcase all of the resources that are associated with the winweb01-placeholder_guid virtual machine, this allows for easy troubleshooting when issues come up.
Feel free to explore around the search engine with other qureies, they are all simple text based.
SAY:
ACM provides powerful search capabilities to look at specific VM resources, related resources, and overall cluster health. This is especially useful for monitoring and troubleshooting, now let’s dive deeper into Observability and showcase how we can monitor and alert on resources as needed.
DO:
-
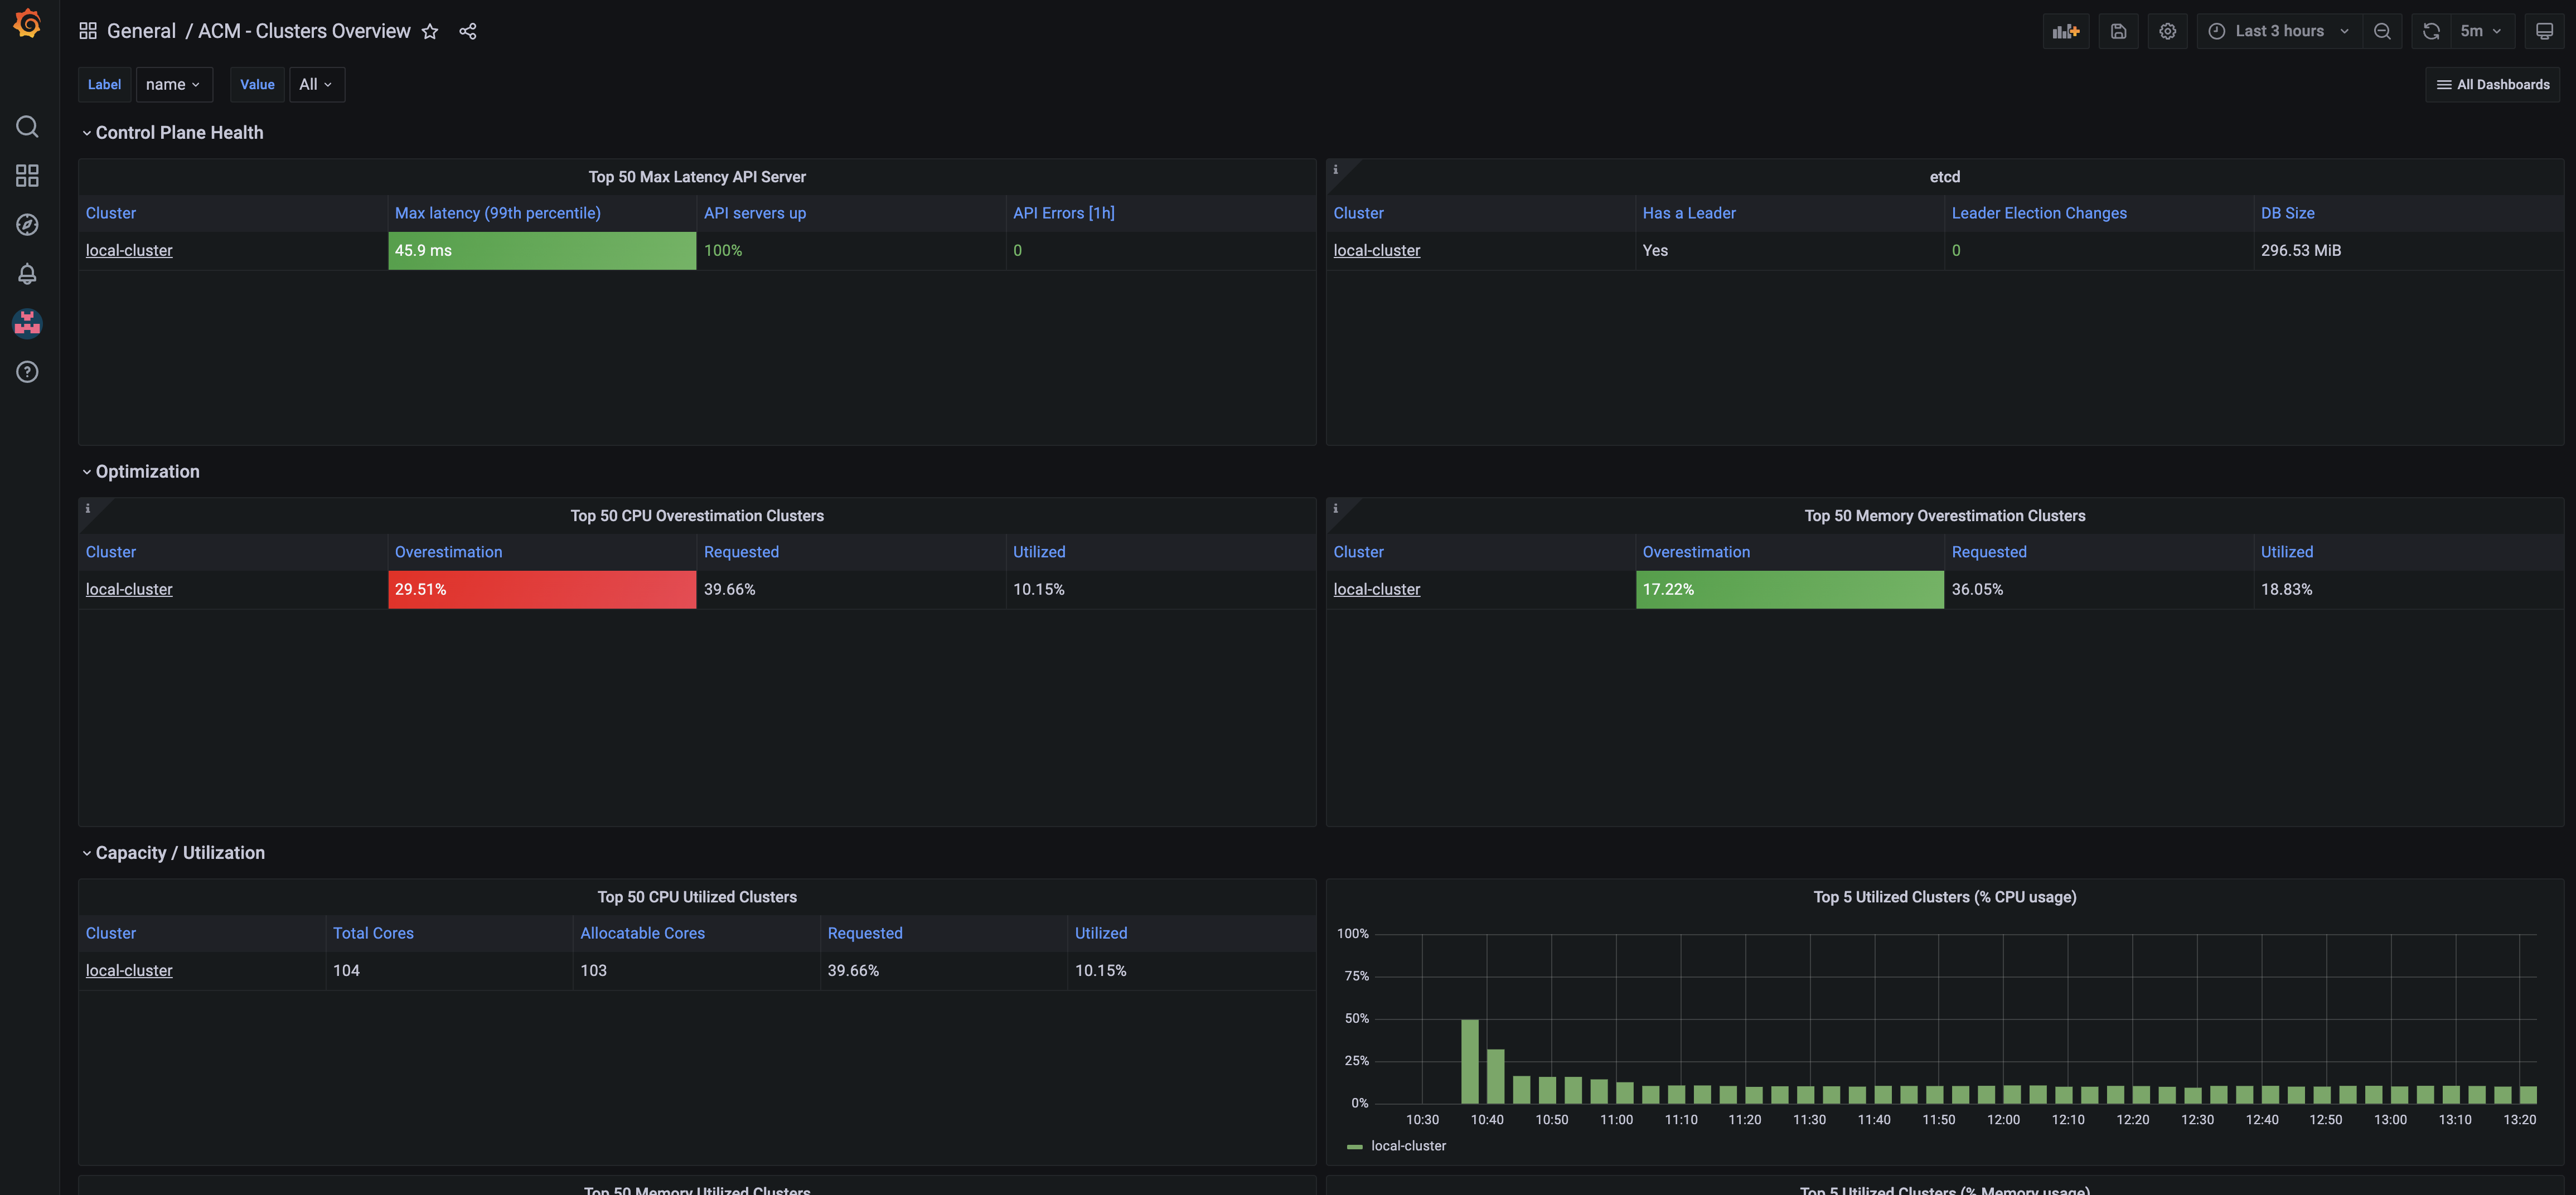
Get back to ACM, in Infrastructure and Clusters. Click on the Grafana link.
-
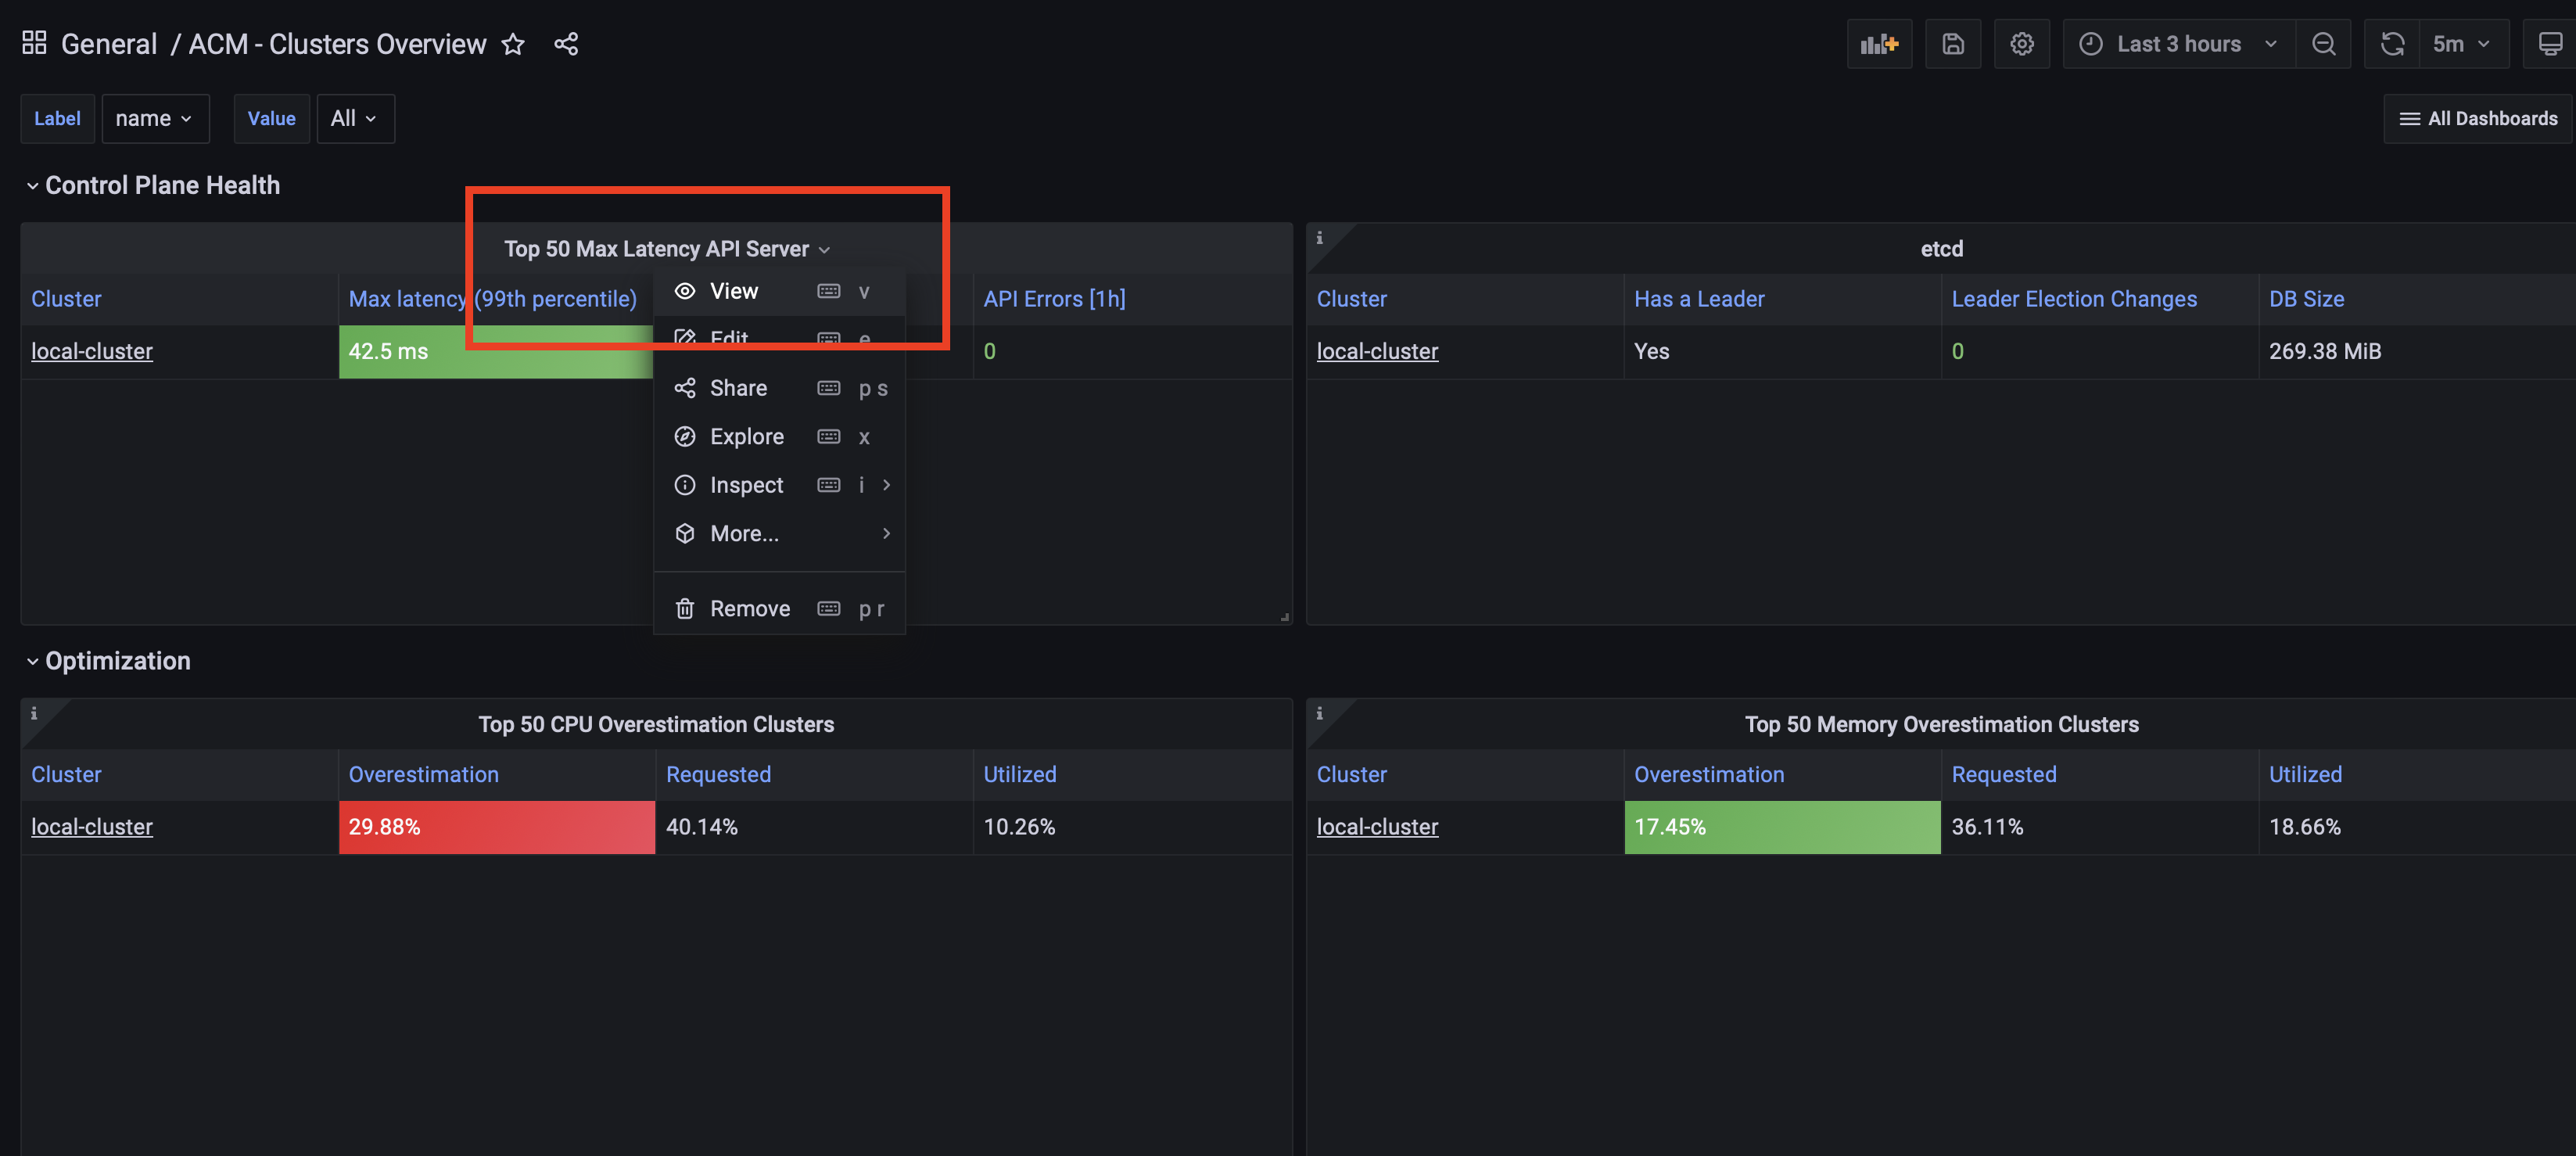
Click on Top 50 Max Latency API Server title followed by View.
-
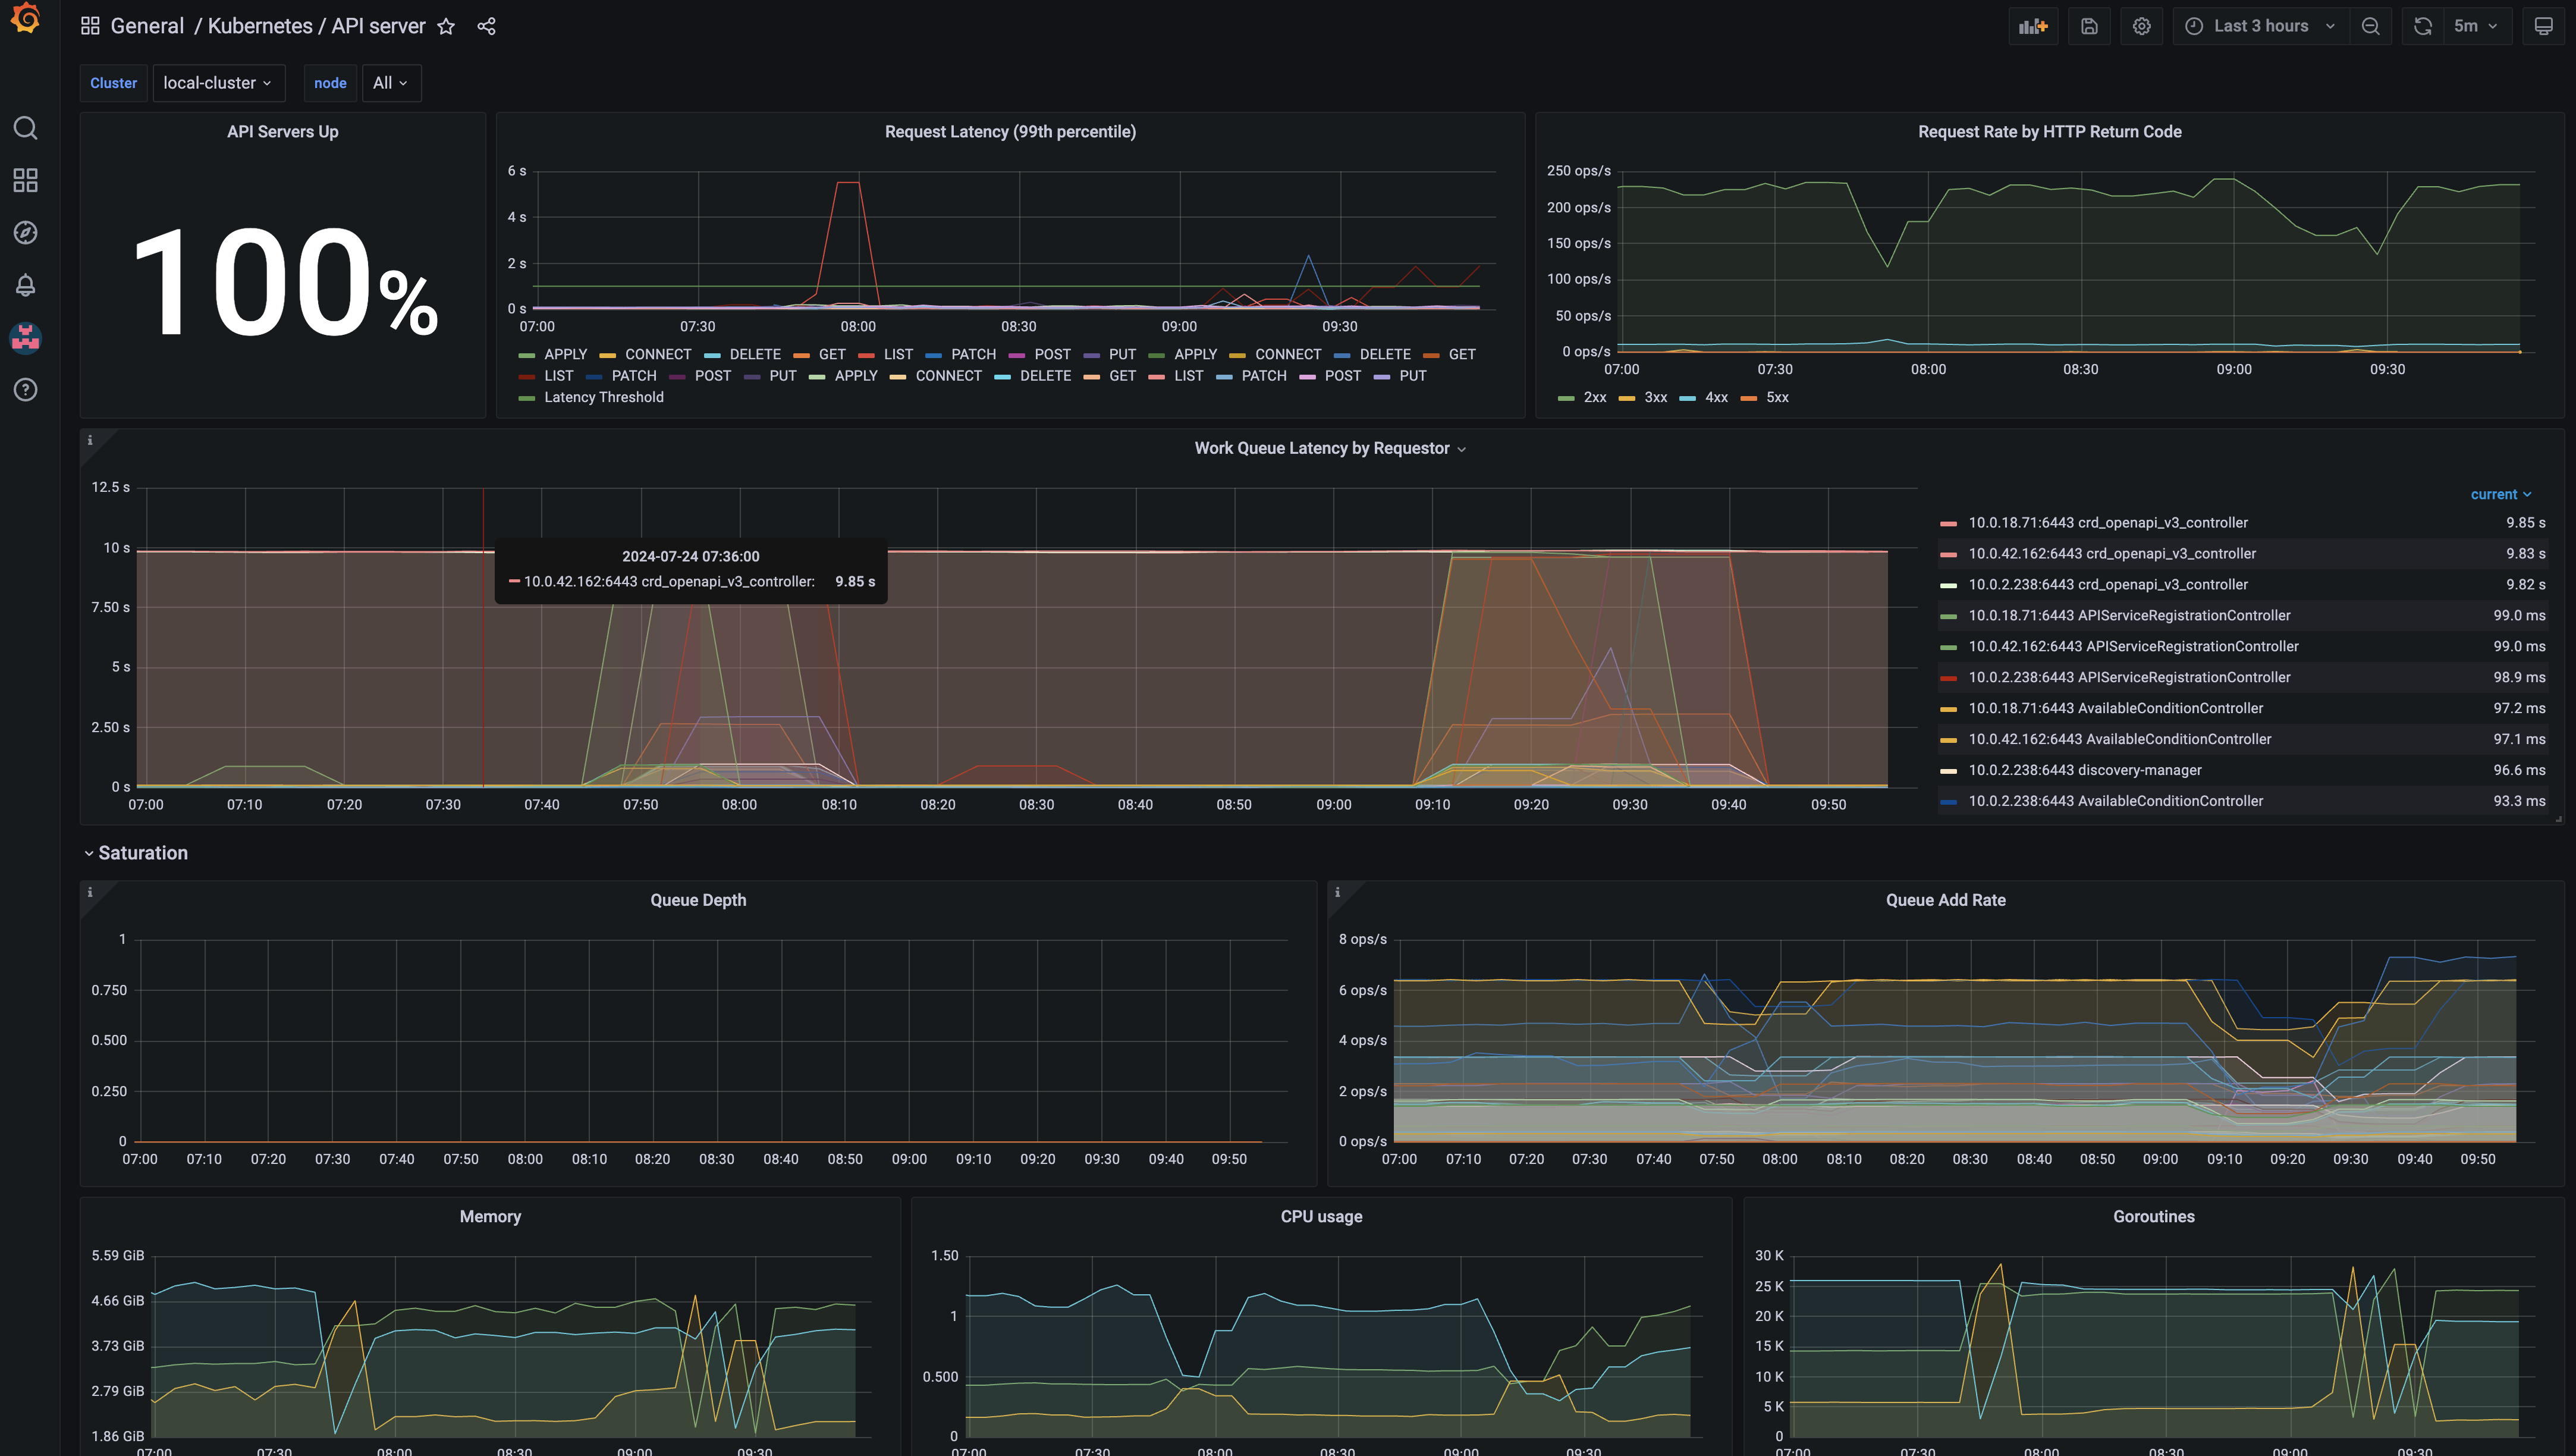
Click on local-cluster to open the dashboard.
Notice the amount of information thats avaiable here from our cluster APIs, you can see what the top Requests are, and how many resources they consumed, by CPU, memory and much more. You can configure alerts from Grafana to be forward to any system that you might currently use for further monitoring and troubleshooting.
-
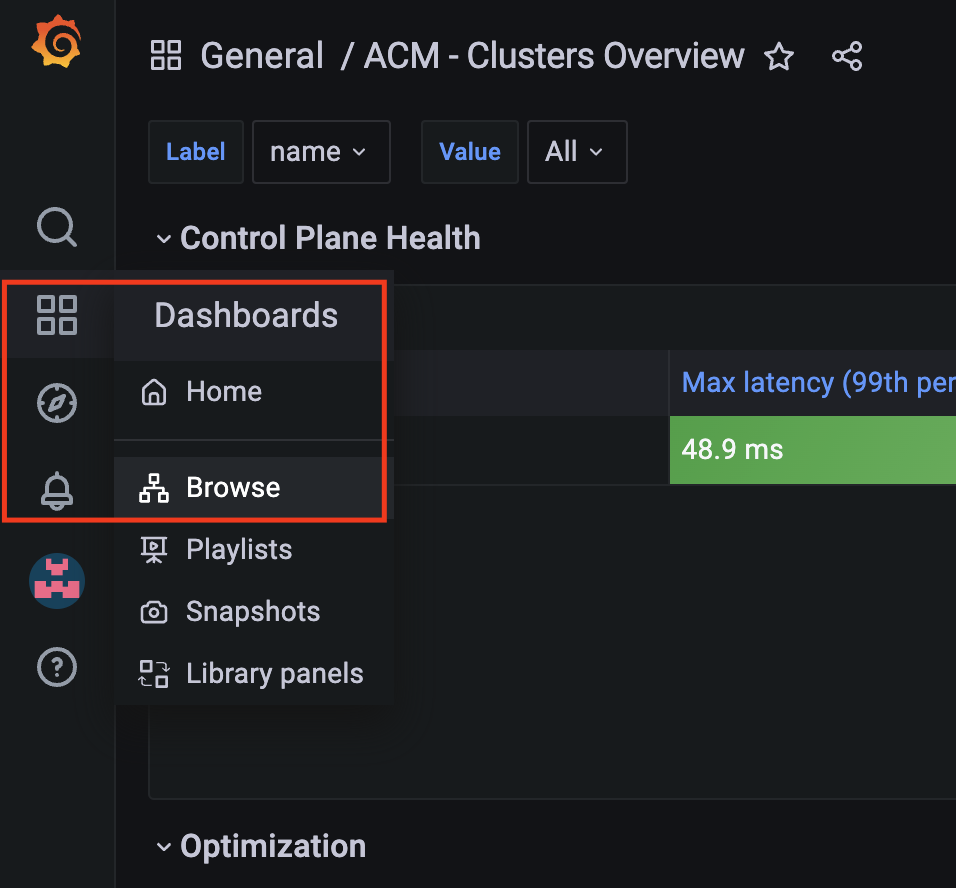
Let’s have a look at the workloads inside our cluster like Virtual Machines, let’s Navigate to the side bar and click on Browse
-
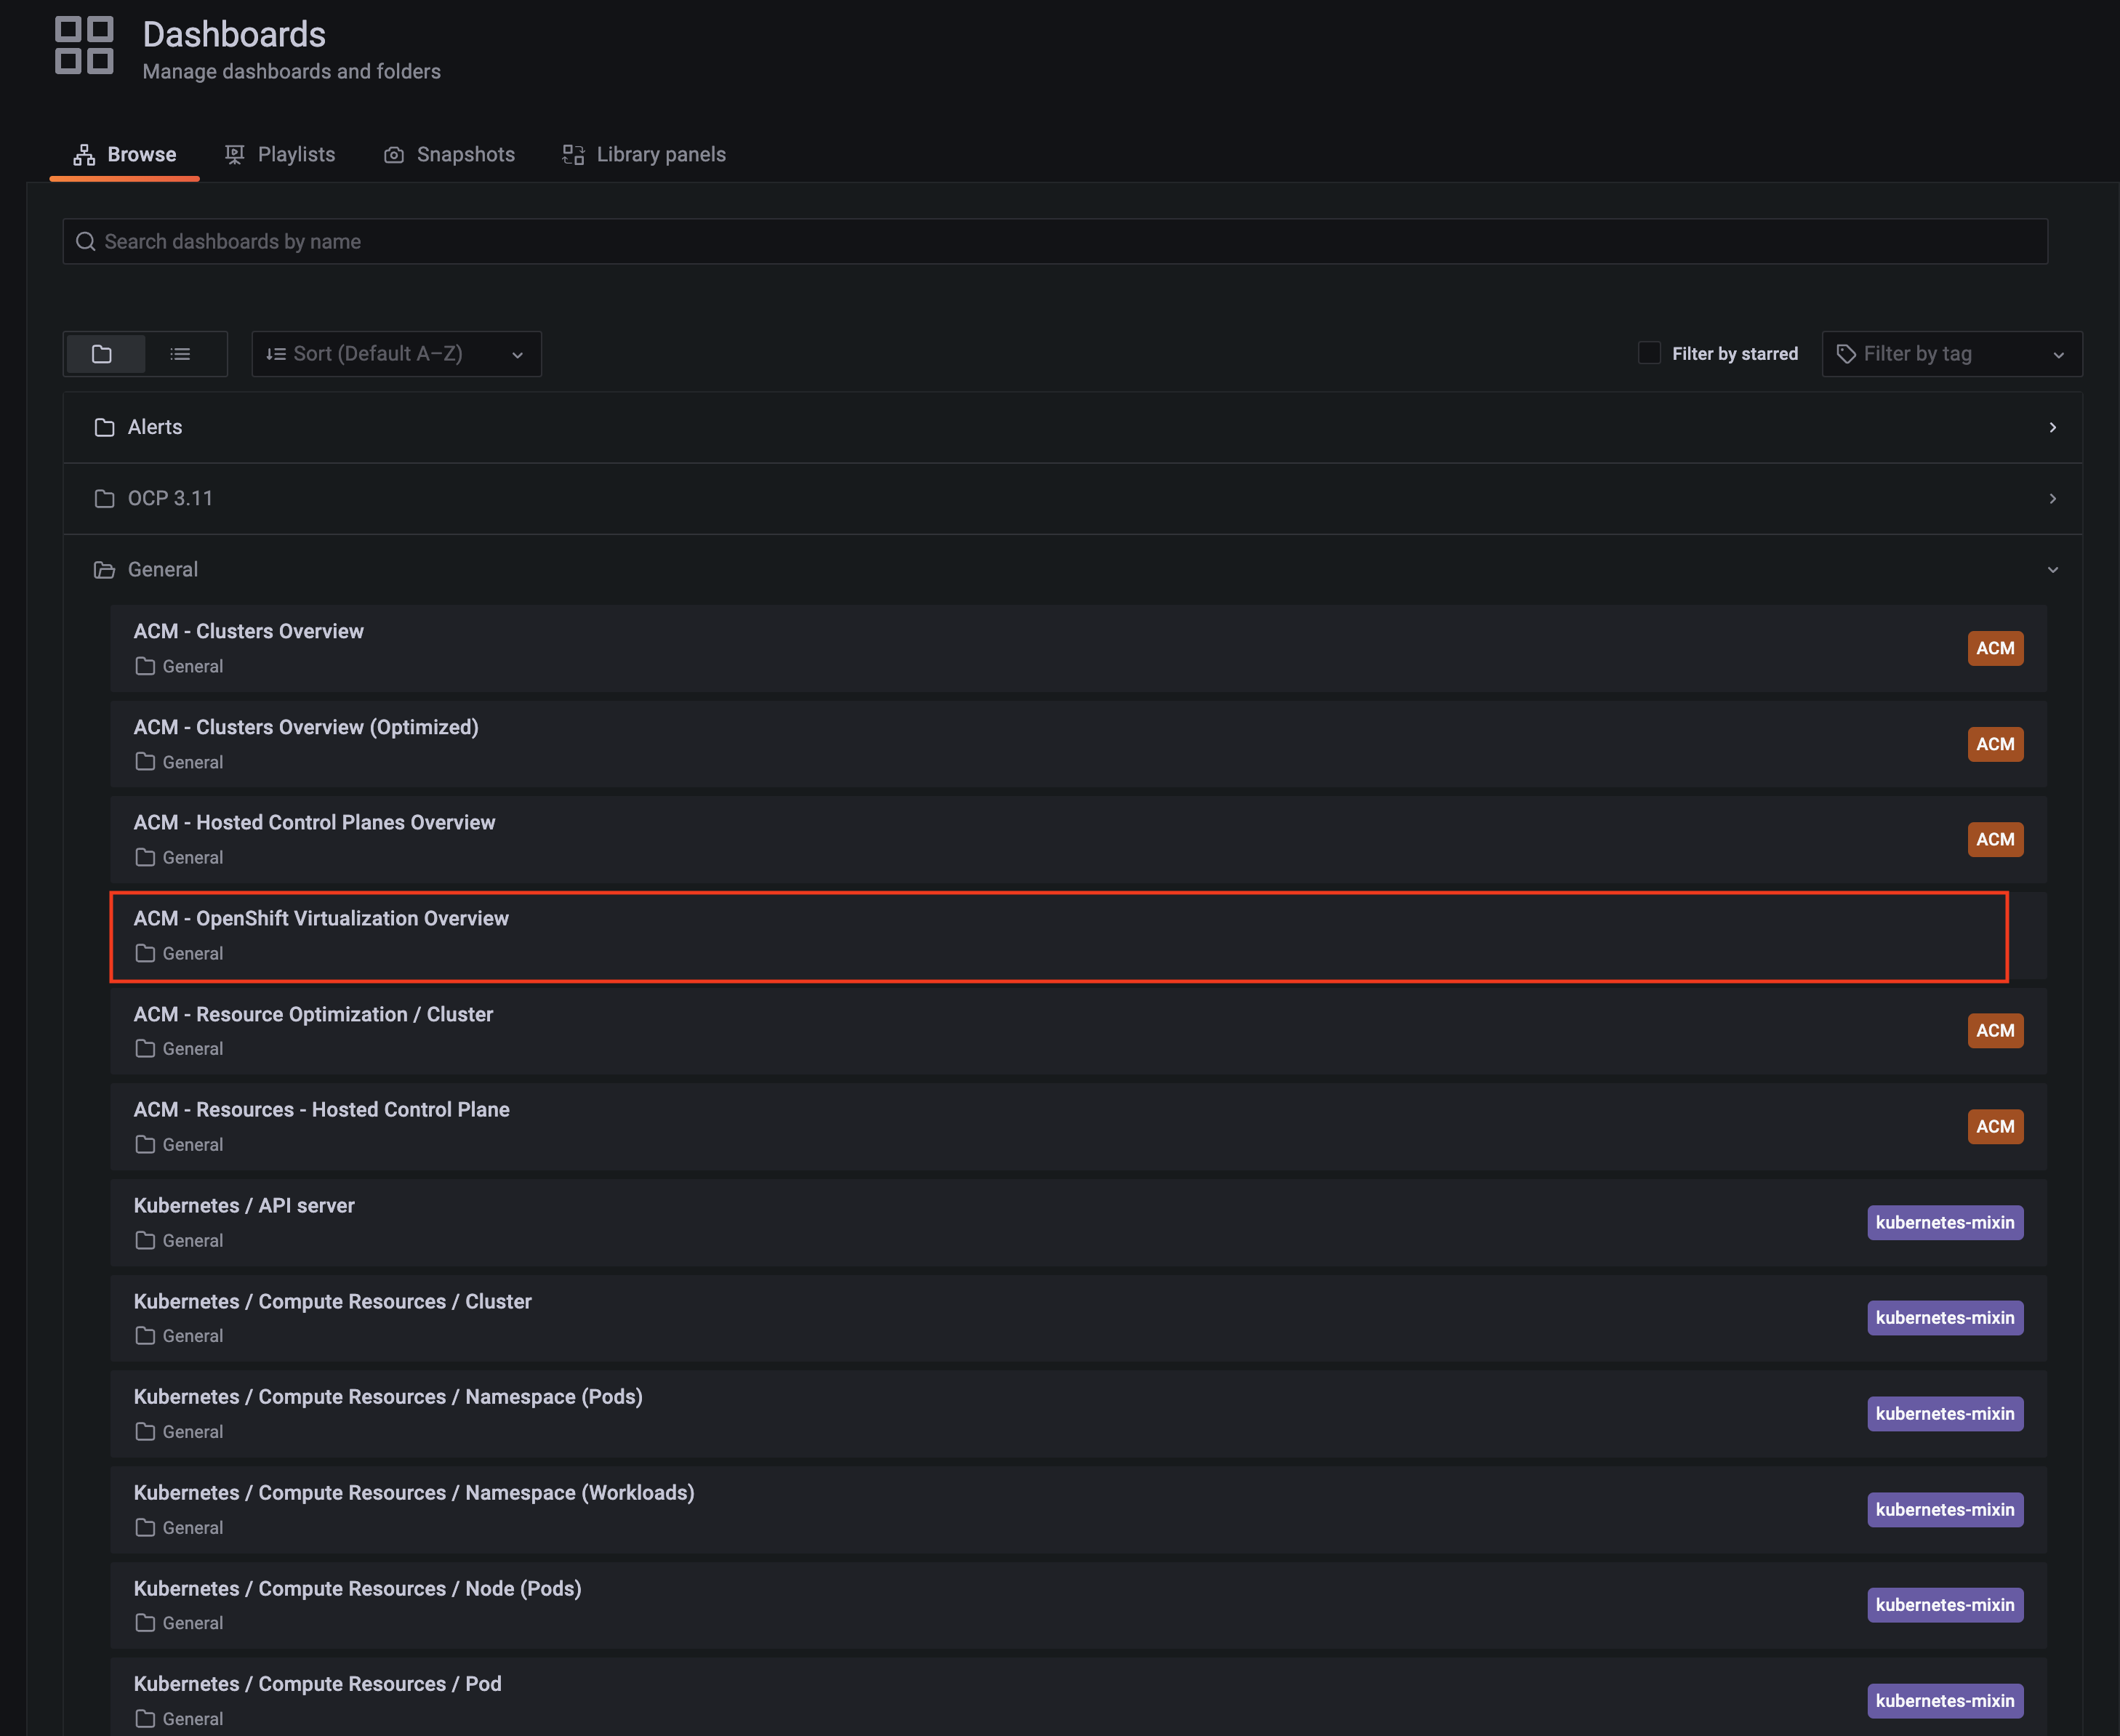
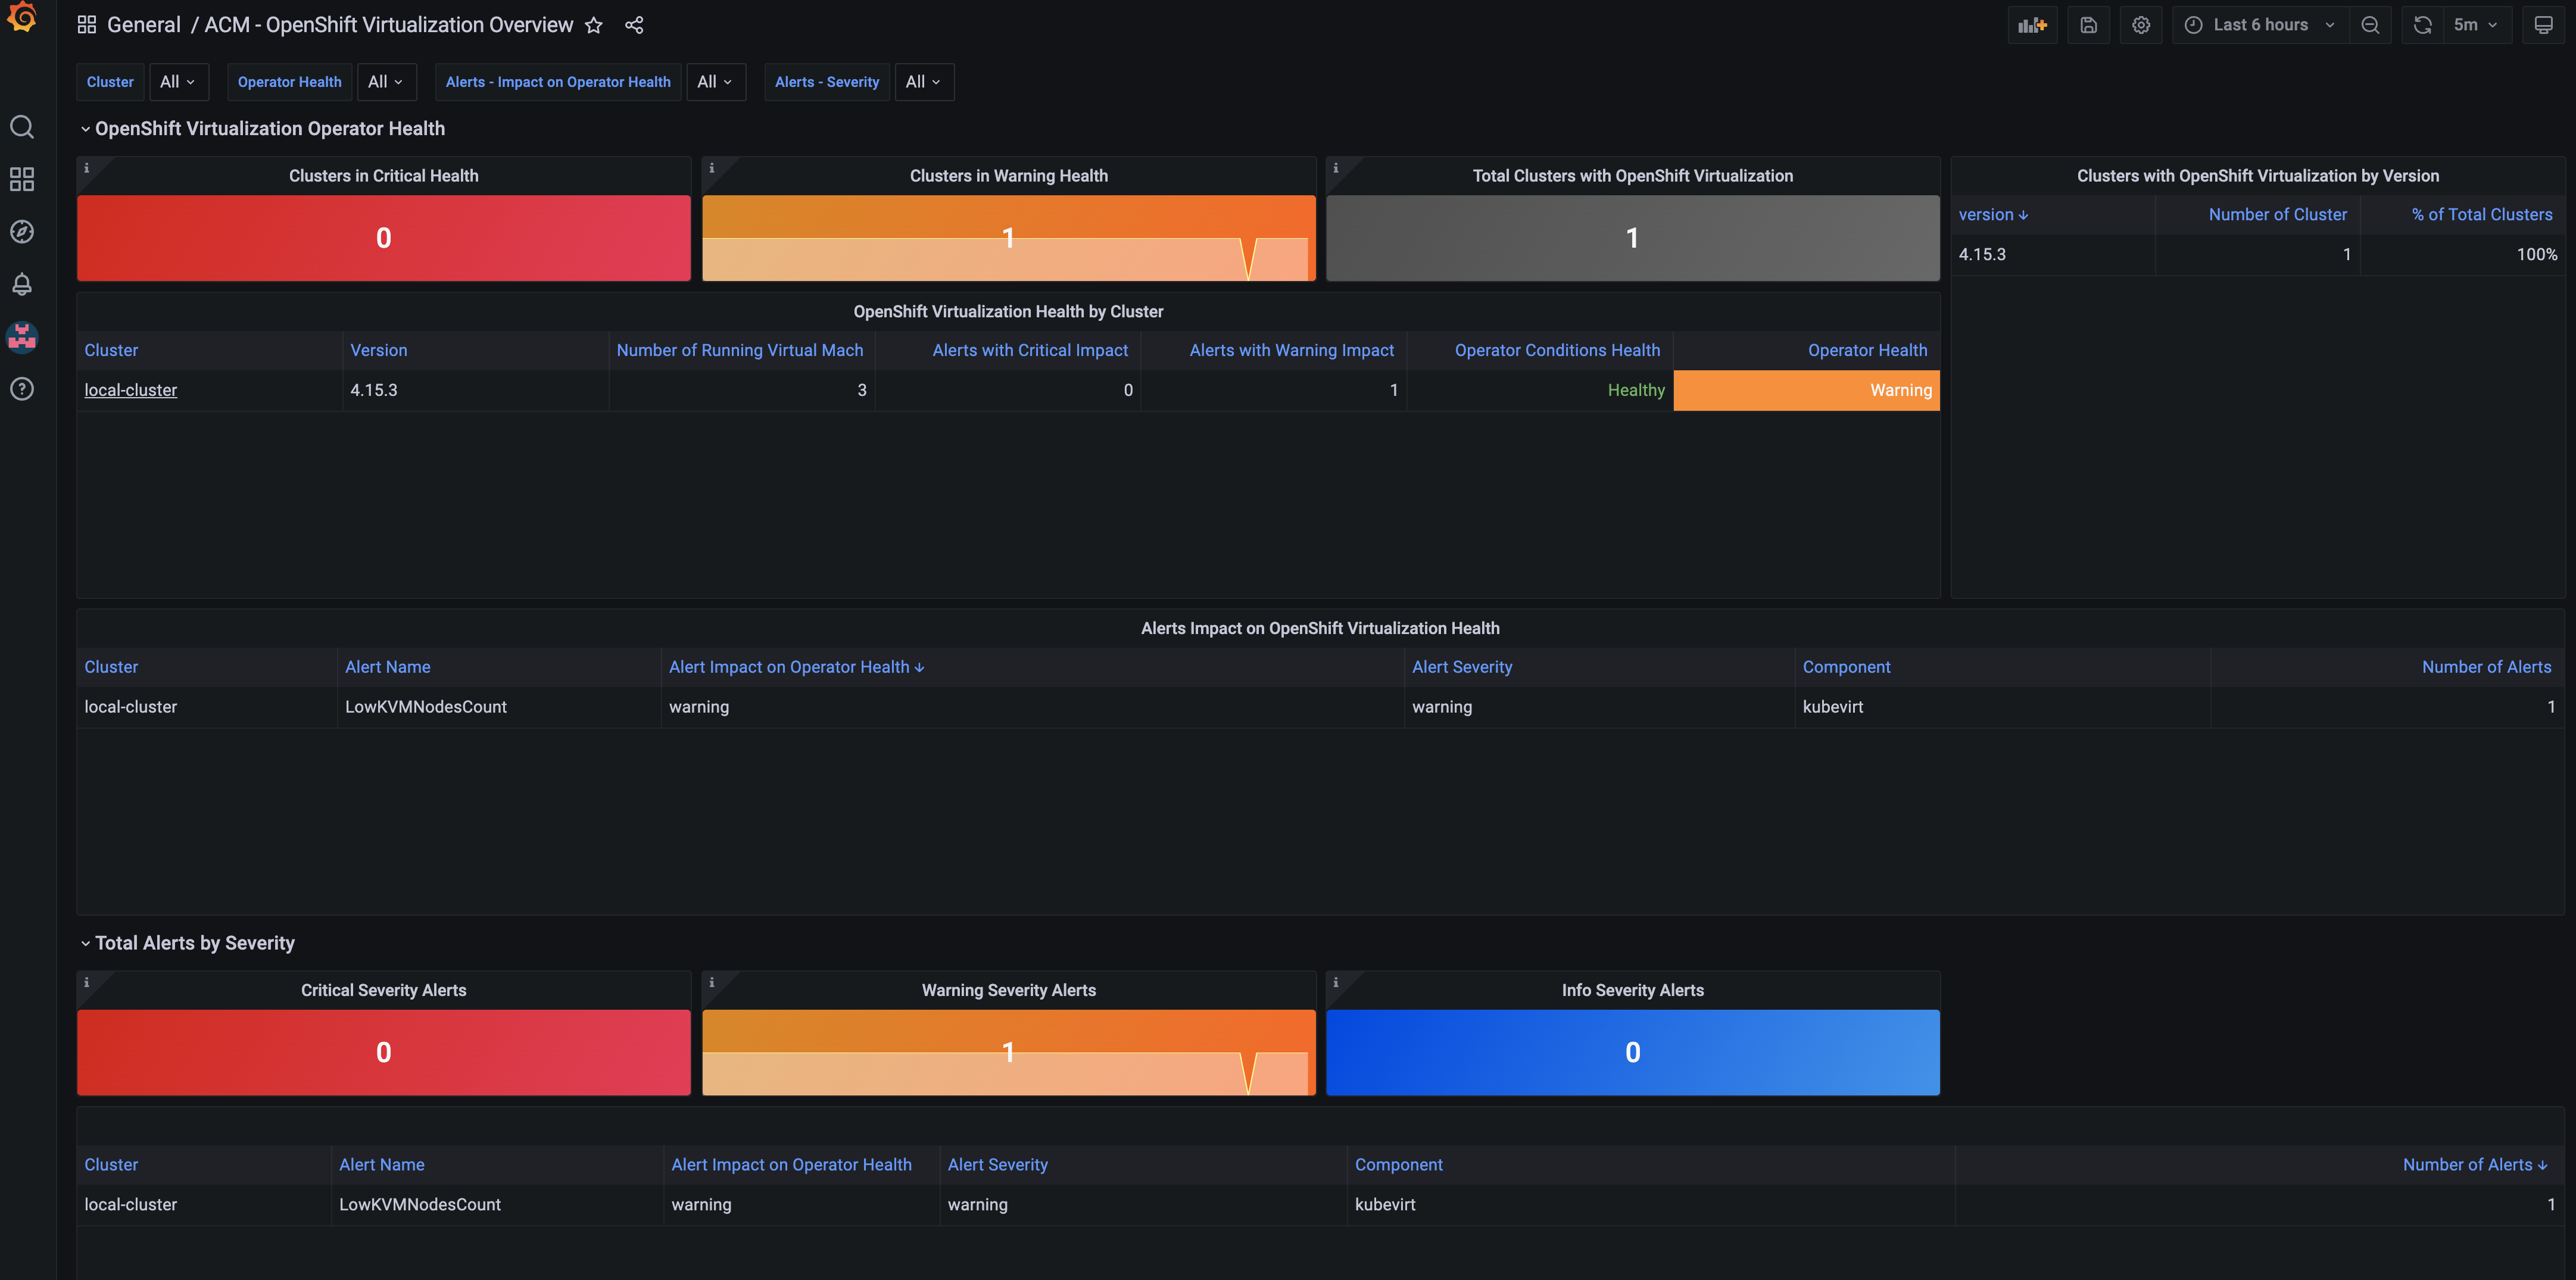
Once there notice all of the out of the box dashboards that are available. Custom dashboards can also be created and configure. Let’s dive deeper into these dashboards and select the ACM - OpenShift Virtualization Overview
-
This Dashboard showcases the Health of the OpenShift Virtualization Operator - kubevirt - and what resources - virtual machines - are available and and what the state is.
Feel free to explore around the multiple Grafana dashboards to familiarize yourself with whats included out of the box.
SAY:
The Observability feature in Red Hat Advanced Cluster Management for Kubernetes enhances cluster resource management by providing comprehensive visibility into the health, performance, and utilization of cluster resources.
By integrating with Grafana, it offers real-time monitoring and detailed dashboards that display key metrics for nodes, pods, and applications.
This allows administrators to identify and address performance bottlenecks, optimize resource allocation, and ensure efficient operation of the clusters.
The ability to set up alerts and analyze historical data further aids in proactive management, enabling better planning and timely resolution of potential issues, ultimately leading to a more resilient and well-optimized Kubernetes environment.
Summary
SAY:
In this module, we demonstrated the centralized view and management capabilities of ACM, observed the deployment and monitoring of VMs, and highlighted the observability features that ensure the health and performance of our virtual machines.
By leveraging ACM, we can efficiently manage and scale our VM deployments across different infrastructures, ensuring consistency and reducing the potential for human error.
| Please delete this demo from the Red Hat Demo Platform once you have completed practicing or delivering it to your customer. |
