Agentic Troubleshooting
Feature Overview
Agentic Troubleshooting combines OpenShift Lightspeed with OCP 5’s agentic operator to provide AI-driven investigation and remediation of cluster and application issues. It operates in two modes:
-
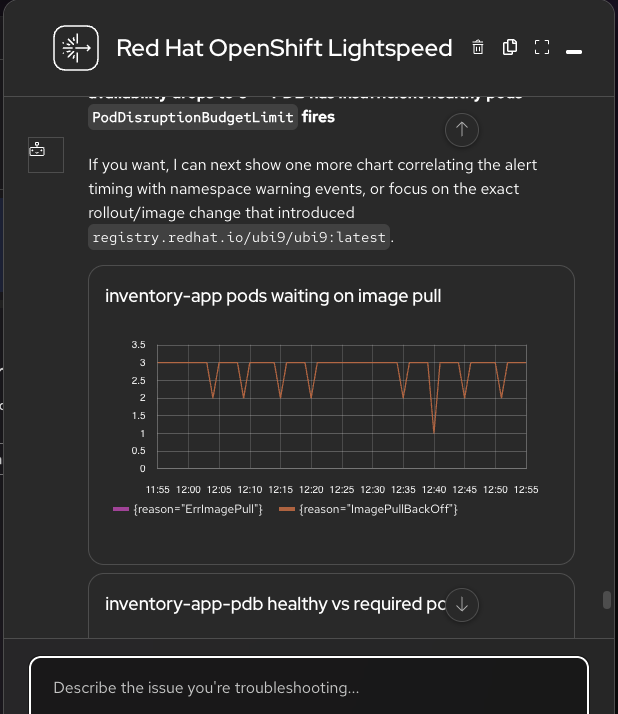
User-initiated — An SRE uses Lightspeed chat in troubleshooting mode to investigate issues through natural language. The AI queries cluster state via MCP, correlates metrics and logs, and provides a mitigation plan. It can also dynamically generate inline Perses charts for visualization, which can be exported to dedicated dashboards.
-
Autonomous (agentic) — The Alertmanager adapter monitors critical alerts and automatically triggers background investigations. The agent produces a step-by-step remediation plan in a "Proposed" state. An operations lead reviews findings in the Agentic Runs UI and authorizes execution with a single click.
Your environment includes pre-deployed applications with intentional issues designed to exercise these workflows:
| Alert | Namespace | Severity | Scenario |
|---|---|---|---|
|
payments |
Critical |
Database connection exhaustion causing 5xx errors |
|
payments |
Warning |
Connection pool leak in reporting-service |
|
inventory |
Critical |
PDB minAvailable exceeds available pods |
|
catalog-service |
Warning |
Pod stuck in not-ready state |
|
user-imports |
Warning |
Pod pending due to unsatisfiable nodeSelector |
These issues are designed to leave a causal trail — cascading failures with an underlying root cause — rather than isolated symptoms. The agentic system will explore this trail, correlating metrics, logs, and resource state to identify the root cause and propose targeted remediation.
Before You Begin
-
Verify the troubleshooting applications are deployed. You should expect to see a mix of
Running,Completed, andImagePullBackOffstatuses — this is intentional, as these broken states are what the agentic system will investigate:oc get pods -n payments && \ oc get pods -n catalog-service && \ oc get pods -n inventory && \ oc get pods -n service-meshExpected output (example)NAME READY STATUS RESTARTS AGE payments-api-c7c648878-k2rww 1/1 Running 0 25h postgres-5bd4d575fb-crf6z 2/2 Running 0 25h reporting-service-6d7f67656f-ktfck 1/1 Running 0 25h reporting-service-rollout-gg5wc 0/1 Completed 0 25h NAME READY STATUS RESTARTS AGE catalog-index-service-5b698694db-rjthx 0/1 Running 0 25h NAME READY STATUS RESTARTS AGE inventory-app-6479f867db-2c25c 0/1 ImagePullBackOff 0 28m inventory-app-6479f867db-qgcz4 0/1 ImagePullBackOff 0 28m inventory-app-6479f867db-tq5zc 0/1 ImagePullBackOff 0 28m NAME READY STATUS RESTARTS AGE backend-54d6d7b87c-r8qqh 1/1 Running 0 28m frontend-6cbbd65959-b7z8m 1/1 Running 0 28m
-
Navigate to Observe > Alerting in the OpenShift console.
-
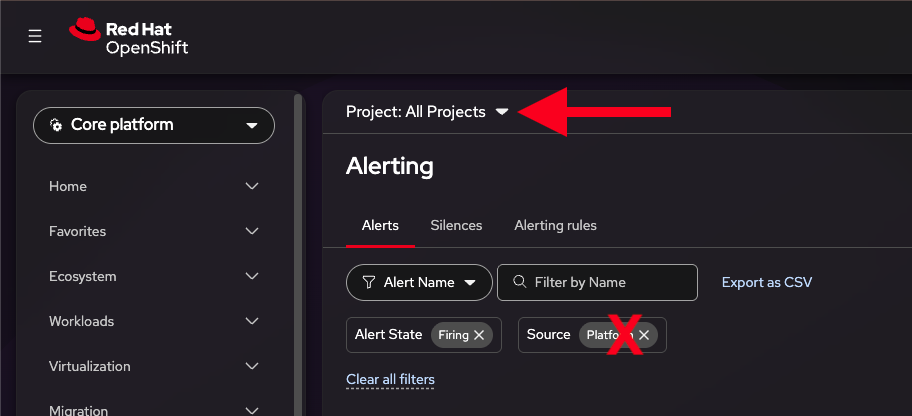
Select All Projects from the project dropdown, and remove the Platform filter so that both Platform and Application alerts are visible.
-
Confirm that you see two Critical alerts (
PaymentErrorRateHighandPodDisruptionBudgetLimit), a Warning alert (PostgresqlTooManyConnections), and other Warning and Info alerts that will be used in later exercises.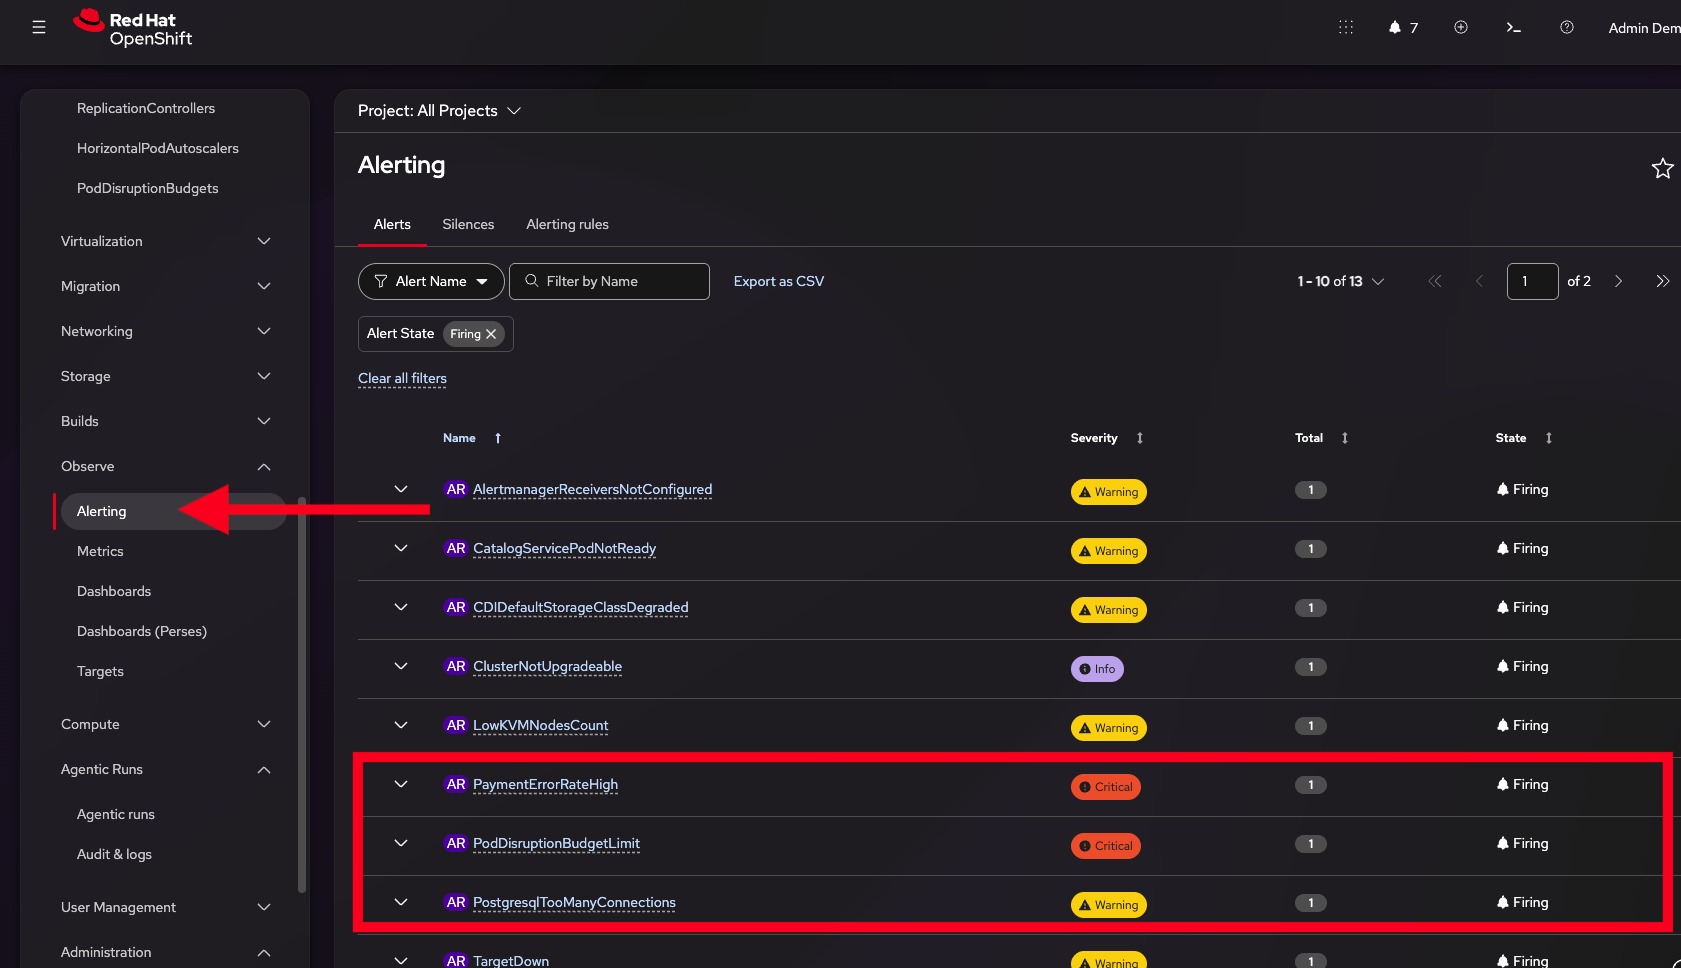
Hands-on Exercises
Exercise 1: Investigate a Timeout Issue (User-Initiated)
In this exercise, you will test Lightspeed’s ability to troubleshoot a cluster issue that does not have an associated Prometheus alert — a timeout connection problem in the service-mesh namespace, where a frontend pod is failing to reach a backend service due to a misconfigured NetworkPolicy.
-
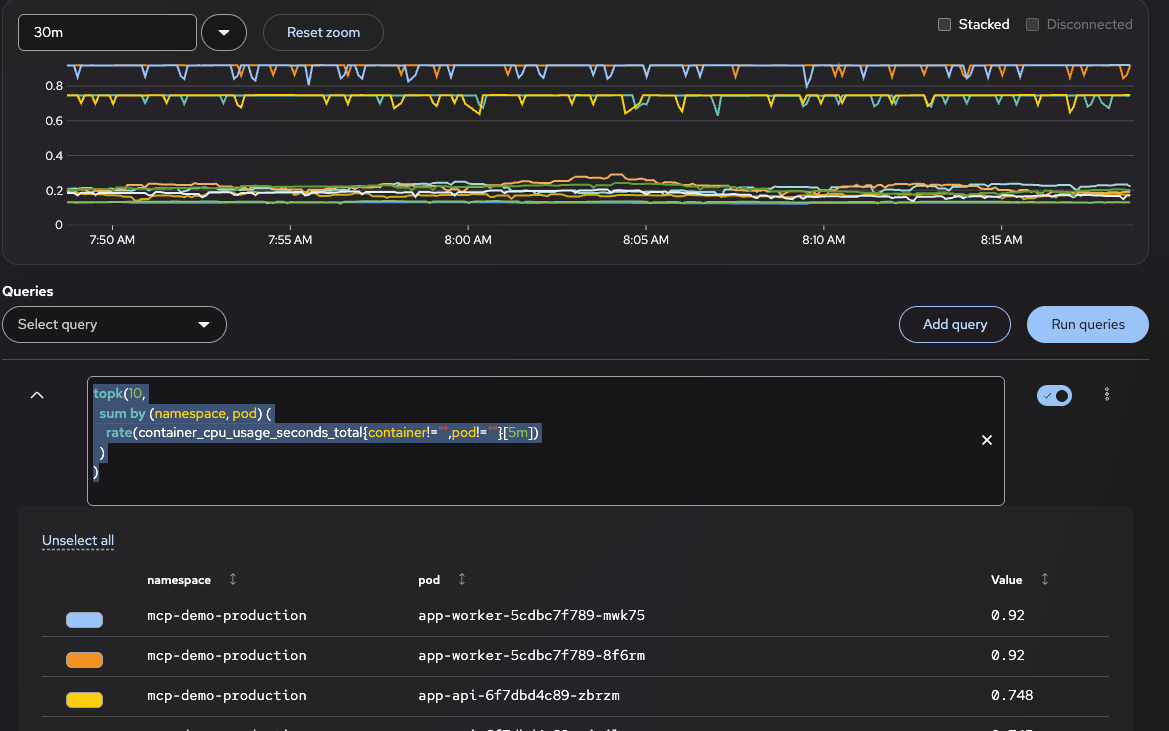
Open the OpenShift console and navigate to Observe > Metrics to get familiar with the current state. Try running this example query to see the top CPU consumers:
topk(10,
  sum by (namespace, pod) (
    rate(container_cpu_usage_seconds_total{container!="",pod!=""}[5m])
  )
)
-
Open the OpenShift Lightspeed chat by clicking the chat icon in the bottom right of the console.
-
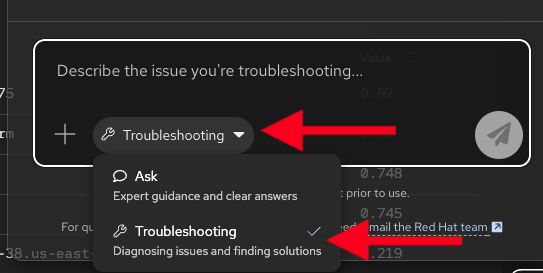
Select the troubleshooting mode from the mode selector.
-
Ask Lightspeed to investigate the timeout issue:
"Investigate the timeout connection in the service-mesh namespace"
Lightspeed will query the MCP server, examine pod logs and events, and identify the root cause — a NetworkPolicy blocking the frontend from reaching the backend service.
During investigation, Lightspeed may prompt you to approve certain tools such as pod_exec. More powerful tools require explicit approval before the agent can use them. Click Approve to allow Lightspeed to proceed. It is normal forpod_execto occasionally fail — security-hardened pods on OpenShift use minimal container images that may not include common shell utilities likess,netstat, ordig. Lightspeed uses any available signals from a wide range of components (pod logs, events, Prometheus metrics, resource state) to analyze and correlate issues, so a failed exec does not prevent a successful investigation.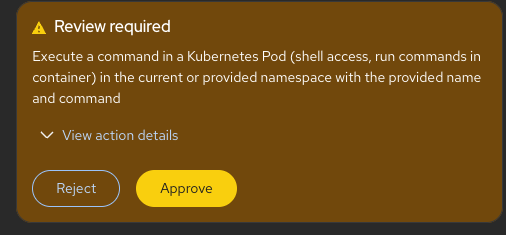
-
Continue the conversation with follow-up prompts:
"Identify recent changes that may have caused this and suggest remediation"
-
Review the mitigation plan that Lightspeed provides. It should include correlation evidence and a read-only remediation plan.
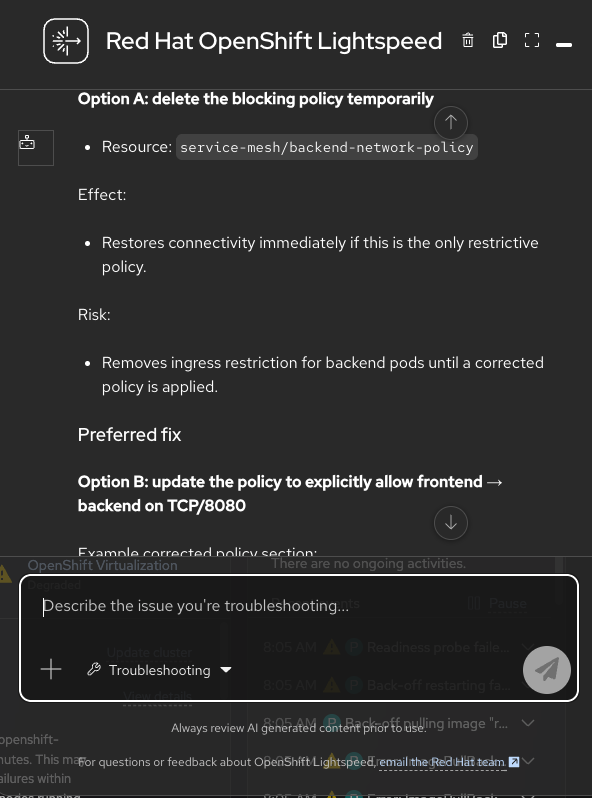
Do not execute the remediation steps manually. In Exercise 4, the agentic system will provide a more structured way to review and execute remediation plans with full audit trails.
This conversational approach to troubleshooting means SREs can investigate complex issues without memorizing oc commands, PromQL syntax, or navigating between multiple console views. Lightspeed handles the tool orchestration while the SRE focuses on understanding the problem and deciding what to do about it.
Exercise 2: Investigate a Critical Alert (User-Initiated)
This exercise validates Lightspeed’s ability to correlate standard infrastructure alerts and provide actionable remediation guidance.
-
Recall from the Before You Begin section that the
PodDisruptionBudgetLimitalert is firing in theinventorynamespace. In this exercise, we will ask Lightspeed to investigate it. -
Open the Lightspeed chat (in troubleshooting mode) and ask it to investigate the alert:
"Investigate the root cause of the firing PodDisruptionBudgetLimit alert"
Lightspeed will use multiple tools, examine pod state and logs, correlate Prometheus metrics, and identify the root cause (a typo in the image tag
laetst— it should have beenlatest). -
Review the response. Lightspeed should provide a mitigation plan based on relevant in-cluster data points — Kubernetes resource state, pod logs, and Prometheus metrics.
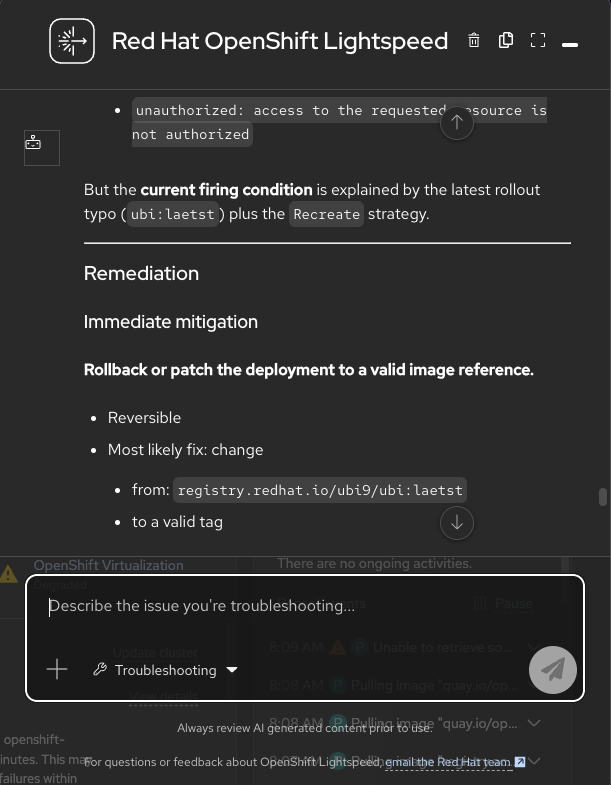
Whether the starting point is a firing Prometheus alert or a vague symptom like "things are slow," Lightspeed follows the same investigative process — correlating multiple data sources to surface the root cause. This makes it equally effective for known alerts and novel issues that don’t yet have monitoring coverage.
Exercise 3: Generate Inline Perses Charts (User-Initiated)
OpenShift Lightspeed can dynamically generate interactive Perses charts directly in the chat UI, making it easy to visualize metrics during a troubleshooting session.
-
First, create a Perses dashboard to receive exported charts. Navigate to Observe > Dashboards (Perses) and click Create to create a new dashboard named
Investigation Hub. Select thepaymentsnamespace.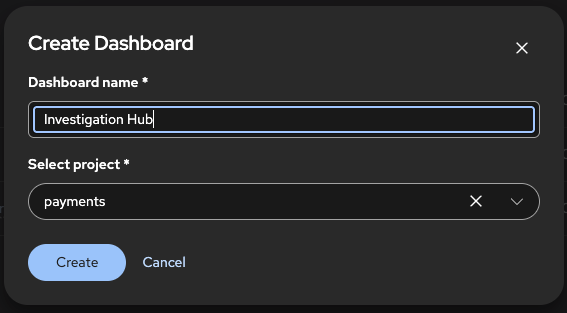
-
In the Lightspeed chat (still in troubleshooting mode), ask for a visualization related to your current investigation:
"Show me the most relevant charts for this investigation"
Or create charts from scratch with specific prompts:
"Which pods are using the most CPU? Show me the top 5. Use Prometheus and visualize."
"Which pods were crashlooping in the last 5 minutes? Use Prometheus and visualize."
-
Verify that an interactive Perses chart is rendered directly in the chat UI.
-
Click the Add To Dashboard button on the chart to export it to your
Investigation Hubdashboard. The chart is now persisted and can be revisited at any time under Observe > Dashboards (Perses) to see updated metrics.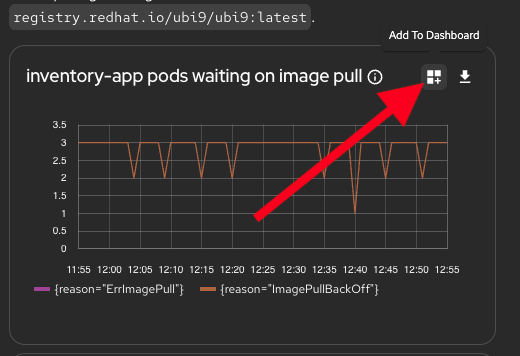
This workflow allows SREs to dynamically construct useful dashboards through natural language — no need to hand-craft PromQL queries or manually configure chart panels. As investigations evolve, charts can be added incrementally, building a living dashboard that captures the metrics most relevant to the issue at hand. These dashboards persist beyond the chat session and continue to show updated metrics, serving as a reference for ongoing monitoring or future incidents.
Exercise 4: Enable Automatic Agentic Runs from Alerts
By default, the agentic alerts adapter runs in the cluster but does not process alerts. In this exercise, you will enable automatic investigation of critical alerts and review the agent’s proposed remediation.
-
First, enable automatic analysis so that agentic runs begin investigating immediately without requiring manual approval:
oc patch approvalpolicy cluster --type merge \ -p '{"spec":{"stages":[{"name":"Analysis","approval":"Automatic"},{"name":"Execution","approval":"Manual"},{"name":"Verification","approval":"Automatic"}]}}' -
Enable the alerts adapter to process critical alerts:
oc get configmap alerts-adapter-config -n openshift-lightspeed -o json \ | jq '.data["config.yaml"] |= gsub("# +- critical"; " - critical")' \ | oc apply -f - -
The critical alerts you confirmed earlier (
PaymentErrorRateHighandPodDisruptionBudgetLimit) will now be automatically detected by the agentic system, analyzed, and remediation plans generated for each one. -
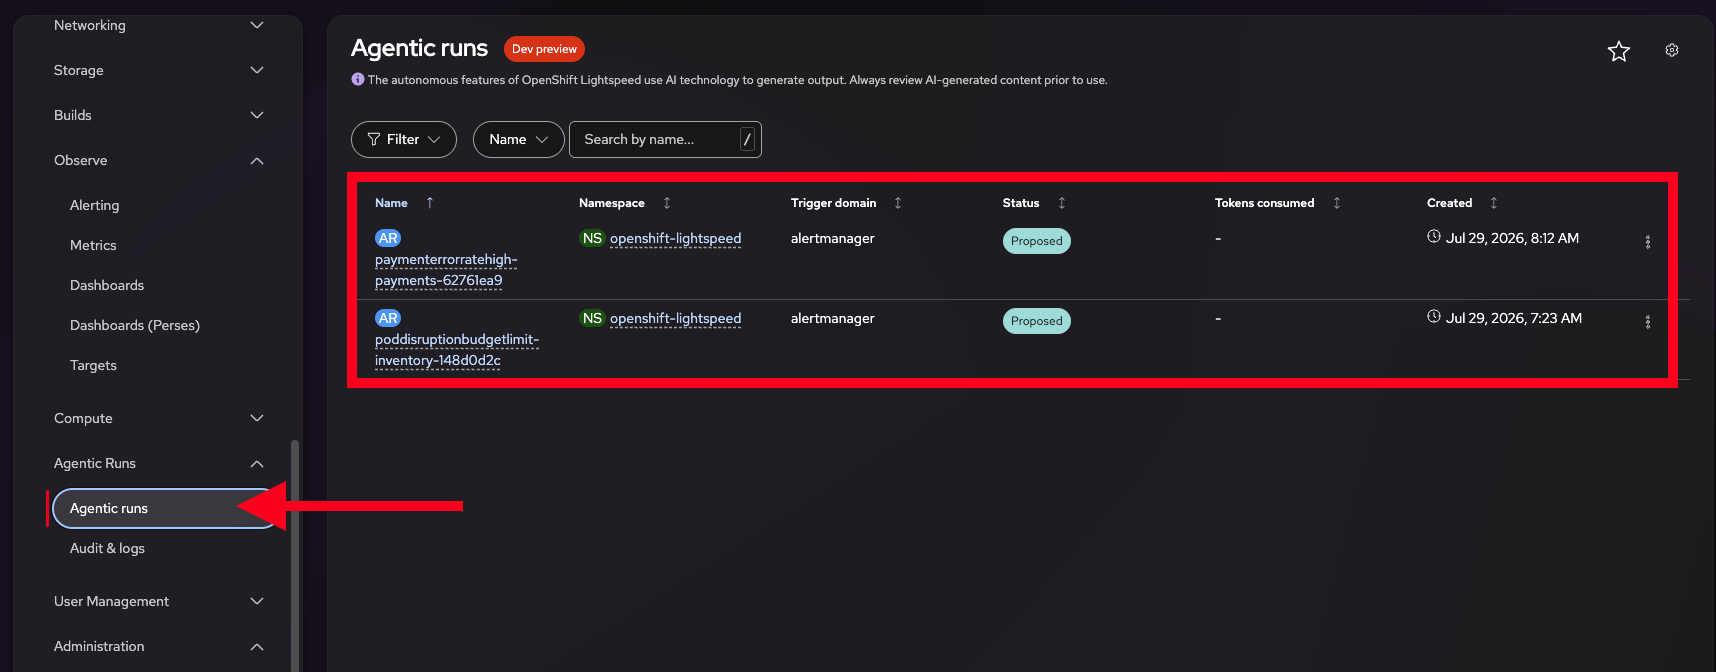
Navigate to the Agentic Runs UI to see the investigations in progress. The runs may initially be in the Analyzing phase — you can watch the agent work in real time as it queries cluster state, correlates data, and builds its findings.
-
You can also manage AgenticRuns from the command line using the
oc agenticCLI plugin. List all runs:oc agentic run listGet the details of the
PaymentErrorRateHighrun:oc agentic run get $(oc agentic run list -o json | jq -r '.items[].metadata.name' | grep -i payment | head -1)The
oc agenticCLI supports the full lifecycle of AgenticRuns: approve or deny proposed remediations (oc agentic run approve/oc agentic run deny), watch live agent logs (oc agentic run logs), or create a new run on demand (oc agentic run create). Runoc agentic --helpto explore all available commands. -
Once an AgenticRun moves to the Proposed phase, open the run corresponding to the
PaymentErrorRateHighalert to drill into the step-by-step findings and remediation plan.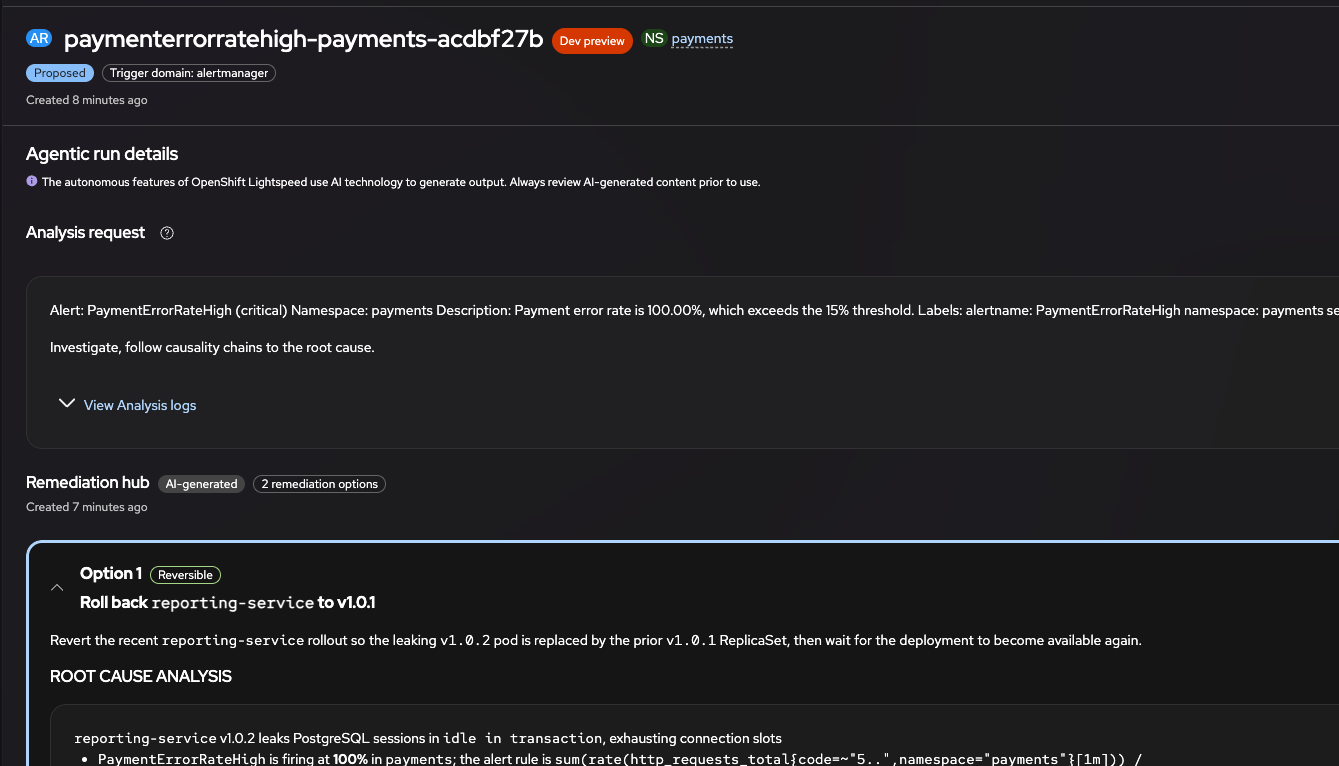 If a run fails or does not propose the right fix, delete it to run it again
The investigation is done by an AI model, so the result can differ from one run to the next. Delete the AgenticRun and let the agentic system start a new one if you see either of these:
-
The run shows Failed, for example with
Connection error,422 Unprocessable Entityorresult CR missing checks. -
The
PaymentErrorRateHighrun does not offer an option to roll backreporting-serviceto the previous version. For example, it only suggests increasingmax_connections, or it reports that no action is needed.
Delete the
PaymentErrorRateHighrun:oc get agenticrun -n openshift-lightspeed -o name | grep -i payment | xargs oc delete -n openshift-lightspeedA new run for the same alert starts within about 30 seconds. Wait for it to reach the Proposed phase again, then continue with the next step. For the
PodDisruptionBudgetLimitrun, use the same command withinventoryinstead ofpayment. -
-
Review the proposed remediation steps. Select the option that recommends rolling back to the last known good version — and click the Execute remediation button to authorize the change. It will ask you once again to confirm the execution. Click Execute Remediation once more to confirm.
-
Once the remediation is executed, review the post-execution summary.
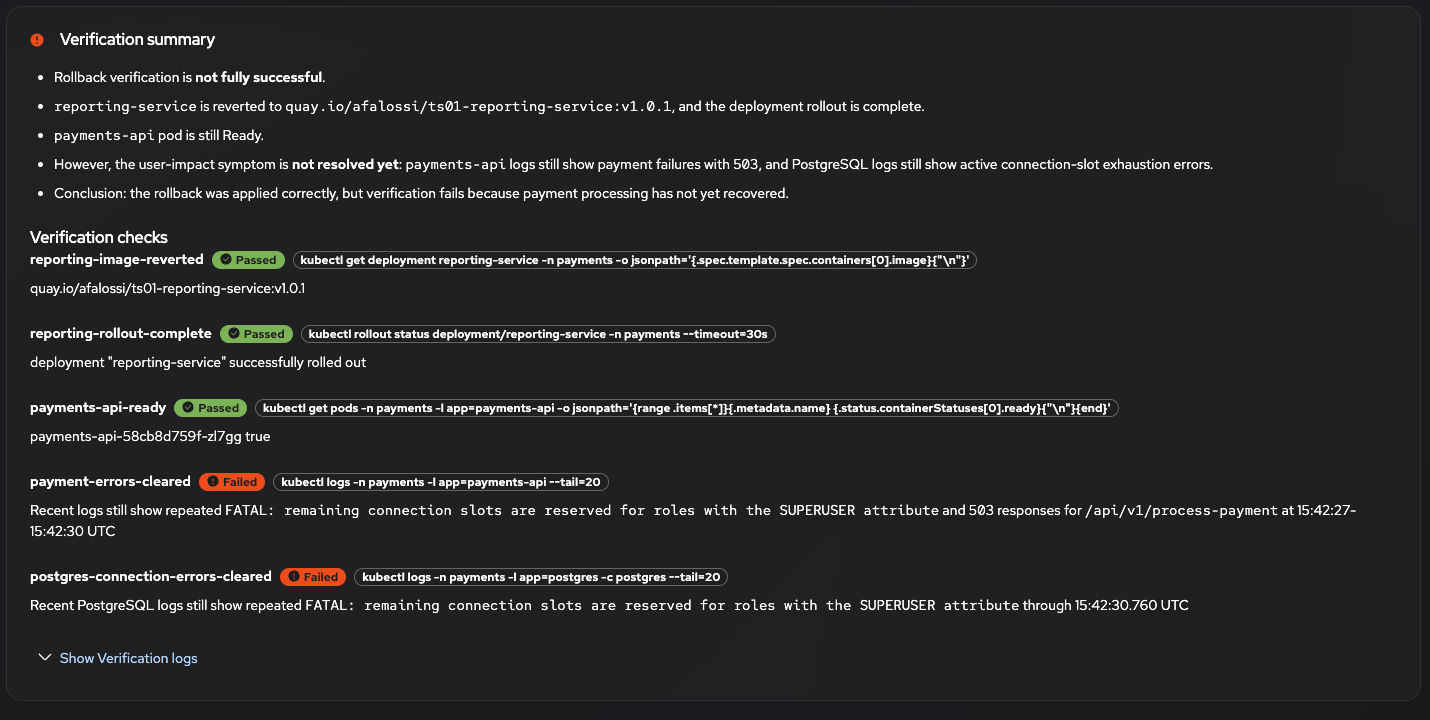
The remediation may show errors and move into the Escalating state. The underlying issue should still be resolved — return to Observe > Alerting to verify the PaymentErrorRateHighalert has stopped firing. The escalation workflow is designed for cases where automated remediation is insufficient, allowing operators to open a support case with the diagnostic details collected during the investigation.
This is the full agentic loop — from alert detection through investigation, proposal, approval, and execution — with a human in the loop at every decision point. The system handles the heavy lifting of data correlation and remediation execution, while the operations team retains full control over what changes are made to the cluster.
Key Takeaways
-
Lightspeed’s troubleshooting mode provides AI-driven root cause analysis through natural language conversation
-
The AI correlates Prometheus metrics, pod logs, and Kubernetes resource state to identify issues
-
Inline Perses charts can be generated during troubleshooting and exported to persistent dashboards
-
The agentic alerts adapter enables autonomous investigation of critical alerts without human initiation
-
All proposed remediation actions require explicit approval before execution