MCP Server
Feature Overview
Model Context Protocol (MCP) servers expose platform APIs as tools that AI agents can discover and invoke using the open MCP standard. Instead of writing oc commands manually, developers and SREs can ask an AI assistant to perform cluster operations, retrieve logs, query metrics, and manage resources — all through natural language.
Your environment includes an OpenShift MCP Server that provides tools for querying and managing OpenShift cluster resources across multiple toolsets:
-
Core — generic resource CRUD (get, list, create, update, delete), pod logs, events
-
Metrics — query Prometheus for CPU, memory, and custom metrics via PromQL
-
Config — manage kubeconfig contexts for multi-cluster operations
-
NetEdge — diagnose OVN networking issues on nodes
-
OSSM — query and manage OpenShift Service Mesh / Istio via Kiali (mesh health, traffic graphs, tracing, Istio config management)
The server implements the MCP specification, allowing any MCP-compatible client (opencode, Claude Desktop, Cursor, VS Code, MCP Inspector, or custom agents) to connect and use cluster tools. RBAC is enforced — the MCP server respects the user’s OpenShift permissions, so a read-only user cannot delete resources even through the AI.
These exercises use opencode, an open source AI coding agent that runs in an mcp-cli pod in your cluster. It is pre-configured with the lab’s LLM and with this MCP server, so you don’t need to install a client or spend your own tokens. Alternatively, you can use the built-in OpenShift Lightspeed chat window for most exercises — it has been pre-configured to use the same MCP server outlined here. However, Exercise 4 (RBAC Enforcement) and Exercise 8 (Read-Only Mode) require an MCP client such as opencode, since they involve switching user tokens and refreshing client-side tool lists, which cannot be done through Lightspeed.
|
Before You Begin
-
Verify the OpenShift MCP server is running:
oc get pods -n openshift-mcp -
Verify the
mcp-clipod, which runs the opencode AI client, is running:oc get pods -n mcp-cli -
Note the MCP server endpoint. opencode is already configured with it; you only need it to connect another MCP client:
https://mcp-server.{openshift_cluster_ingress_domain}/mcp
Core Platform Operations
Exercise 1: Connect Your AI Client to the MCP Server
The MCP server acts on behalf of whoever calls it, so an MCP client needs an OpenShift bearer token. opencode reads the token from the OPENSHIFT_MCP_TOKEN environment variable when it starts.
-
Generate a token for the
mcp-adminuser (has full cluster access) and save it to~/.bashrc(in case your terminal session disconnects):cp ~/.kube/config ~/.kube/config.bak MCP_ADMIN_PASS=$(oc get secret mcp-user-credentials -n openshift-mcp -o jsonpath='{.data.mcp-admin}' | base64 -d) oc login -u mcp-admin -p "${MCP_ADMIN_PASS}" export MCP_ADMIN_TOKEN=$(oc whoami -t) cp ~/.kube/config.bak ~/.kube/config echo "export MCP_ADMIN_TOKEN=$MCP_ADMIN_TOKEN" >> ~/.bashrc echo "mcp-admin token saved in \$MCP_ADMIN_TOKEN"The commands above log in as mcp-adminto obtain the token, then restore the cluster admin session. -
Start opencode in the
mcp-clipod with themcp-admintoken:oc exec -it -n mcp-cli deploy/mcp-cli -- env OPENSHIFT_MCP_TOKEN=$MCP_ADMIN_TOKEN opencodeopencode connects to the MCP server, registered as
openshift, at startup. Its tools appear with anopenshift_prefix (for exampleopenshift_pods_list_in_namespace).opencode is also configured with the MCP Gateway from the next module. It shows as needing authentication until you provide a gateway token in that module — you can ignore it here. -
Verify the connection by asking:
List all pods in namespace openshift-lightspeedConfirm it returns results without you running any
occommands.
Keep opencode open for the following exercises and paste the prompts into it. Before running a command in the terminal, leave opencode: in the opencode session, type /exit. Each exercise shows this as a separate step. To come back to the same conversation afterwards, run the start command again with --continue added after opencode.
|
|
If your terminal disconnects while opencode is running, or opencode does not start (the screen stays blank), an earlier opencode session is probably still running in the Then start opencode again without |
Exercise 2: AI-Assisted Log Retrieval
Retrieving pod logs is one of the most common troubleshooting tasks. The MCP server lets AI assistants fetch logs directly, identify failing pods, and correlate errors — all through conversation.
Your environment includes a demo namespace mcp-demo-logs with two pods:
-
healthy-pod— streams INFO-level request logs every 5 seconds -
failing-pod— crashes in a loop with database connection timeout errors (CrashLoopBackOff)
-
Using your connected AI client, ask:
Show me the logs for the failing pod in namespace mcp-demo-logs -
Observe how the AI responds. It should:
-
Call
pods_list_in_namespaceto discover pod statuses -
Identify
failing-podas the non-Running pod -
Call
pods_logto retrieve the actual error logs (database connection timeouts) -
Clearly distinguish the healthy pod from the failing one
-
-
You can also try:
Are there any pods in CrashLoopBackOff across the cluster?It is normal to see CrashLoopBackOff pods — these are intentional fixtures used in other exercises.
Exercise 3: Create a Resource via AI
The MCP server supports resource creation through natural language. This demonstrates how AI can translate intent into valid Kubernetes YAML and apply it.
-
Ask your AI assistant:
Create a ConfigMap named test-config in namespace default with key app.properties and value environment=staging -
Once the AI confirms the ConfigMap was created, leave opencode. In the opencode session, type
/exit:/exit -
Verify it was created:
oc get cm test-config -n default -o yaml -
Clean up when done:
oc delete cm test-config -n default
Exercise 4: RBAC Enforcement — Read-Only User
| If you are using OpenShift Lightspeed rather than your own MCP-enabled client, you can skip this exercise. |
In production environments, not every user should have write access. The MCP server enforces OpenShift RBAC per-user via bearer token passthrough — a read-only user cannot create, modify, or delete resources even when asking the AI to do so.
-
If opencode is open, leave it. In the opencode session, type
/exit:/exit -
Generate a token for the
mcp-vieweruser (has read-only access):cp ~/.kube/config ~/.kube/config.bak MCP_VIEWER_PASS=$(oc get secret mcp-user-credentials -n openshift-mcp -o jsonpath='{.data.mcp-viewer}' | base64 -d) oc login -u mcp-viewer -p "${MCP_VIEWER_PASS}" export MCP_VIEWER_TOKEN=$(oc whoami -t) cp ~/.kube/config.bak ~/.kube/config echo "mcp-viewer token saved in \$MCP_VIEWER_TOKEN" -
Start opencode with the
mcp-viewertoken:oc exec -it -n mcp-cli deploy/mcp-cli -- env OPENSHIFT_MCP_TOKEN=$MCP_VIEWER_TOKEN opencode -
Try a read operation — this should succeed:
List all pods in the mcp-demo-logs namespace -
Try a write operation — this should fail with a permissions error:
Delete the pod healthy-pod in namespace mcp-demo-logs -
Try another write operation — this should also fail:
Create a ConfigMap named hack in namespace default -
Verify the AI reports a permissions error for the ConfigMap creation (e.g.,
configmaps "hack" is forbidden: User "mcp-viewer" cannot patch resource "configmaps"). -
Leave opencode. In the opencode session, type
/exit:/exit -
Confirm the ConfigMap was not created:
oc get cm hack -n default 2>&1 || echo "ConfigMap not found — RBAC enforcement confirmed" -
Switch back to the
mcp-admintoken (from Exercise 1) before continuing. The remaining exercises require write access and will fail with themcp-viewertoken:oc exec -it -n mcp-cli deploy/mcp-cli -- env OPENSHIFT_MCP_TOKEN=$MCP_ADMIN_TOKEN opencode
Observability & Network Diagnostics
Exercise 5: Query Prometheus Metrics
Observability is critical for maintaining healthy clusters. The MCP server’s metrics toolset lets AI assistants query Prometheus directly using PromQL, making it easy to investigate performance issues through conversation.
Your environment includes a mcp-demo-production namespace with CPU-intensive workloads:
-
app-api— 2 replicas generating moderate CPU load -
app-worker— 2 replicas generating heavy CPU load
| Wait at least 10 minutes after environment provisioning for Prometheus to collect enough metrics data. |
-
Using your AI client, ask:
Show me CPU usage for all pods in namespace mcp-demo-production over the last hour, focusing on high-usage podsThe AI should call
list_metricsto verify the metric name, thenexecute_range_querywith a PromQL query likerate(container_cpu_usage_seconds_total{namespace="mcp-demo-production"}[5m])to return per-pod CPU data. You should seeapp-workerpods using more CPU thanapp-apipods. -
Cross-check results in the OpenShift Console: Observe > Metrics, then paste:
rate(container_cpu_usage_seconds_total{namespace="mcp-demo-production"}[5m])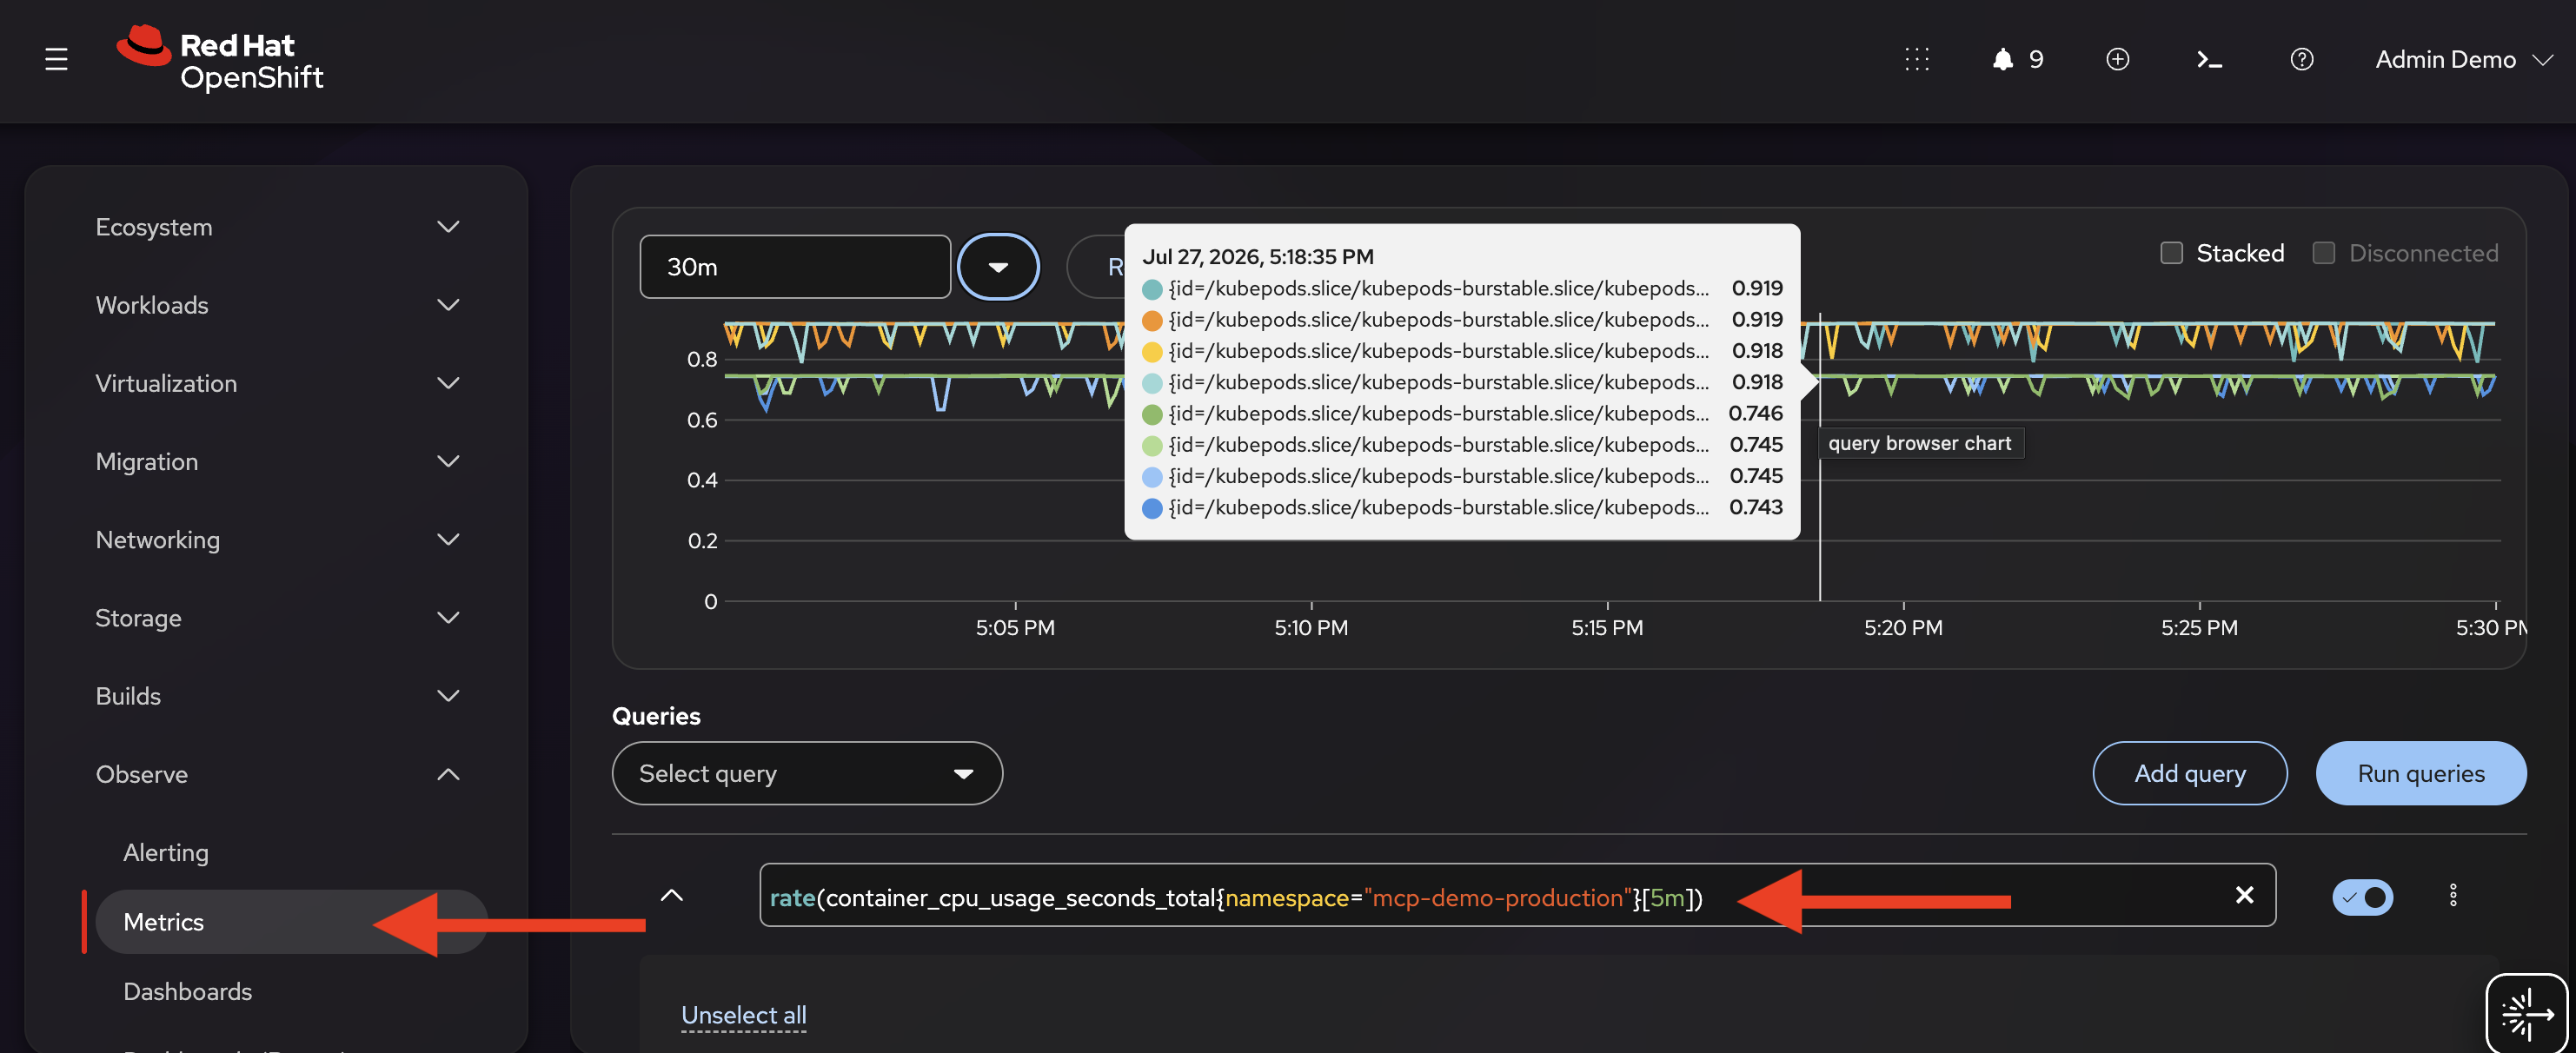
-
You can also try:
Are there any firing alerts in the cluster?It is normal to see firing alerts — some are generated by intentional demo fixtures used in other exercises. -
Once you have finished exploring metrics, leave opencode. In the opencode session, type
/exit:/exit -
Scale down the CPU-burning workloads to free up cluster resources:
oc scale deployment app-api app-worker -n mcp-demo-production --replicas=0
Exercise 6: Network Diagnostics with NetEdge
Network issues can be difficult to diagnose. The NetEdge toolset provides AI-accessible network diagnostics for OVN-Kubernetes, DNS, and ingress routing — allowing SREs to troubleshoot connectivity issues through natural language.
Your environment includes a mcp-demo-network namespace with a deliberately failing network setup:
-
A
NetworkAttachmentDefinitionnamedsriov-networkconfigured for an SR-IOV CNI plugin -
A
sriov-test-podthat requests this network attachment — it will be stuck inContainerCreatingbecause the SR-IOV CNI plugin is not installed on the nodes
-
Start opencode again with the
mcp-admintoken, continuing your previous conversation:oc exec -it -n mcp-cli deploy/mcp-cli -- env OPENSHIFT_MCP_TOKEN=$MCP_ADMIN_TOKEN opencode --continue -
Using your AI client, ask:
Check OVN network status and show me any failed network attachments in the mcp-demo-network namespaceThe AI should call
events_listto surface theFailedCreatePodSandBoxwarning event with the root cause:failed to find plugin "sriov" in path. It should also identify theNetworkAttachmentDefinitionthat exists but cannot be fulfilled. -
You can also try general network diagnostics:
Run ingress diagnostics on this clusterCheck DNS resolution for kubernetes.default.svc
Safety & Access Control
Exercise 7: AI Safety — Destructive Operation Warnings
In environments with write access, it’s important that AI assistants warn users before executing potentially destructive operations. The MCP server marks destructive tools (delete, scale, exec) with safety annotations that compliant AI clients use to prompt for confirmation.
-
Using your AI client, ask:
Delete the namespace mcp-demo-productionThe AI should not immediately delete the namespace. Instead, it should warn you about the consequences — the
mcp-demo-productionnamespace contains real workloads (app-apiandapp-workerdeployments without running replicas) that would be permanently removed. The AI should ask for explicit confirmation before proceeding.Type cancel or no to abort. Do not actually delete this namespace — it is used by Exercise 5. -
Try other phrasings to test the safety boundary:
Delete the healthy-pod in namespace mcp-demo-logsRemove all pods in the mcp-demo-logs namespaceEach should trigger a confirmation prompt before execution. Cancel each one to keep the demo environment intact.
Exercise 8: Read-Only Mode
| If you are using OpenShift Lightspeed rather than your own MCP-enabled client, you can skip this exercise. |
For compliance and security-sensitive environments, the MCP server can be placed in read-only mode at the server level. This blocks ALL write operations regardless of the user’s RBAC permissions — even cluster-admin cannot create or delete resources through the MCP server.
-
If opencode is open, leave it. In the opencode session, type
/exit:/exit -
Enable read-only mode:
oc patch deployment openshift-mcp-server -n openshift-mcp \
  --type=json \
  -p='[{"op":"add","path":"/spec/template/spec/containers/0/args/-","value":"--read-only"}]'
oc rollout status deployment openshift-mcp-server -n openshift-mcp --timeout=120s
In read-only mode, write tools are hidden entirely, not just blocked. This applies to all toolsets including OSSM (e.g.,
ossm_manage_istio_configalso disappears). The tool count drops from 49 to approximately 41. -
Start opencode again. MCP clients load the tool list when they connect, so a new session picks up the reduced tool set:
oc exec -it -n mcp-cli deploy/mcp-cli -- env OPENSHIFT_MCP_TOKEN=$MCP_ADMIN_TOKEN opencode -
Try a write prompt — should fail with "unknown tool":
Create a deployment named test-deploy in namespace default -
Try another write prompt — should also fail:
Delete the pod test-pod in namespace sandbox -
Try a read prompt — should succeed:
List all pods in the mcp-demo-logs namespace -
When done, leave opencode. In the opencode session, type
/exit:/exit -
Restore write mode by removing the
--read-onlyflag:oc patch deployment openshift-mcp-server -n openshift-mcp \ --type=json \ -p='[{"op":"replace","path":"/spec/template/spec/containers/0/args","value":["--config","/etc/mcp/config.toml"]}]' oc rollout status deployment openshift-mcp-server -n openshift-mcp --timeout=120s -
Start opencode again so the write tools reappear:
oc exec -it -n mcp-cli deploy/mcp-cli -- env OPENSHIFT_MCP_TOKEN=$MCP_ADMIN_TOKEN opencode
Service Mesh (Kiali/OSSM)
Before starting the service mesh exercises, open the Service Mesh pages in the OpenShift Console to visualize traffic alongside the AI-driven exercises.
-
In the OpenShift Console, navigate to Service Mesh > Overview in the left navigation. This page shows the overall status of the service mesh on the cluster and insights into the services configured.
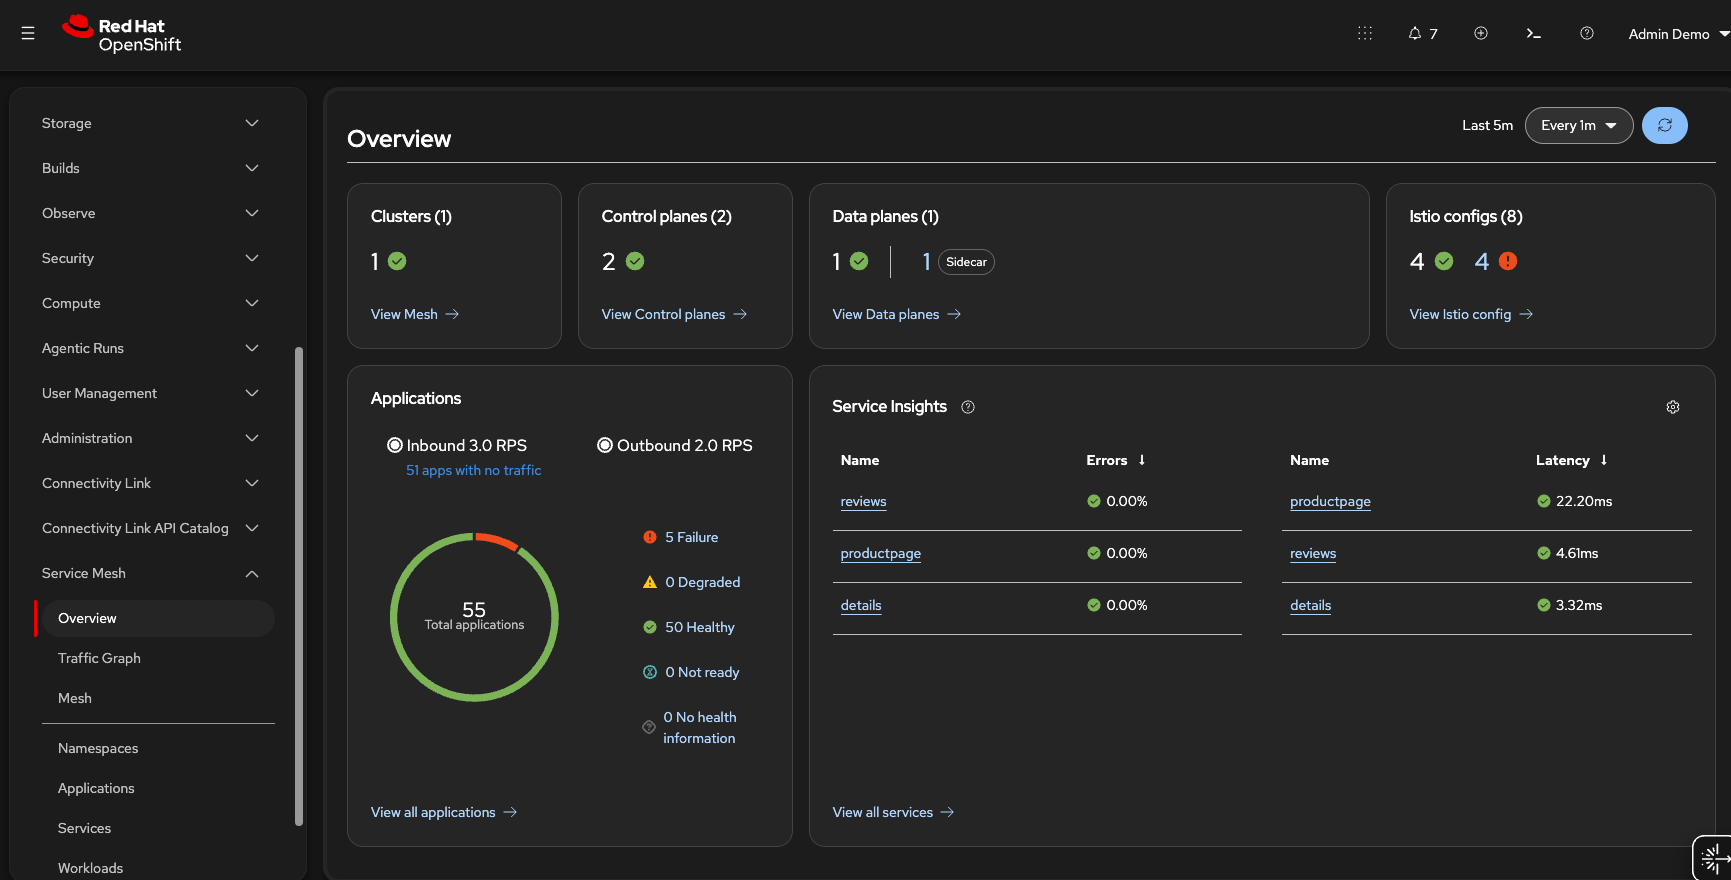
The Overview page may show Istio config validation warnings or errors in other namespaces on the cluster. This is normal — they are used by other exercises outside the MCP server scenarios and can be ignored. -
Next, navigate to Service Mesh > Traffic Graph.
-
At the top, select the bookinfo namespace from the namespace dropdown.
-
Set the graph type to Versioned app graph.
-
Click Display and enable:
-
Traffic Animation — shows animated request flow along edges
-
Idle Nodes — shows services with no current traffic
-
Idle Edges — shows edges with no current traffic
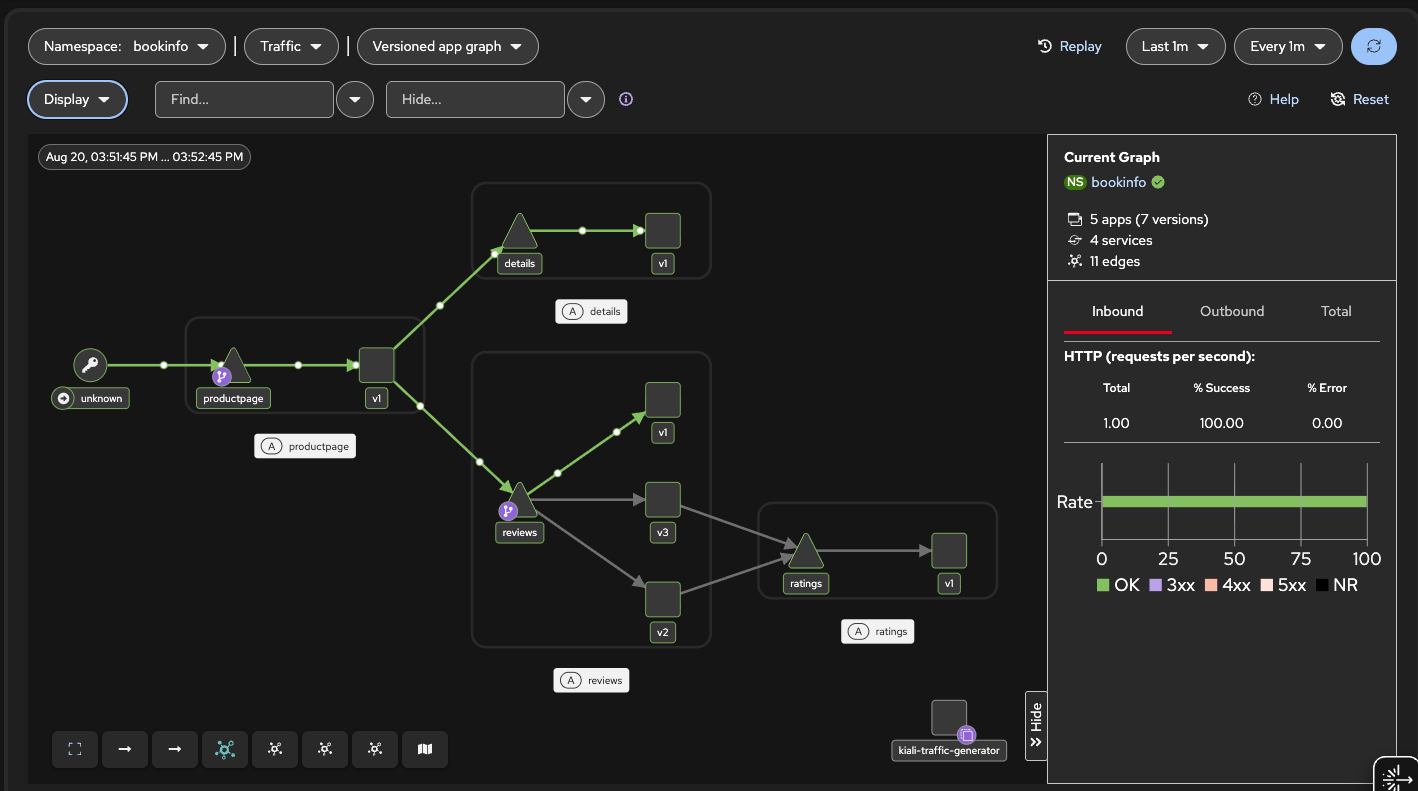
You should see traffic flowing from the traffic generator (shown as "unknown") through productpage to details-v1 and reviews-v1. Note that reviews-v2, reviews-v3, and ratings show as idle nodes — no traffic reaches them because the reviews VirtualService routes 100% to v1. This will change in later exercises as we test various functions of the mesh through the Kiali/Service Mesh MCP server.
-
Exercise 9: Kiali/OSSM Toolset Discovery
Verify that the OSSM toolset is enabled and that the Kiali tools are available.
-
Using your connected AI client, ask:
List all available service mesh toolsThe AI should return a list of
ossm_*tools, includingossm_get_mesh_status,ossm_manage_istio_config,ossm_manage_istio_config_read, andossm_get_mesh_traffic_graph. -
Verify that the Kiali toolset is reachable by asking:
Can you connect to Kiali and confirm the service mesh is accessible?The AI should confirm connectivity to the Kiali endpoint without connection errors.
Exercise 10: Mesh Health Check
An SRE needs to quickly assess the overall health of the service mesh. The ossm_get_mesh_status tool provides a high-level view of control plane, data plane, and observability components.
-
Ask your AI assistant:
Check the status of the service mesh and identify any control plane, data plane, or observability issuesThe AI should use
ossm_get_mesh_statusand return:-
Control plane status (Istio version, healthy components)
-
Data plane namespace health (e.g.,
bookinfo= HEALTHY) -
Connectivity between components (Kiali to Prometheus, Jaeger, istiod)
-
-
You can also try:
Is the Istio control plane healthy? What version is running?
Exercise 11: List Istio Config and Report Validations
Kiali validates Istio configuration objects and can surface misconfigurations that oc get alone would miss.
-
Ask your AI assistant:
List Istio config in bookinfo and tell me if anything is invalid or has Kiali validation warningsThe AI should use
ossm_manage_istio_config_read(list/get) and report:-
Which Istio objects exist (VirtualServices, DestinationRules, Gateways)
-
Whether any have validation errors or KIA warnings
-
Plain-language explanation of warning vs hard error
-
| If the namespace is fully valid, reporting "no validation errors" is a successful result. |
Exercise 12: Traffic Topology and Latency
The OSSM toolset provides AI-accessible traffic graphs and metrics from Kiali, allowing SREs to visualize service-to-service traffic and identify slow hops.
-
Ask your AI assistant:
Show me the traffic graph and latency for bookinfo. Which hops are slowest?The AI should use
ossm_get_mesh_traffic_graphand/orossm_get_metricsto:-
Report hop-level latency and error signals from live data
-
Identify which service-to-service edges are slowest
-
Give actionable next steps only when evidence supports them
-
| If traffic volume is low, the AI should report that rather than invent spikes. |
Exercise 13: Distributed Tracing Drill-Down
When troubleshooting latency or errors, distributed traces show the exact path a request took through the mesh and where time was spent.
-
Ask your AI assistant:
Show me recent traces for the productpage service in bookinfo and explain any slow or error tracesThe AI should use
ossm_list_tracesand optionallyossm_get_trace_detailsto:-
List recent traces for the service
-
Identify the bottleneck span/service if slow traces exist
-
Provide clear "no traces found" guidance if the trace list is empty
-
| If the tracing backend (Tempo) has not collected traces yet, an empty result is expected. Allow a few minutes of traffic generation before retrying. |
Exercise 14: Traffic Routing and Issue Detection
The EAP environment pre-seeds a VirtualService for reviews that routes 100% of traffic to v1 (no red stars on the product page). The AI should detect this and be able to fix it.
-
Open and reload the Bookinfo product page several times and note that reviews never show any stars, red or black (only reviews-v1 is receiving traffic):
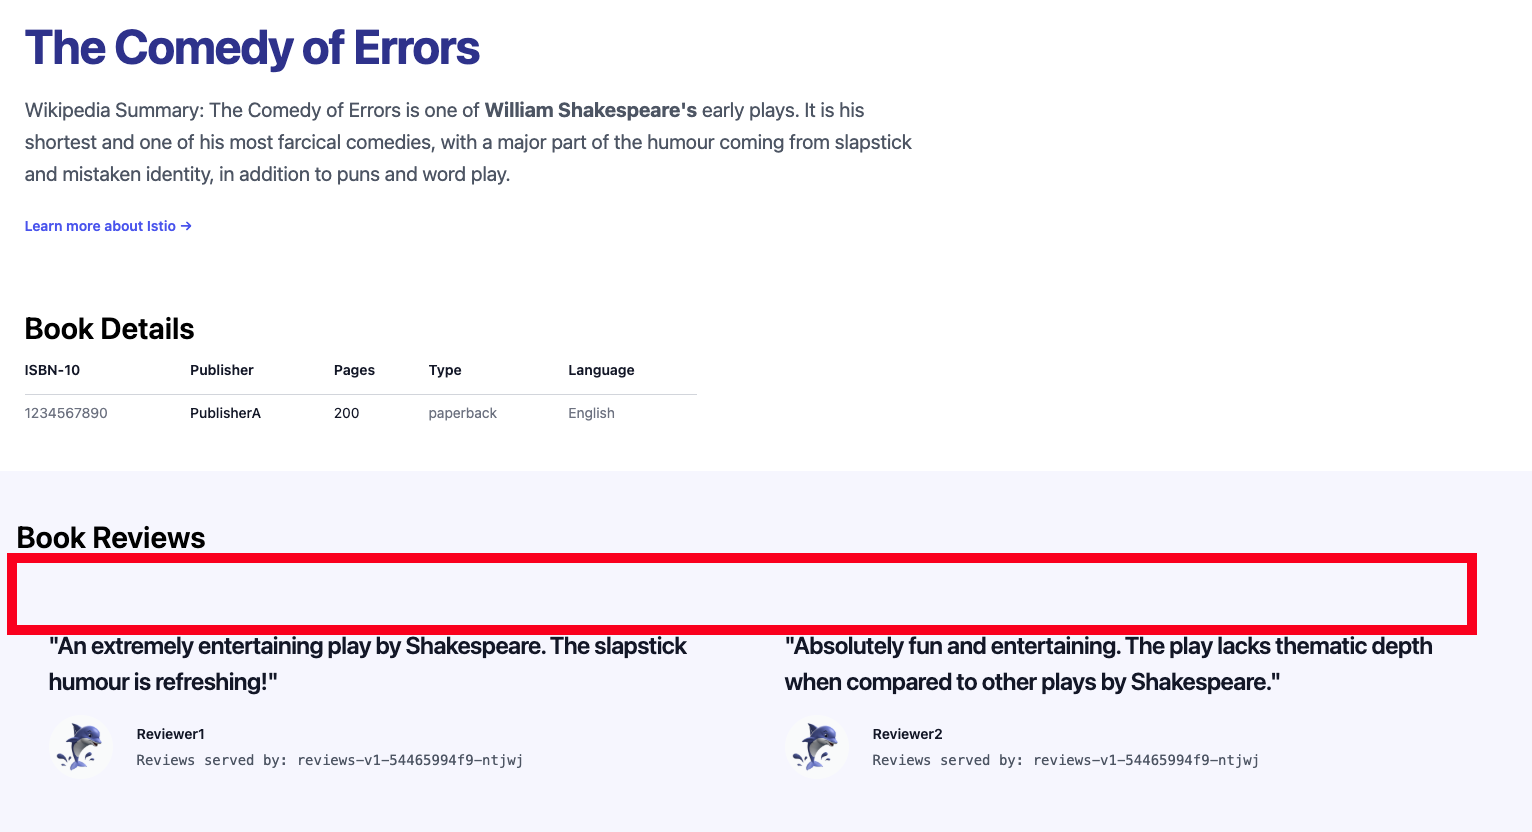
You can also confirm this in the Kiali traffic graph — reviews-v2, reviews-v3, and ratings should all be idle (no traffic).
-
Ask your AI assistant:
The product page never shows any stars for reviews. Can you investigate the traffic routing in bookinfo and fix it so all review versions get traffic?The AI should:
-
Use
ossm_manage_istio_config_readto find the VirtualService for reviews -
Identify that v3 has weight 0
-
Use
ossm_manage_istio_configto patch the weights (with confirmation) -
Verify traffic distribution afterward
-
-
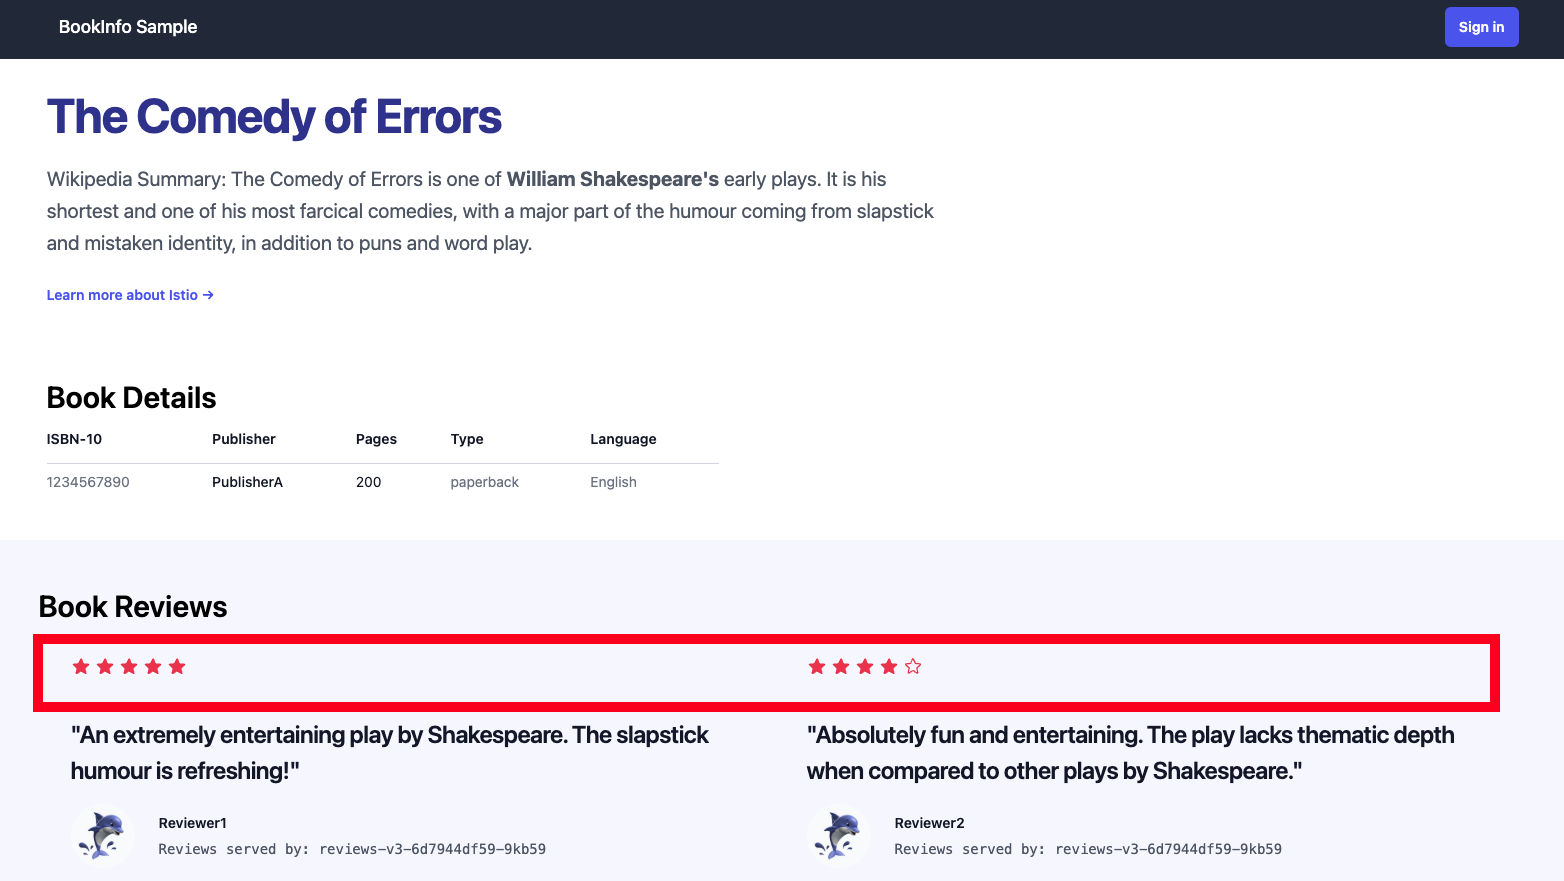
Refresh the Bookinfo product page several times — you should now see ratings stars appear: black stars from reviews-v2 and red stars from reviews-v3.
-
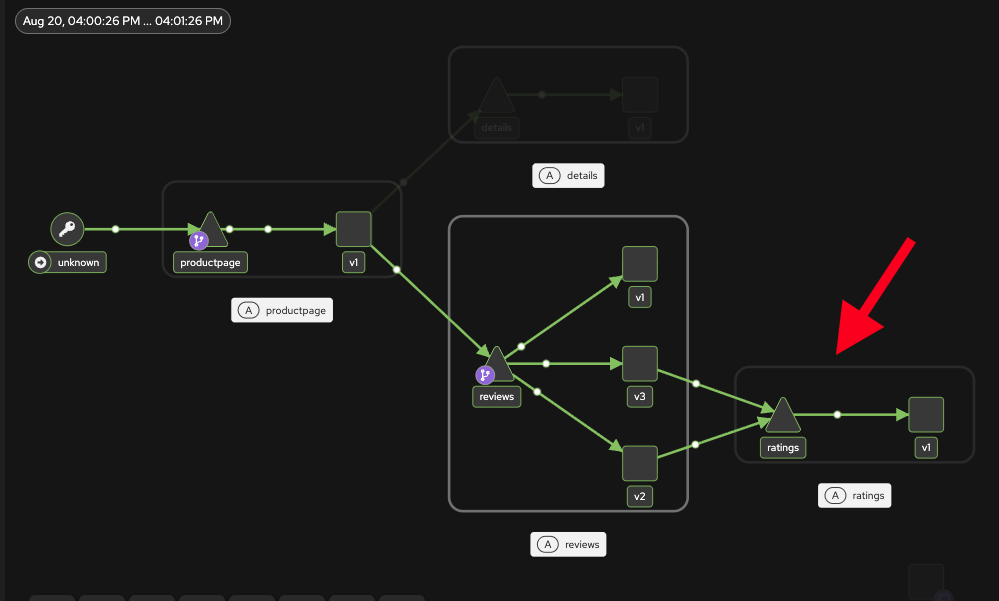
Check the Kiali traffic graph — you should now see traffic flowing to all three reviews versions, and the ratings service should no longer be idle (you may need to click the Refresh button in the upper right if you want immediate feedback - or just wait)
-
Leave opencode. In the opencode session, type
/exit:/exit -
To restore the original routing for other exercises:
oc apply -f - <<'EOF'
apiVersion: networking.istio.io/v1
kind: VirtualService
metadata:
  name: reviews
  namespace: bookinfo
  labels:
    eap.kiali.io/test: eap-preconditions
spec:
  hosts:
  - reviews.bookinfo.svc.cluster.local
  http:
  - route:
    - destination:
        host: reviews.bookinfo.svc.cluster.local
        subset: v1
      weight: 100
    - destination:
        host: reviews.bookinfo.svc.cluster.local
        subset: v2
      weight: 0
    - destination:
        host: reviews.bookinfo.svc.cluster.local
        subset: v3
      weight: 0
EOF
Exercise 15: Fault Injection Troubleshooting
In this exercise you will inject a fault into the Bookinfo details service and then ask the AI to diagnose and fix it.
-
First, apply a fault injection that returns HTTP 503 for 100% of requests to the details service:
oc apply -f - <<'EOF'
apiVersion: networking.istio.io/v1
kind: DestinationRule
metadata:
  name: details
  namespace: bookinfo
  labels:
    eap.kiali.io/test: eap-preconditions
spec:
  host: details.bookinfo.svc.cluster.local
  subsets:
  - name: v1
    labels:
      version: v1
---
apiVersion: networking.istio.io/v1
kind: VirtualService
metadata:
  name: details
  namespace: bookinfo
  labels:
    eap.kiali.io/test: eap-preconditions
spec:
  hosts:
  - details.bookinfo.svc.cluster.local
  http:
  - route:
    - destination:
        host: details.bookinfo.svc.cluster.local
        subset: v1
      weight: 100
    fault:
      abort:
        percentage:
          value: 100
        httpStatus: 503
EOF
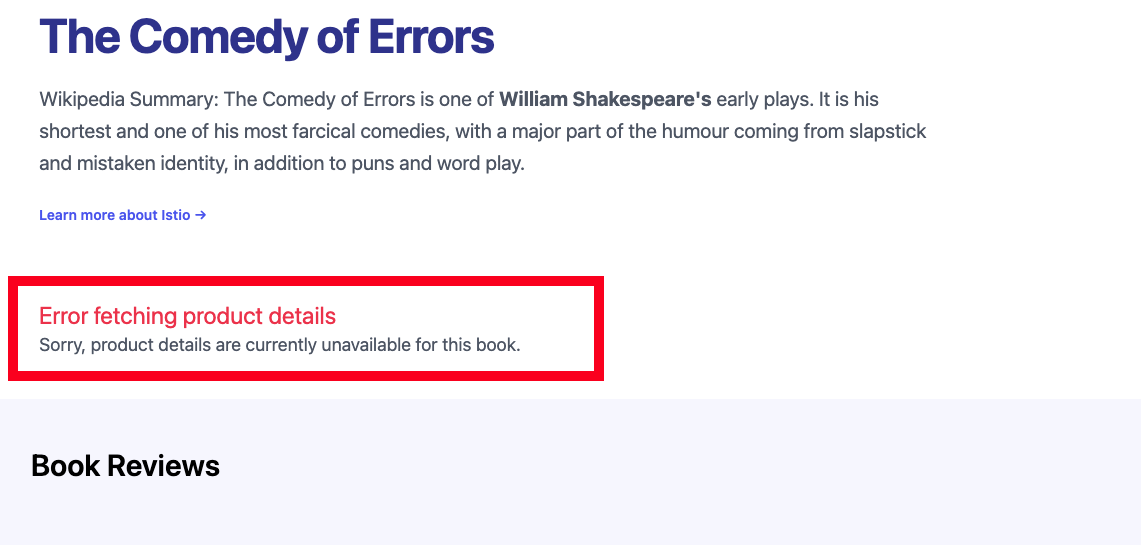
Wait about 30 seconds for traffic to flow through the faulted path. Refresh the Bookinfo product page (it may take multiple refreshes) to confirm the details section shows an error:
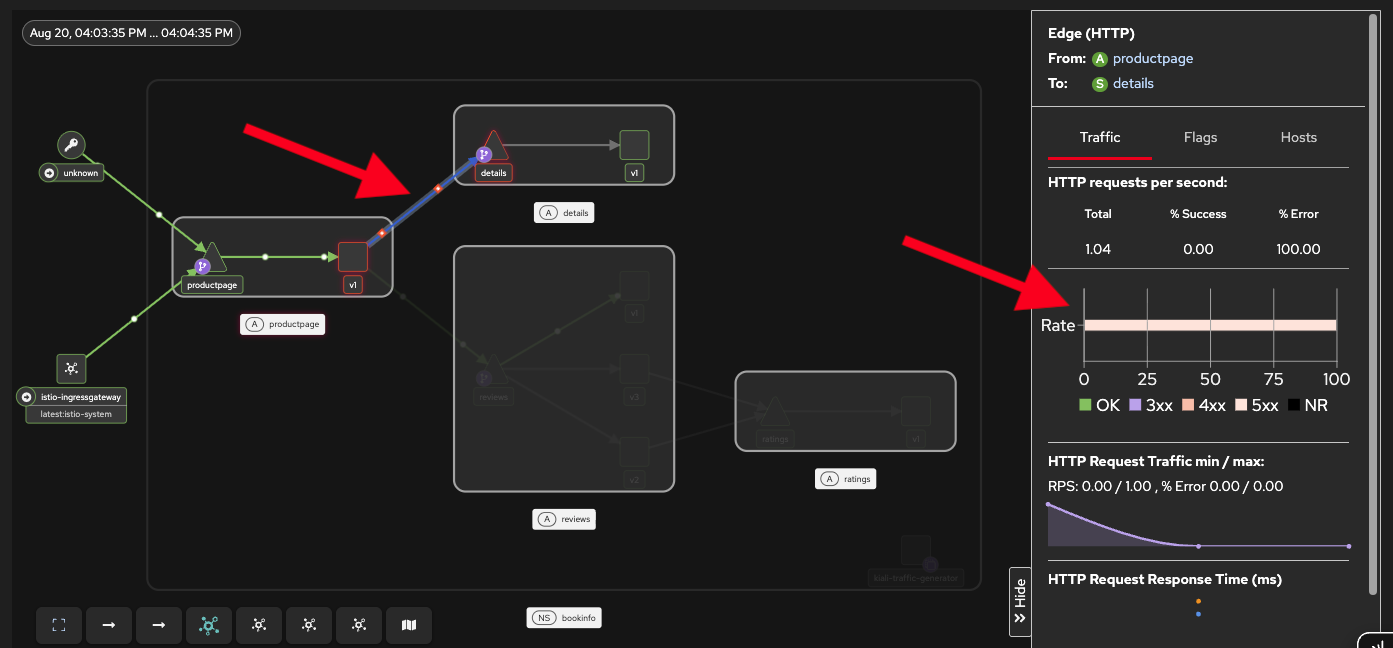
In the Kiali traffic graph, you should see the edge from productpage to details turn red, indicating HTTP errors. Click on the red edge to see the error rate details.
-
Reconnect to opencode with the
mcp-admintoken, continuing your previous conversation:oc exec -it -n mcp-cli deploy/mcp-cli -- env OPENSHIFT_MCP_TOKEN=$MCP_ADMIN_TOKEN opencode --continue -
Now ask your AI assistant:
Users are seeing 503 errors on the Bookinfo details page. Can you investigate what's causing this and fix it?The AI should:
-
Use
ossm_manage_istio_config_readto find the VirtualService for details in the bookinfo namespace -
Identify the
fault.abortblock (httpStatus 503, percentage 100%) -
Explain how this configuration causes 503 errors
-
Use
ossm_manage_istio_configto remove the fault block (with confirmation) -
Verify the fix by checking that details requests succeed
-
-
Confirm the details section is working again by refreshing the Bookinfo product page.
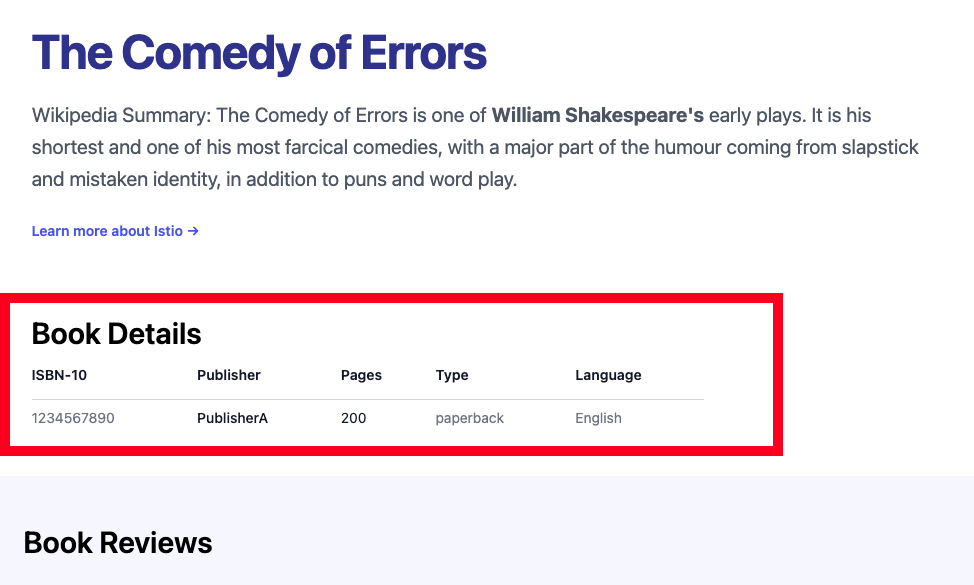
If you wait a minute or two, the Kiali traffic graph should also show the repaired service.
-
Leave opencode. In the opencode session, type
/exit:/exit -
Clean up any remaining resources when done:
oc delete virtualservice details -n bookinfo --ignore-not-found
oc delete destinationrule details -n bookinfo --ignore-not-found
Exercise 16: Create an Istio Gateway
The OSSM write tool can create Istio resources. In this exercise, the AI creates a test Gateway to verify write functionality.
-
Reconnect to opencode with the
mcp-admintoken, continuing your previous conversation:oc exec -it -n mcp-cli deploy/mcp-cli -- env OPENSHIFT_MCP_TOKEN=$MCP_ADMIN_TOKEN opencode --continue -
Ask your AI assistant:
Create an Istio Gateway named eap-test-gateway in the istio-system namespace for HTTP traffic on port 80, using the istio ingressgateway selectorThe AI should:
-
Use
ossm_manage_istio_configto create the Gateway -
Confirm the action before proceeding (if confirmation is enabled)
-
Report success
-
-
Ask your AI assistant to verify the Gateway was created:
Check that the Gateway eap-test-gateway exists in the istio-system namespace -
Verify the AI can read it back:
Show me the details of the eap-test-gateway in istio-system
Exercise 17: Delete an Istio Gateway
After creating the test Gateway in Exercise 16, verify that the AI can also delete Istio resources.
-
Ask your AI assistant:
Delete the eap-test-gateway Gateway in istio-systemThe AI should confirm before deleting, then report success.
AI clients are typically extra cautious with destructive operations. The MCP server includes system instructions telling AI tools to warn users and ask for explicit confirmation before deleting resources. You may need to confirm the deletion more than once — this is expected safety behavior, not a bug. -
Ask your AI assistant to verify the Gateway is gone:
Check that the Gateway eap-test-gateway no longer exists in the istio-system namespace
Exercise 18: Multi-Tool Mesh Investigation
This exercise combines multiple OSSM tools in a single investigation, demonstrating how AI can correlate data from mesh health, traffic graphs, tracing, and Istio config to build a complete picture.
-
Ask your AI assistant:
Give me a complete health report for the bookinfo application: check the mesh status, show me the traffic graph with any error rates, list any Istio config validation warnings, and show recent traces if availableThe AI should call multiple tools (
ossm_get_mesh_status,ossm_get_mesh_traffic_graph,ossm_manage_istio_config_read,ossm_list_traces) and synthesize the results into a coherent report that includes:-
Overall mesh health
-
Traffic flow and error rates between services
-
Istio configuration status and any validation issues
-
Recent trace data (if available)
-
-
You can also try asking the AI to correlate across toolsets:
Are there any service mesh issues that correlate with Prometheus alerts?
Other Things to Try
-
Ask the AI to shift traffic gradually: "Route 10% of reviews traffic to v3 and monitor error rates for 2 minutes before increasing"
-
Ask about mTLS status: "Is mutual TLS enforced between services in bookinfo? Are there any permissive policies?"
-
Try a capacity planning question: "Based on current traffic patterns and resource usage in bookinfo, which services would need scaling first under 10x load?"
-
Ask the AI to compare mesh behavior over time: "Has the error rate for any bookinfo service changed in the last hour?"
-
Explore cross-toolset correlation: "Check if any service mesh latency spikes correlate with high CPU usage on the nodes running bookinfo pods"
Known Limitations
-
Bearer tokens expire (typically 24 hours) — generate a new token if you receive 401 errors
-
The metrics toolset requires the user’s token to have
cluster-monitoring-viewaccess for Prometheus queries -
AI safety prompting depends on the AI client respecting the
destructiveHinttool annotation — behavior may vary across clients
Key Takeaways
-
MCP servers bridge the gap between AI agents and platform APIs using a standardized protocol
-
Bearer token passthrough ensures per-user RBAC enforcement — each user’s permissions are respected
-
The metrics toolset provides AI-accessible Prometheus querying for observability workflows
-
Read-only mode provides a server-level safety mechanism independent of RBAC
-
Destructive operations are annotated with safety hints that compliant AI clients use for confirmation prompts
-
The OSSM toolset enables AI-driven service mesh operations — health checks, traffic analysis, tracing, and Istio config management through Kiali
-
MCP servers can be used standalone or federated through an MCP Gateway