Module 02: Service Mesh integration with virtual machines
In this module we are going to introduce Red Hat OpenShift Service Mesh and explore the added features and capabilities, that allow us to elevate the experience of operating and monitoring Virtual Machines (VMs) as first class citizens in a cloud-native world.
Objectives
-
Introducing OpenShift Service Mesh
-
Integrate VMs with OpenShift Service Mesh for advanced networking
-
Implement traffic management rules and review new observability features through Red Hat OpenShift Service Mesh
-
Configure Advanced Security and Testing with Virtual Machines
About OpenShift Service Mesh
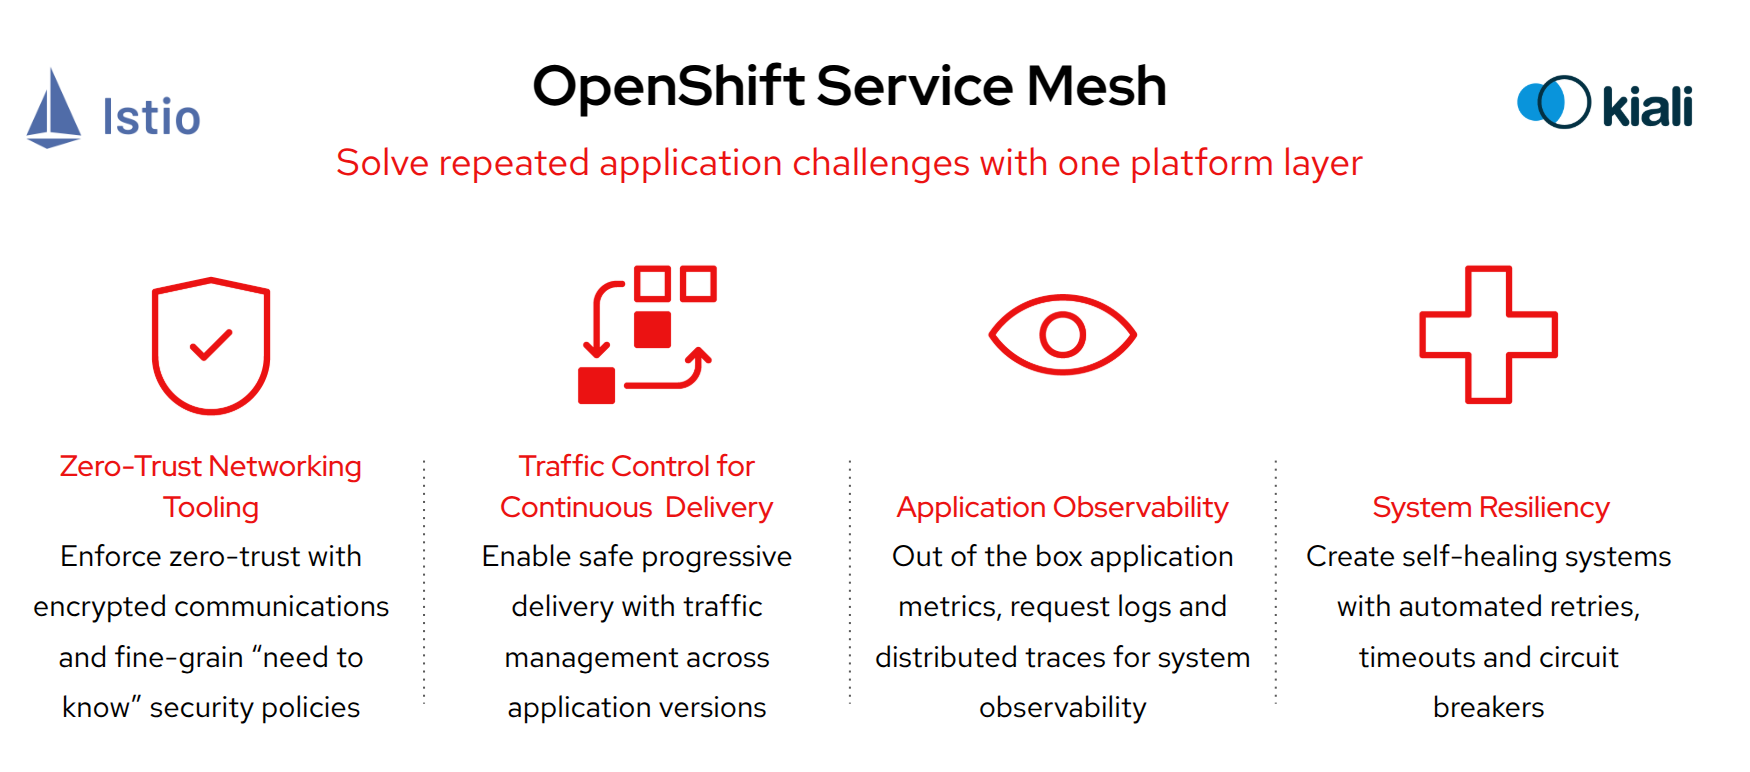
Red Hat OpenShift Service Mesh is an integrated service mesh solution based on the open source projects Istio, Kiali, and Jaeger, designed to simplify microservice communication, security, and observability in OpenShift environments. It provides a uniform way to manage service-to-service interactions, including traffic control, security policies, and monitoring.
| OpenShift Service Mesh is an add-on service that can be installed through an operator. |
Even though OpenShift Service Mesh is primarily designed for containerized workloads, it also supports VMs by integrating them into the mesh. Key benefits for VMs include:
-
Consistent Networking & Security – VMs can securely communicate with containerized workloads using mutual TLS (mTLS) encryption and access policies.
-
Unified Observability – VMs gain visibility through tracing (Jaeger), monitoring (Prometheus, Grafana), and service topology visualization (Kiali).
-
Traffic Management – Enables intelligent routing, load balancing, and failover between VMs and microservices.
-
Gradual Migration – Allows a hybrid approach, where legacy VMs can coexist and gradually transition into a containerized environment.
-
Policy Enforcement – Ensures compliance by applying service-level access control and security policies uniformly across VMs and containers.
The following section provides additional information on the Service Mesh Architecture. Feel free to skip to the Getting Started section to save time and come back later if needed.
OpenShift Service Mesh architecture
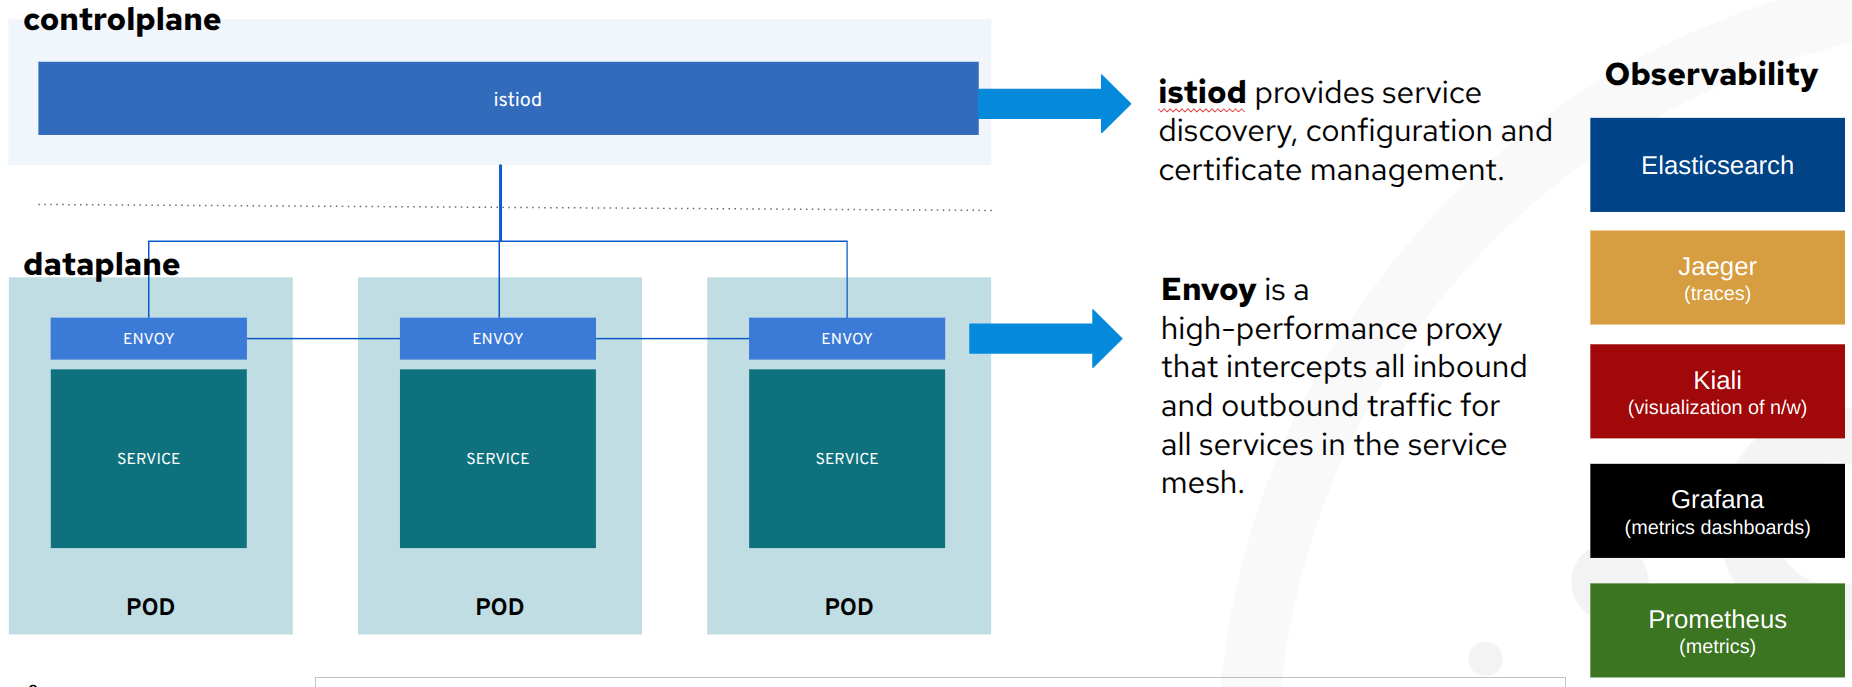
OpenShift Service Mesh, delivered as part of the platform, adds the above cross-cutting application capabilities through the following components:
-
istiod: applies all defined policies (encryption, authorization, traffic management, observability) in the network of VMs and containers included in the mesh.
-
envoy: a sidecar container, of a VM or containerized workload, with the ability to receive and apply the policies effectively making a VM part of the mesh. The envoy sits side-by-side to a VM (see the image above) and intercepts all requests coming in and out of it.
-
Kiali: visualises through a UI what is configured in the mesh, the network of included applications, the traffic throughput and latency, the security utilised, the issues that may occur in the configurations or network, the logs and a host of other features that the mesh offers.
-
The rest of the observability components (as seen in the image above) contain parts of what
kialivisualises for a deeper inspection:-
Prometheuscollects the metrics emitted by theenvoyof each container/VM in the mesh, -
Grafanaprovides additional dashboards for the operators and business analysts to review on performance, request throughput/latency, success/failures etc.
-
-
Gateways: one or more
ingress gatewayinstances support traffic flow into service mesh from the outside. This is required since the mesh comes withnetwork policiesthat disable direct access to VMs/containers in the mesh. Also anegress gatewayrespectively can control outgoing traffic from the mesh to external services.
| The administrators of the cluster, you will be using, have already done the setup of Service Mesh so lets see how easy it is to enable a VM to take advantage of these new capabilities. |
Getting started
All assets for this module are in the folder module-02 in the repo you cloned in the introduction module. Please change the directory into this folder now.
|
cd $HOME/modernize-ocp-virt-workspace/module-02Explore the Service Mesh observability stack
Beginning with Red Hat OpenShift Service Mesh 3, the various components that make up the service mesh functionality as outlined above are integrated into the left hand menu bar through dynamic plugins.
Older versions would require that each of the individual services Istio, Kiali, and Grafana be exposed through their own routes, and be made accessible through a console login. The newer version is much more streamlined and easier for users to begin working with.
Review the Service Mesh web console plugin
Click on Service Mesh → Overview in the left side navigation menu to see a screen that shows information about each Red Hat OpenShift project, and the applications hosted there.
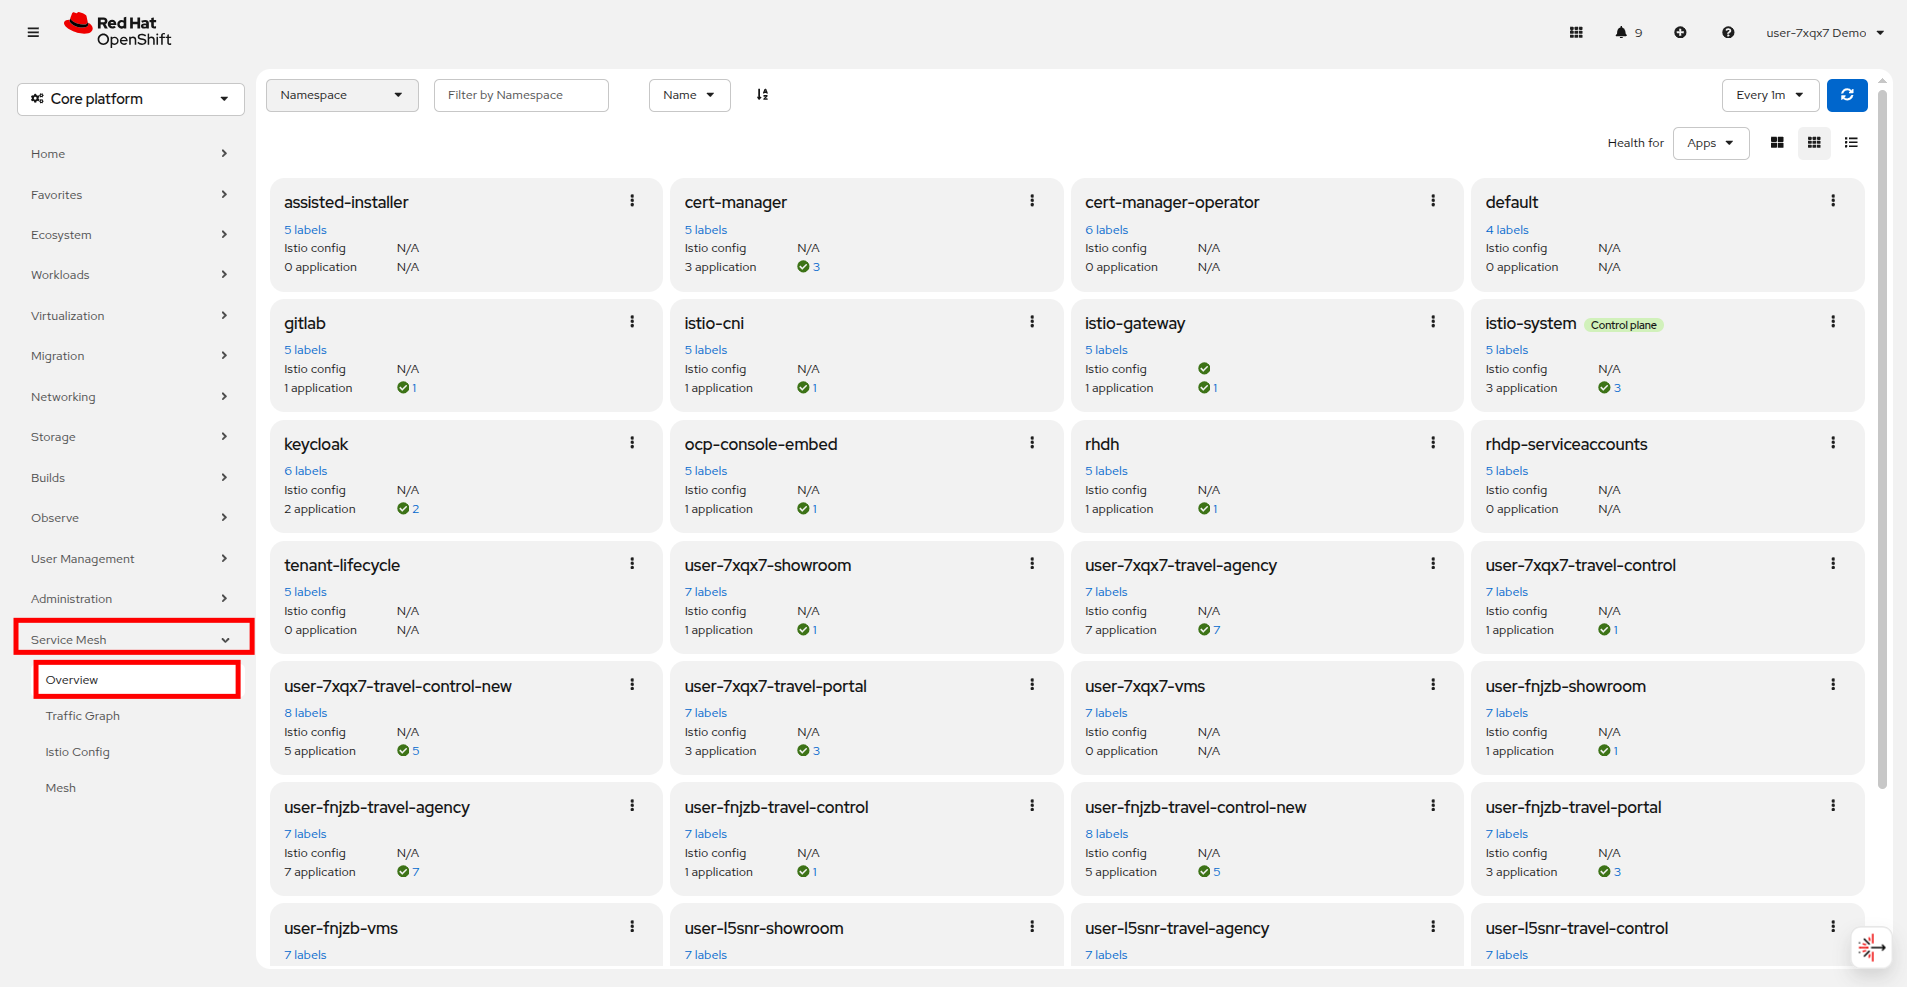
On this screen you will see that there are all of the projects in our shared cluster listed. In this lab we will be working with the projects: userX-travel-agency, userX-travel-control, and userX-travel-portal.
Take a closer look at the projects that your user is responsible for.
You can hover over the labels on the project get more information, and you get a report on applications, in this case VMs, in the projects and their current health with a green check mark for healthy, or a red X if there are issues.
Next click on Service Mesh → Traffic Graph in the left side navigation.
Use the Namespace dropdown at the top and search for userX-travel to see your associate projects. Select the projects: userX-travel-agency, userX-travel-control, and userX-travel-portal.
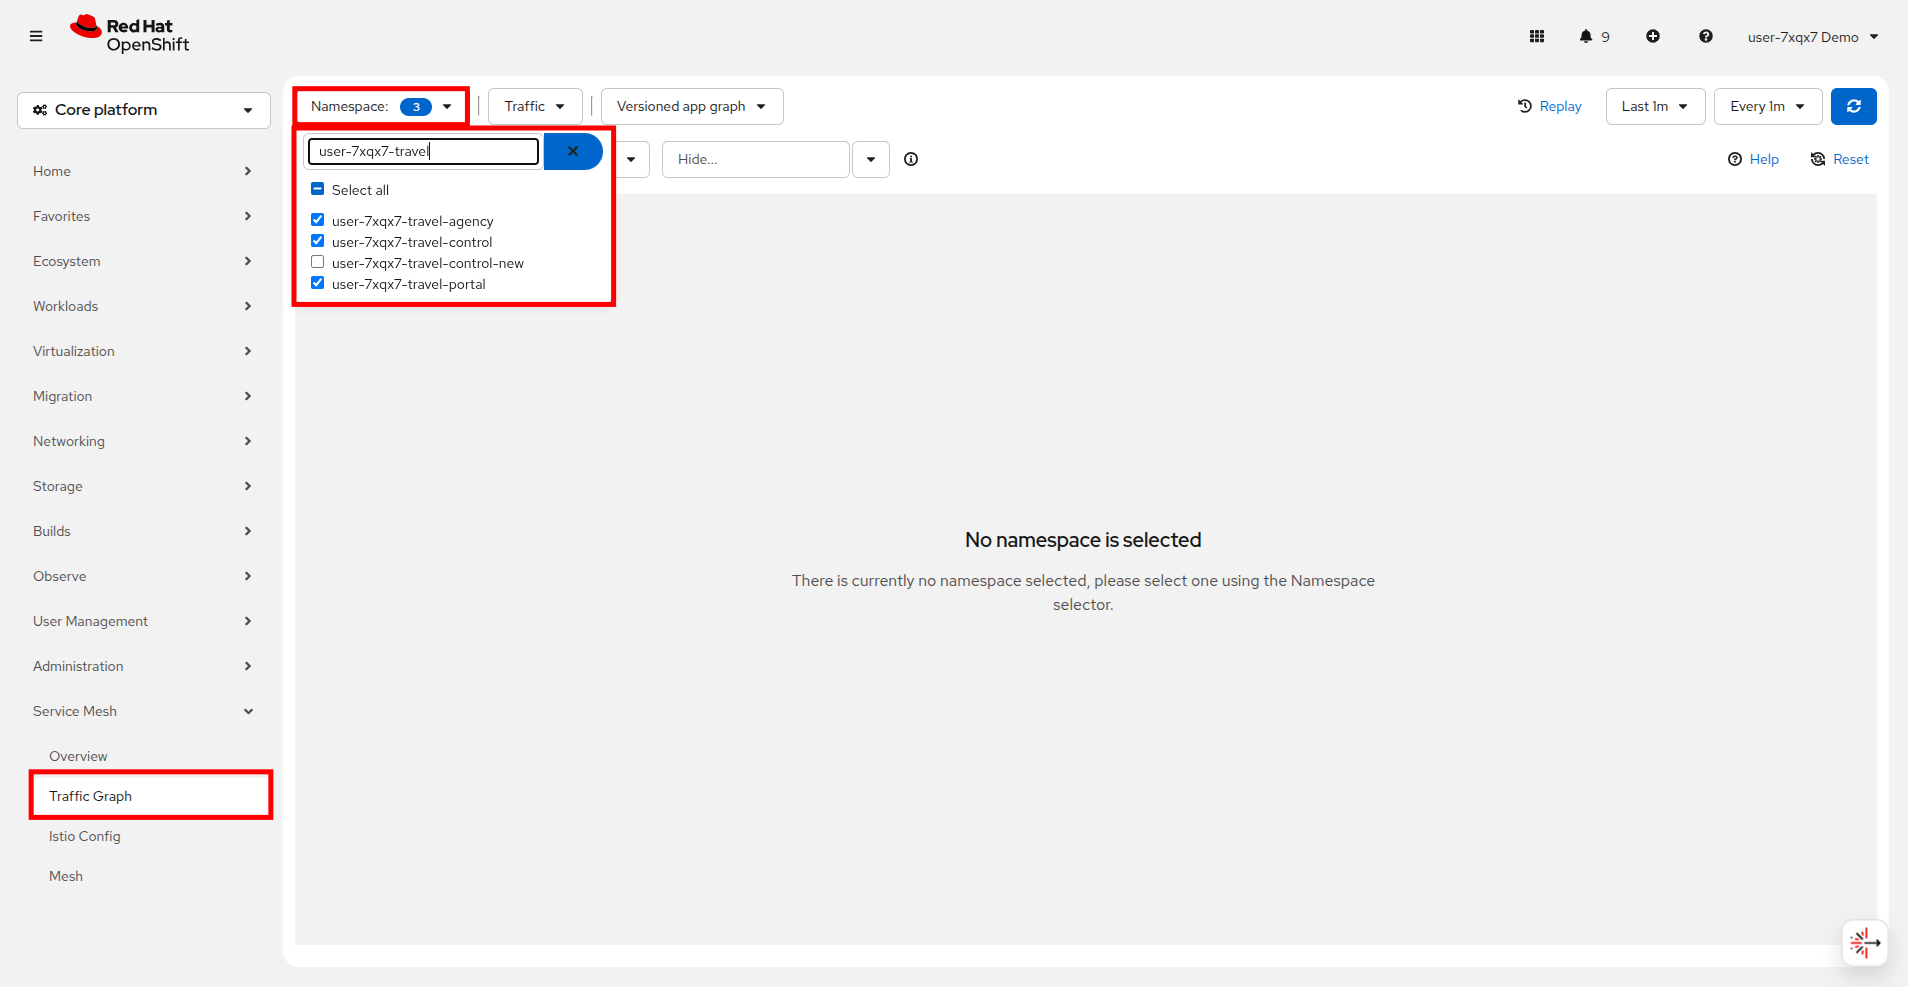
When the projects are selected there will be a brief pause, and the console will attempt to load the traffic graph.
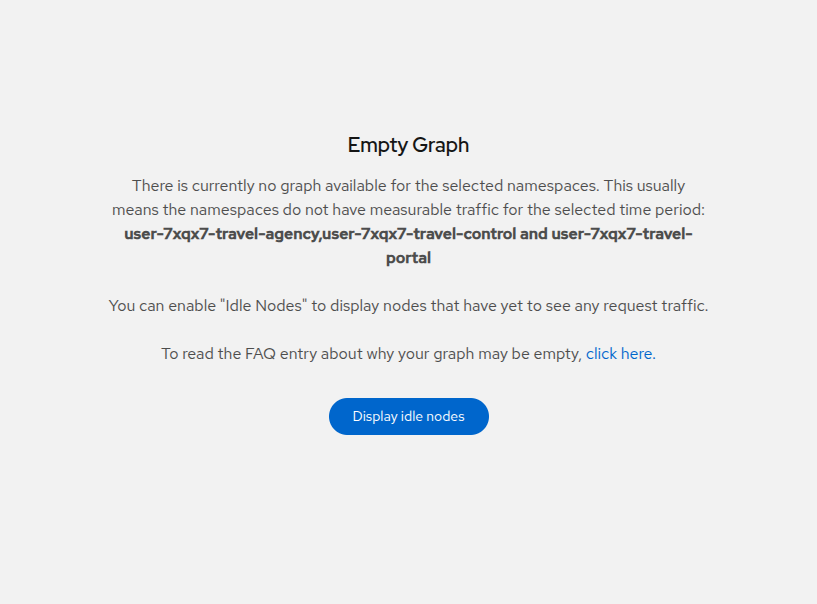
The traffic graph is empty!
This is to be expected because we have yet to add our existing applications to the mesh. We will perform this in the next step.
Add VMs and containers to OpenShift Service Mesh
If it was not apparent until now, you can only apply policies (security, observability etc.) and visualize network traffic flows to VMs and containers that are part of the mesh!
| In order to become part of the mesh each Travel Booking namespace must be configured to be a member of the mesh, and each workload component needs to have an additional sidecar container injected, which will intercept the traffic to/from your VM. |
Take a look at the pods that are associated with the VMs that are in your userX-travel-agency project by clicking on Workloads → Pods, and selecting userX-travel-agency from the dropdown Project menu.
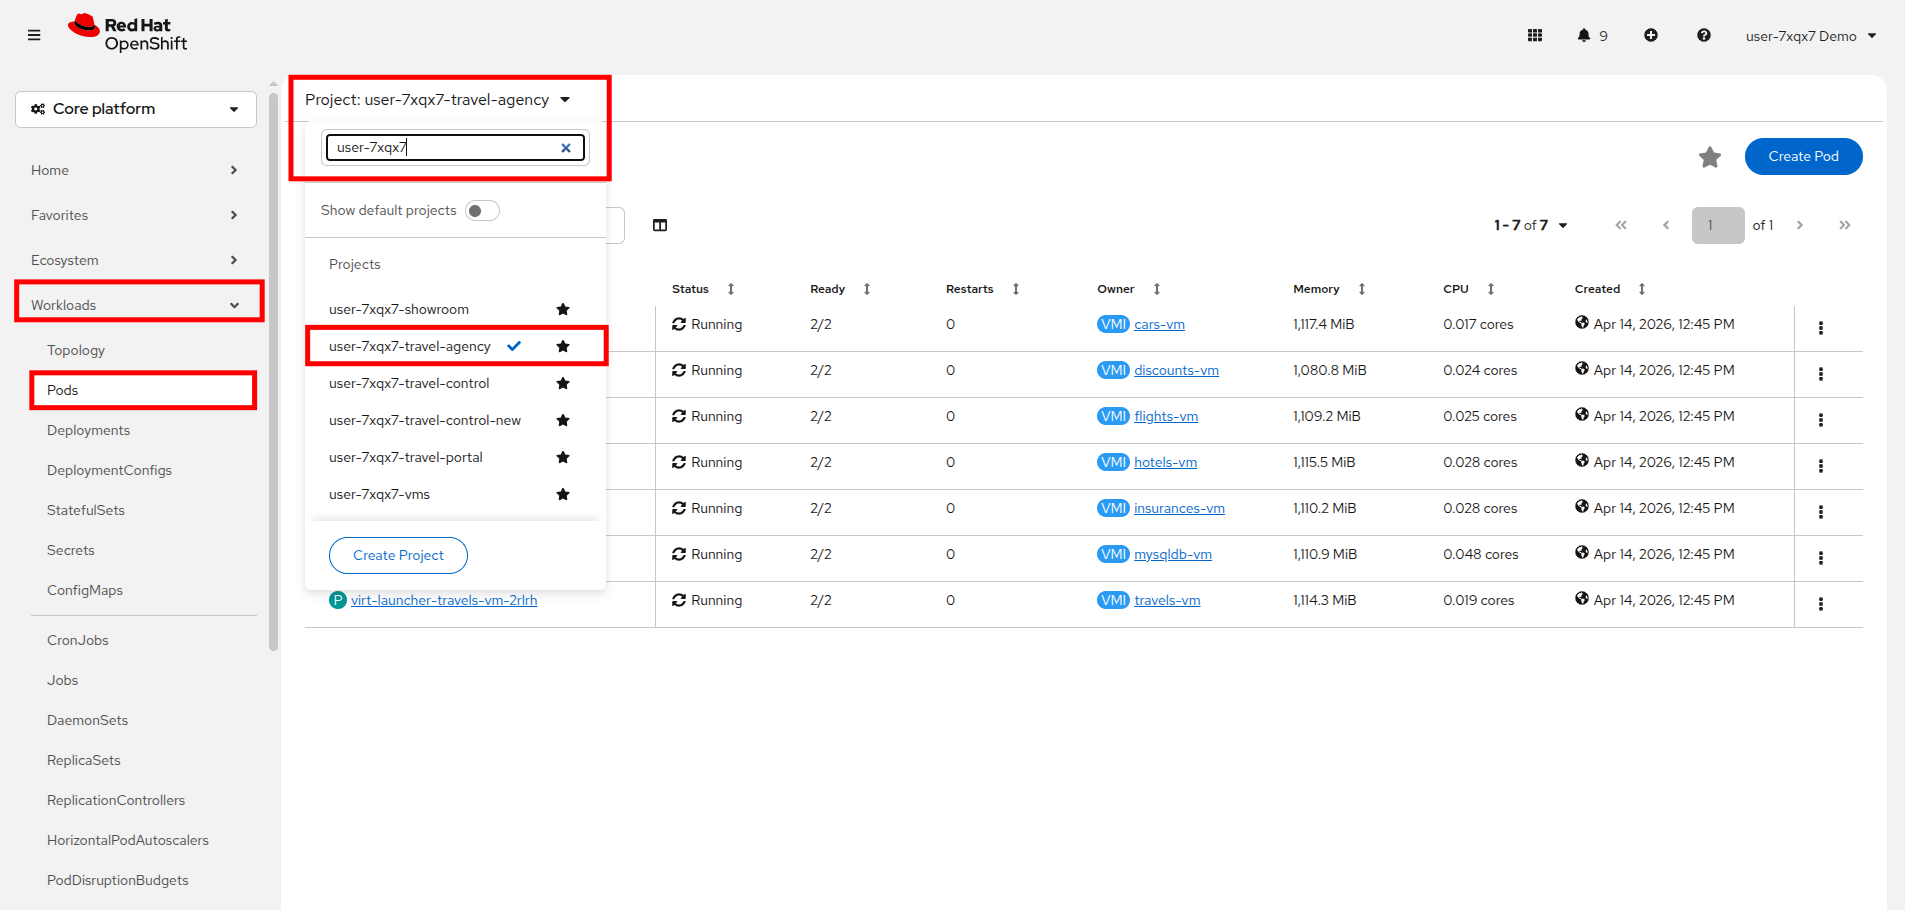
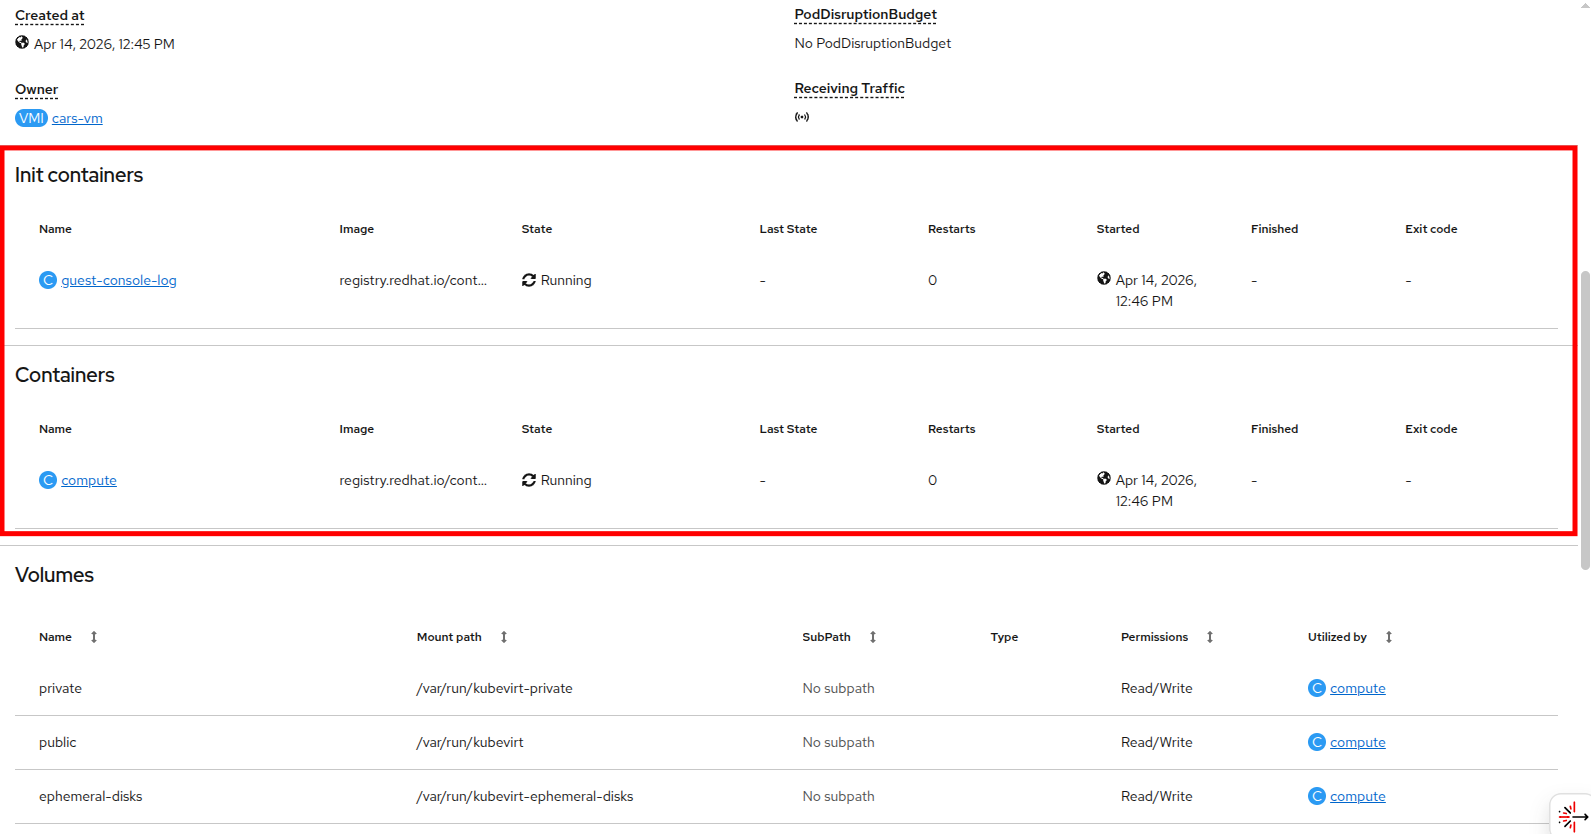
Right now you may notice that the pods associated with each VM have 2 containers.
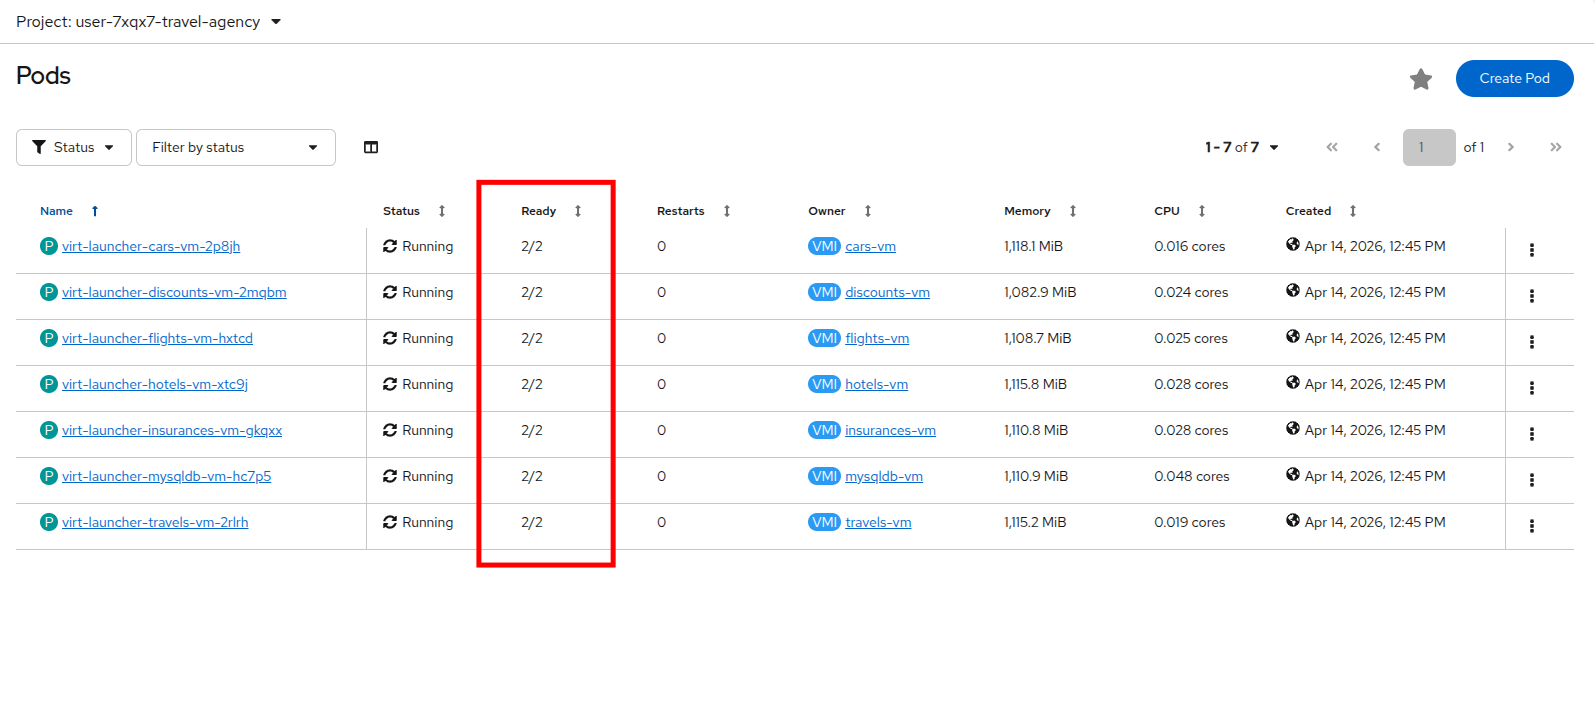
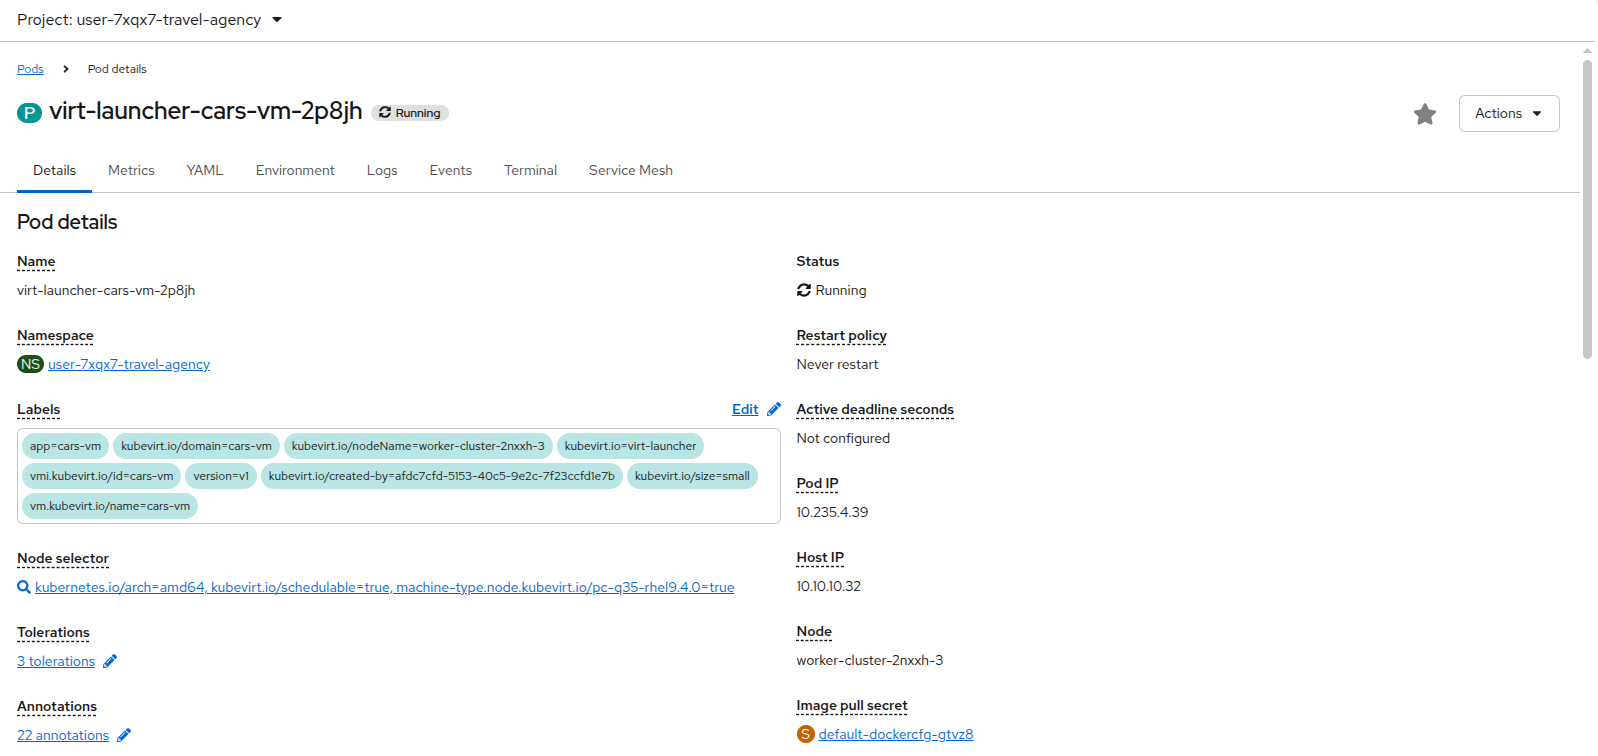
The 2 containers associated with each virtual machine are the compute container, and the guest-console-log. You can check this by clicking on any one of the pods in your project and scrolling down to see the container list.
Let’s add the Travel Booking application to the service mesh.
We do this by adding a sidecar container to each of the workloads.
| It’s the same process for VMs and containers. |
This forms the actual dataplane of the mesh, and consists of an envoy-proxy (namely the istio-proxy container).
The provided scripts will insert the injection annotation sidecar.istio.io/inject in each workload and also restart them, so that service mesh can inject the istio-proxy container and start applying the configured policies.
Execute the following scripts in the Terminal to the right:
./add-envoy-to-travel-agency-services-domain.sh./add-envoy-to-travel-portal-domain.sh./add-envoy-to-travel-control.sh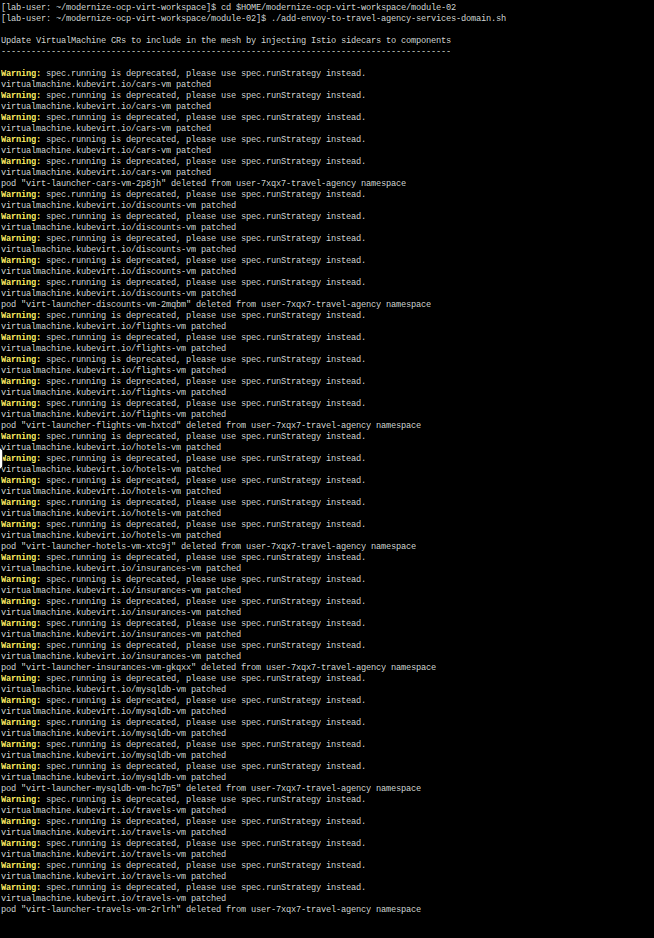
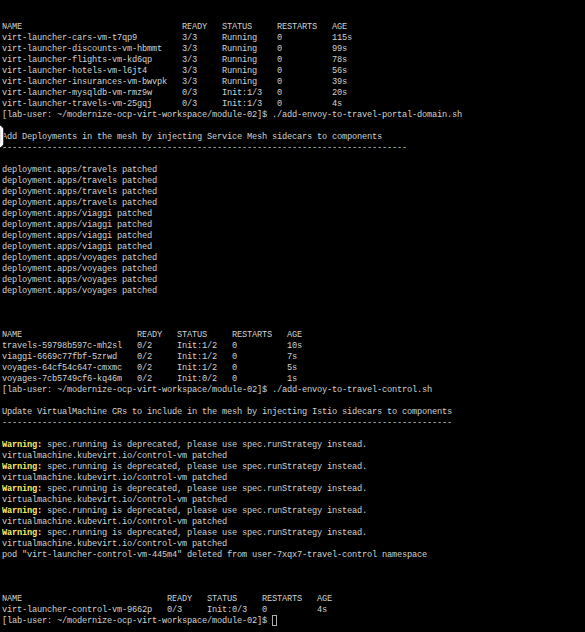
INFO: For details of how this is done see the scripts at add-envoy-to-travel-agency-services-domain.sh, add-envoy-to-travel-portal-domain.sh, add-envoy-to-travel-control.sh.
Now we have included all Travel Booking VMs and Containers in the mesh, and each POD now consists of 3 running containers: compute, guest-console-log, and now the istio-proxy container.

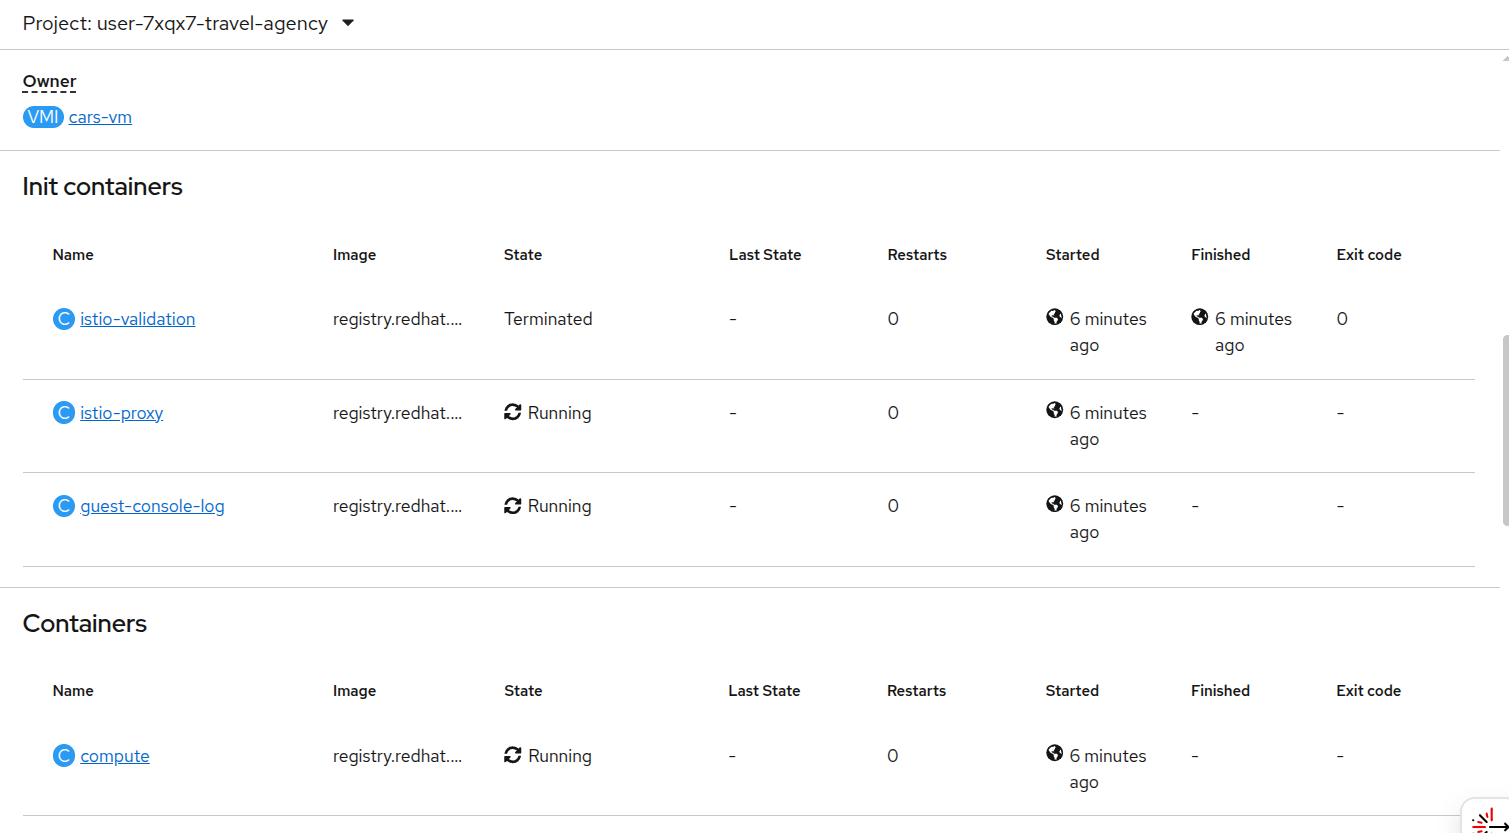
This is it!! The VMs can now take advantage of all the service mesh features.
Validate Service Mesh enabled applications
With the istio-proxy container now added to each virtual machine workload, we are now able to visualize network information about the Travel Booking services in our 3 namespaces.
Let’s return to the Service Mesh → Traffic Graph menu and see what type of information the graph has for us now.
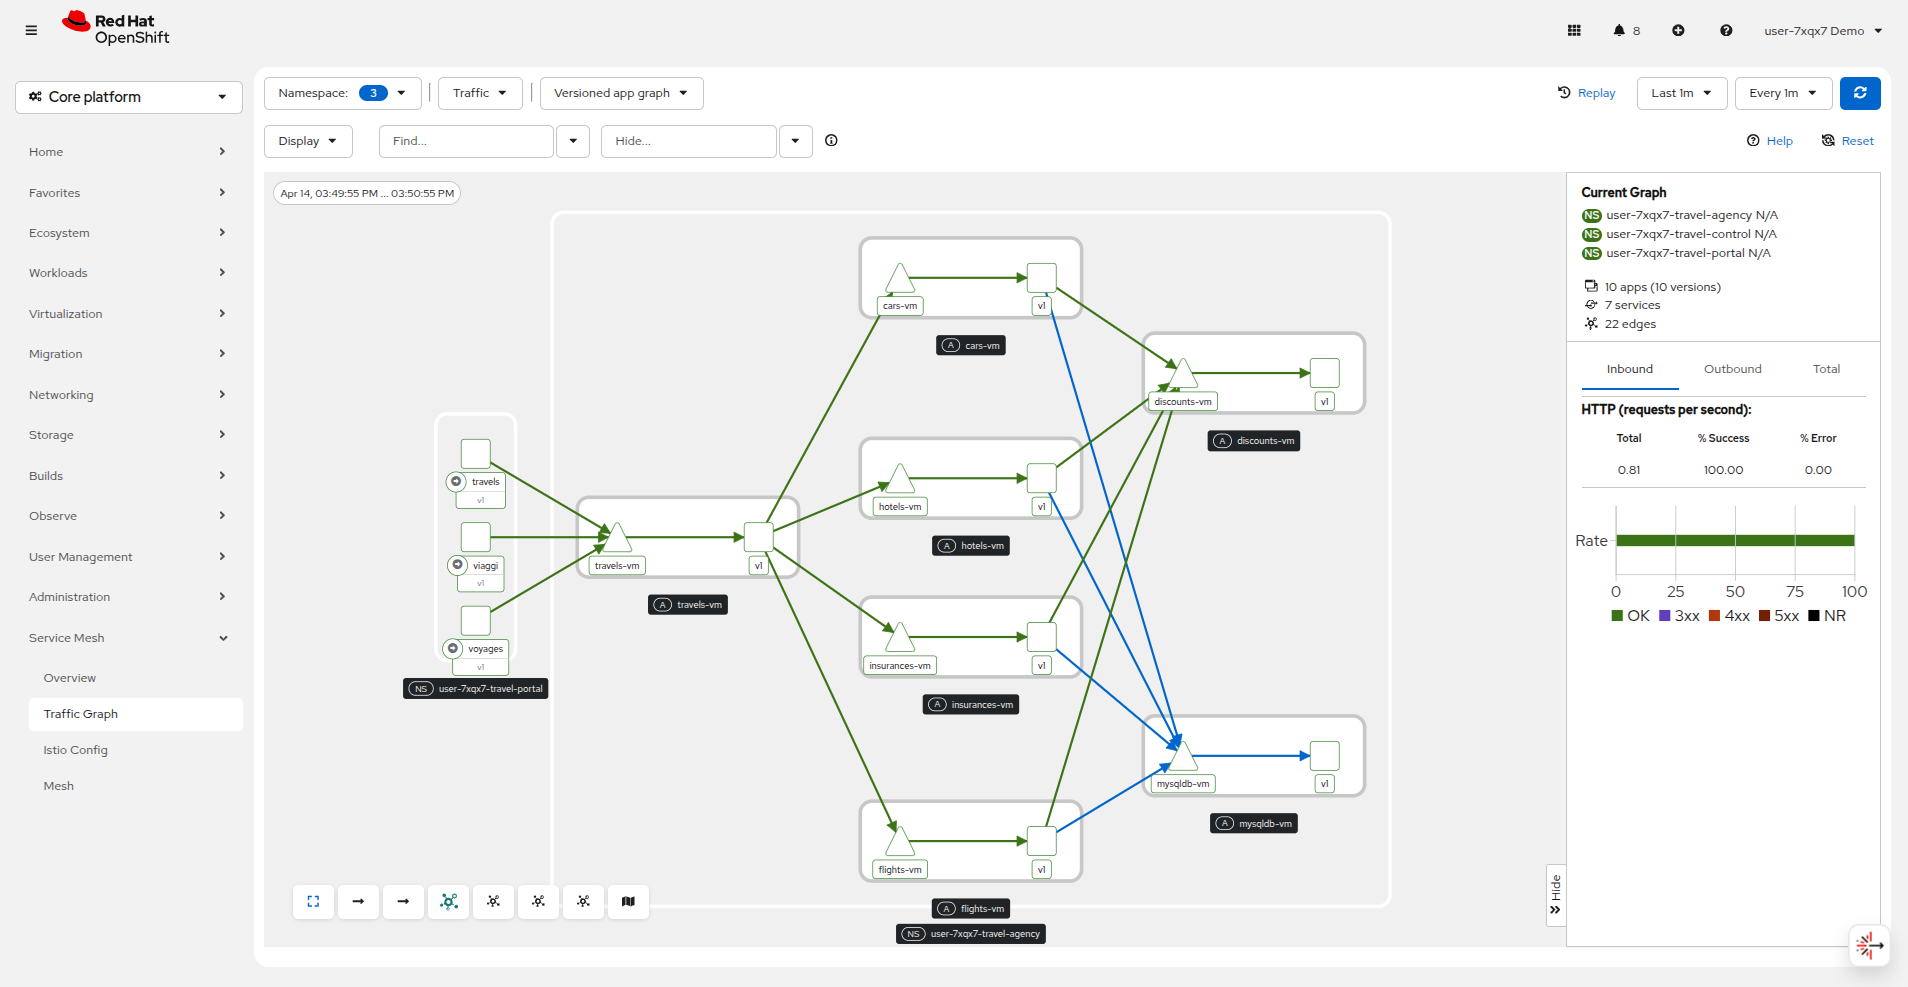
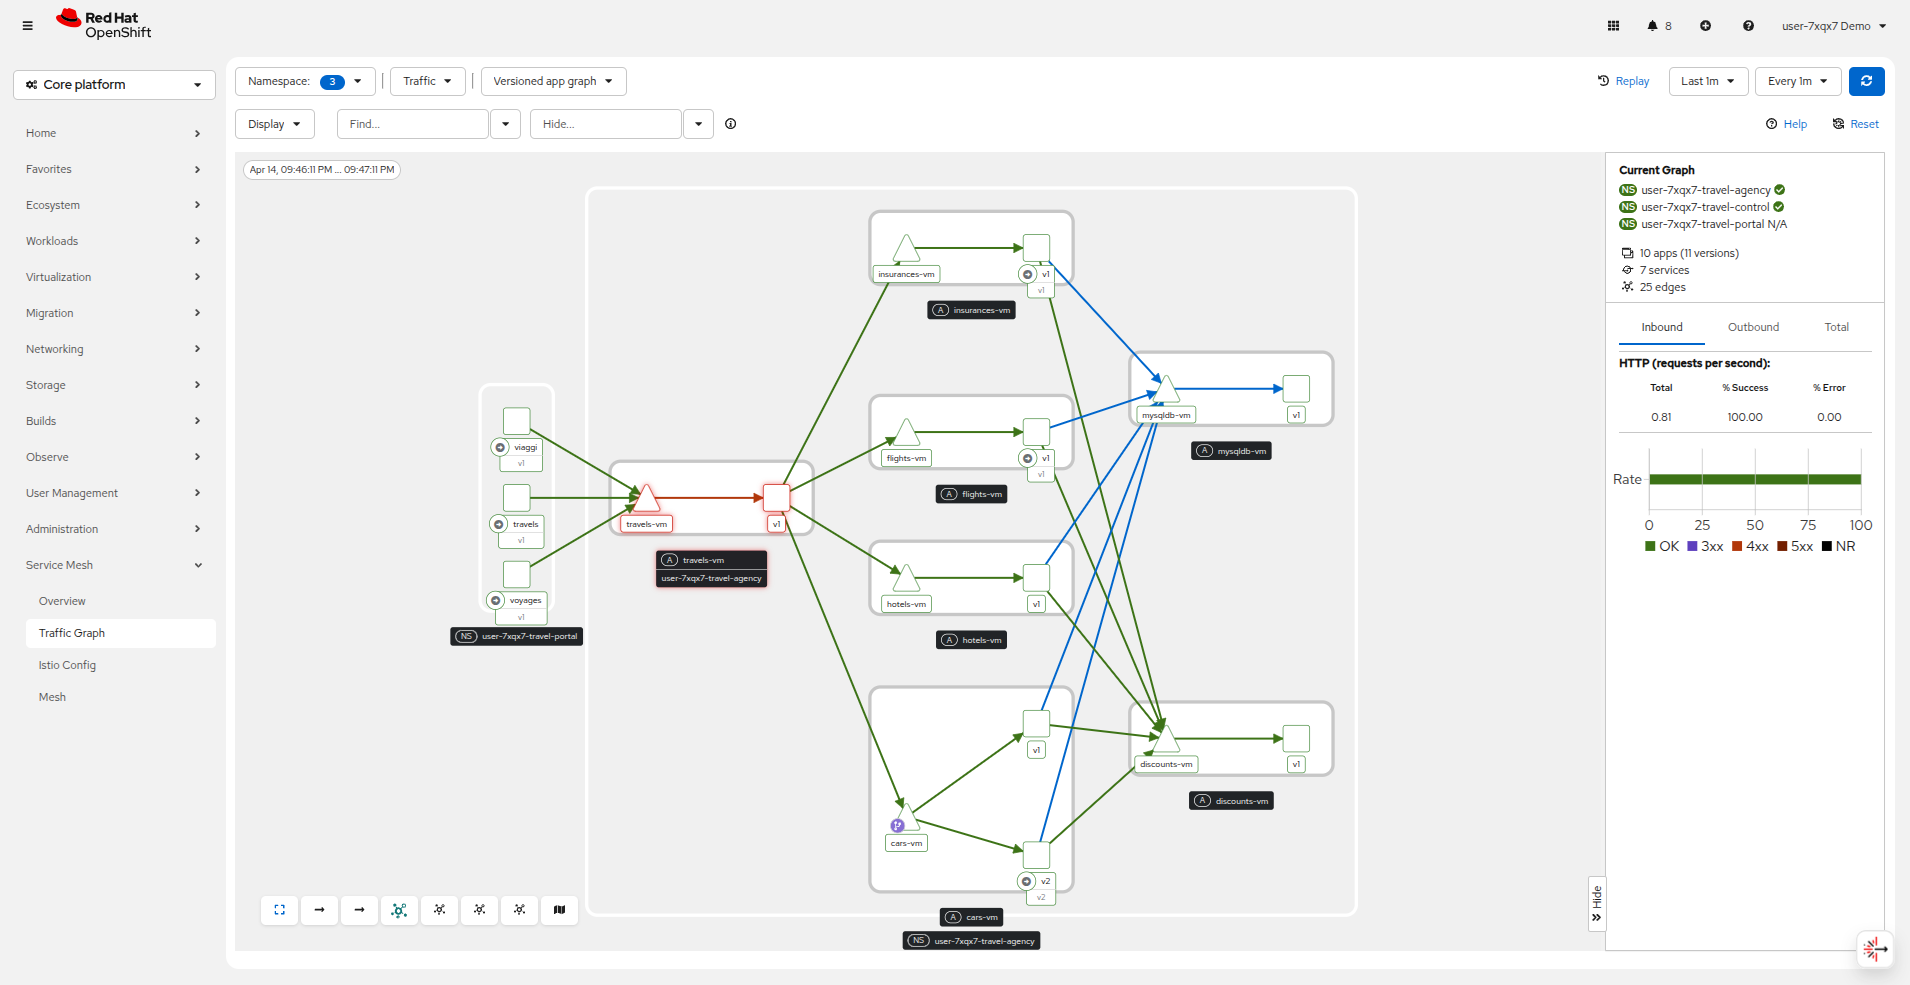
The Versioned App Graph shows the whole network of microservices (VMs and containers) and the traffic flowing between them.
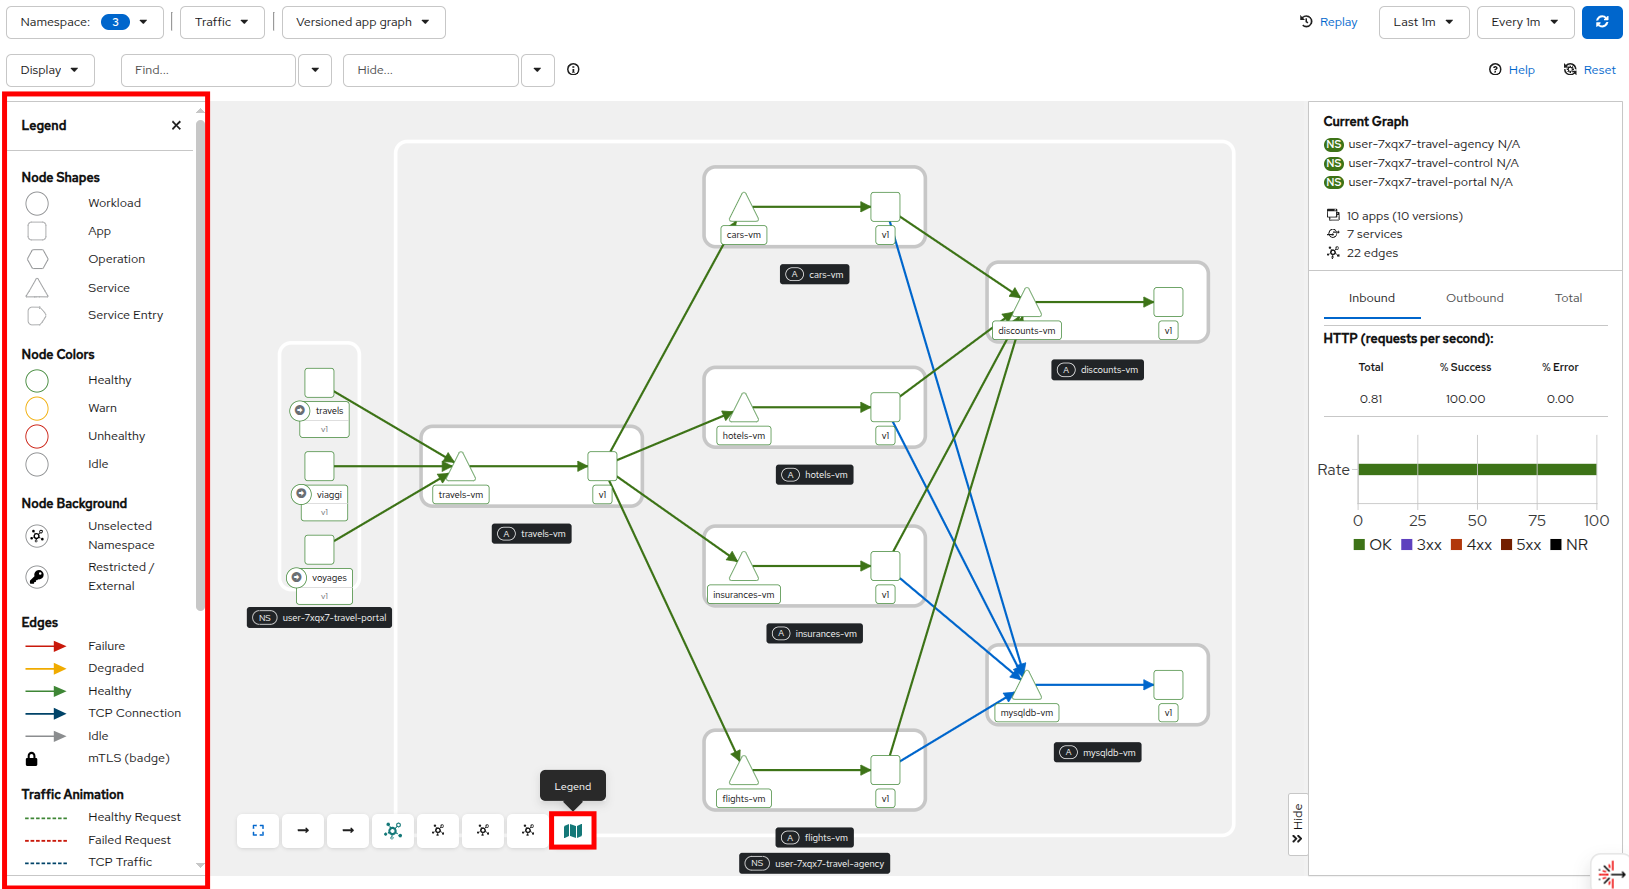
There is a button at the bottom of the graph that will display the Legend for the traffic graph, which will be helpful in determining what is what in the graph.
This shows us now how we can see containers and VMs working side by side within the platform and how the mesh is integrating them without distinguishing on the technology of their runtime.
And all you had to do was to make 1 annotation change to each VM resource.
Expose a VM-based application route
Have you noticed that for all we’ve talked about it, that you still have not been able to access the Travel Booking application UI?
It’s because there is no route configured to expose the services to the outside world.
Since, the user interface is not accessible yet, we will test the solution through internal service-to-service communications.
We are going to simulate a booking request by sending a request for a travel quote from the travels portal in the userX-travel-portal namespace to the travels-vm VM in the userX-travel-agency namespace.
Run the following command to query the Travel Booking application, and verify that it is functioning.
oc -n userX-travel-portal exec $(oc -n userX-travel-portal get po -l app=travels|awk '{print $1}'|tail -n 1) -- curl -s travels-vm.userX-travel-agency.svc.cluster.local:8000/travels/London |jqYou should receive a quote similar to the one following:
{
  "city": "London",
  "coordinates": null,
  "createdAt": "2025-03-24T13:58:06Z",
  "status": "Valid",
  "flights": [
    {
      "airline": "Red Airlines",
      "price": 1018
    },
    {
      "airline": "Blue Airlines",
      "price": 368
    },
    {
      "airline": "Green Airlines",
      "price": 318
    }
  ],
  "hotels": [
    {
      "hotel": "Grand Hotel London",
      "price": 590
    },
    {
      "hotel": "Little London Hotel",
      "price": 116
    }
  ],
  "cars": [
    {
      "carModel": "Sports Car",
      "price": 1090
    },
    {
      "carModel": "Economy Car",
      "price": 336
    }
  ],
  "insurances": [
    {
      "company": "Yellow Insurances",
      "price": 325
    },
    {
      "company": "Blue Insurances",
      "price": 74
    }
  ]
}
We will now use the Service Mesh and the Kubernetes Gateway API to expose the control-vm service where you will get to see the Travel Control dashboard.
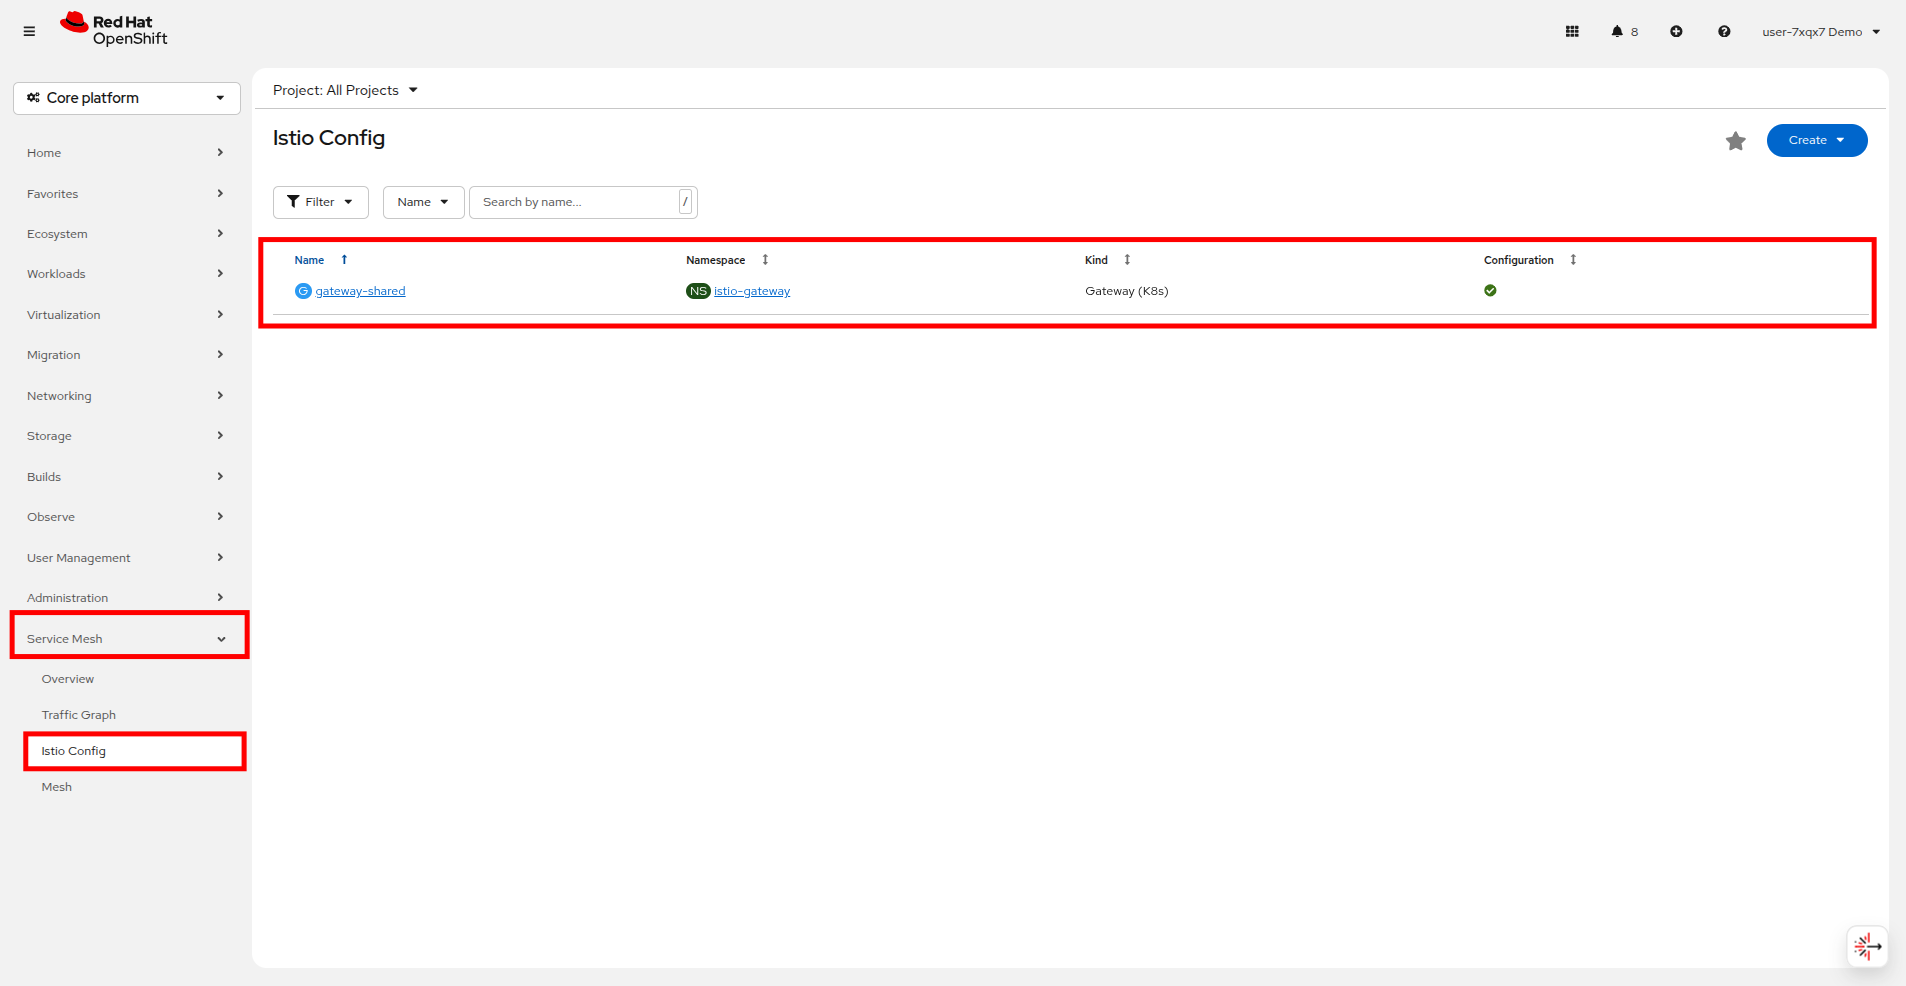
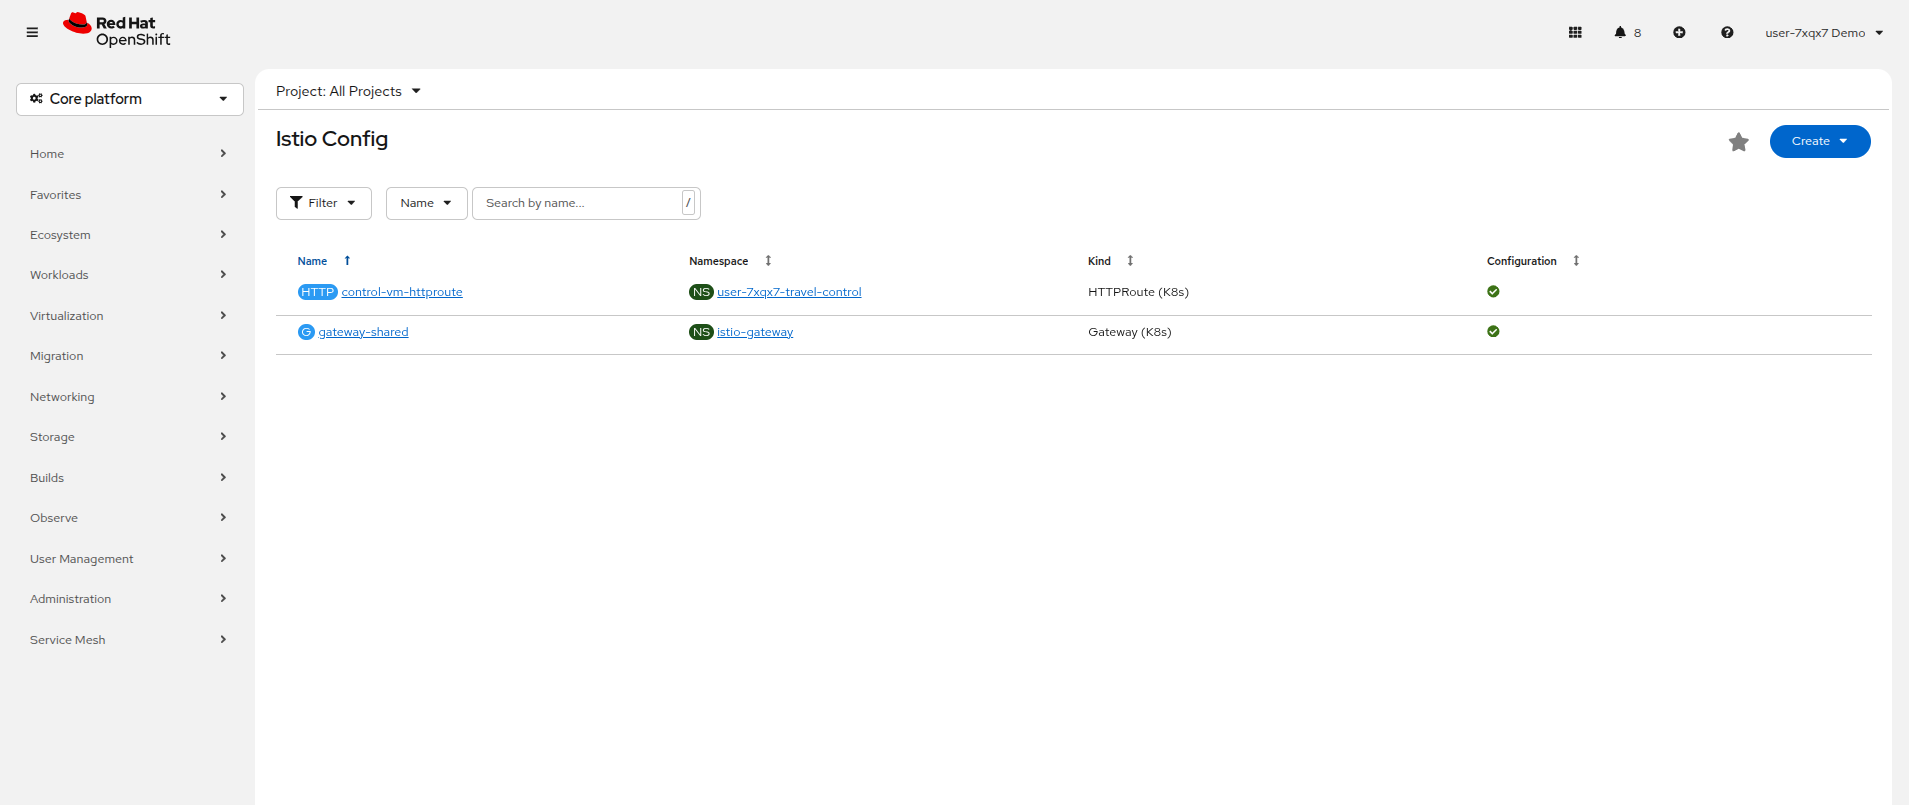
There is an Istio Gateway already deployed in the istio-gateway namespace, and an external Route in that namespace exposing the gateway to outside traffic.
You can see it by clicking on Service Mesh → Istio Config in the left side navigation menu.
In this exercise you will create an HTTPRoute (Gateway API) that attaches to that existing gateway and forwards HTTP requests to the control-vm service. Copy and paste the following into your terminal on the right side to complete this action.
echo "apiVersion: gateway.networking.k8s.io/v1
kind: HTTPRoute
metadata:
  name: control-vm-httproute
  namespace: userX-travel-control
spec:
  parentRefs:
  - name: gateway-shared
    namespace: istio-gateway
  hostnames:
  - "userX-istio-gateway.apps.cluster.example.com"
  rules:
  - matches:
    - path:
        type: PathPrefix
        value: /
    backendRefs:
    - name: control-vm
      port: 8080" | oc apply -f -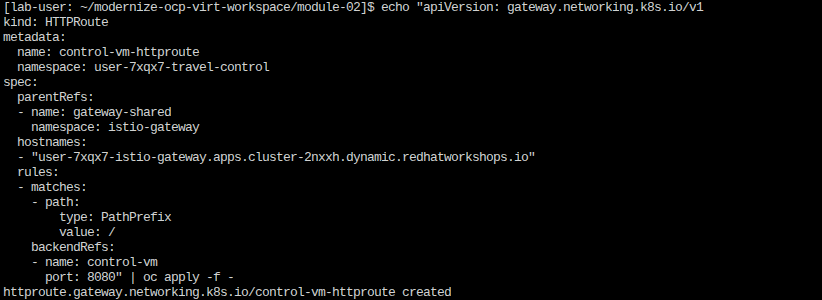
If you refresh the page on your OpenShift console you should see that there is now an HTTPRoute created in the Istio Config pane.
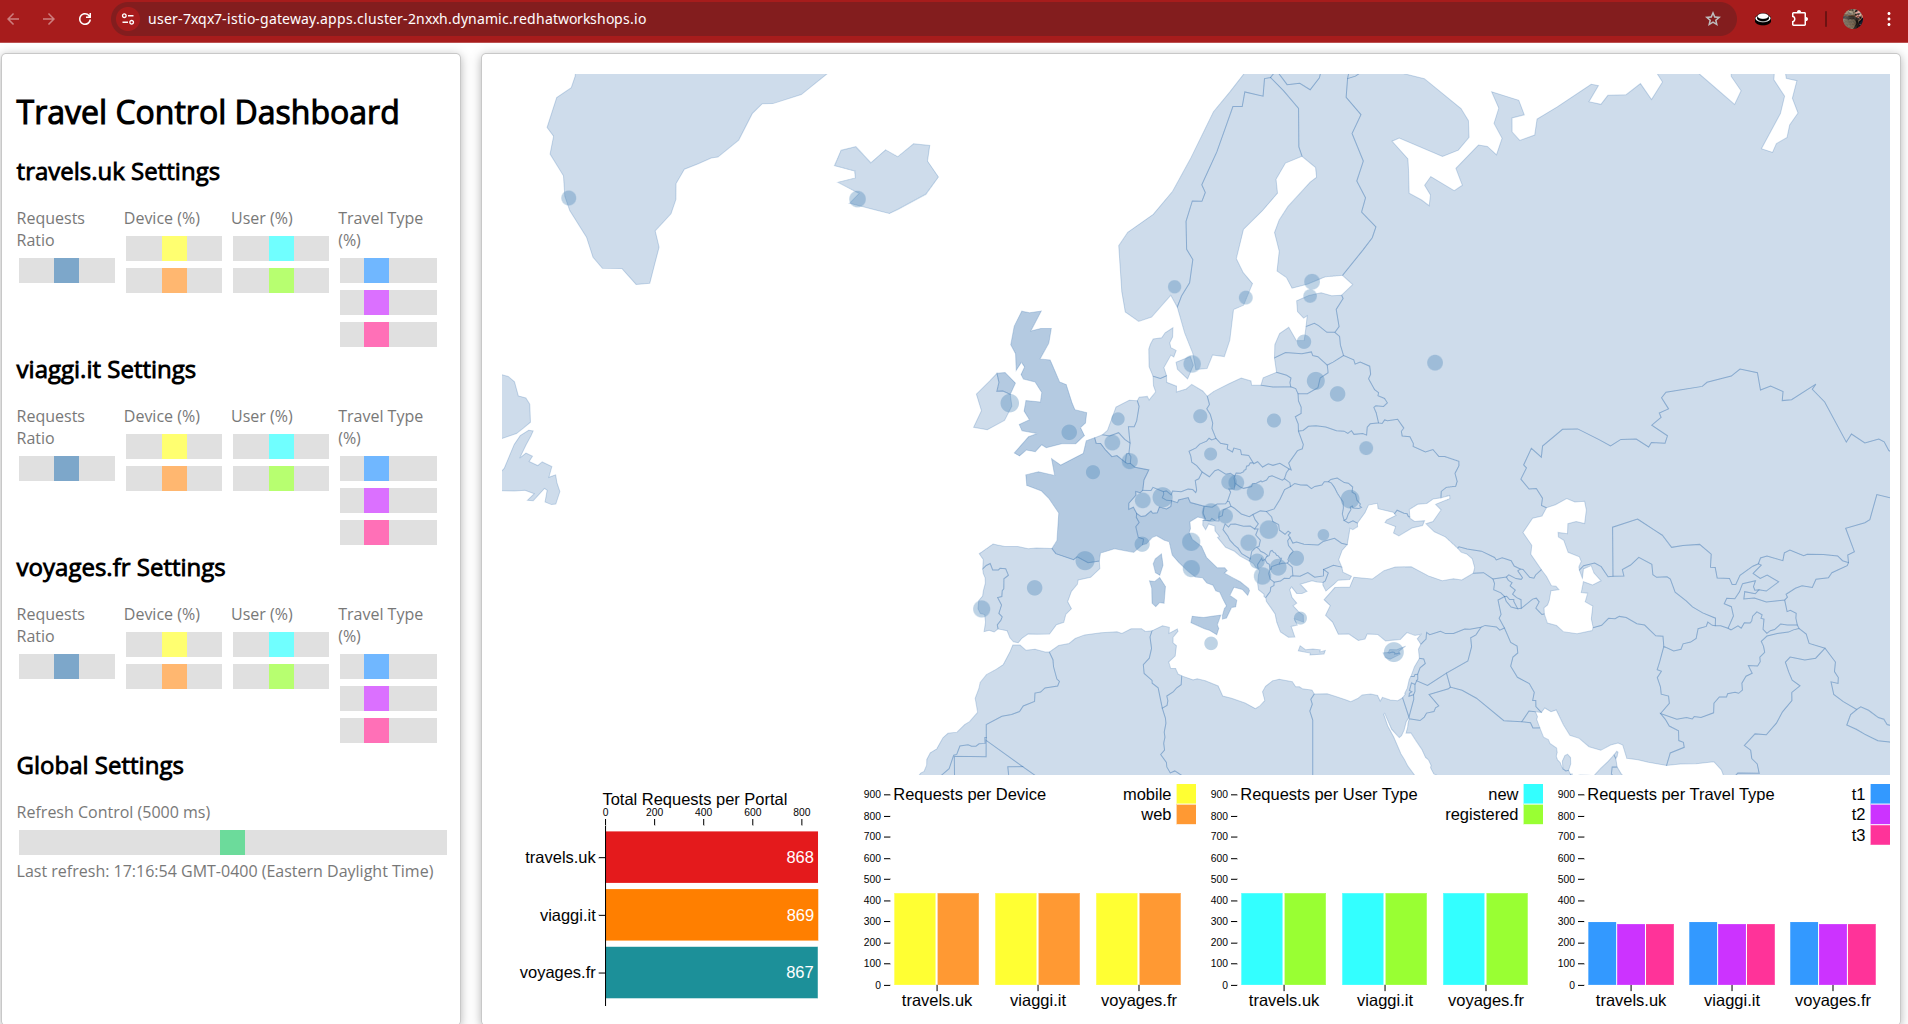
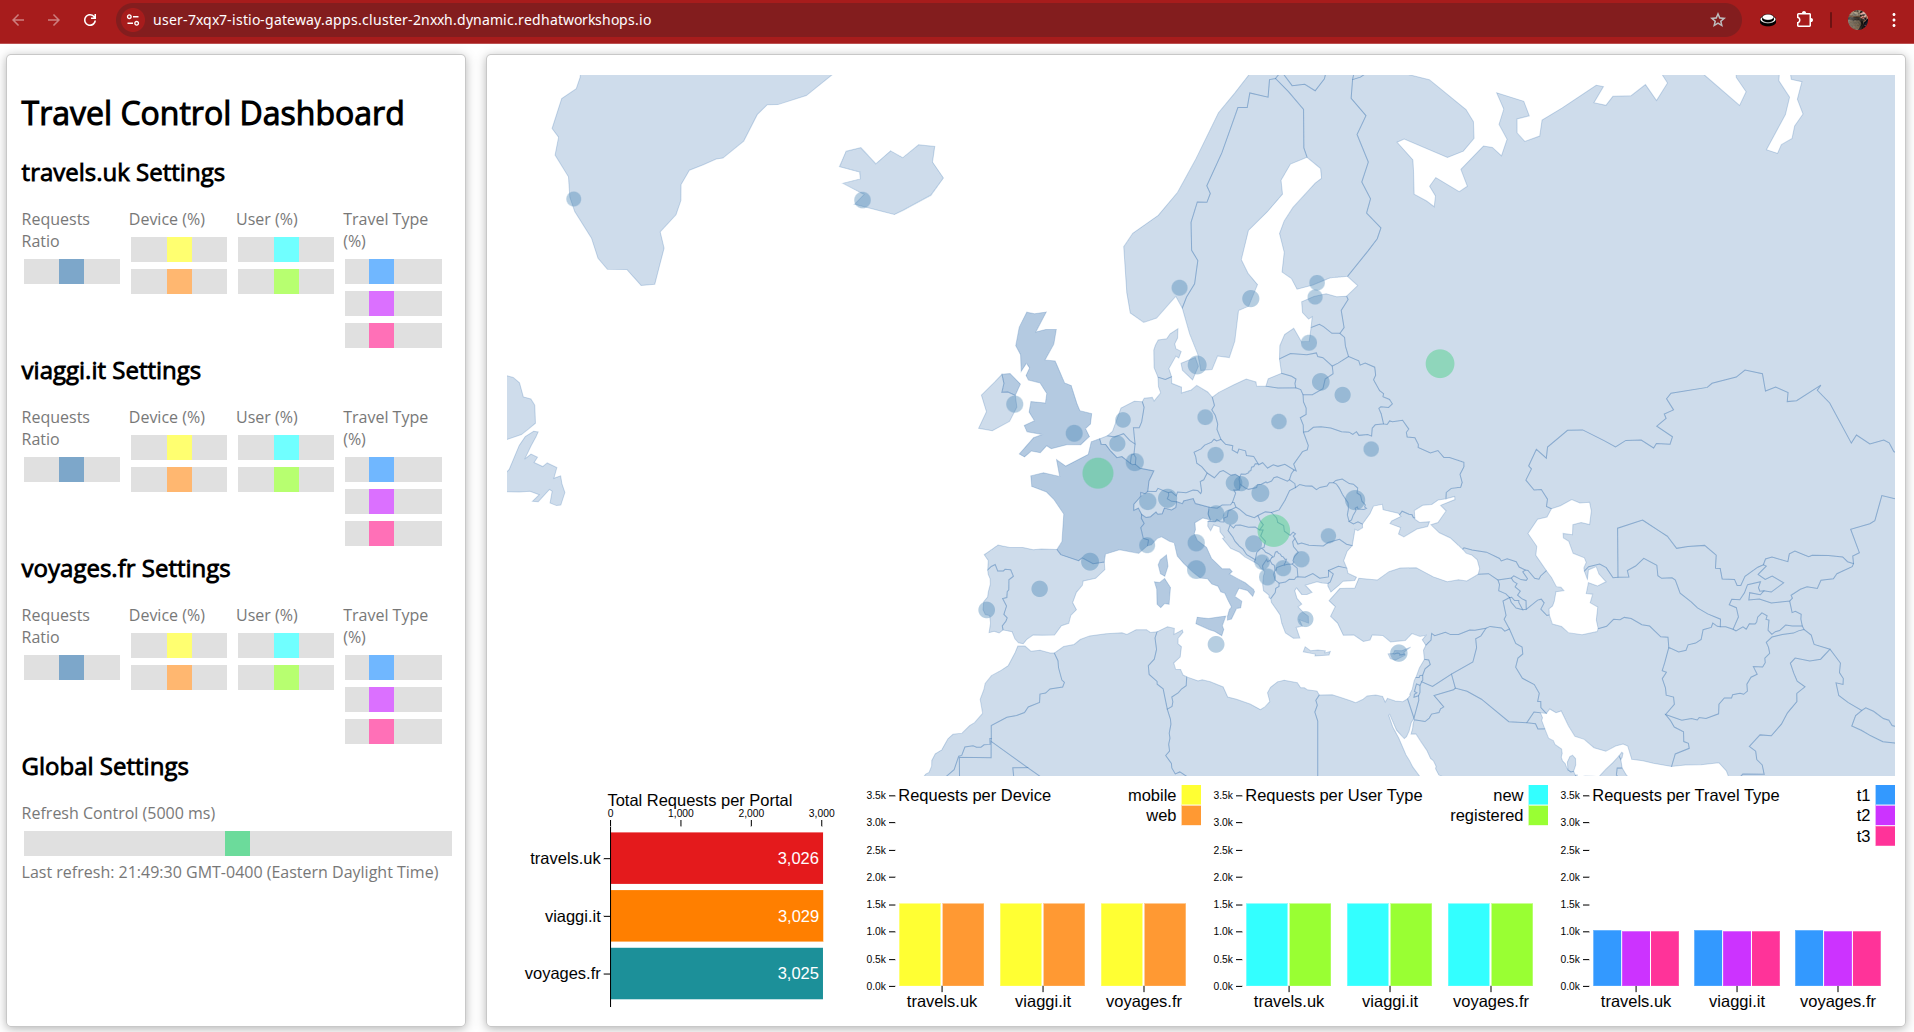
If everything is correct, you should now be able to access the Travel Control dashboard through the istio-gateway.
Click on the link here: Travel Control Dashboard
Versioning VMs with a canary release
Adding virtual machines and containers to a service mesh is not only about networking, or visualization of traffic flows. Often you will be required to deploy and maintain multiple versions of an application to provide new features to a subset of customer, or to test a site update before going live to the general public.
-
In this Task, you will be releasing a new version v2 of the cars-vm component, allowing 10% of new customers to access this new service, whilst the remainder will continue to use version v1.
-
If everything goes well, you will gradually increase up to 80% of the traffic to version v2 by running the command again with different attributes.
-
In order to achieve this, you are going to deploy a new VM with the name
cars-vm-v2and a labelversion=v2 -
Then you need to configure a
DestinationRuleto be able to direct the traffic to both versions of thecars-vmservice. -
Finally, you will create a
VirtualServiceto split the traffic between the 2 versions according to the defined percentages. -
For more details, find the manifests used here.
Ensure that you are in the userX-travel-agency project in your terminal on the right, and then execute the script below which delivers all the above configurations:
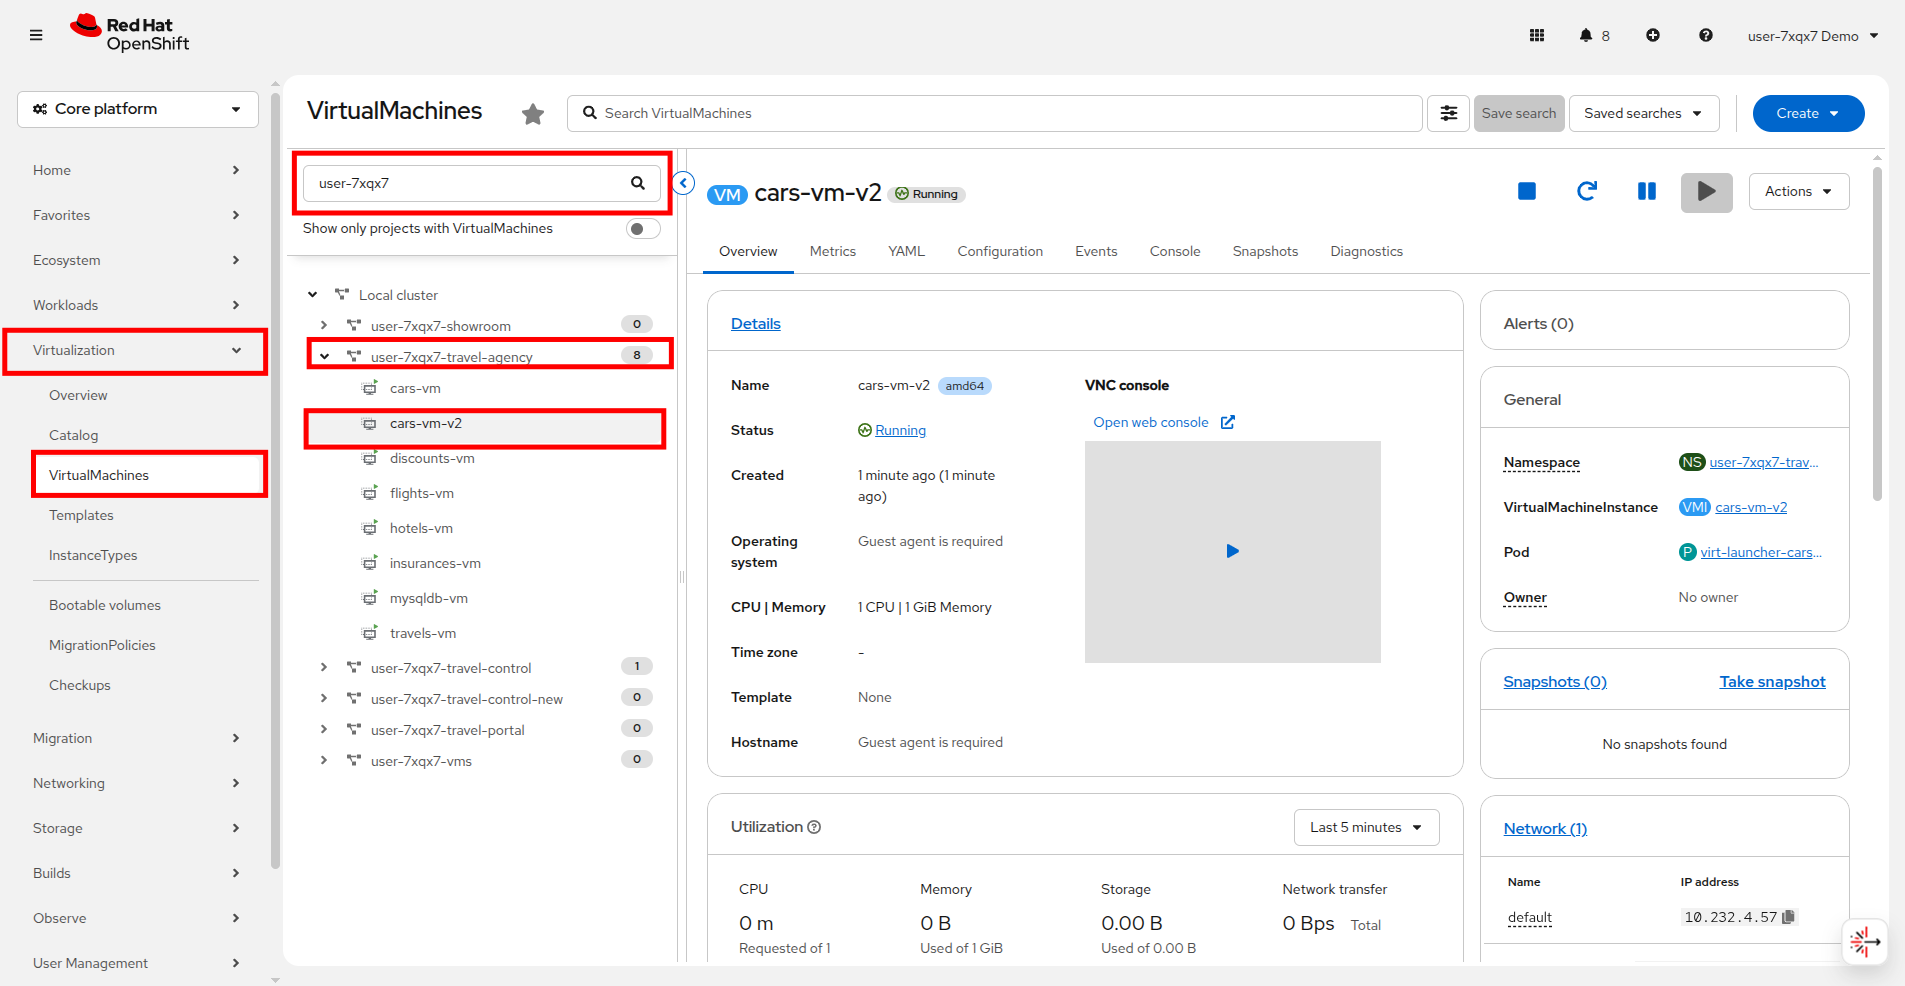
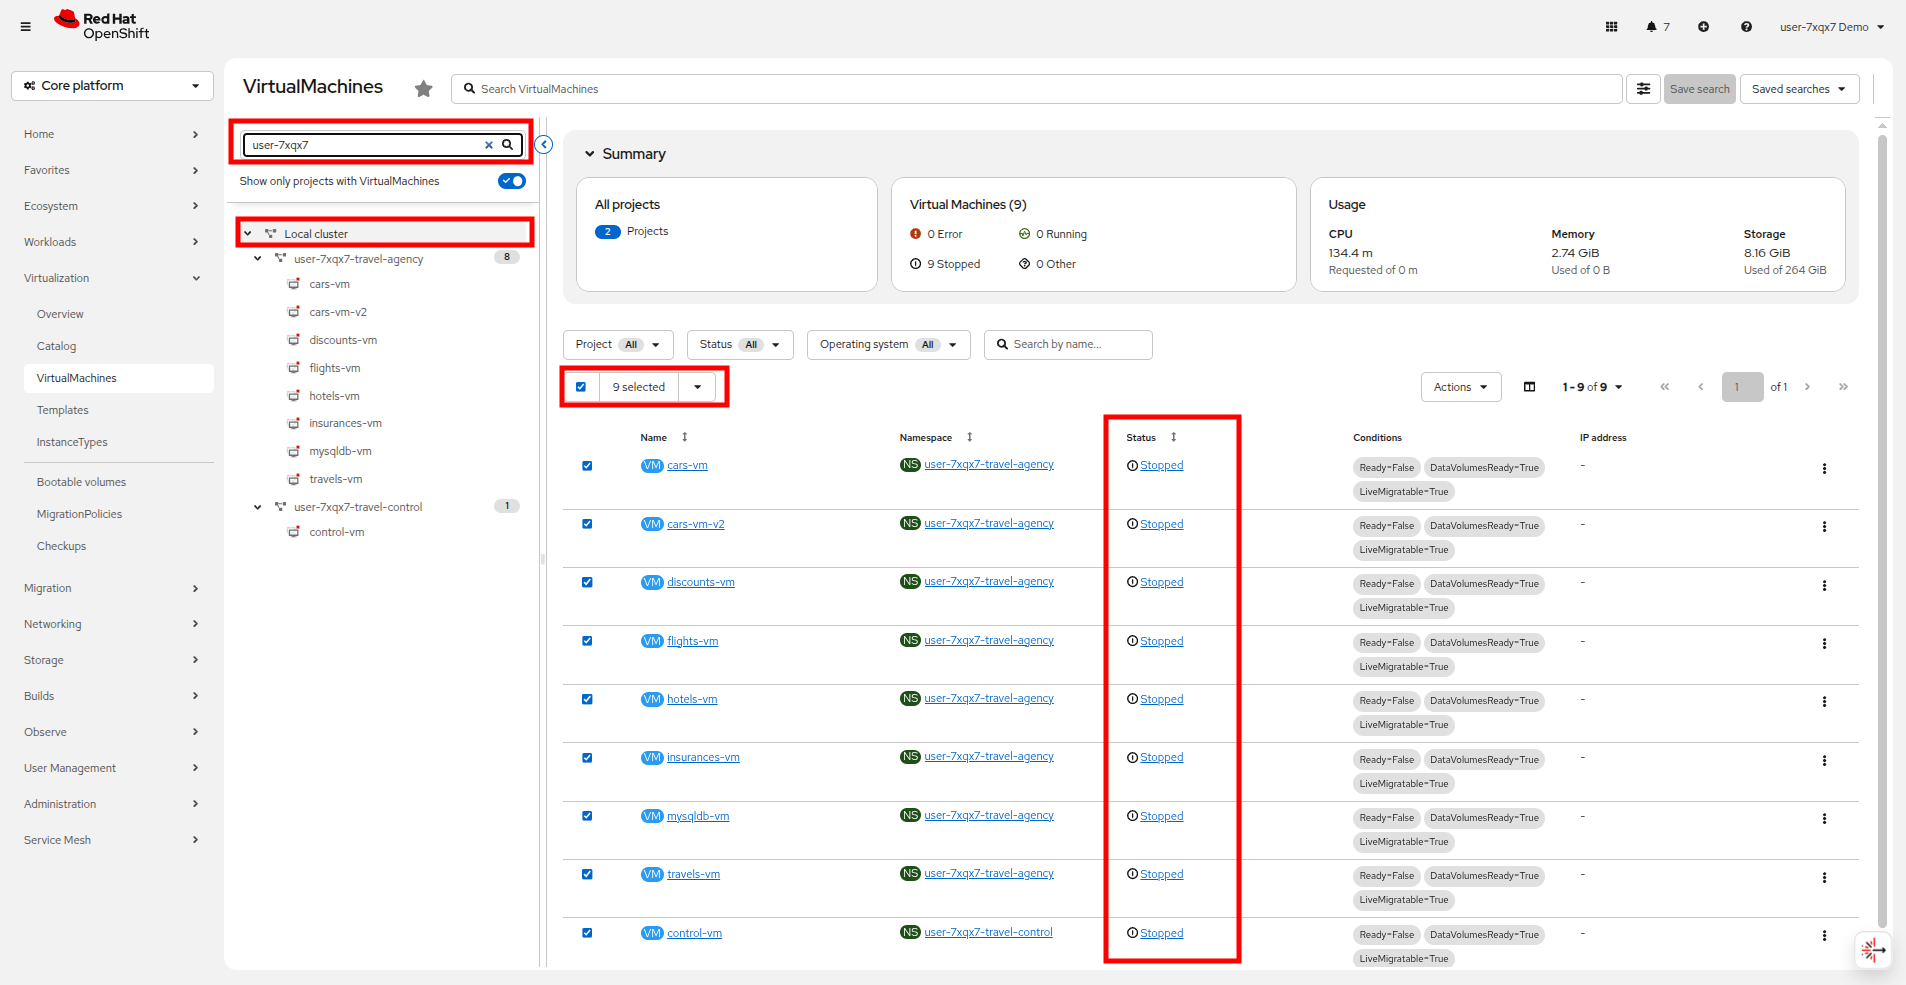
./multipleversions-for-car-vm-in-the-mesh.sh 90 10With the script completed successfully, click on Virtualization → VirtualMachines and view the new cars-vm-v2 running in the userX-travel-agency project.
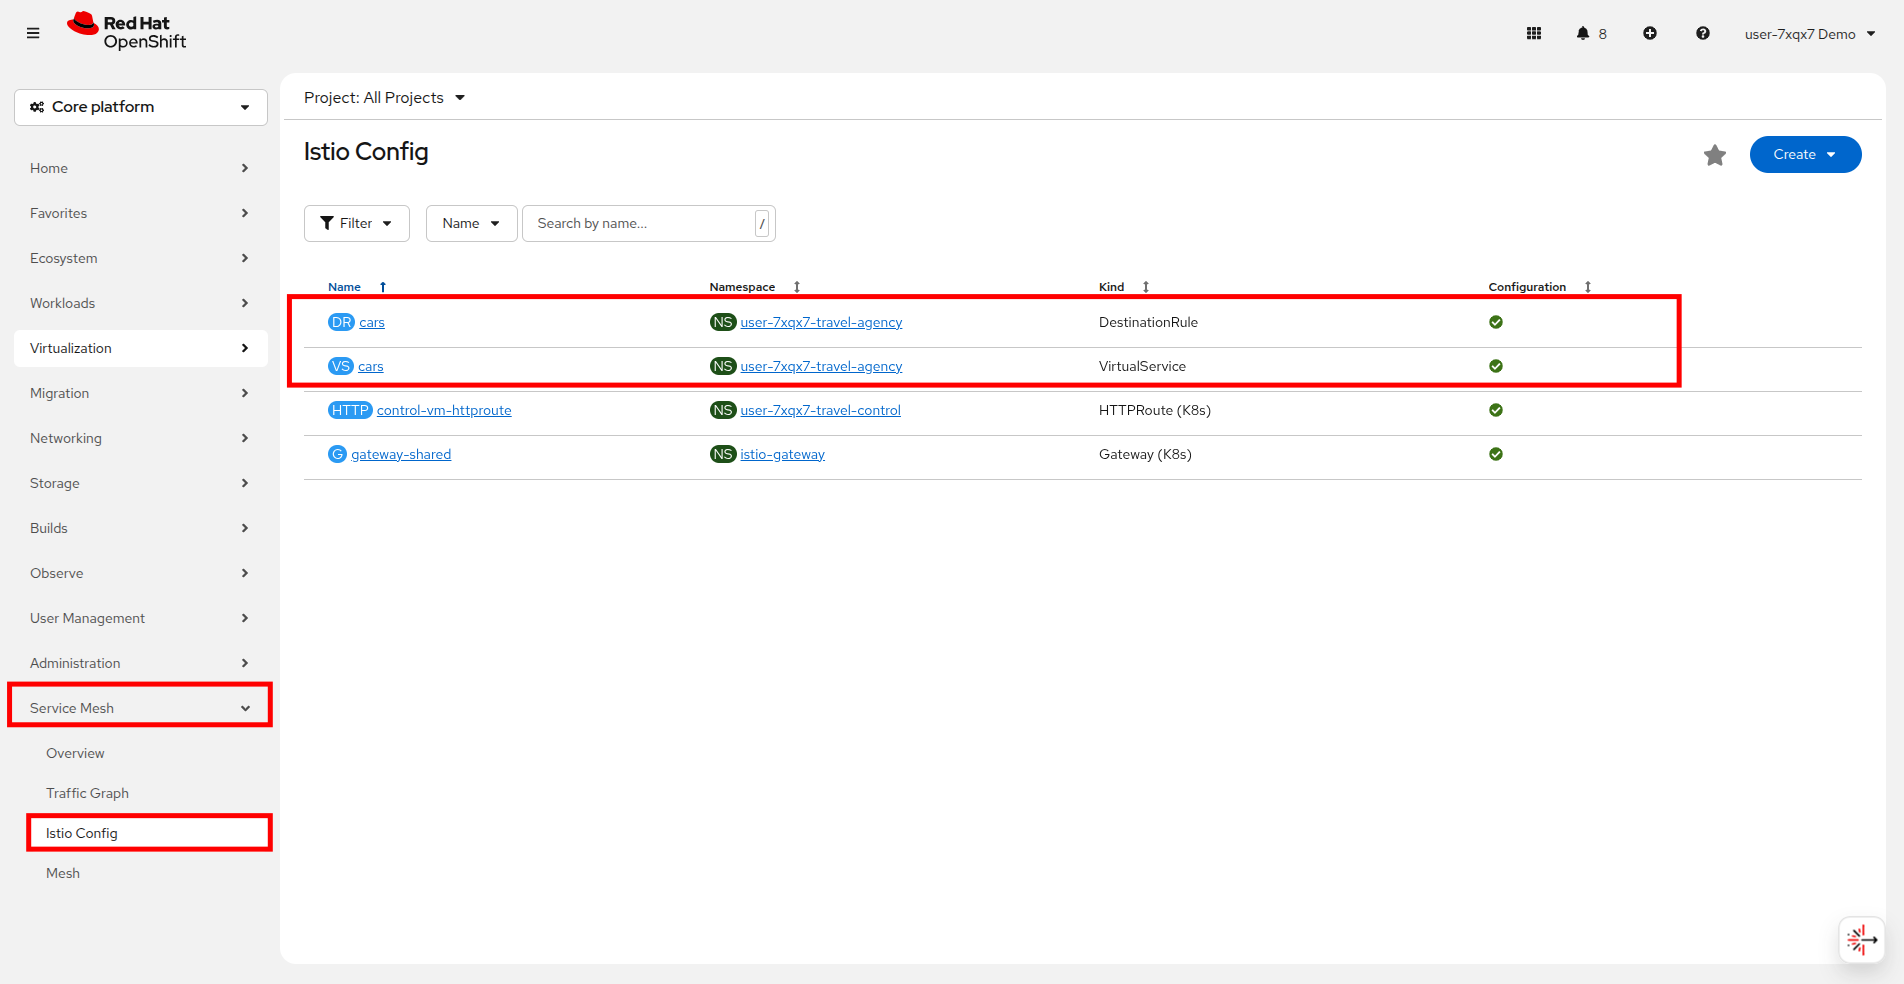
Now click on Service Mesh → Istio Config. This will now list the new traffic management configurations under the userX-travel-agency project.
Shortly after creating the traffic configuration you will start seeing the result of the traffic split in the traffic graph as well. Click on Service Mesh → Traffic Graph to return to that view.
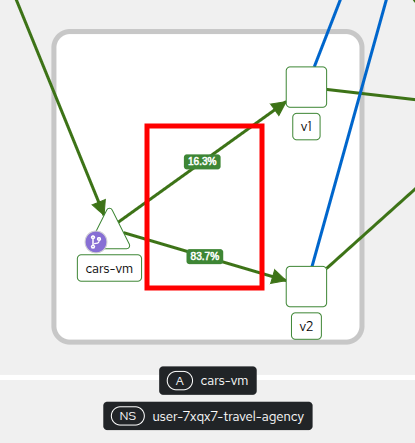
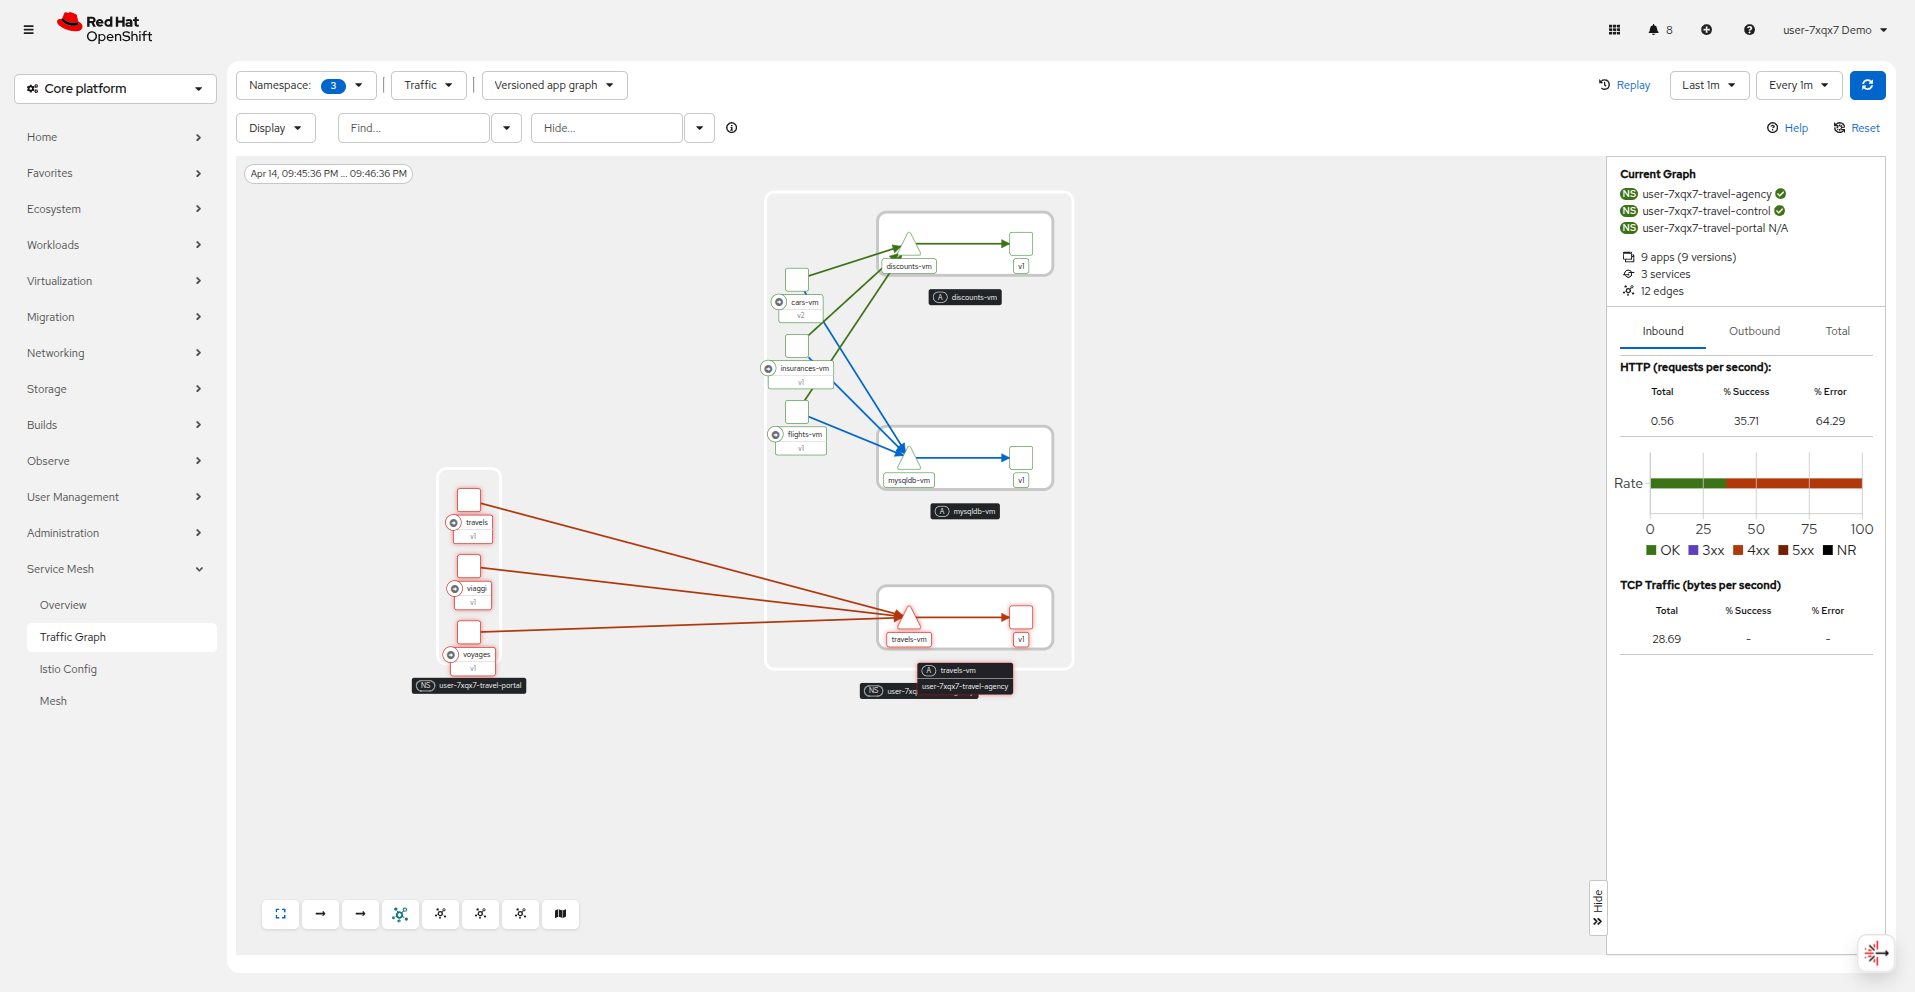
Notice that cars-vm is now directing traffic to both v1 and v2.
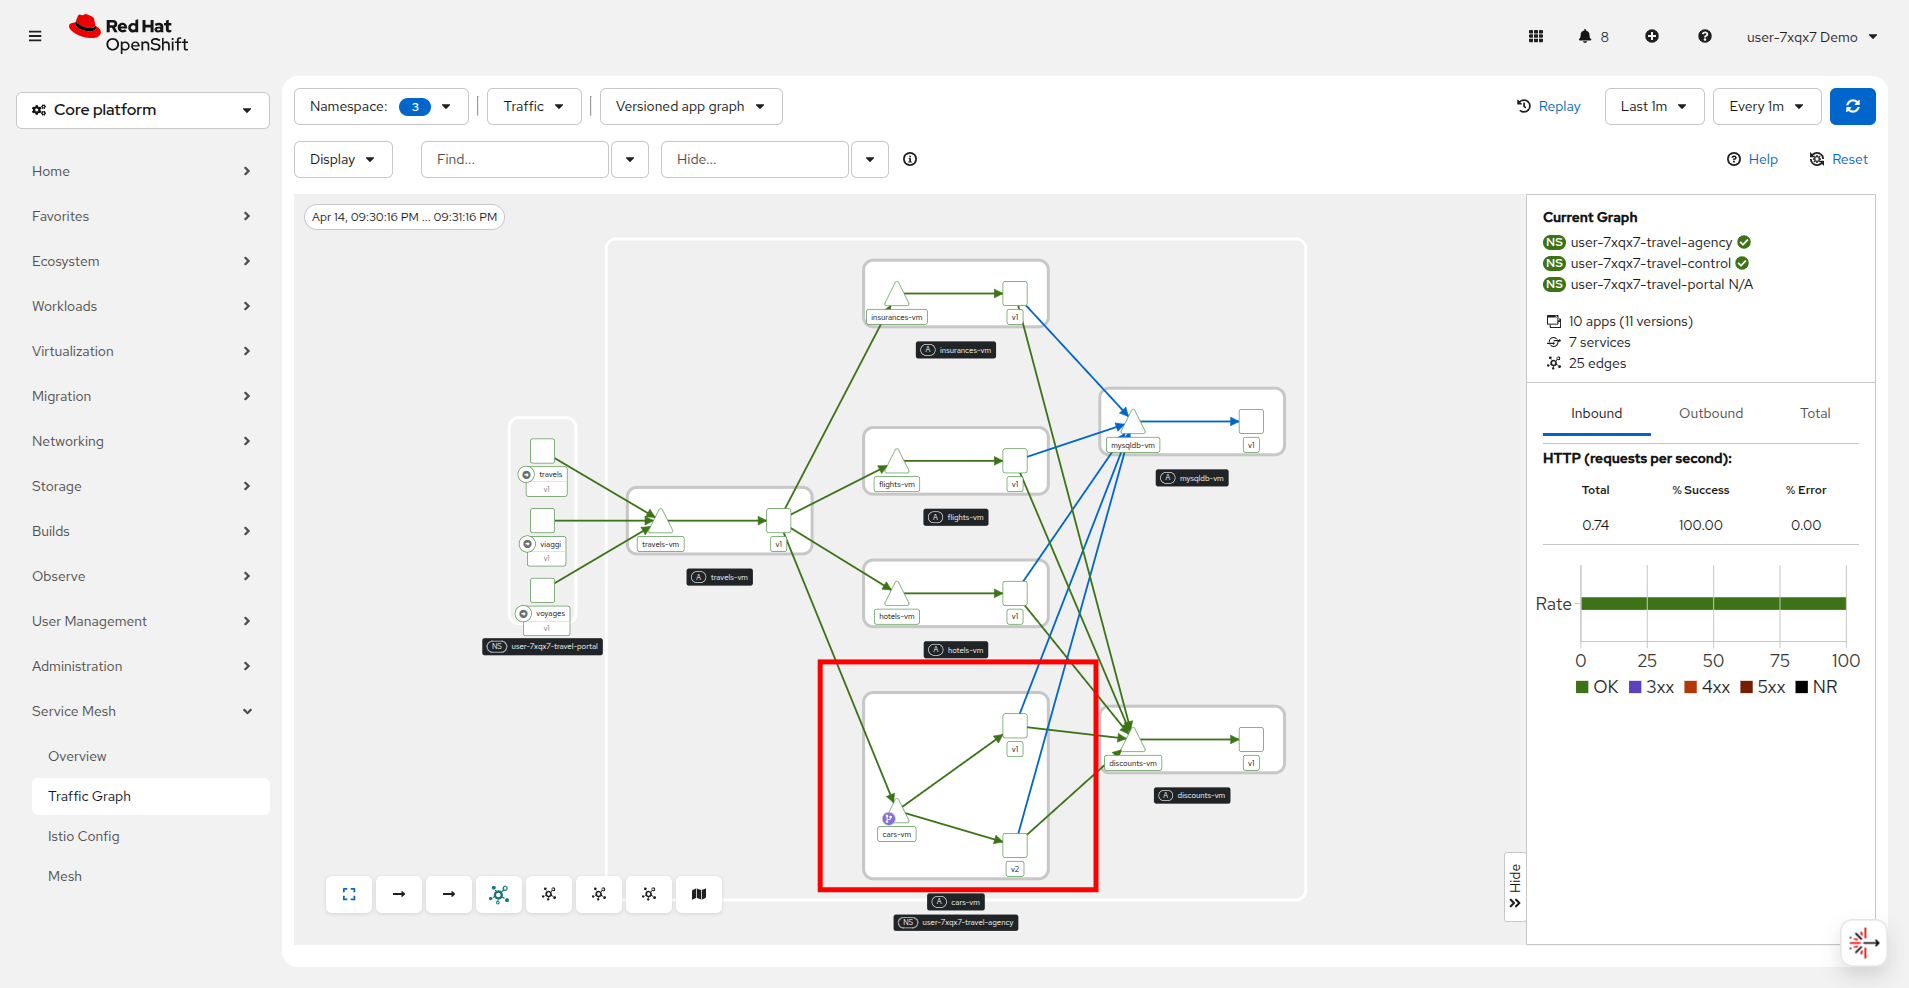
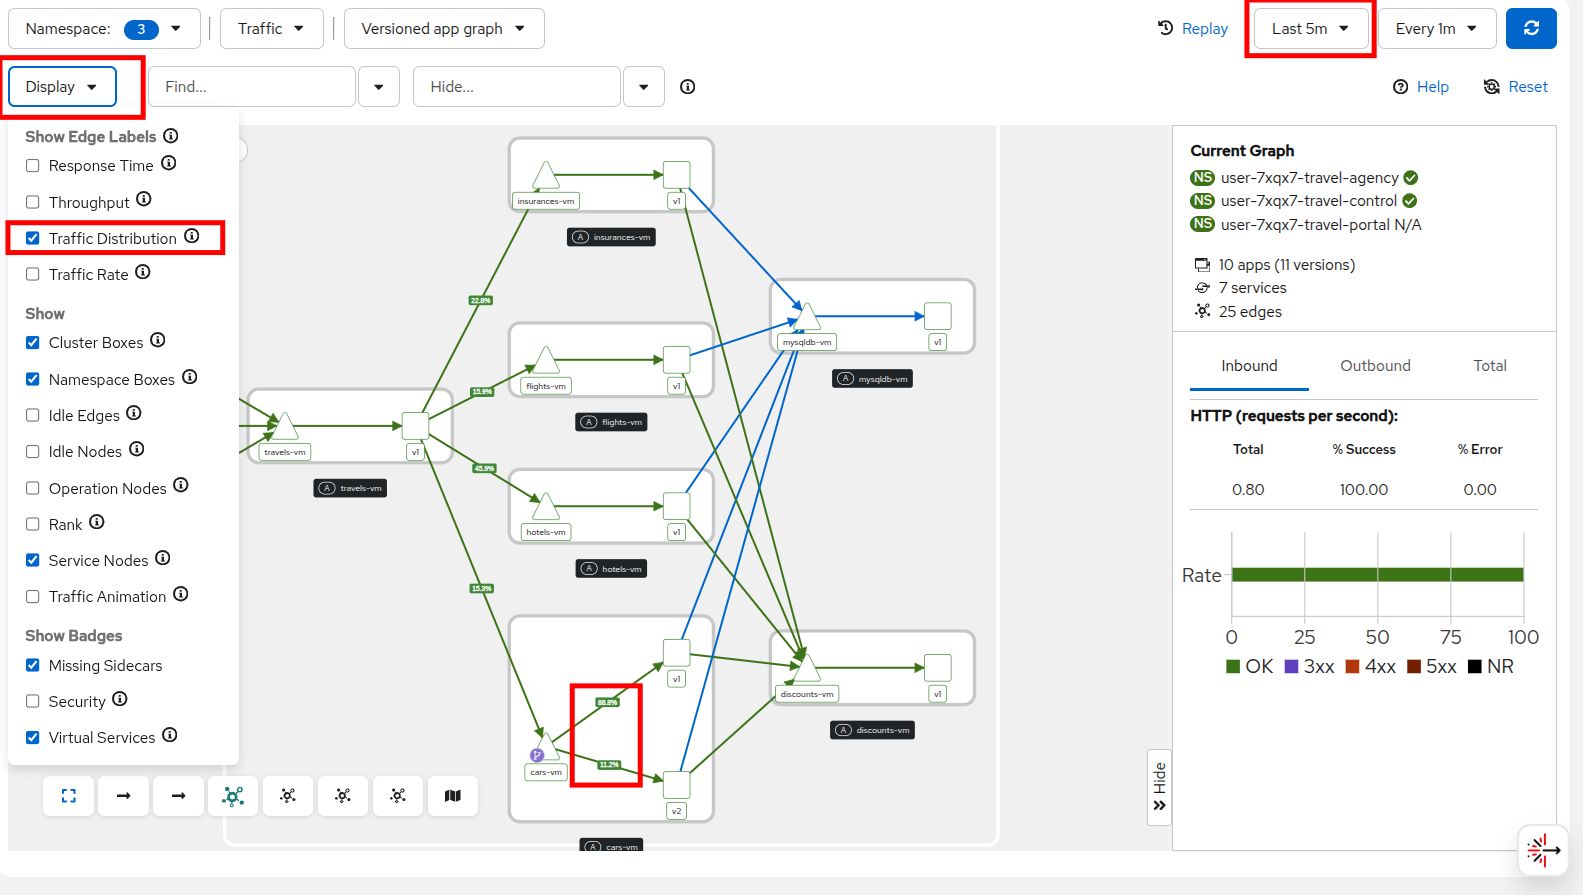
The 2 drop-down menus (top right) can define the graph refreshing periods.
Select Display → Traffic Distribution from the drop down menu at the top to visualize the traffic percentages between the services.
After you have verified the new version is stable go ahead and increase the traffic routing for version v2 to 80%.
./multipleversions-for-car-vm-in-the-mesh.sh 20 80The Istio config has now been updated and soon the traffic graph should show 80% traffic flowing to version v2.
Access limitations with authorization policies
Outside of network traffic monitoring and shaping, enhanced security is another benefit added by integrating into a service mesh.
Although security features such as traffic encryption are by default applied in the mesh, other practices such as access rules on what is a service’s visibility and who can access them are not applied by default. This can have a 2-fold effect:
-
Services that are bad actors deployed by 3rd party in the cluster can gain access to a sensitive service,
-
The amount of all possible destinations in a very large cluster can make the configuration of an
istio-proxysidecar very large, causing evictions and possible cluster instability.
In order to counter these possible issues, you can apply AuthorizationPolicy resources and visibility restrictions based on the principal (the service identification) included in the exchanged certificate.
About Authorization Policies
The authorization policy enforces access control to the inbound traffic in the server side Envoy proxy. Each Envoy proxy runs an authorization engine that authorizes requests at runtime. When a request comes to the proxy, the authorization engine evaluates the request context against the current authorization policies, and returns the authorization result, either ALLOW or DENY. Operators specify Istio authorization policies using YAML notation.
First we are going to apply a default deny all policy to each project, which is considered a best practice.
echo "apiVersion: security.istio.io/v1
kind: AuthorizationPolicy
metadata:
  name: allow-nothing
  namespace: userX-travel-agency
spec:
  {}" | oc apply -f -
echo "apiVersion: security.istio.io/v1
kind: AuthorizationPolicy
metadata:
name: allow-nothing
namespace: userX-travel-control
spec:
{}" | oc apply -f -With these policies in place, all of services of the Travel Booking application are now unable to communicate with each other, as they no longer have permission to do so.
Click on Service Mesh → Traffic Graph and note all of the failures that now appear.
You can confirm the effect by accessing the Travel Booking Dashboard which now fails to load, and returns a message: RBAC: access denied.

Now we will restore communication by applying 2 fine-grained AuthorizationPolicy resources which will allow communications between:
-
The
istio-gateway→control-vm, -
From services in the userX-travel-portal → to services in userX-travel-agency and userX-travel-control.
echo "apiVersion: security.istio.io/v1
kind: AuthorizationPolicy
metadata:
  name: allow-selective-principals-travel-control
  namespace: userX-travel-control
spec:
  action: ALLOW
  rules:
  - from:
    - source:
        principals: [\"cluster.local/ns/istio-gateway/sa/gateway-shared-istio\"]" | oc apply -f -
echo "apiVersion: security.istio.io/v1
kind: AuthorizationPolicy
metadata:
name: allow-selective-principals-travel-agency
namespace: userX-travel-agency
spec:
action: ALLOW
rules:
- from:
- source:
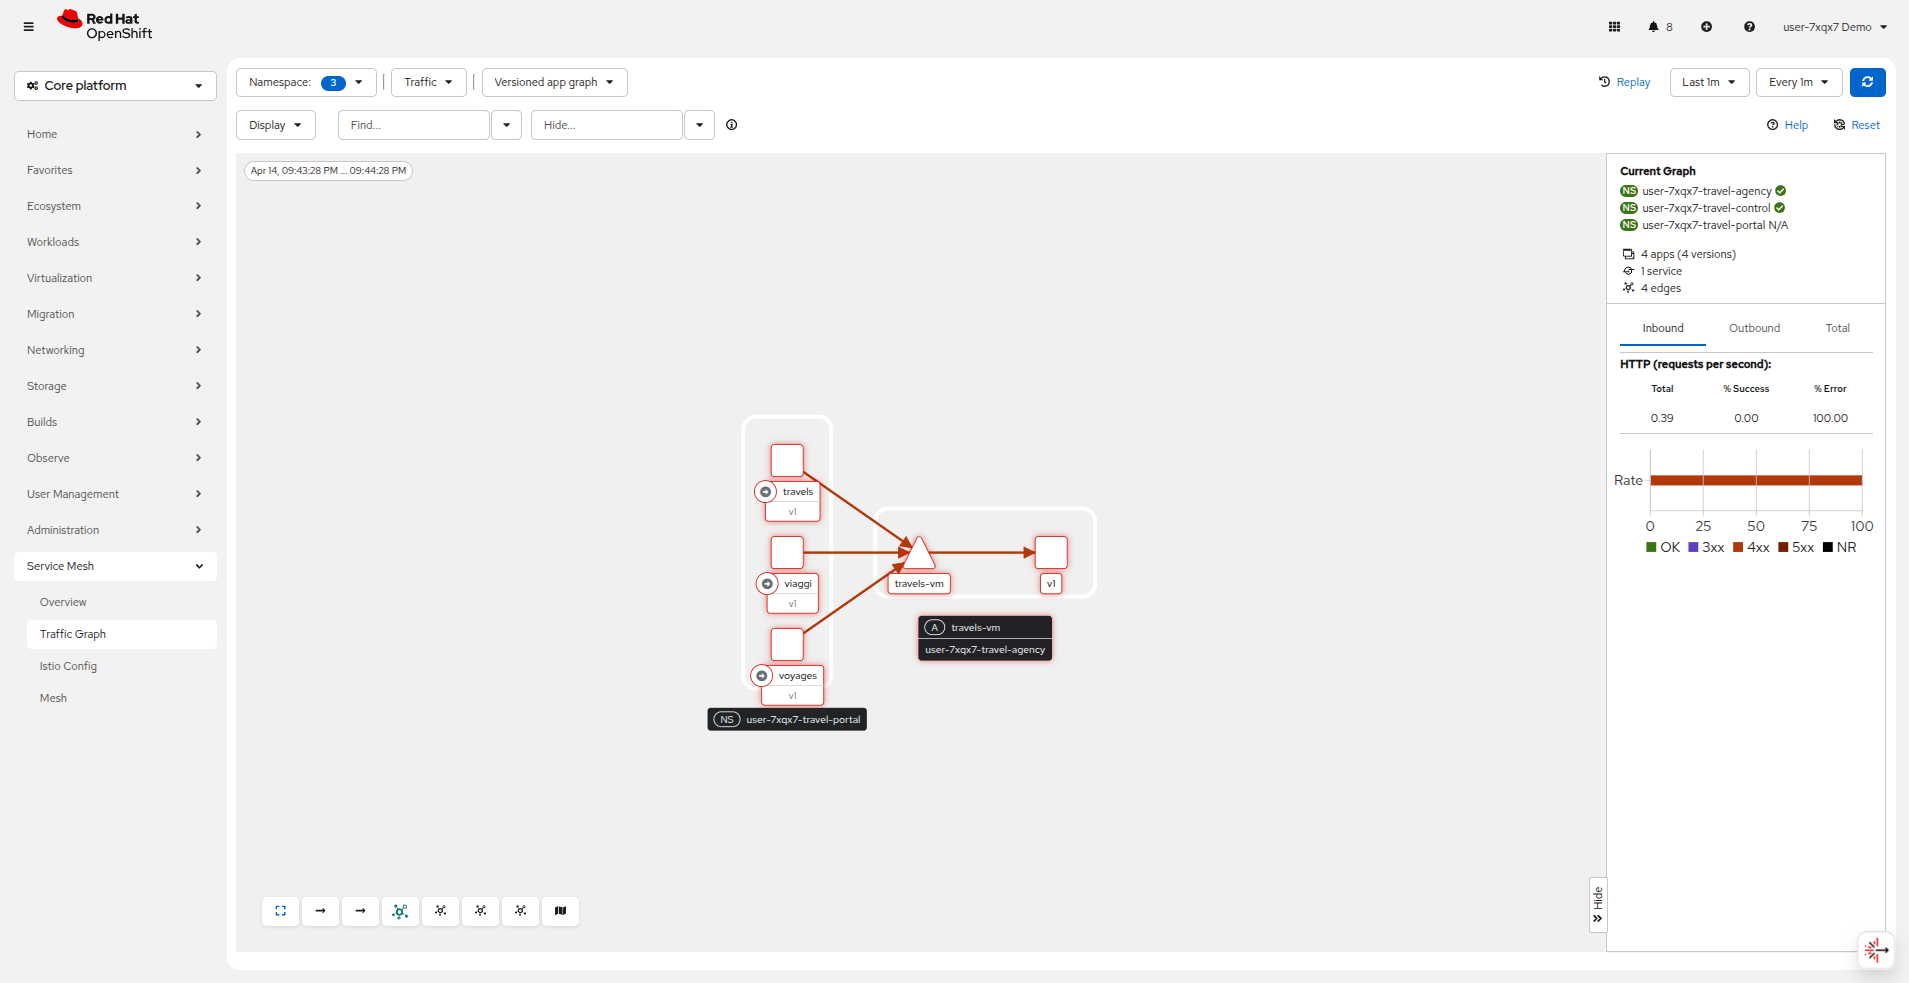
principals: [\"cluster.local/ns/userX-travel-agency/sa/default\",\"cluster.local/ns/userX-travel-portal/sa/default\"]" | oc apply -f -Returning to Service Mesh → Traffic Graph you should see that connectivity begins to be restored between the userX-travel-portal and userX-travel-agency projects. You can refresh the graph to see the changes take place.

After a short period you should also regain access to the Travel Booking Dashboard.
While this makes everything seem like it’s back to normal, you may notice that communication between the travel-control and travel-agency services has been restricted with our new policy, as it is unnecessary and the applied AuthorizationPolicy rule does not permit it.
You can verify this by executing the following command in the terminal:
oc -n userX-travel-control run toolbox --rm -it --image=registry.redhat.io/rhel9/toolbox --restart=Never --overrides='
{
  "spec": {
    "containers": [
      {
        "name": "toolbox",
        "image": "registry.redhat.io/rhel9/toolbox",
        "command": ["/bin/bash", "-c"],
        "args": ["curl -si travels-vm.userX-travel-agency.svc.cluster.local:8000/travels/London"],
        "resources": {
          "requests": { "cpu": "500m", "memory": "512Mi" },
          "limits": { "cpu": "500m", "memory": "512Mi" }
        }
      }
    ]
  }
}'
You should receive a response that this operation is forbidden.
HTTP/1.1 403 Forbidden
content-length: 19
content-type: text/plain
date: Mon, 24 Mar 2025 16:10:11 GMT
server: envoy
x-envoy-upstream-service-time: 1| Prior to moving on to the next section, to conserve resources and ensure a smooth lab experience, make sure that any of the VMs currently running in the userX-travel-agency and userX-travel-control projects are shut down. We will not be making use of them again. |
Summary
In this module you have introduced the Travel Booking namespaces, containers and VMs to a service mesh, reviewed all the observability tooling on offer from OpenShift Service Mesh and by now have an understanding of how sidecar containers enable cross-cutting features such as enhanced security, traffic shaping, and network monitoring, without altering the internal application components whether these are VMs or containers.
In the next scenario you will be automating the delivery of these configurations so that they can be monitored and applied as your needs change in a declarative rather than imperative manner by using OpenShift GitOps.