Module 2: Your first feature
In this module you will launch a cloud development environment, make a code change with the help of an AI coding assistant, push your change, and watch it flow through the automated CI/CD pipeline.
Learning objectives
By the end of this module, you will be able to:
-
Launch and navigate a cloud development environment using Red Hat OpenShift Dev Spaces
-
Understand how devfiles standardize development environments across teams
-
Use the Continue AI coding assistant to explore and modify code
-
Run the Quarkus application in dev mode with nested containers
-
Commit and push code changes that trigger an automated CI/CD pipeline
-
Read a SonarQube quality report generated by the pipeline
Exercise 1: Launch Dev Spaces and explore the IDE
Your first task is to launch a cloud development environment. OpenShift Dev Spaces provides a full VS Code-based IDE running on the cluster, with no local installation required.
Launch Dev Spaces
-
In the OpenShift Console, make sure you are in the
{user_name}-devnamespace -
Click Workloads > Topology in the left sidebar
-
On the Parasol Insurance deployment, click the Dev Spaces icon (the bottom icon, with the tooltip "Edit source code")
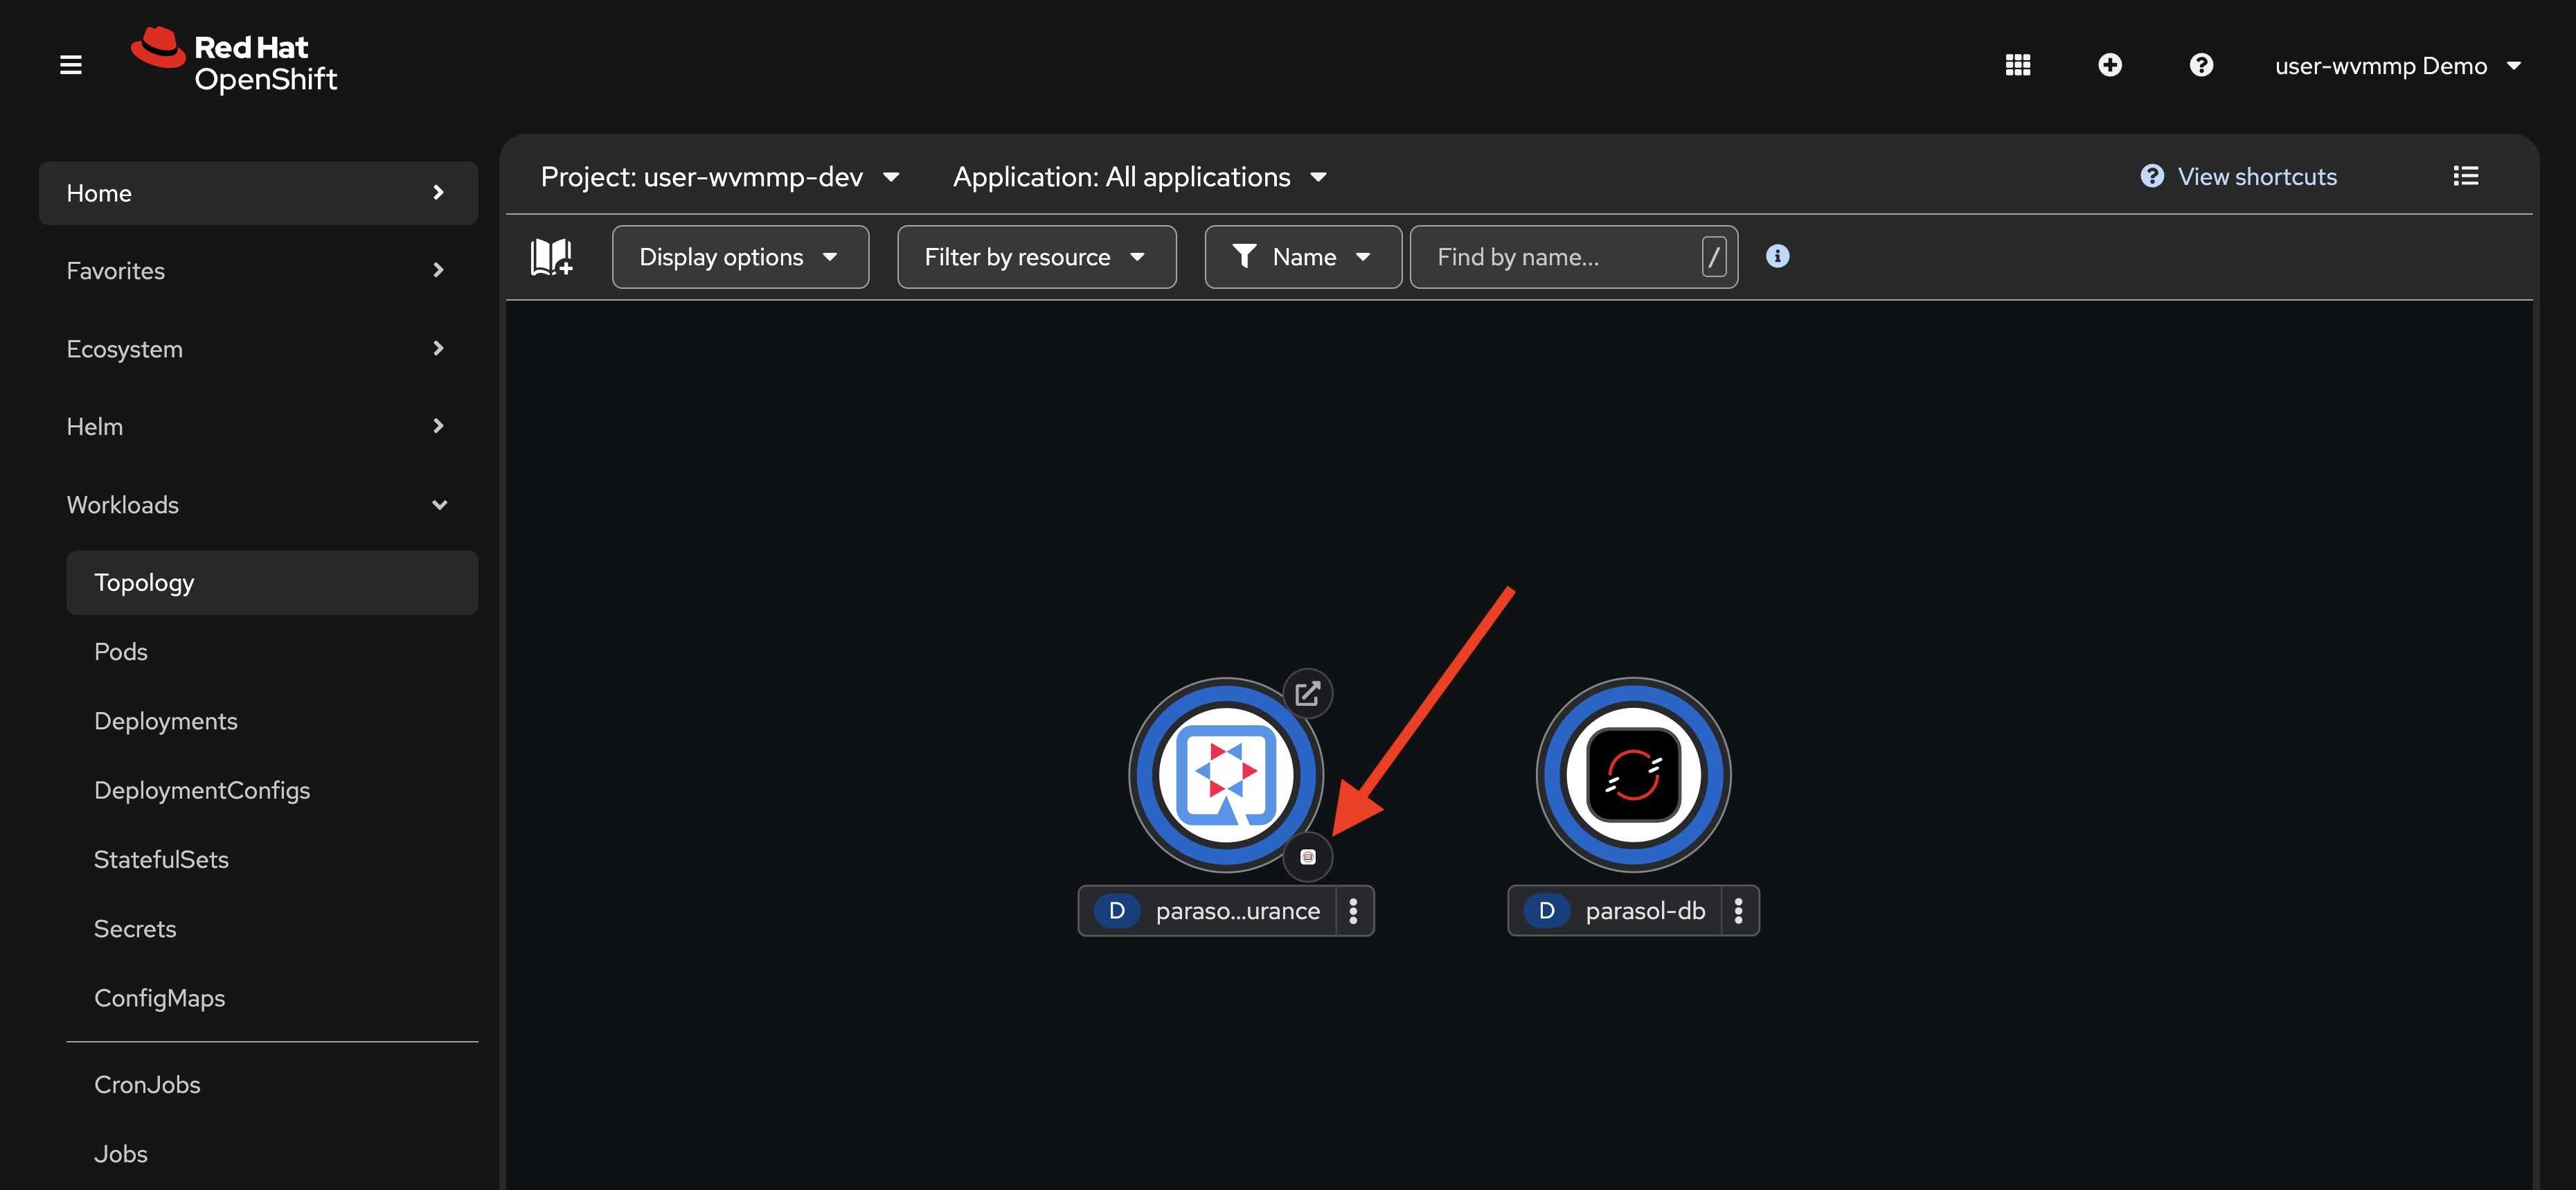 Figure 1. Launching Dev Spaces from the Topology view
This launches OpenShift Dev Spaces, your cloud development environment. The workspace settings are defined by the platform administrator, and a
devfile.yamlin the repository. The devfile specifies the container image, tools, extensions, and runtime configuration. -
You’ll be prompted to log in. Click the Log In using OpenShift button. Enter your credentials, if prompted:
-
Username:
{user_name} -
Password:
{user_password}
-
-
Click the Allow selected permissions button.
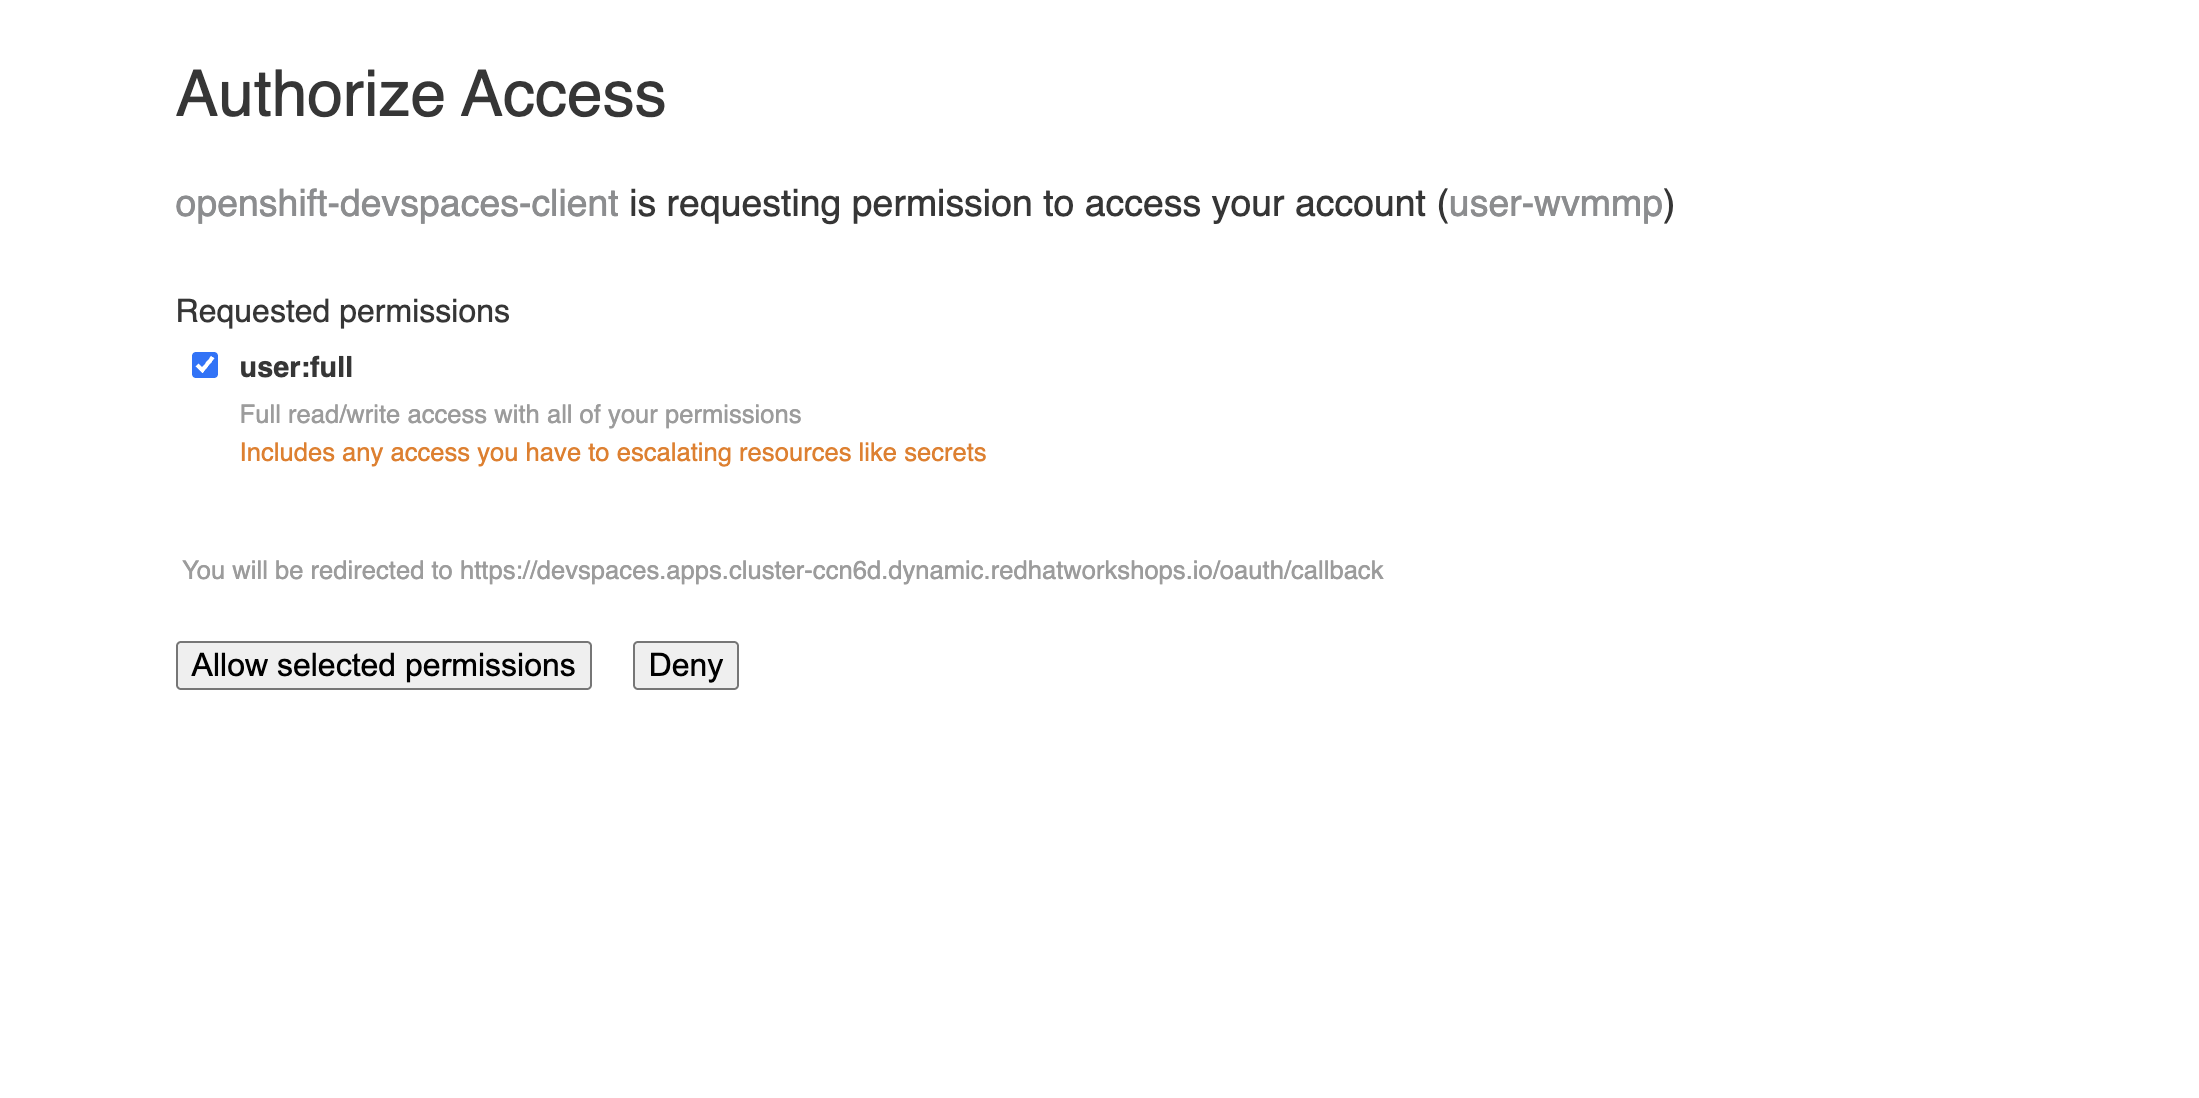 Figure 2. Granting OAuth permissions for Dev Spaces
 -
When asked "Do you trust the authors of this repository?", click Continue. You will be redirected to GitLab’s OAuth page.
-
Finally, when asked "devspaces is requesting access to your account on GitLab Community Edition", click Authorize devspaces.
You might be thinking "this is a lot of log in screens and permissions grants". This is a one time operation, and the reason for this is twofold:
-
OpenShift Dev Spaces uses OpenShift OAuth to start a workspace as a Pod on your behalf in OpenShift.
-
To access and perform read/write to your repositories in GitLab, Dev Spaces uses OAuth.
-
-
Wait for the workspace to start. This may take a minute or two on the first launch as the container image is pulled and the environment is configured.
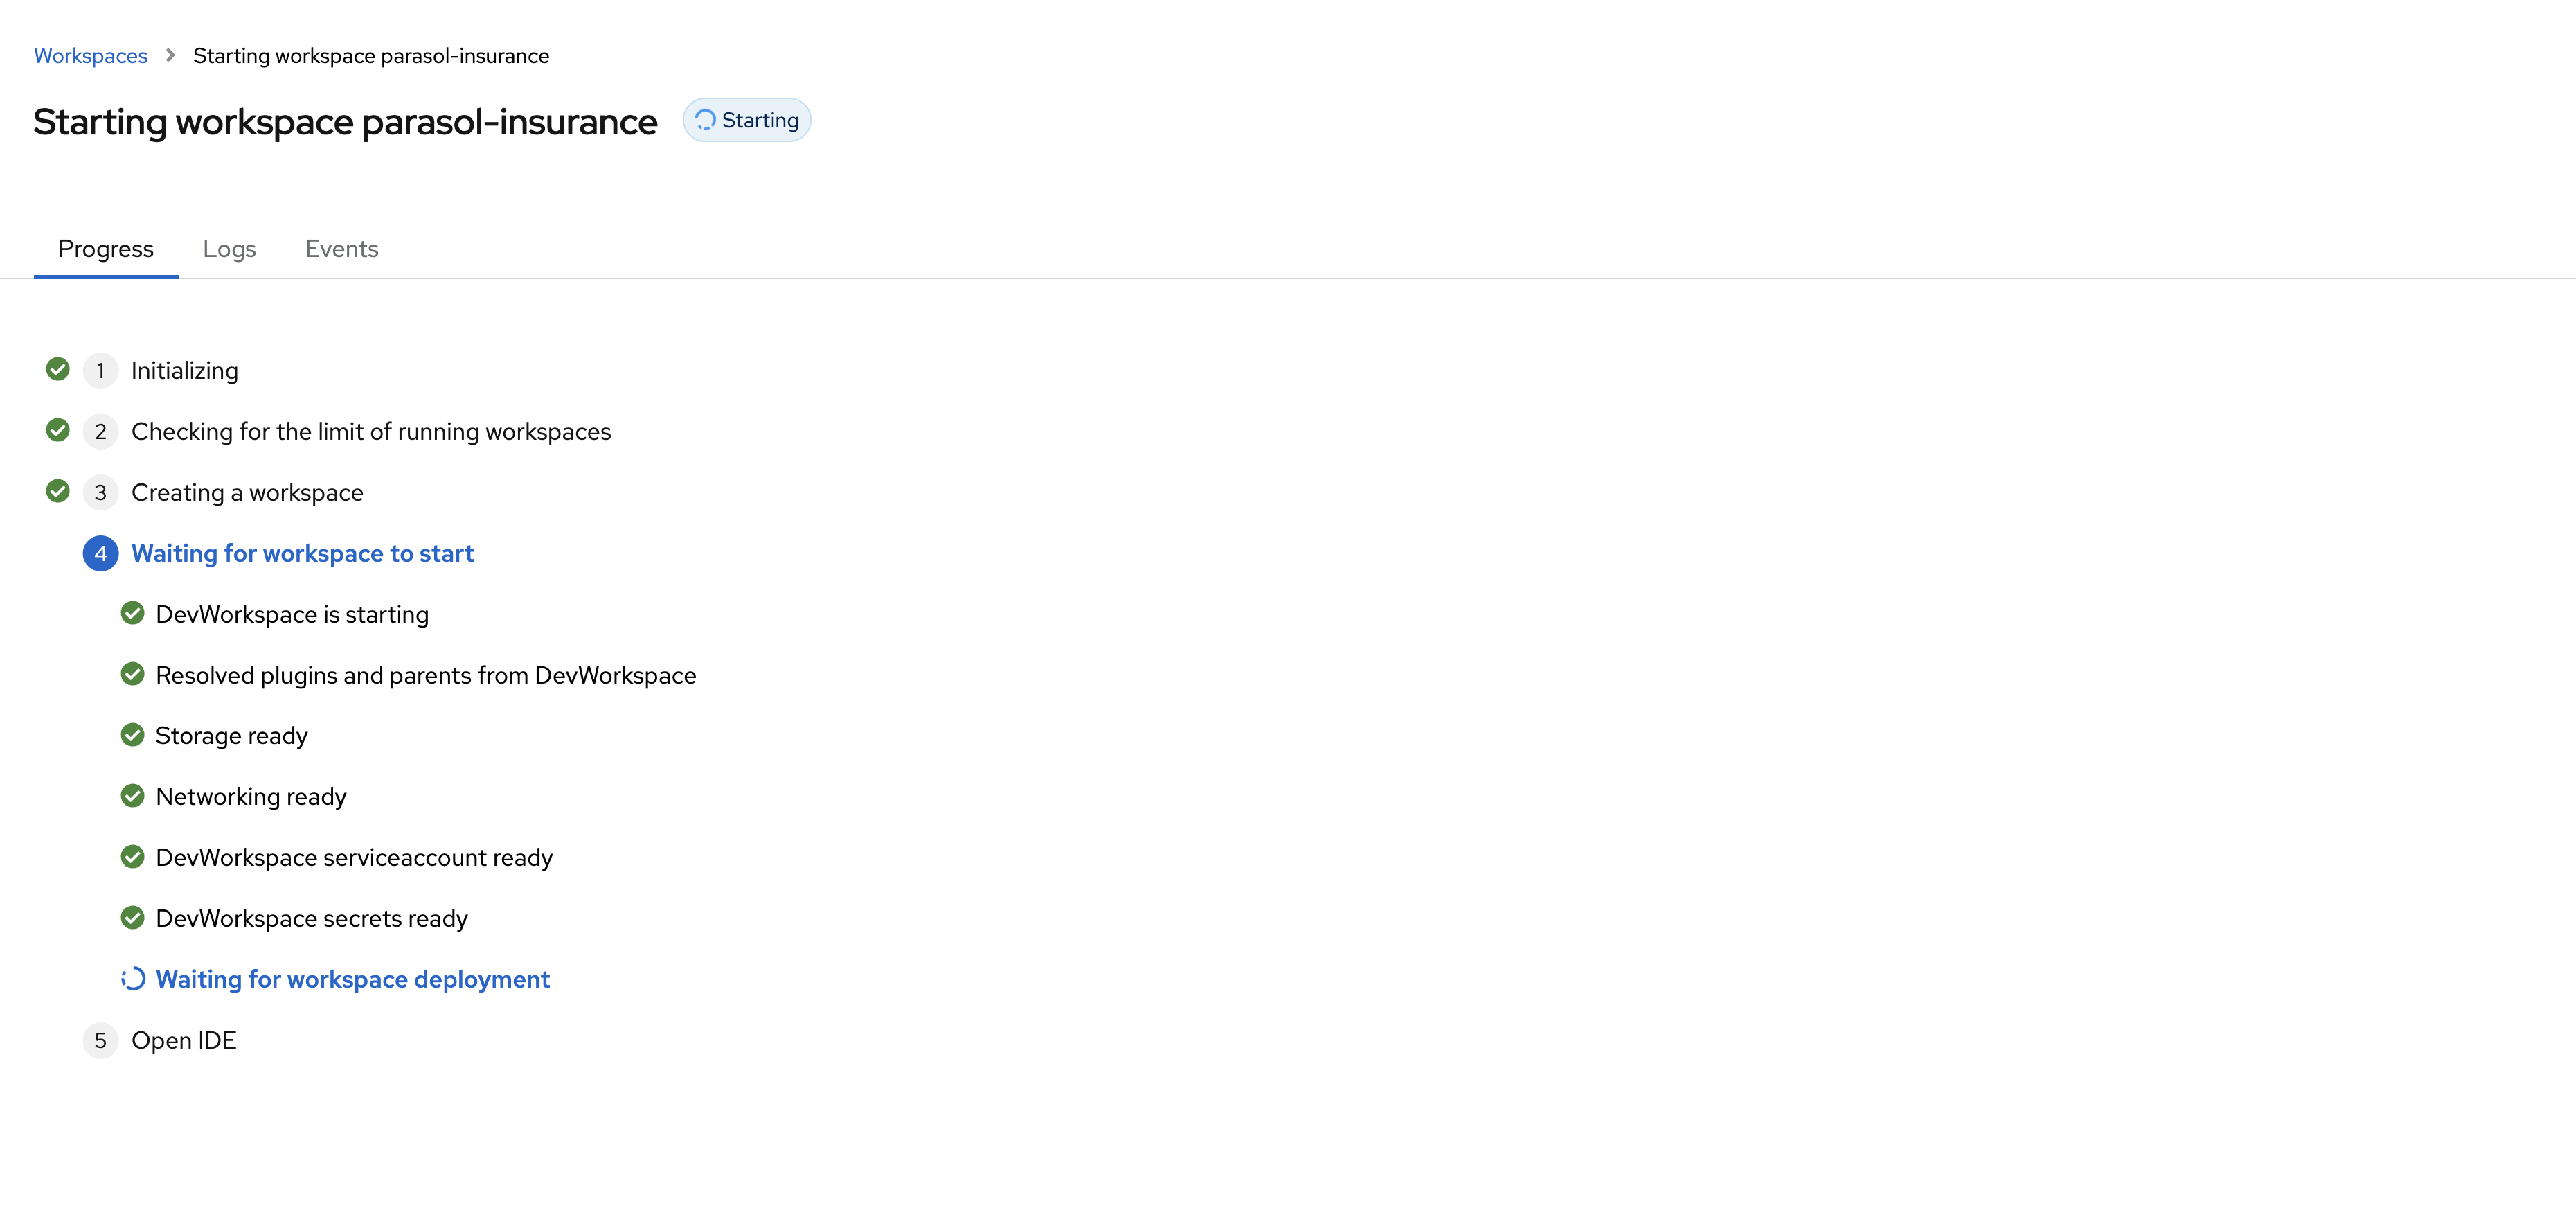 Figure 3. Dev Spaces loading the workspace
After the IDE has started, click Trust Publishers & Install to ensure the default extensions are installed.
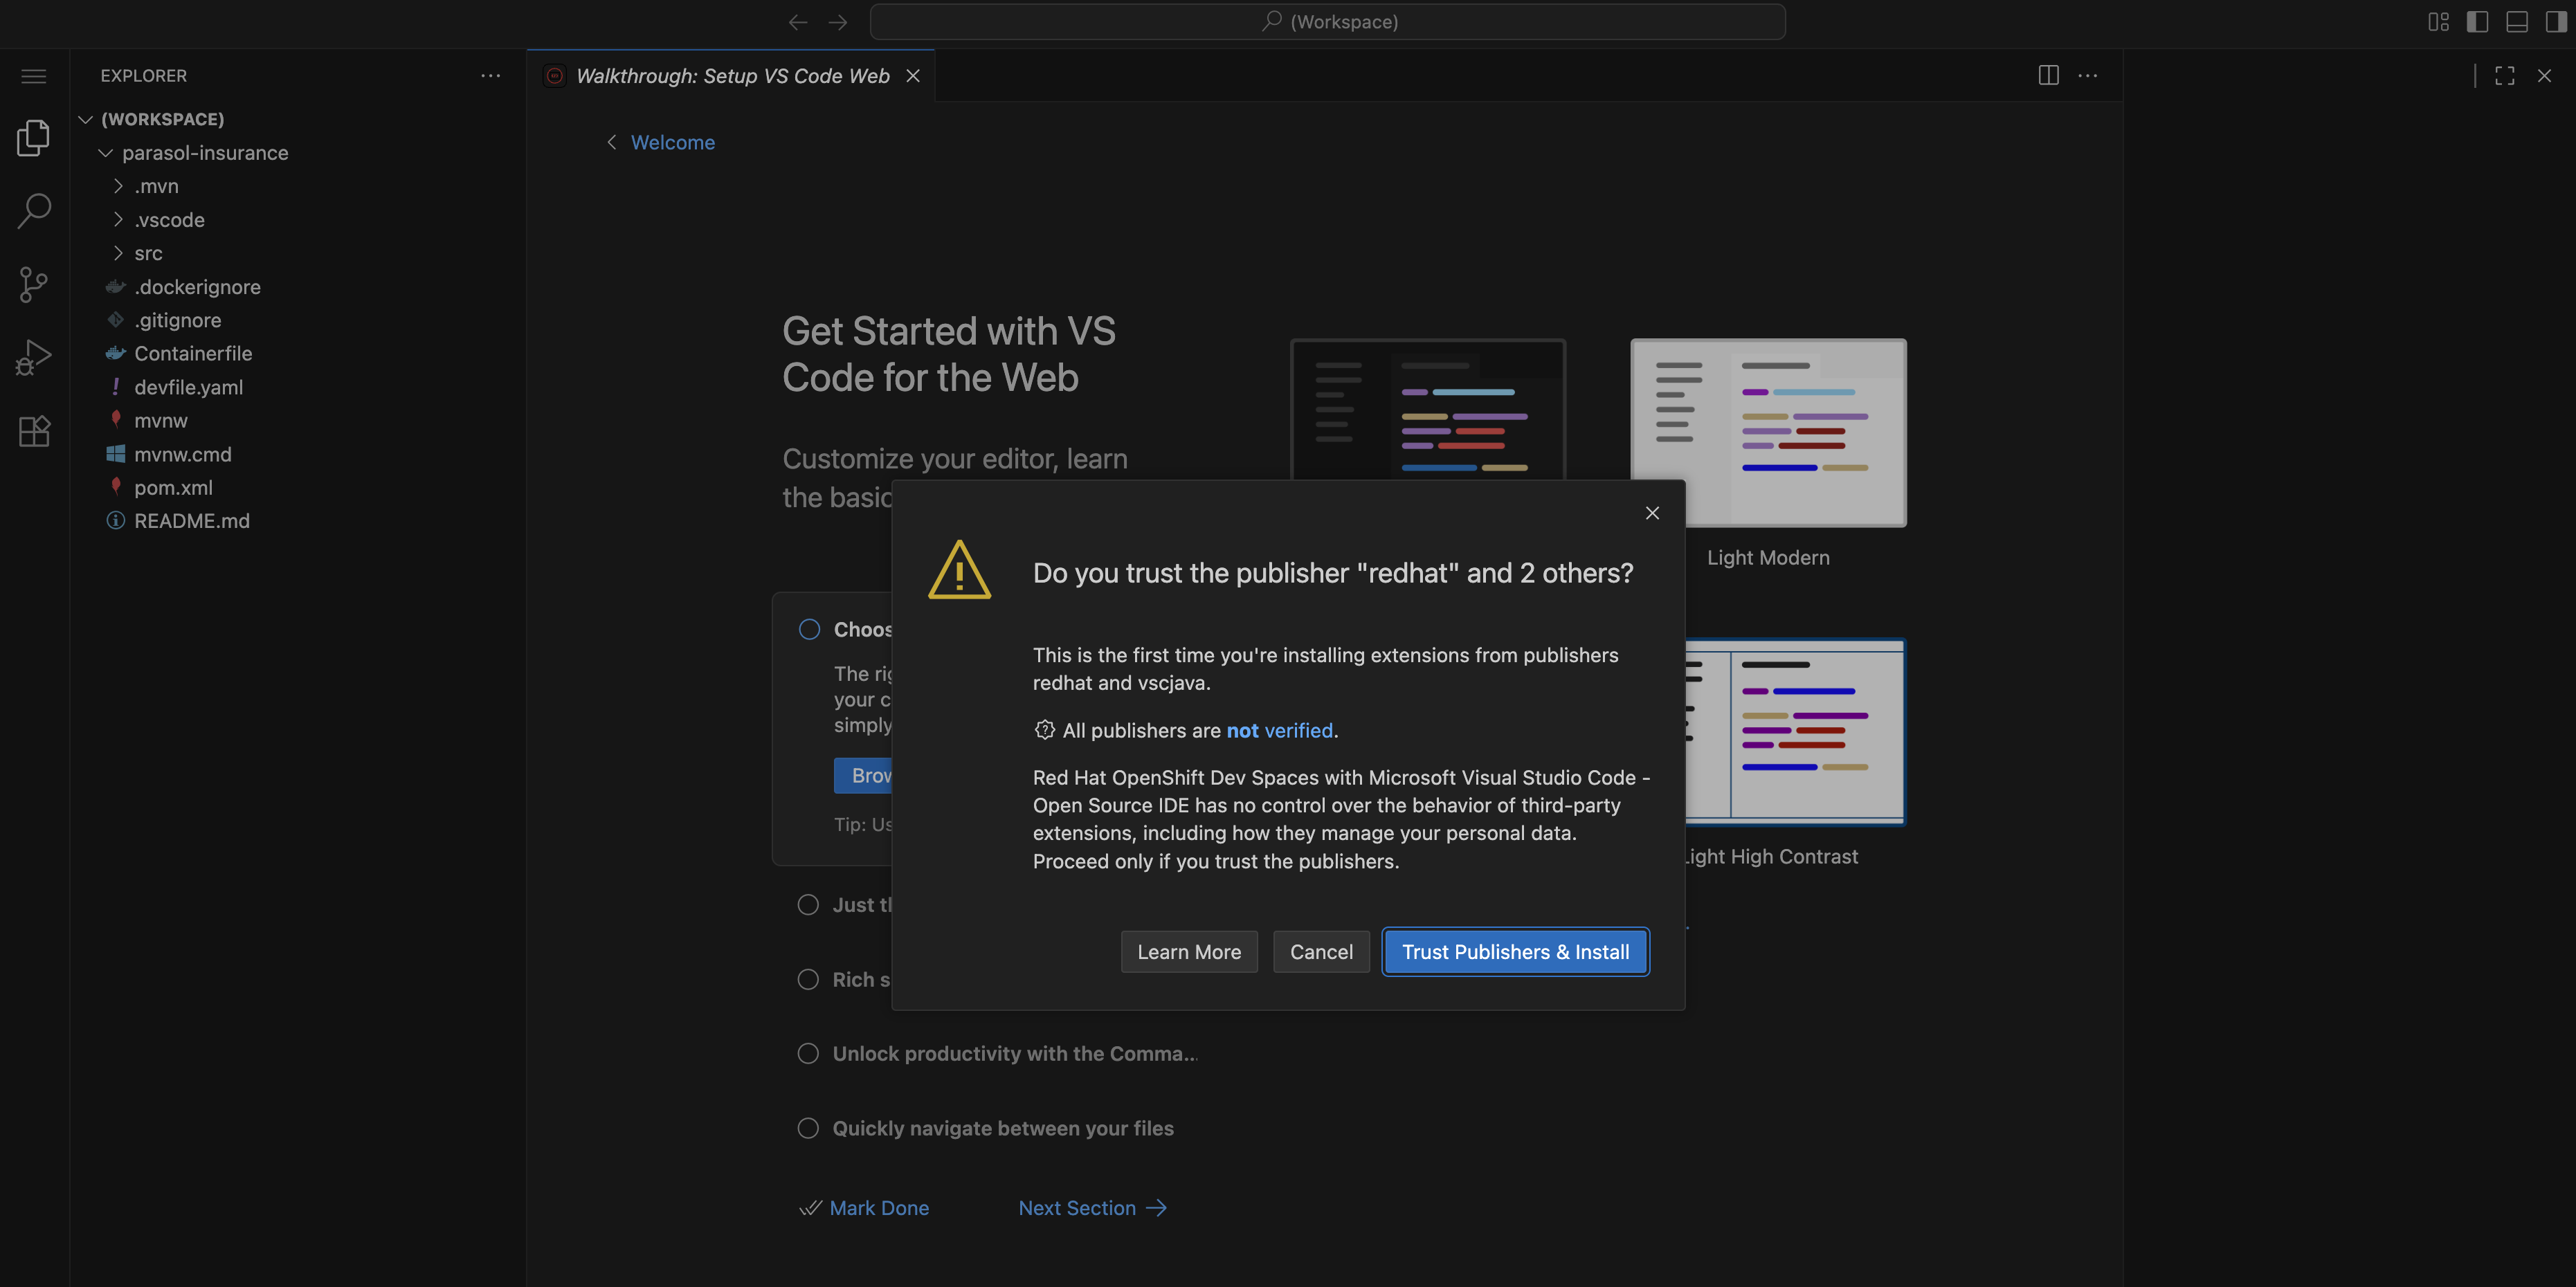
Dismiss pop-ups in the bottom-right using the X icon in their top-right corner. They’re not relevant for this lab.
|
Explore the IDE
Once the workspace loads, take a moment to look around:
-
Explorer (left sidebar): Shows the
parasol-insuranceproject structure. Opensrc/main/resources/application.propertiesto view it in the editor. -
Extensions: In the left sidebar, click the Extensions icon to see pre-installed extensions:
-
RHDA (Red Hat Dependency Analytics) — scans your dependencies for known vulnerabilities
-
Continue — AI coding assistant that can help you write and refactor code
It can take up to a minute for extensions to finish installing after accepting the prompt to trust and install them. If Continue is not shown, wait a moment. 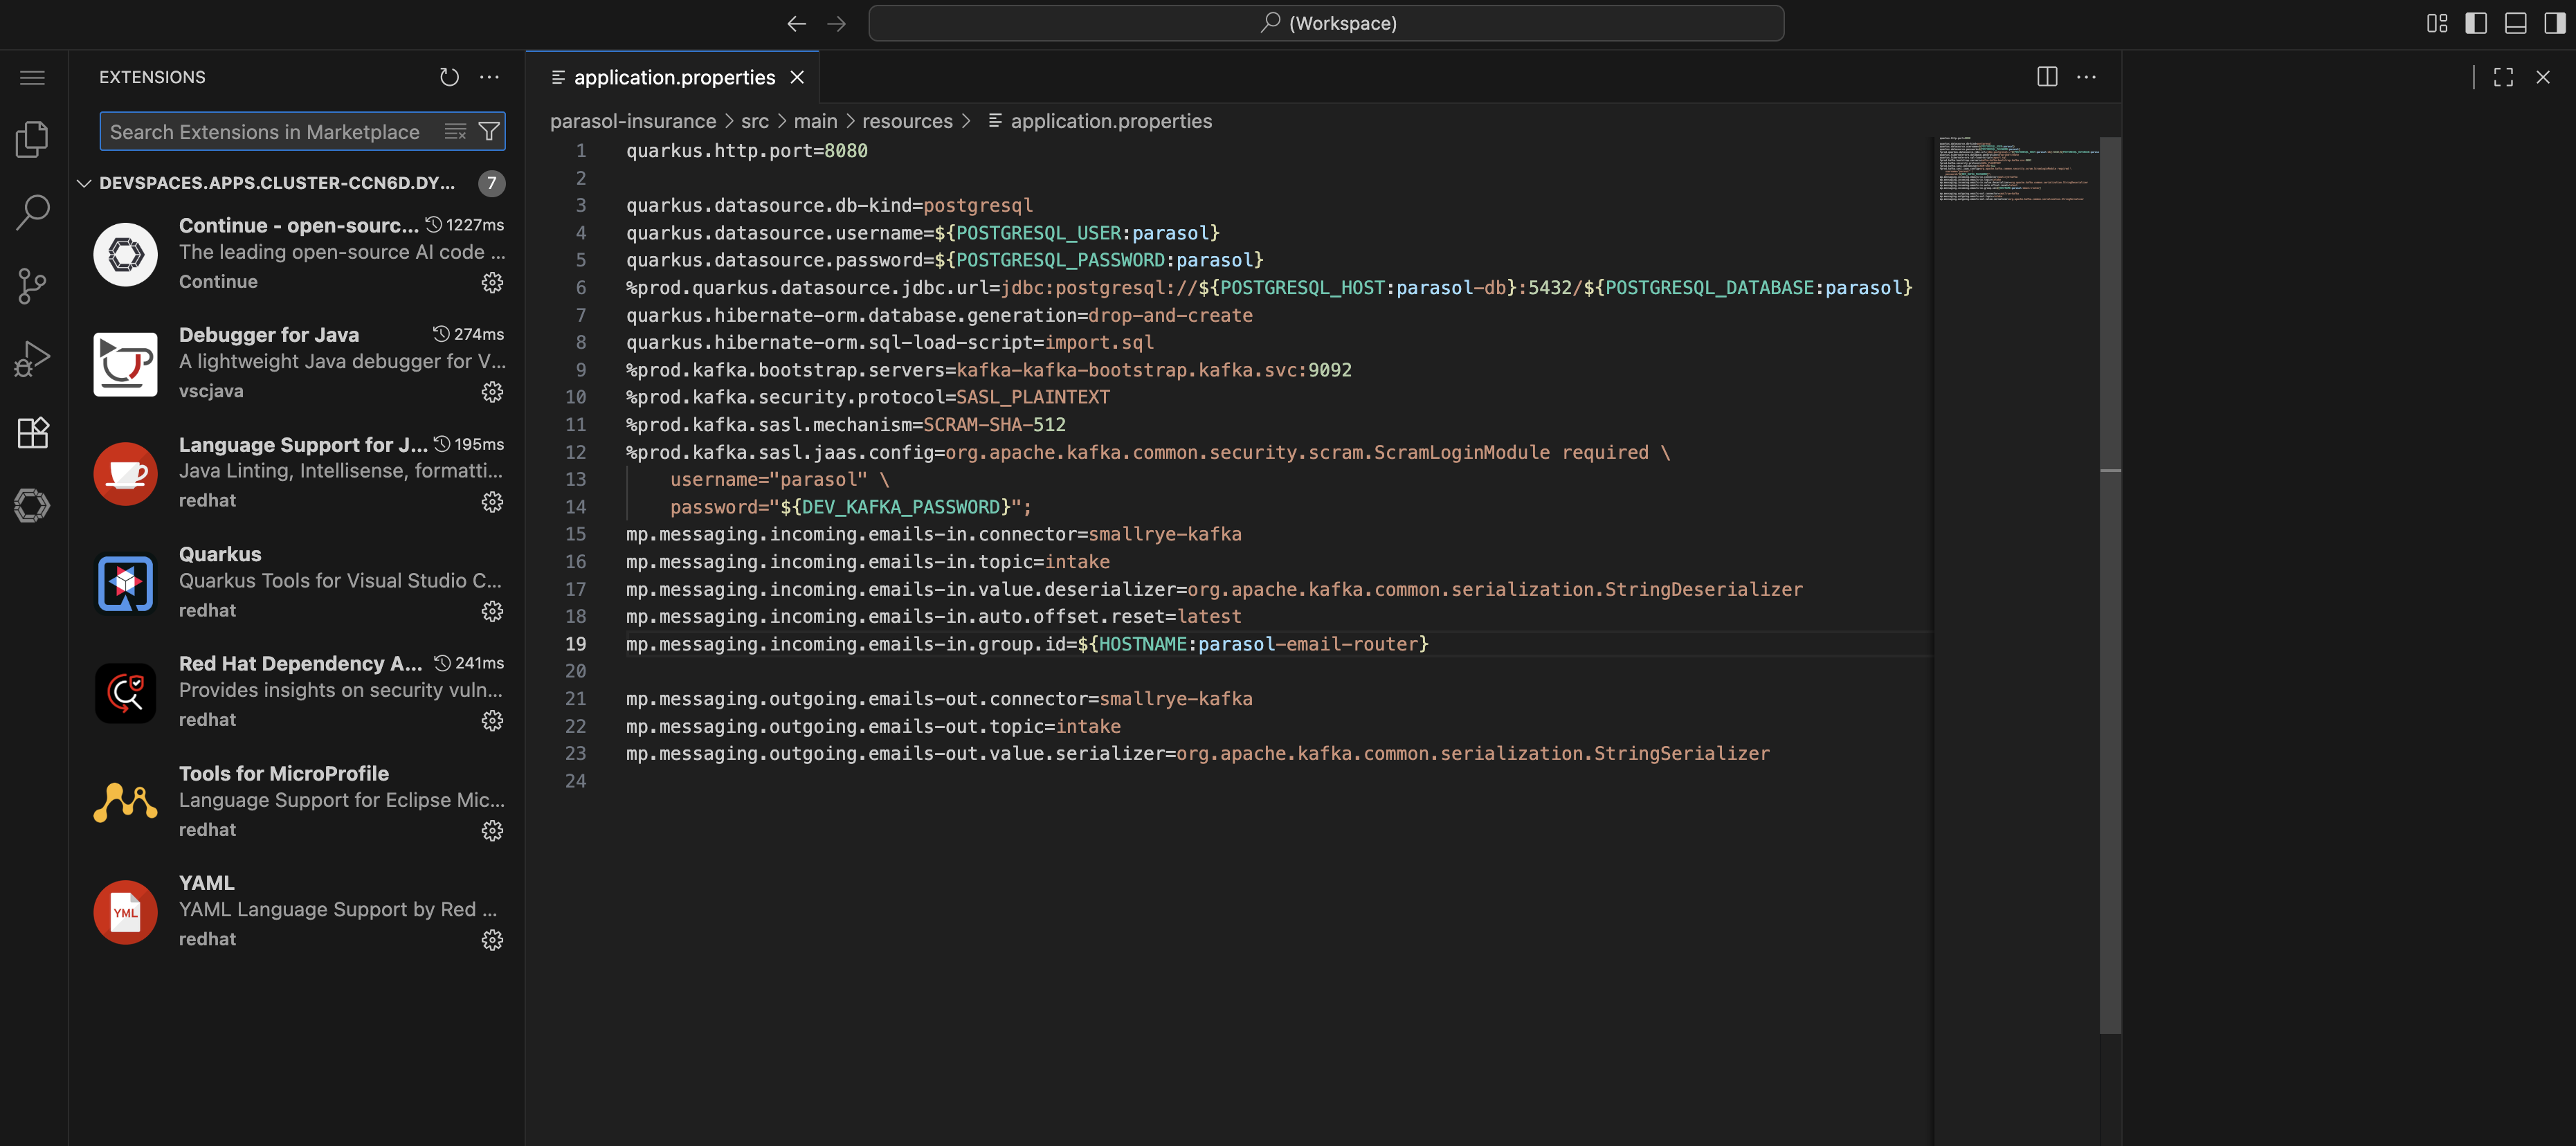 Figure 5. Pre-installed extensions in Dev Spaces
The extensions listed in your environment are curated and enabled by the platform administrator. The full set of VS Code extensions available in the public marketplace can be made available, but most organizations have processes in place to enable only a subset of trusted extensions.
-
-
Source Control: Also in the left sidebar, use this to see commit history, and changes staged for commit.
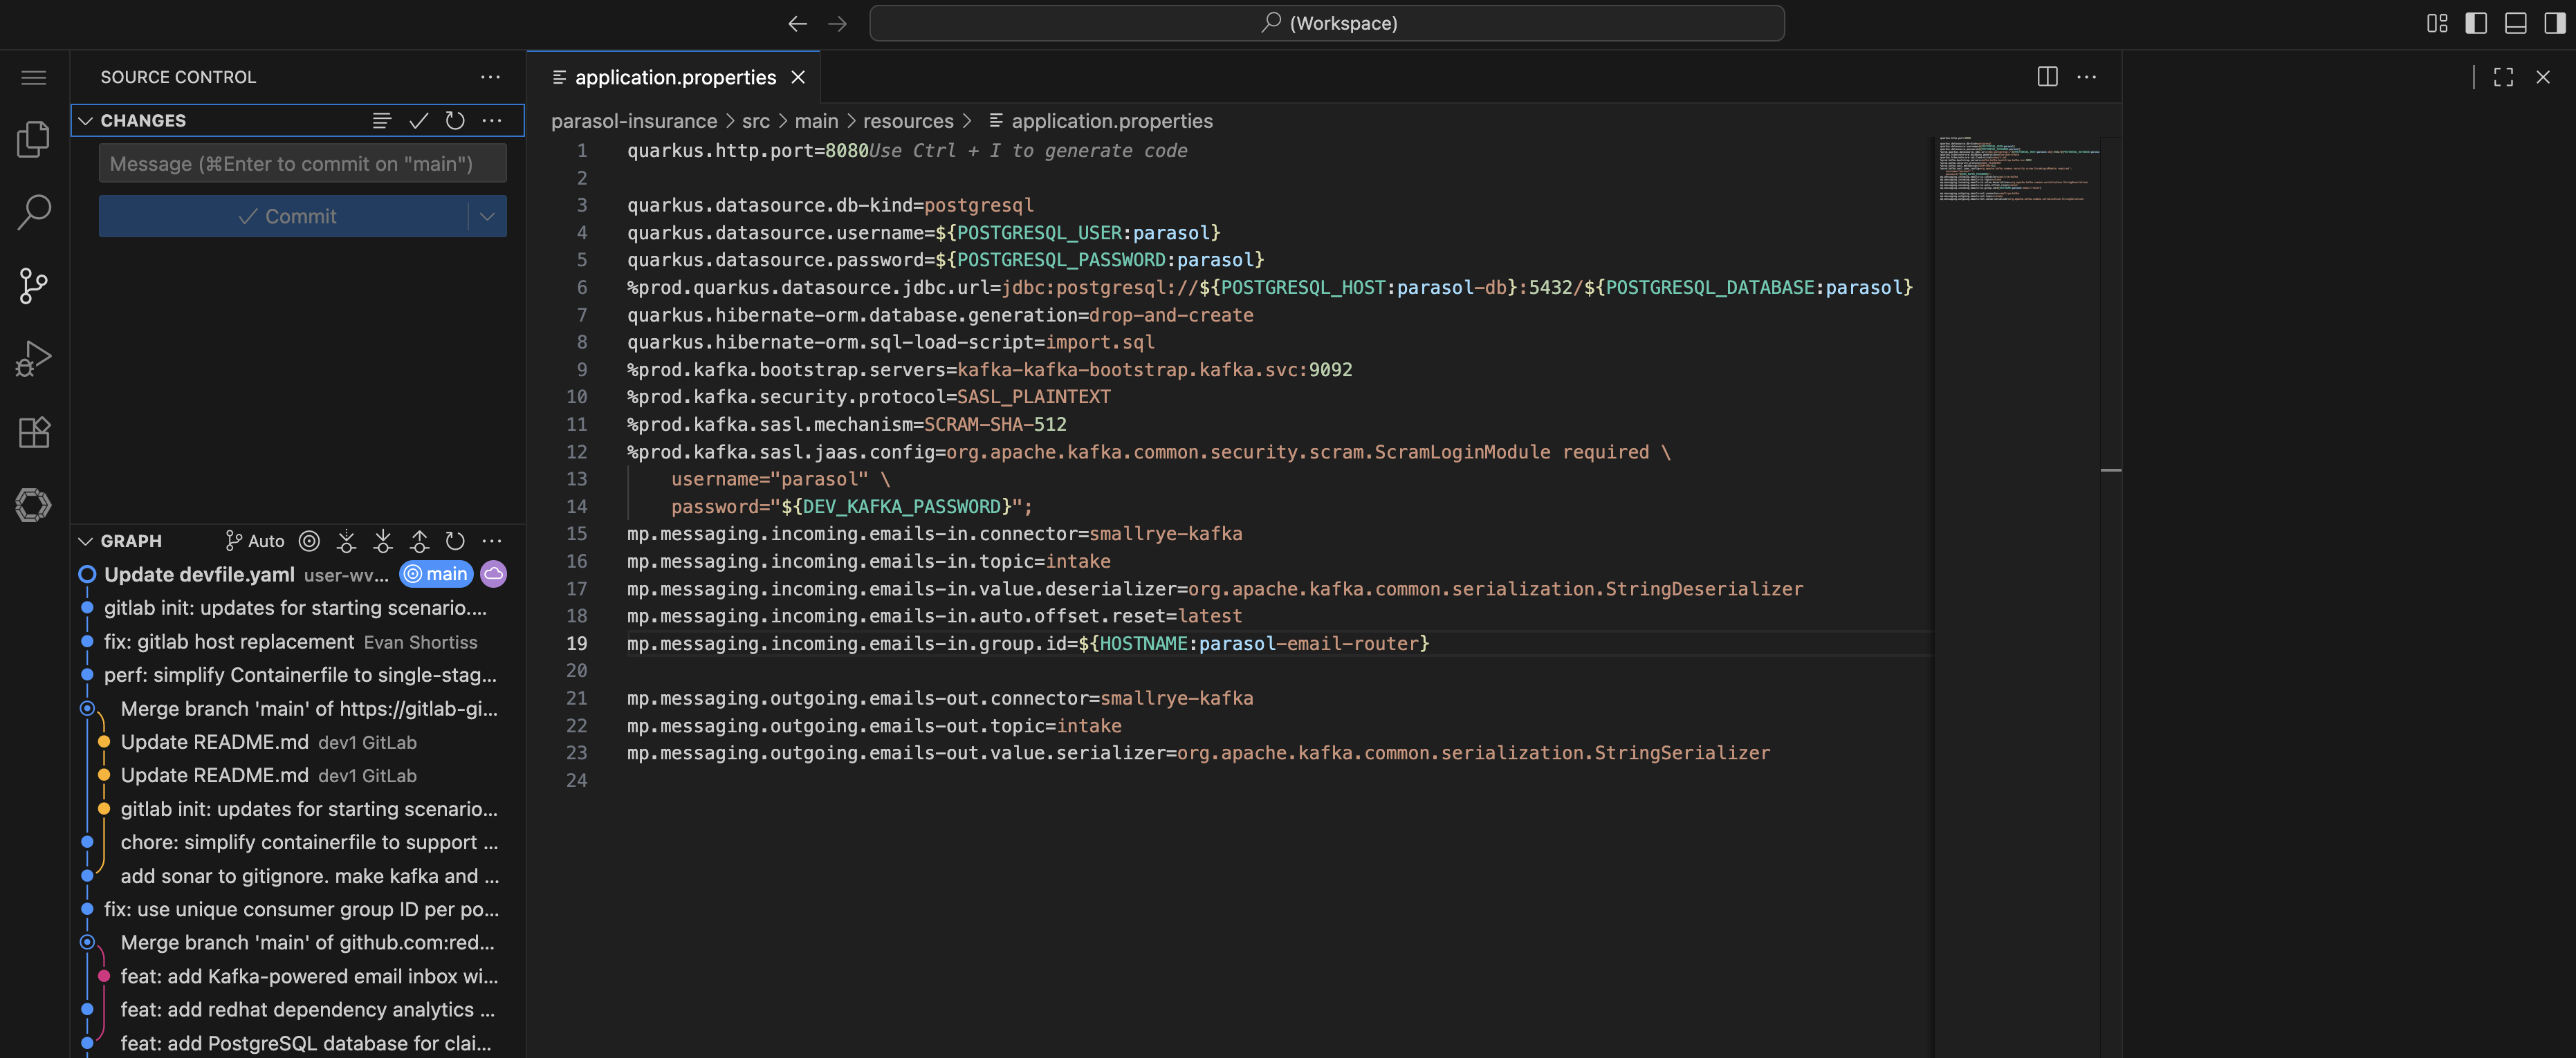 Figure 6. Source Control panel in Dev Spaces
As you can see, this is a fully functional and extensible development environment based on VS Code.
Review the devfile
We mentioned devfiles earlier. Devfile is a standard format for defining containerized development environments. Let’s explore your environment’s devfile.
-
In Dev Spaces, select the Explorer and click on the devfile.yaml file.
-
Take note of the
parent.uri. This demonstrates that each repository can reference a parent devfile to inherit default configurations. -
In the GitLab tab return to the Projects page, then click Explore projects
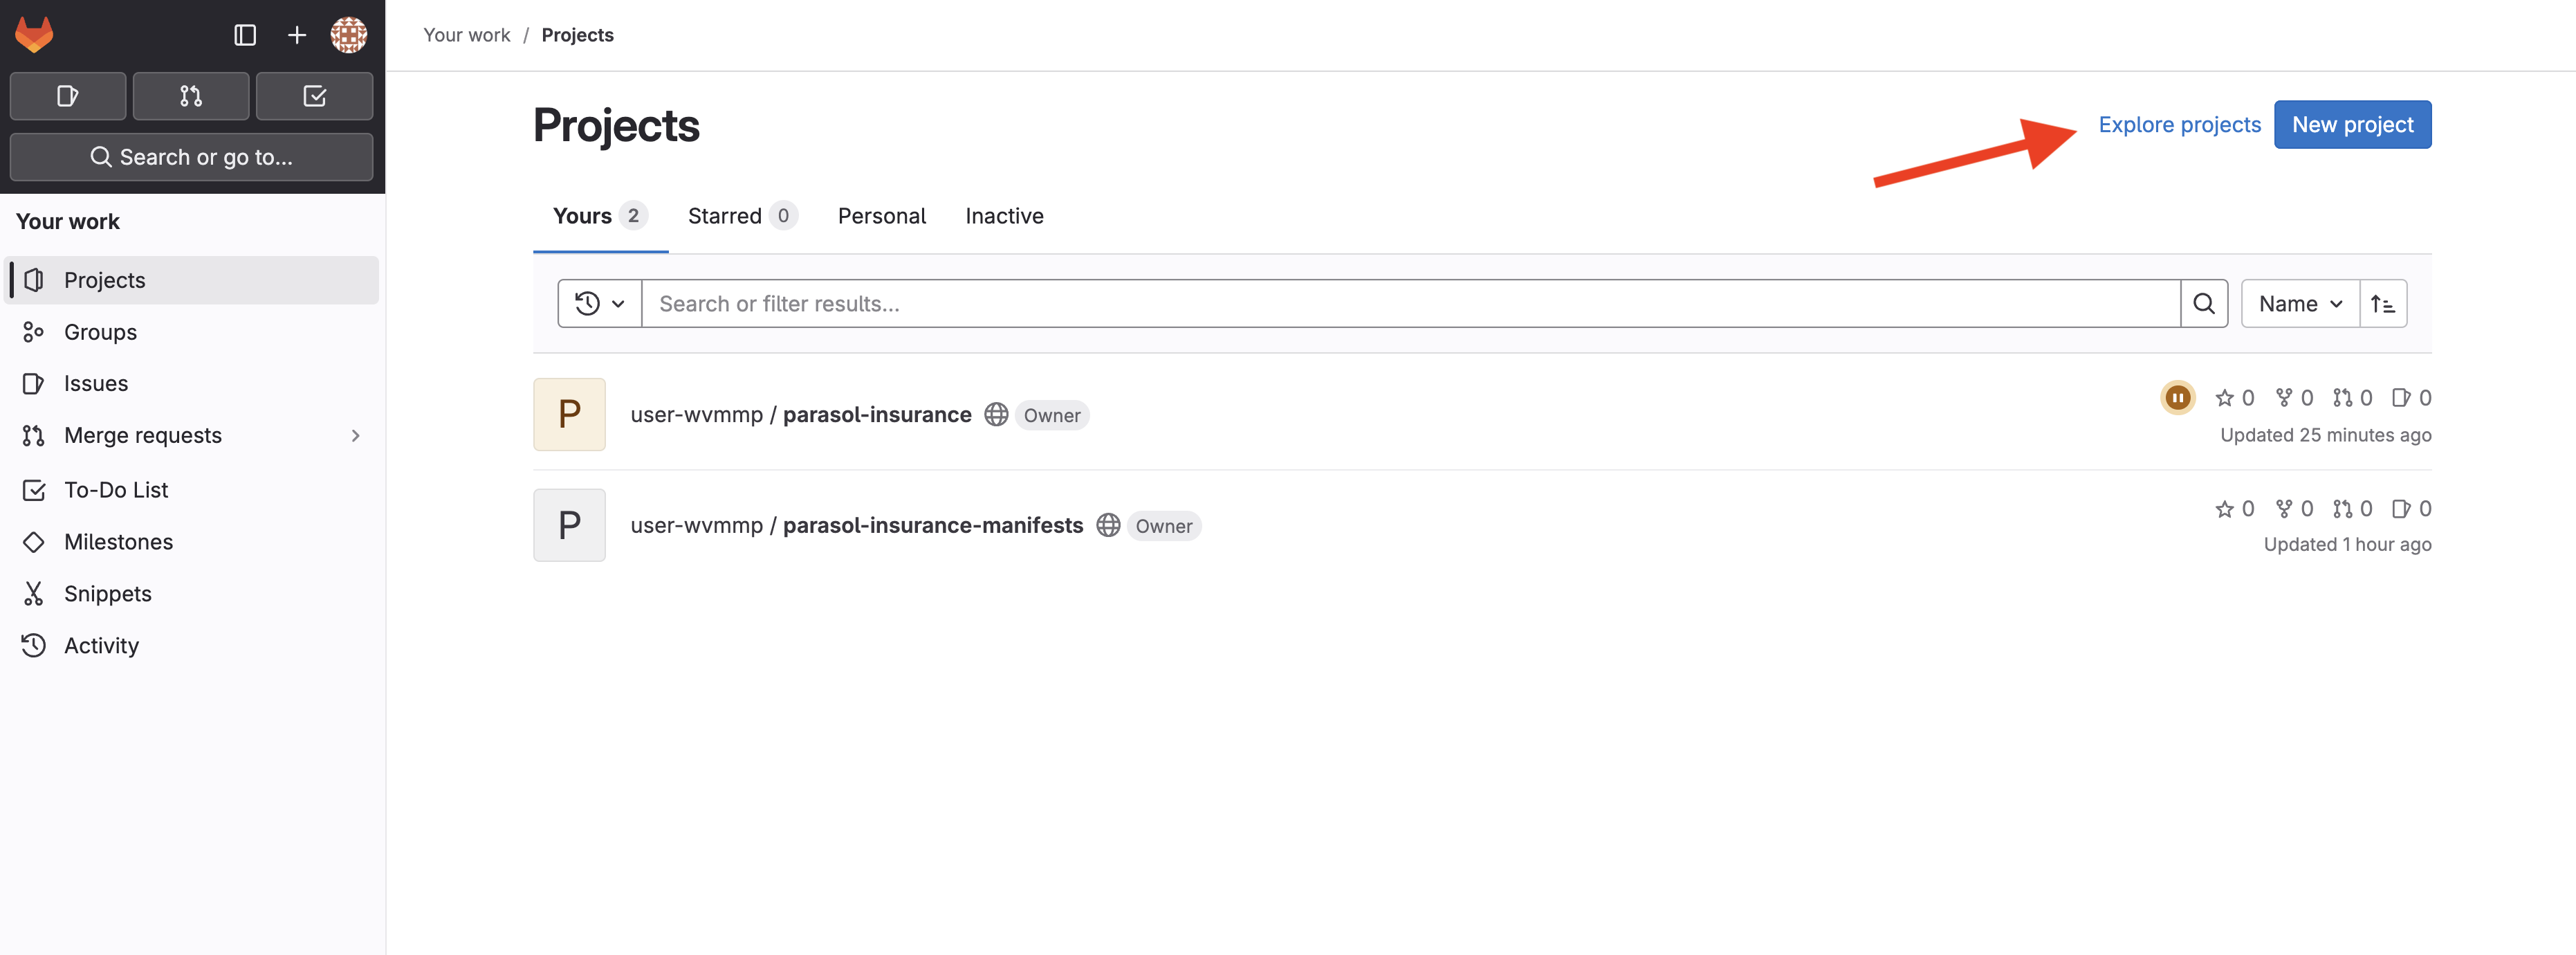 Figure 7. Exploring projects in GitLab
 -
Select the parasol/devfiles repository and view the parent devfile.
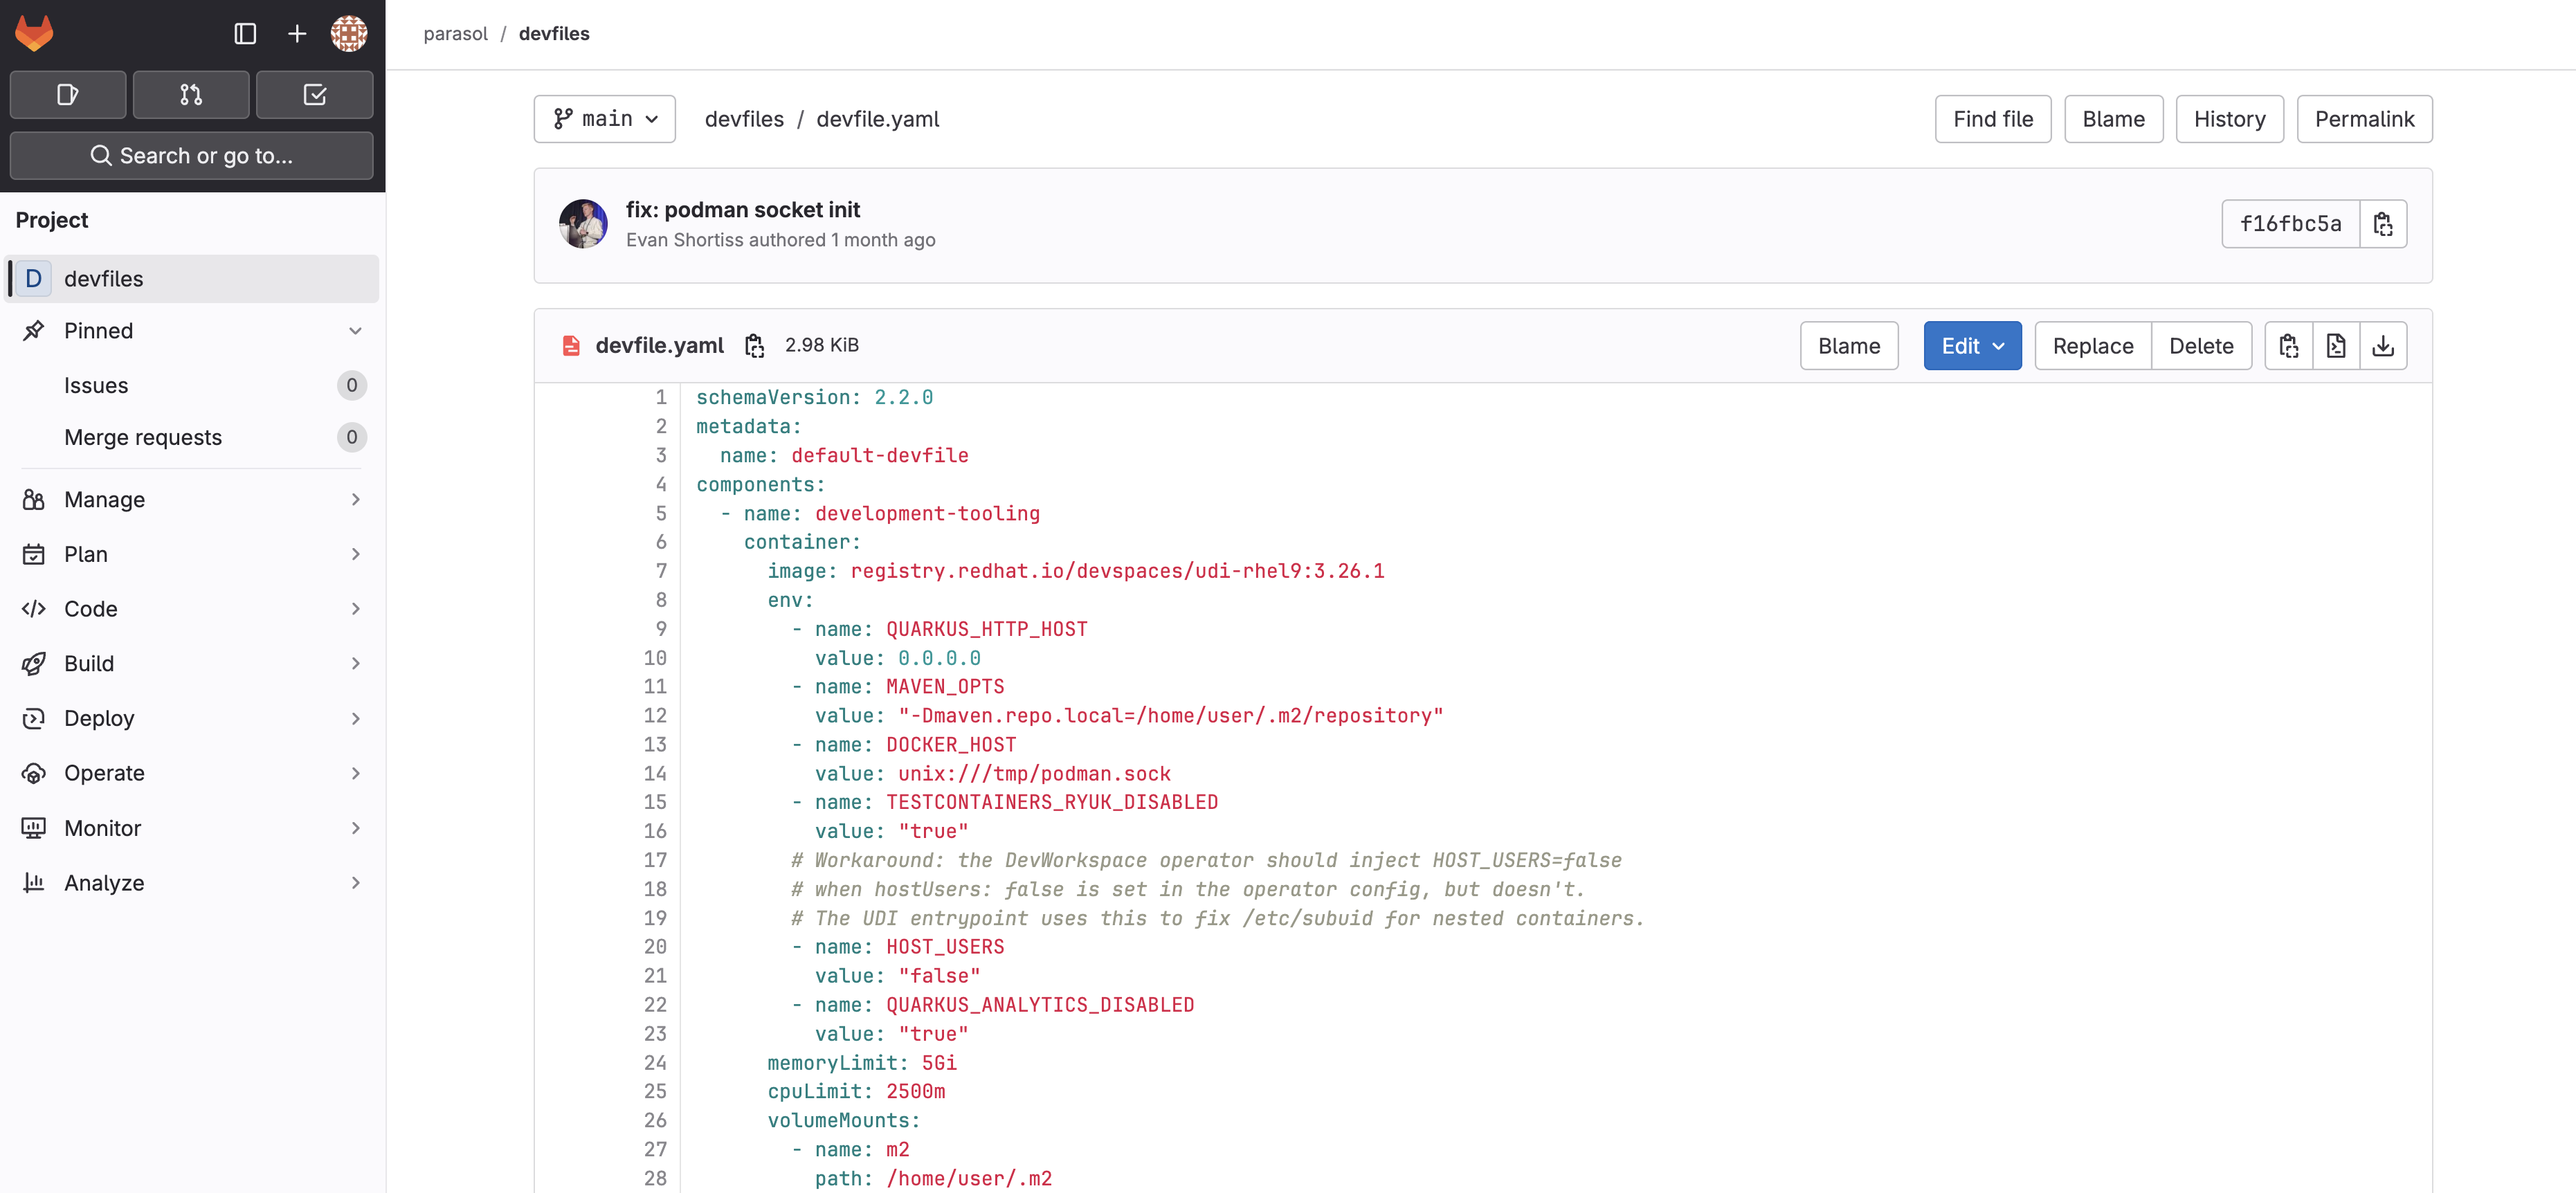 Figure 8. Parent devfile in the parasol/devfiles repository
Parasol has standardized on Quarkus as their primary application runtime. This devfile configures each workspace to enable nested containerization, Maven cache, and initializes an open-source coding assistant.
The nested containerization feature enables Quarkus Dev Services. Dev Services uses container runtimes such as Podman or Docker in a development environment to provide services such as PostgreSQL and Kafka during development.
Exercise 2: Use the Continue AI coding assistant and start dev mode
The platform team at Parasol has pre-configured their OpenShift Dev Spaces environment with credentials to access a self-hosted Large Language Model (LLM). Additionally, they’ve configured the Continue extension to use that LLM to provide a coding assistant to their development teams that "just works" in their workspaces.
Try the Continue AI coding assistant
-
Select the Continue extension in the left sidebar.
-
Click the LiteMaaS (Opus 4.6) model dropdown. This is the only model available for now.
-
Enter the following prompt. If you type the prompt yourself, you’ll see that the
@character triggers a dialog where you can select files and more:Explain the @application.properties file. I don't know much about Quarkus.Continue sometimes requests permission to read/write files. Click Accept when prompted. OpenShift Dev Spaces might request access to your clipboard when performing copy/paste. Click Allow if your browser requests the permission. -
The model will respond with a detailed description of the
application.properties.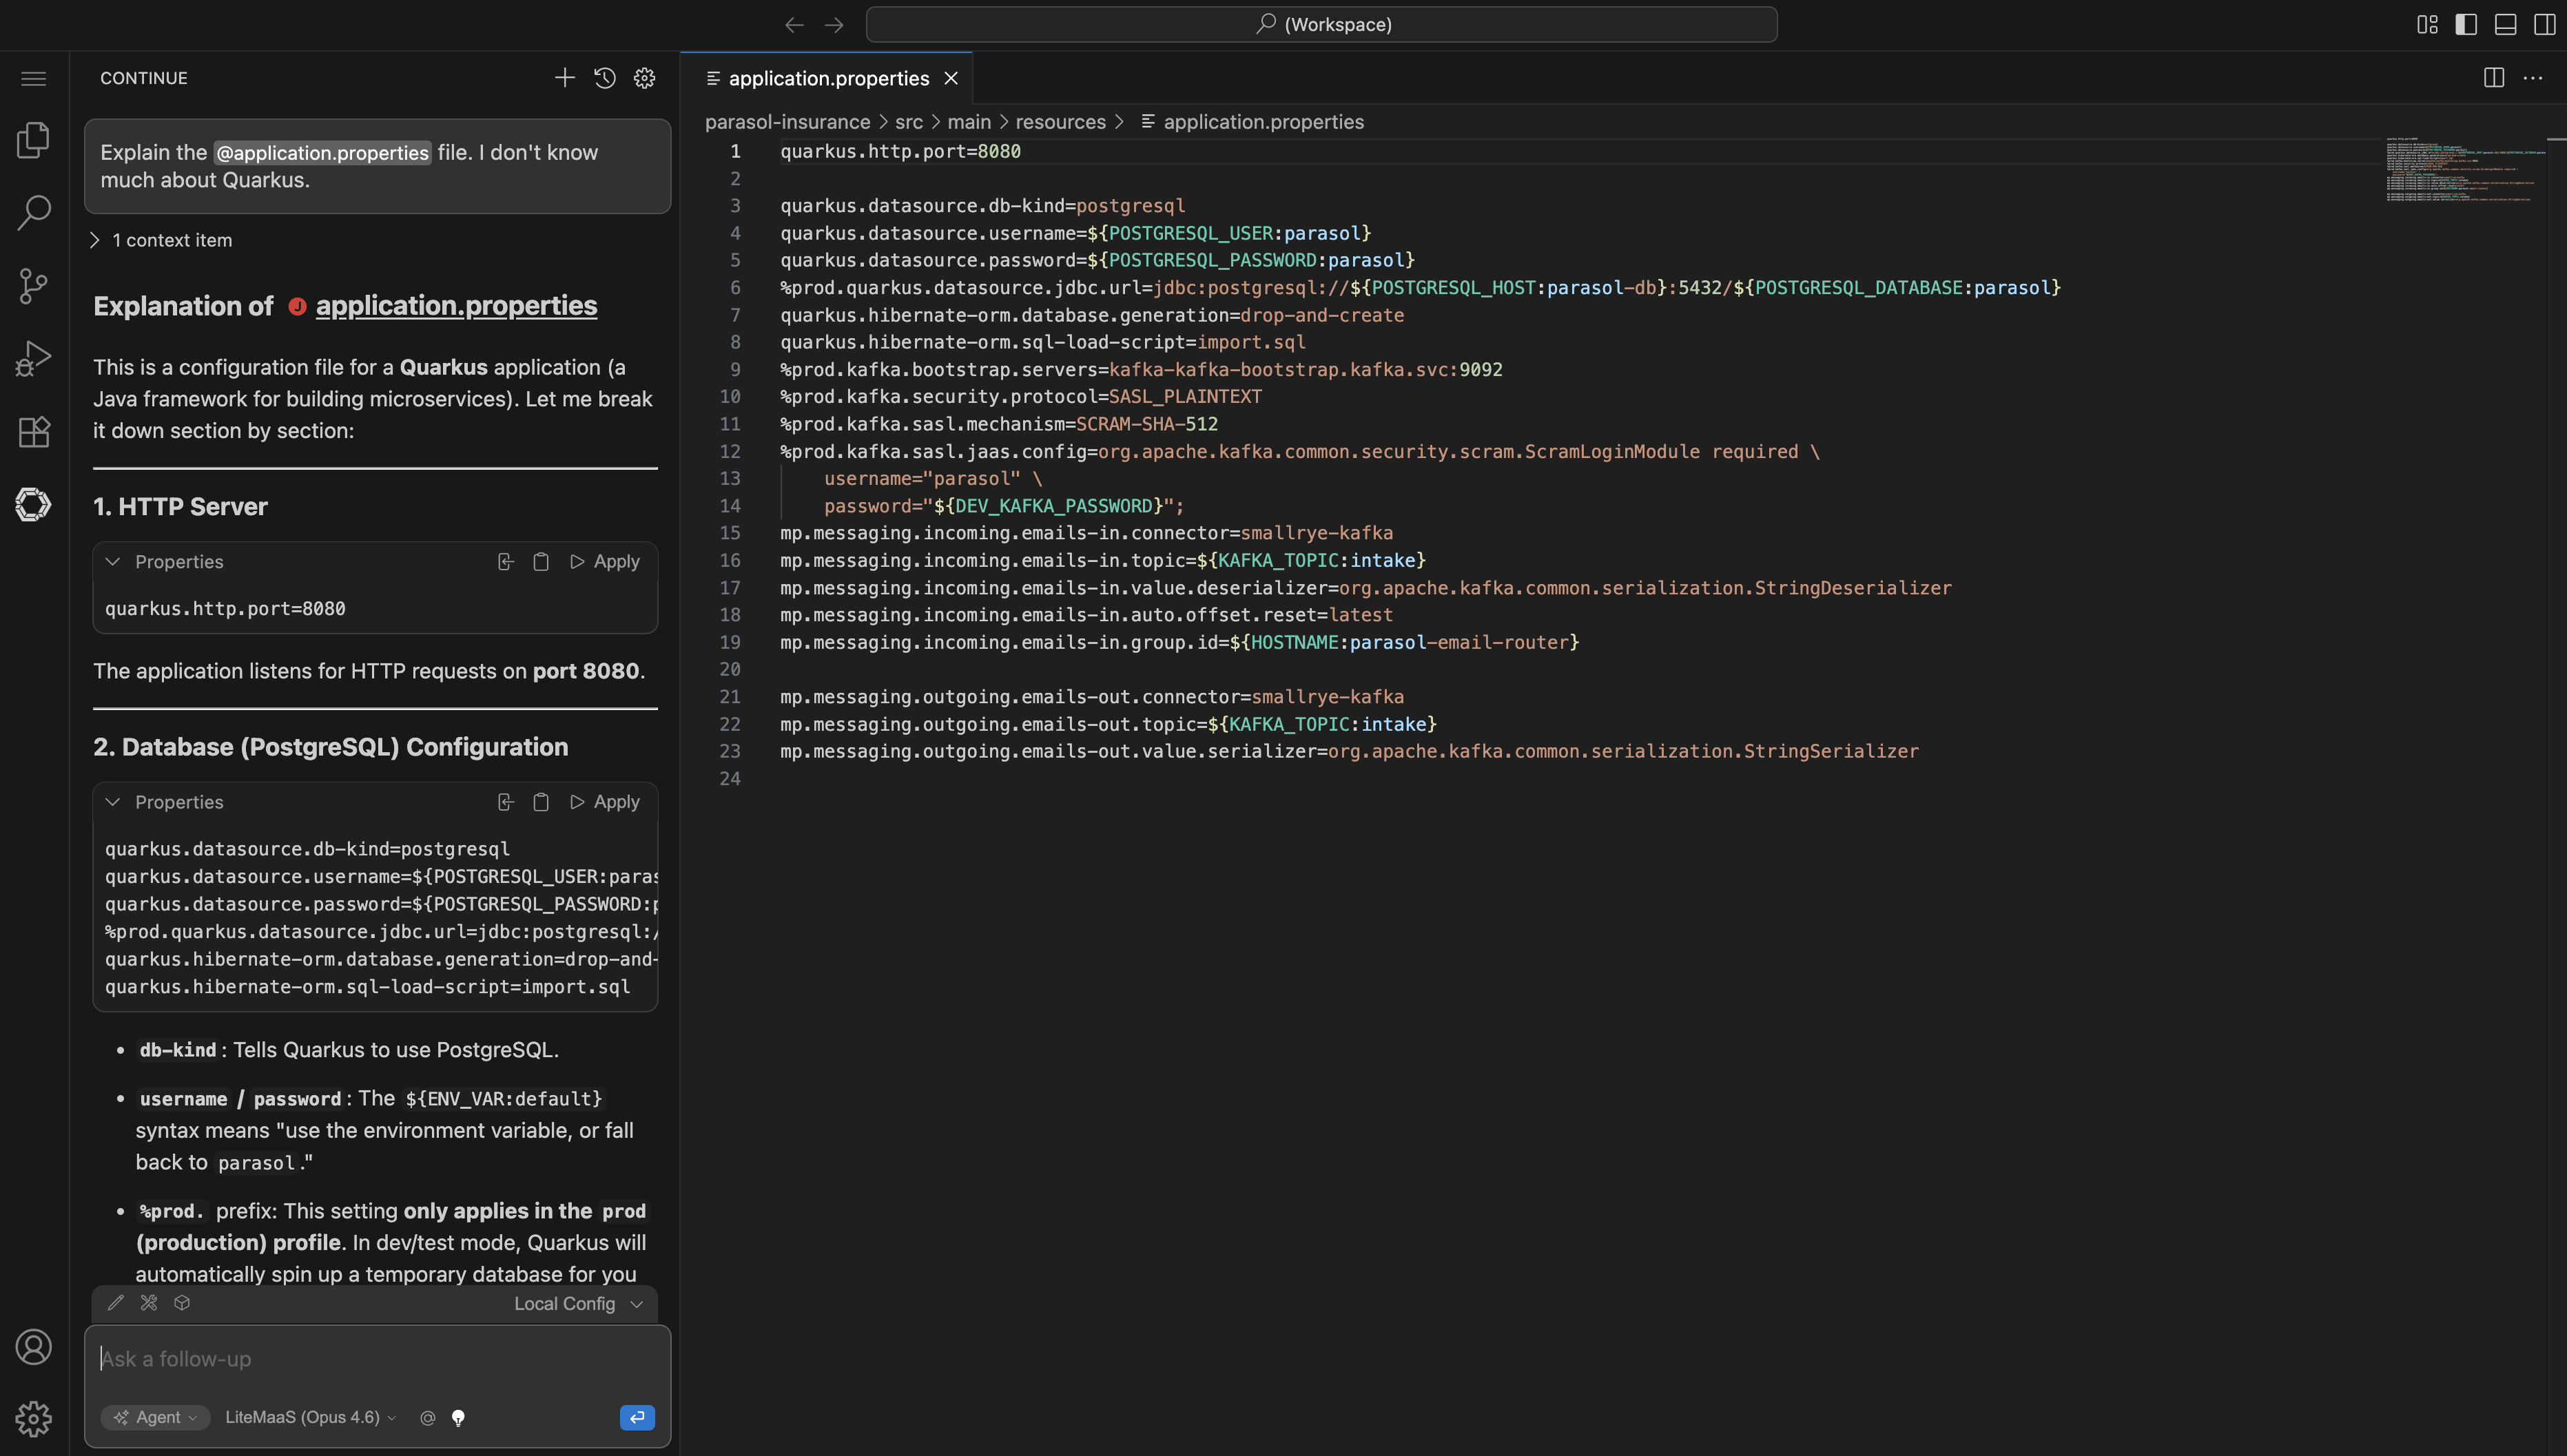 Figure 9. Continue extension explaining application.properties
Next, let’s see the model edit files:
-
Enter the following prompt:
Add some helpful comments to the @application.properties file. -
Wait while the model makes changes and then click Accept to save the changes.
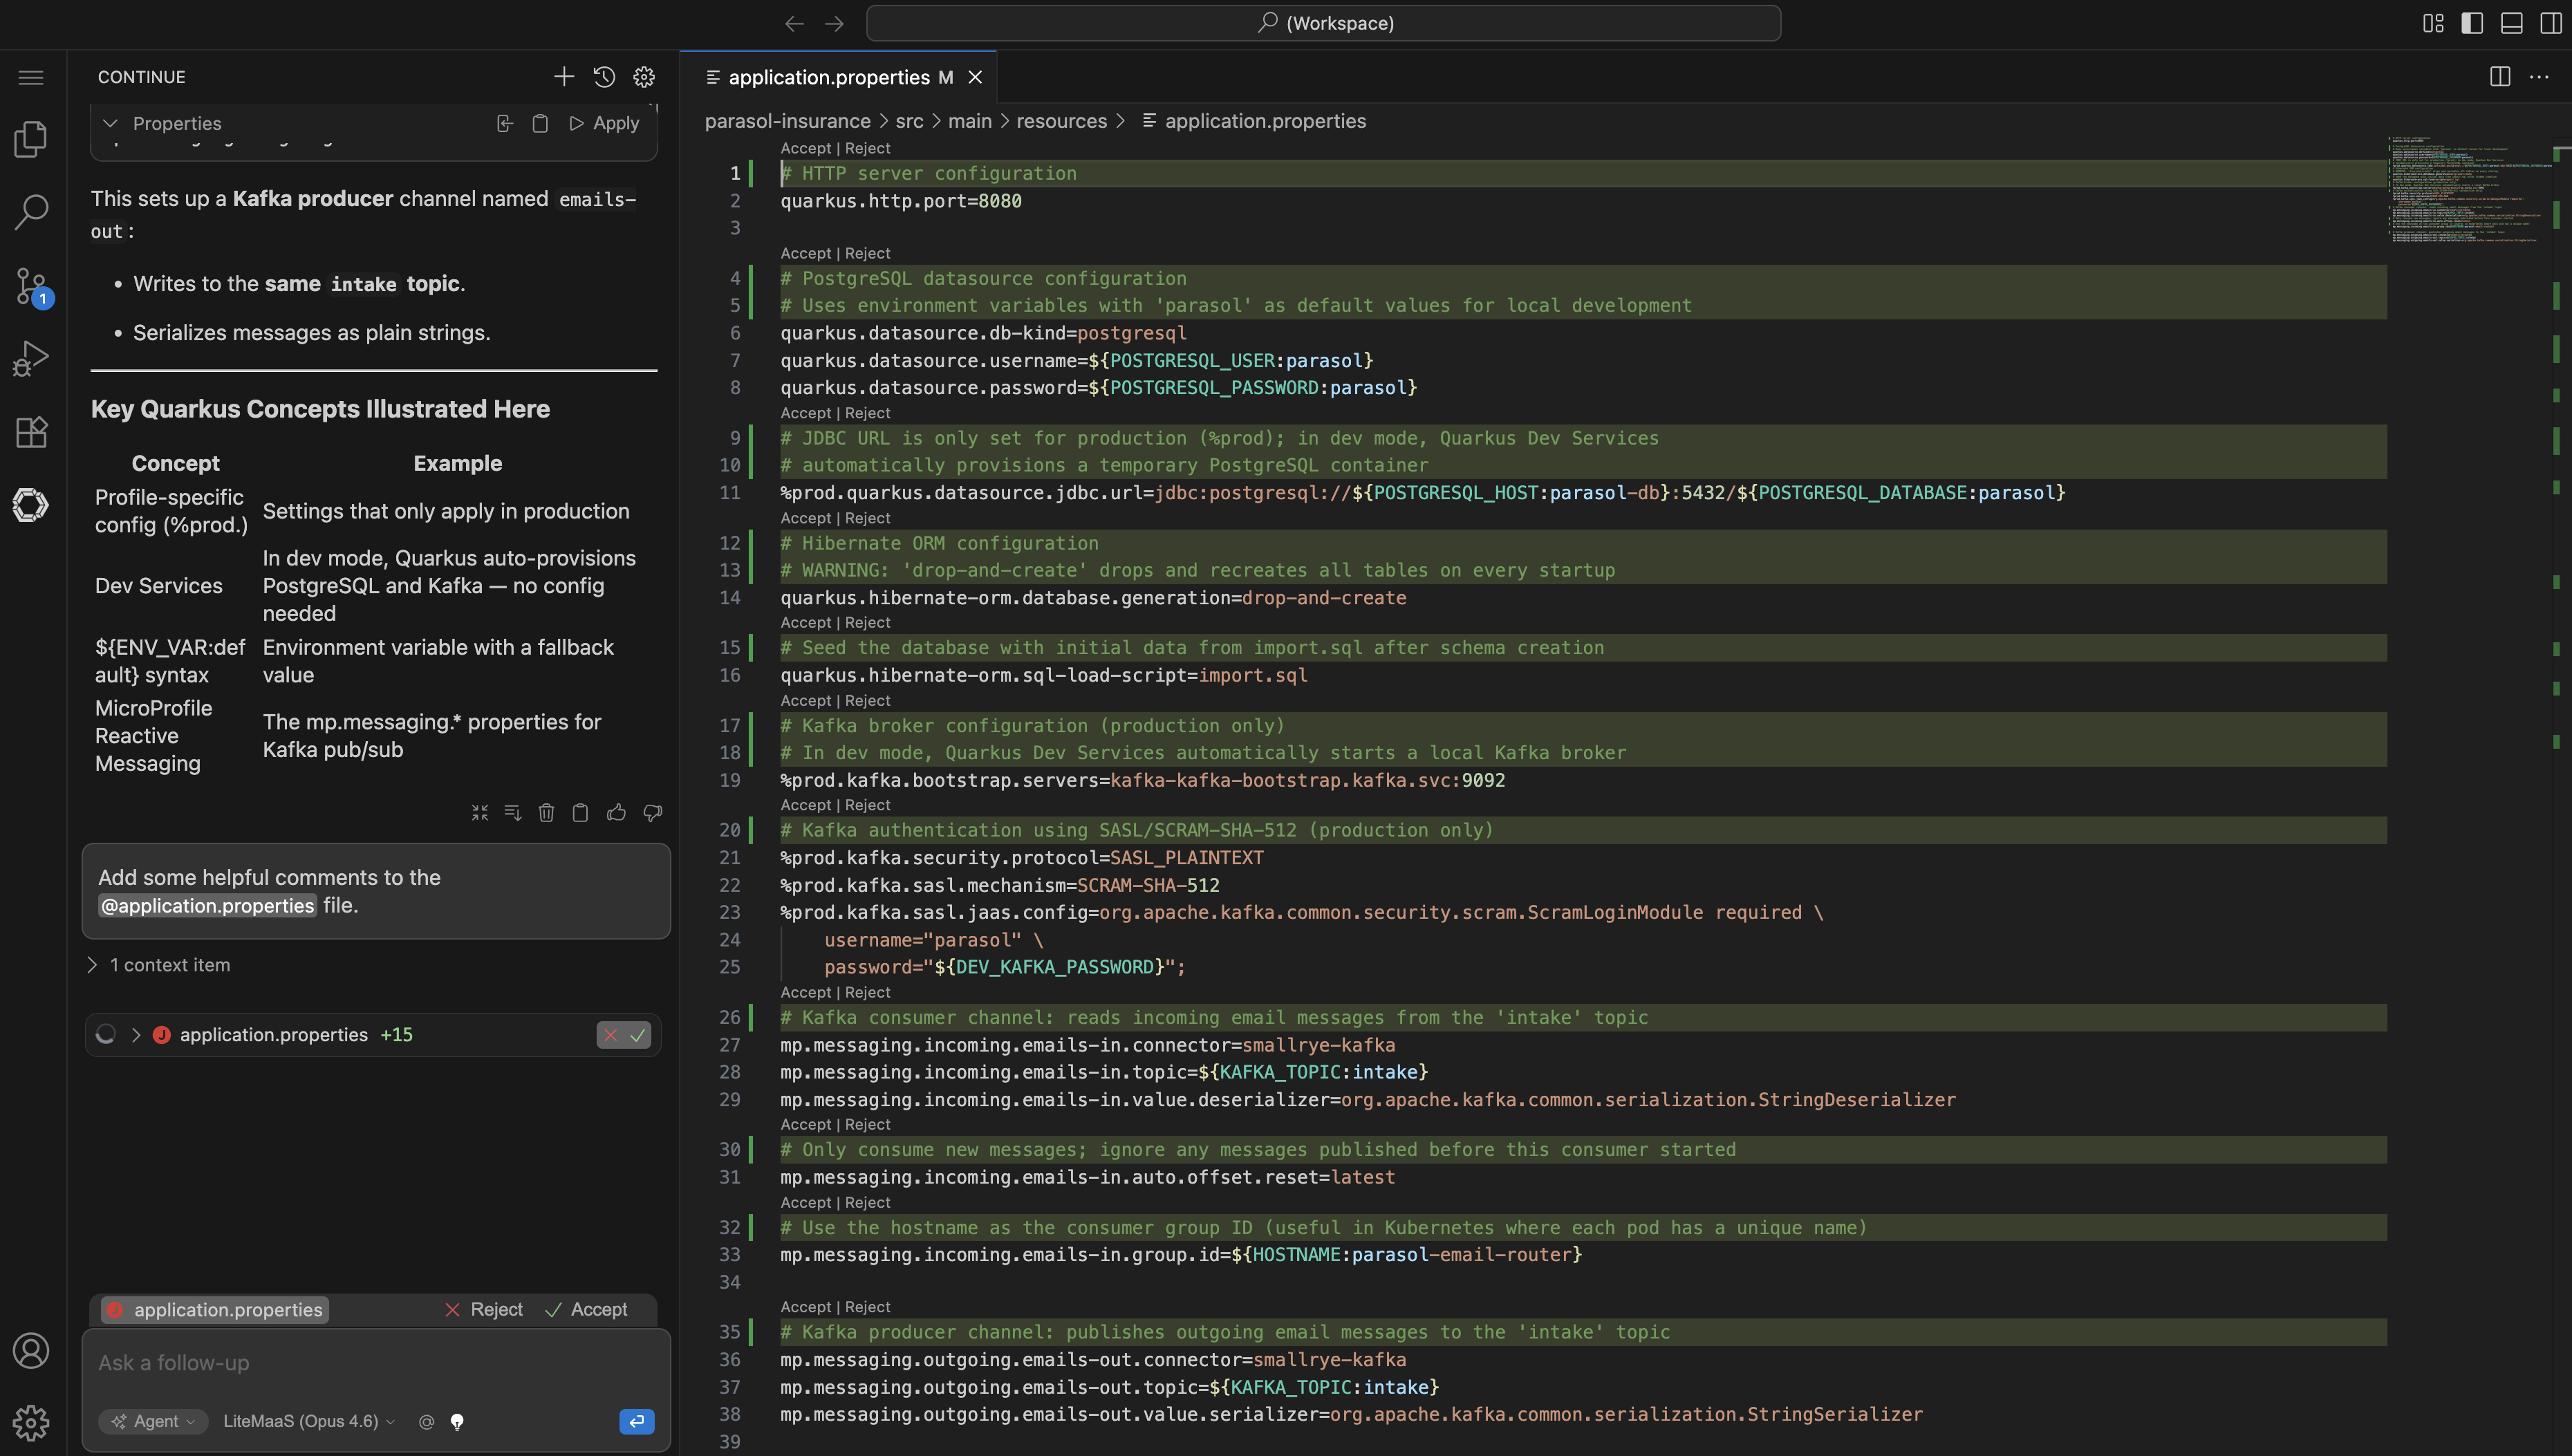 Figure 10. Continue proposing code changes
Developers can use agentic coding assistants to quickly gain insight into codebases they’re not familiar with, and develop new features more quickly. Platform administrators can configure which extensions are available and pre-configure those extensions, as you’ve seen in this environment.
Start the Quarkus application in dev mode
-
In the top-left menu click Terminal > Run Task…
Alternatively use the keyboard shortcut Ctrl + Shift + P then type "run task", then select Tasks: Run Task and press Enter. On macOS use Cmd instead of Ctrl. -
Select devfile > Start Development mode from the Run Task menu
This starts Quarkus in development mode. Behind the scenes, Testcontainers spins up local Kafka and PostgreSQL instances so the full application runs inside your workspace.
-
Wait for the application to start. You will see log output in the terminal indicating the Quarkus application is ready.
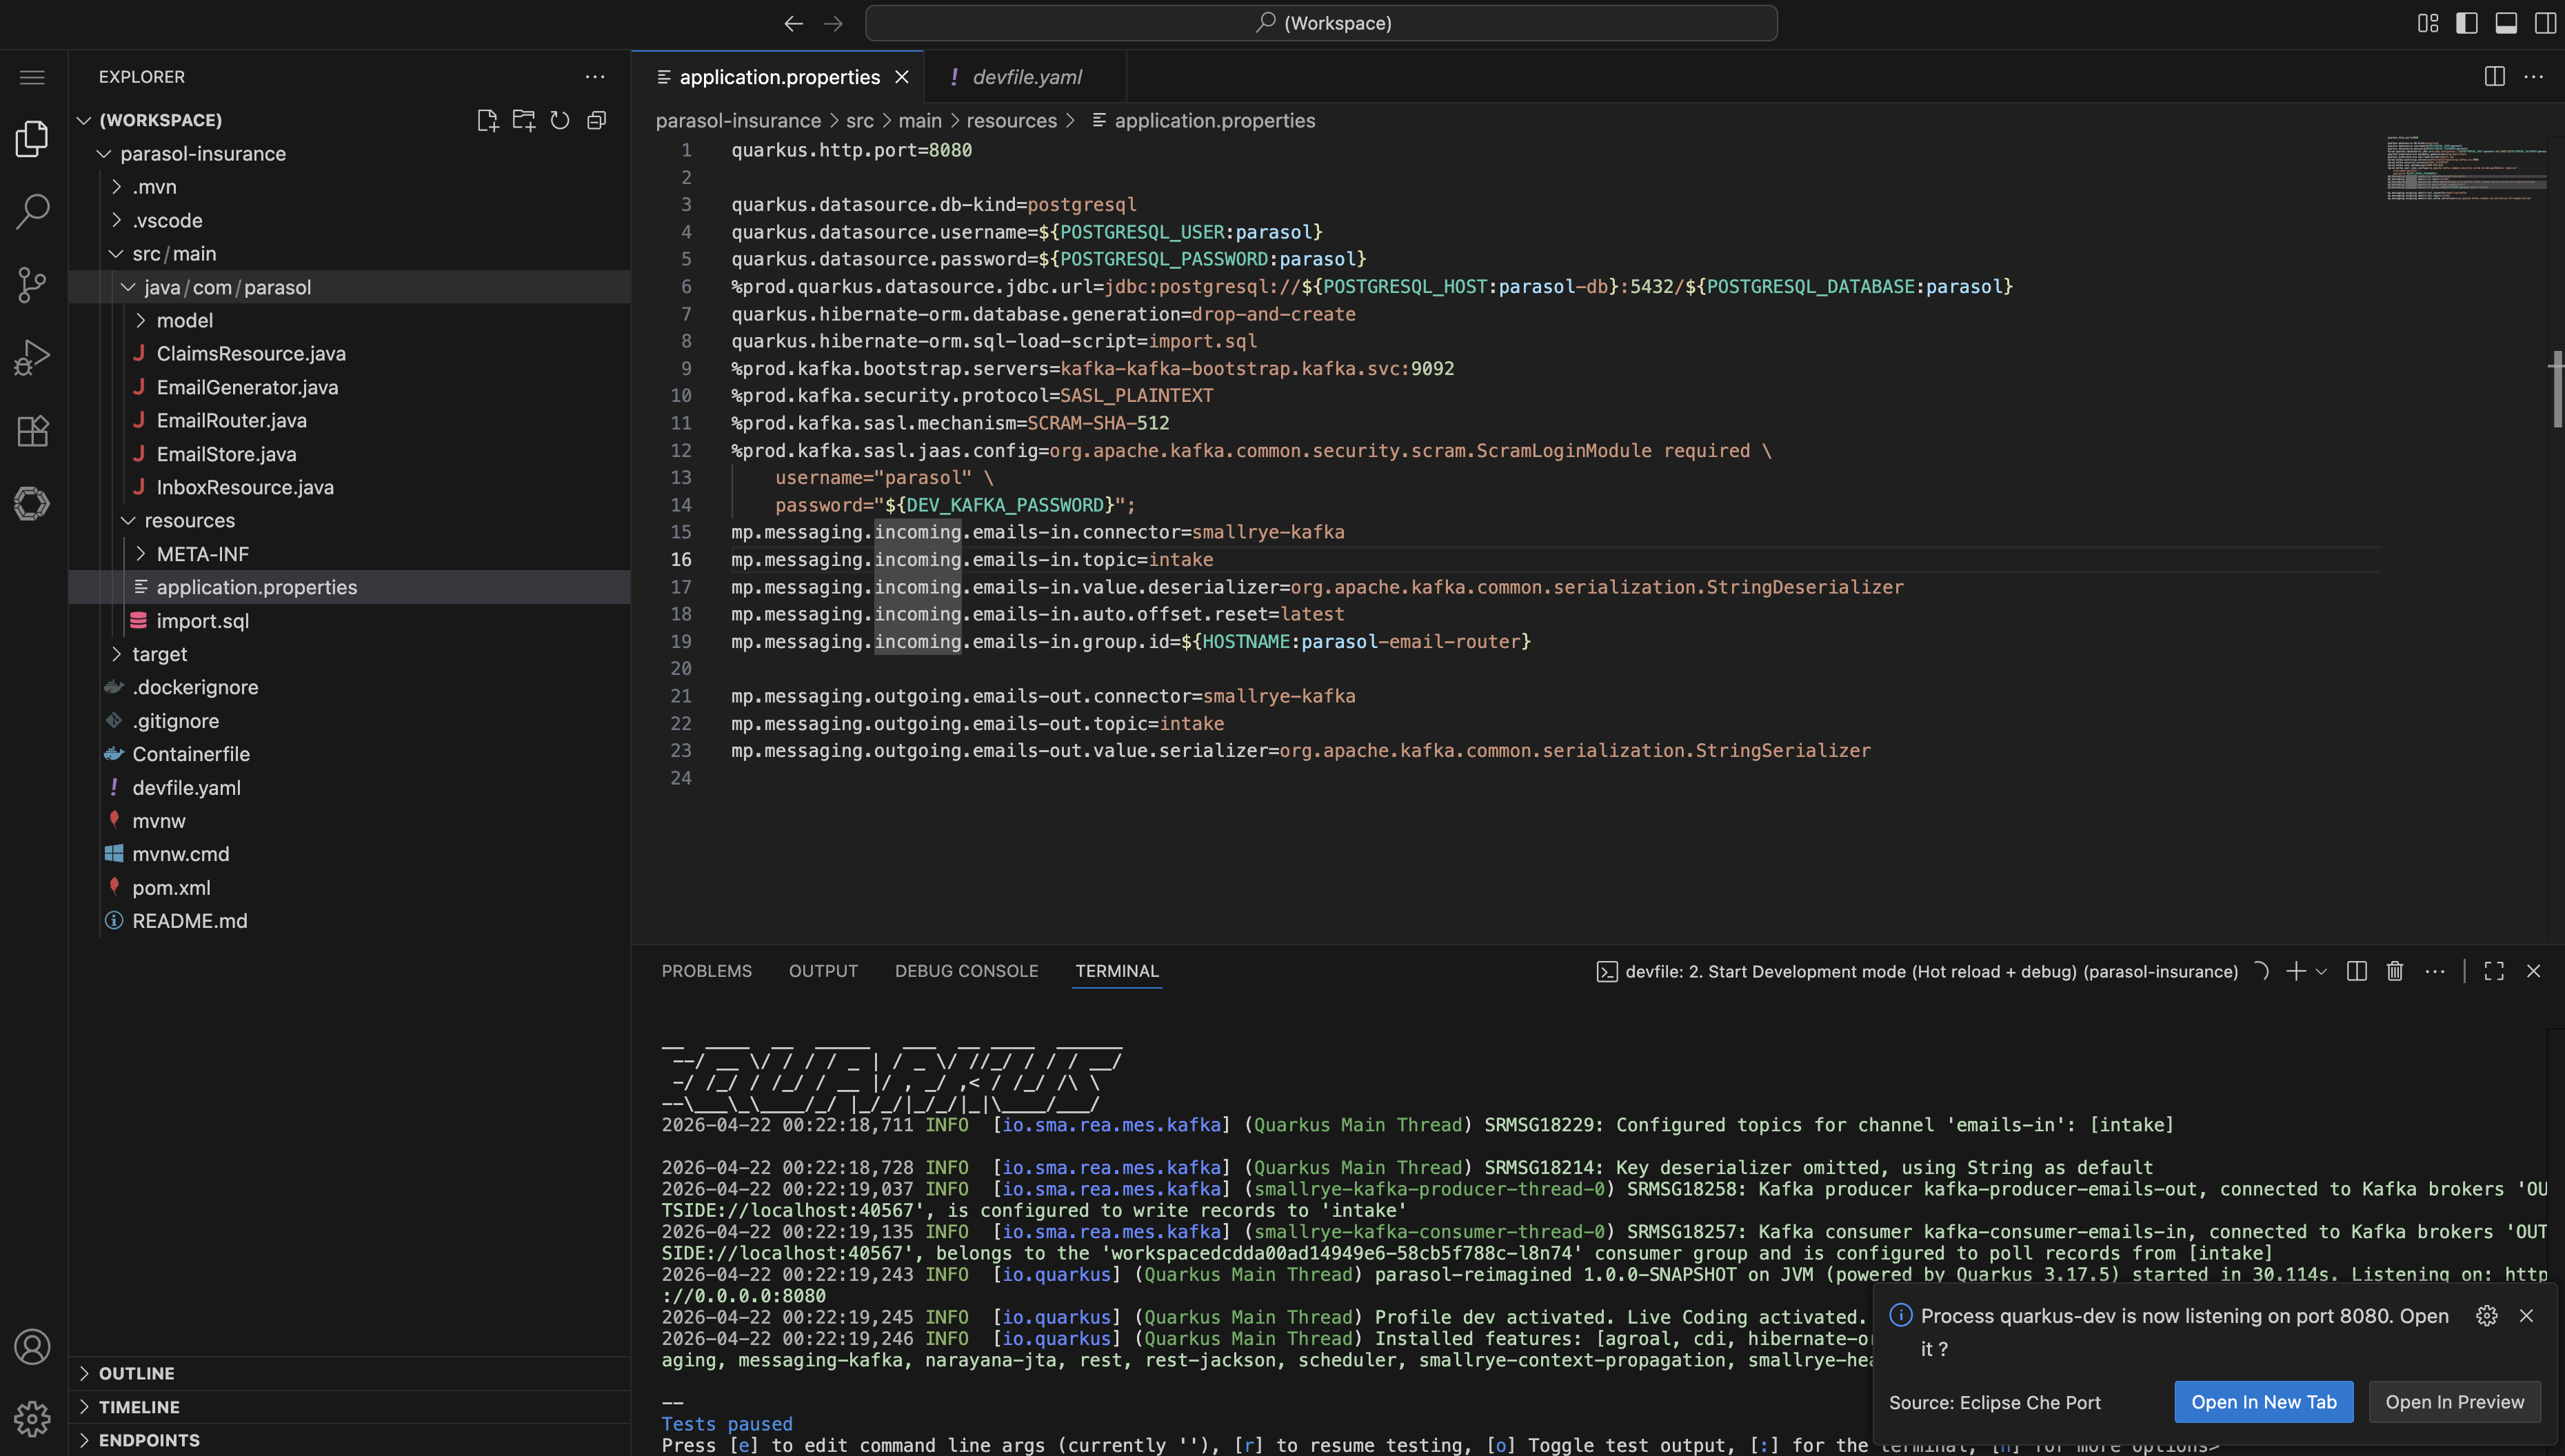 Figure 11. Quarkus running in dev mode
 -
When prompted by a popup, click Open in a New Tab. Navigate to the Inbox page to confirm the application is running and displaying emails.
Curious about how nested containers work in Dev Spaces? Open a new terminal (using the + icon above the Quarkus Dev Mode terminal) and run
podman psto see the Kafka and PostgreSQL containers running alongside your application. -
If you missed the prompt to open the Quarkus application in a new tab, you can use the Endpoints section in OpenShift Dev Spaces to find the link.
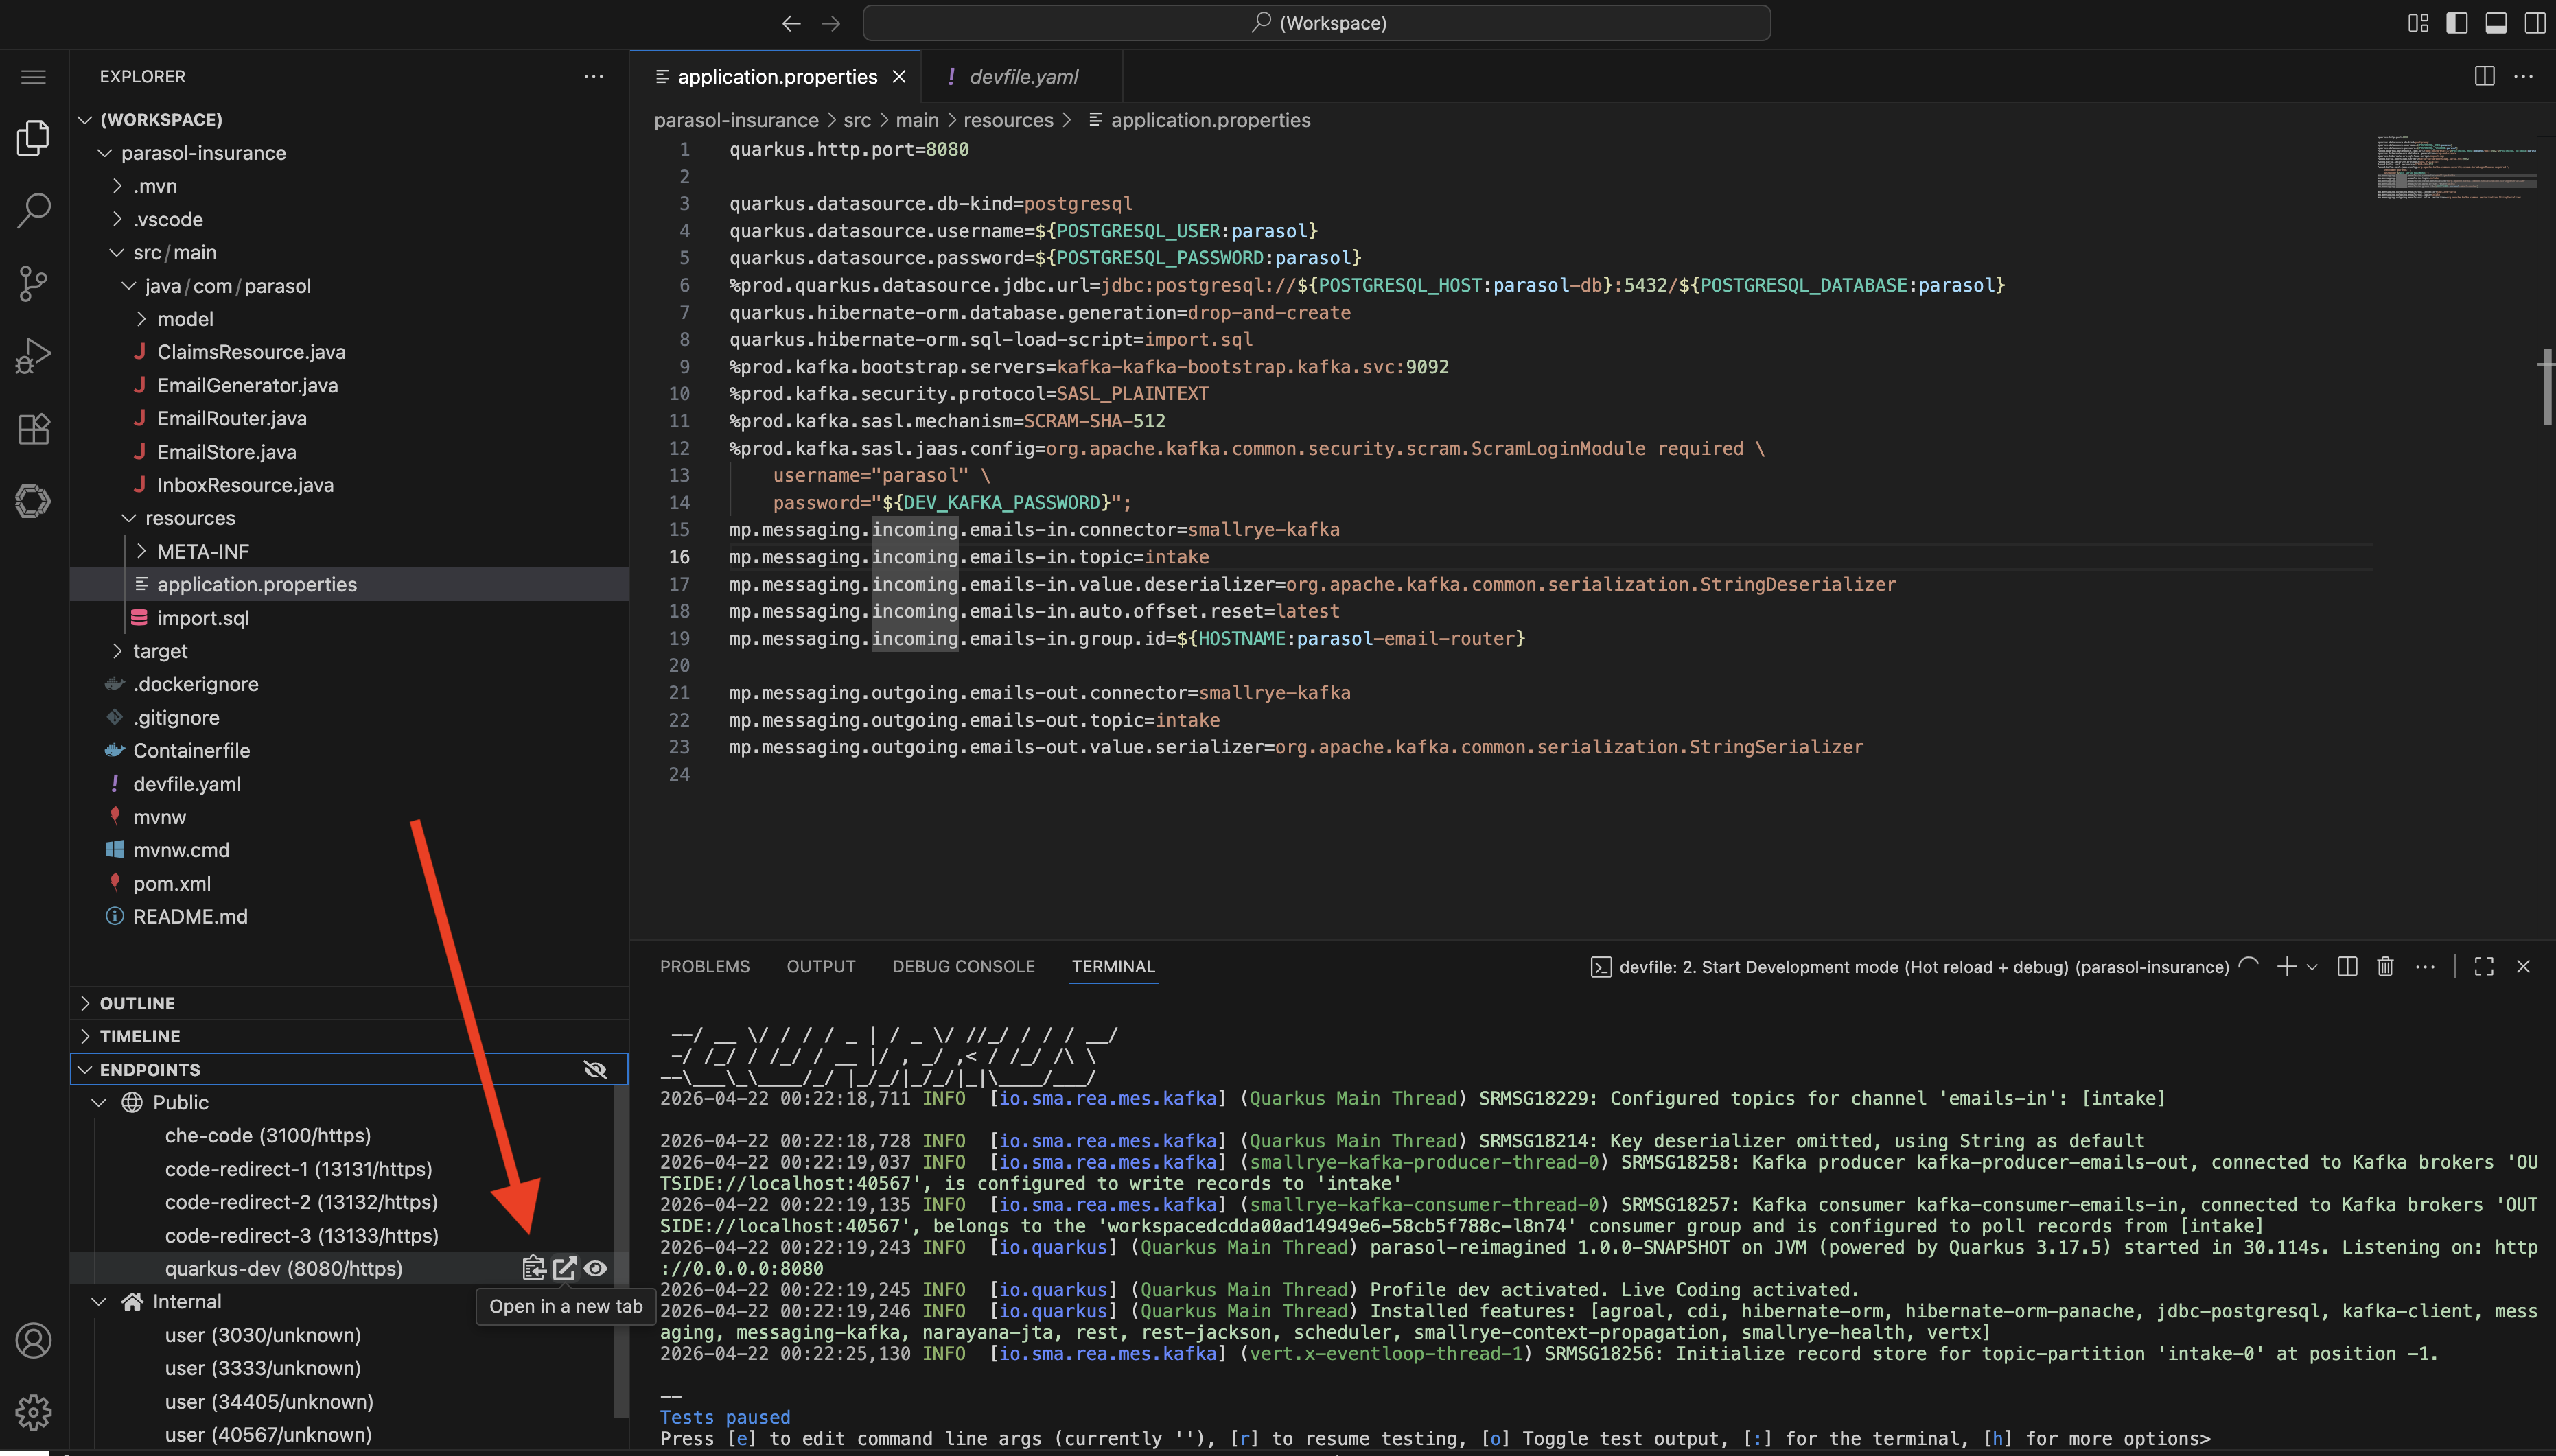 Figure 12. Accessing endpoints in Dev Spaces
Dev Spaces provides a comprehensive local-like development environment with Podman (or Docker) CLI, access to popular runtimes (e.g. JDK, Node.js, Python), and a full featured terminal. By default, Dev Spaces uses a Universal Developer Image that includes popular dev tools and libraries. Platform administrators can use alternative container images with curated tooling and specific versions if desired.
Exercise 3: Implement a feature and push your changes
Now you will use the Continue coding assistant to make a code change, then commit and push it through the automated pipeline.
Make the code change
The inbox currently displays timestamps in a UTC-like 24-hour format (e.g., 2026-04-20 14:30:00). The product requirements call for a locale-friendly format with AM/PM (e.g., Apr 20, 2026 02:30 PM).
-
Select the Continue extension.
-
Click the plus icon at the top of the Continue panel to begin a new session.
-
Enter the following prompt:
The inbox currently displays utc-like time, but the product requirements need a locale time with AM/PM - please implement this change. -
Continue will analyze the codebase, find the relevant code (most likely the
DateTimeFormatterpattern inEmailRouter.java), and propose changes. Review the suggested changes and accept them.The model might choose to edit inbox.htmlinstead, since our prompt is not particularly specific. Such is the nature of working with an LLM.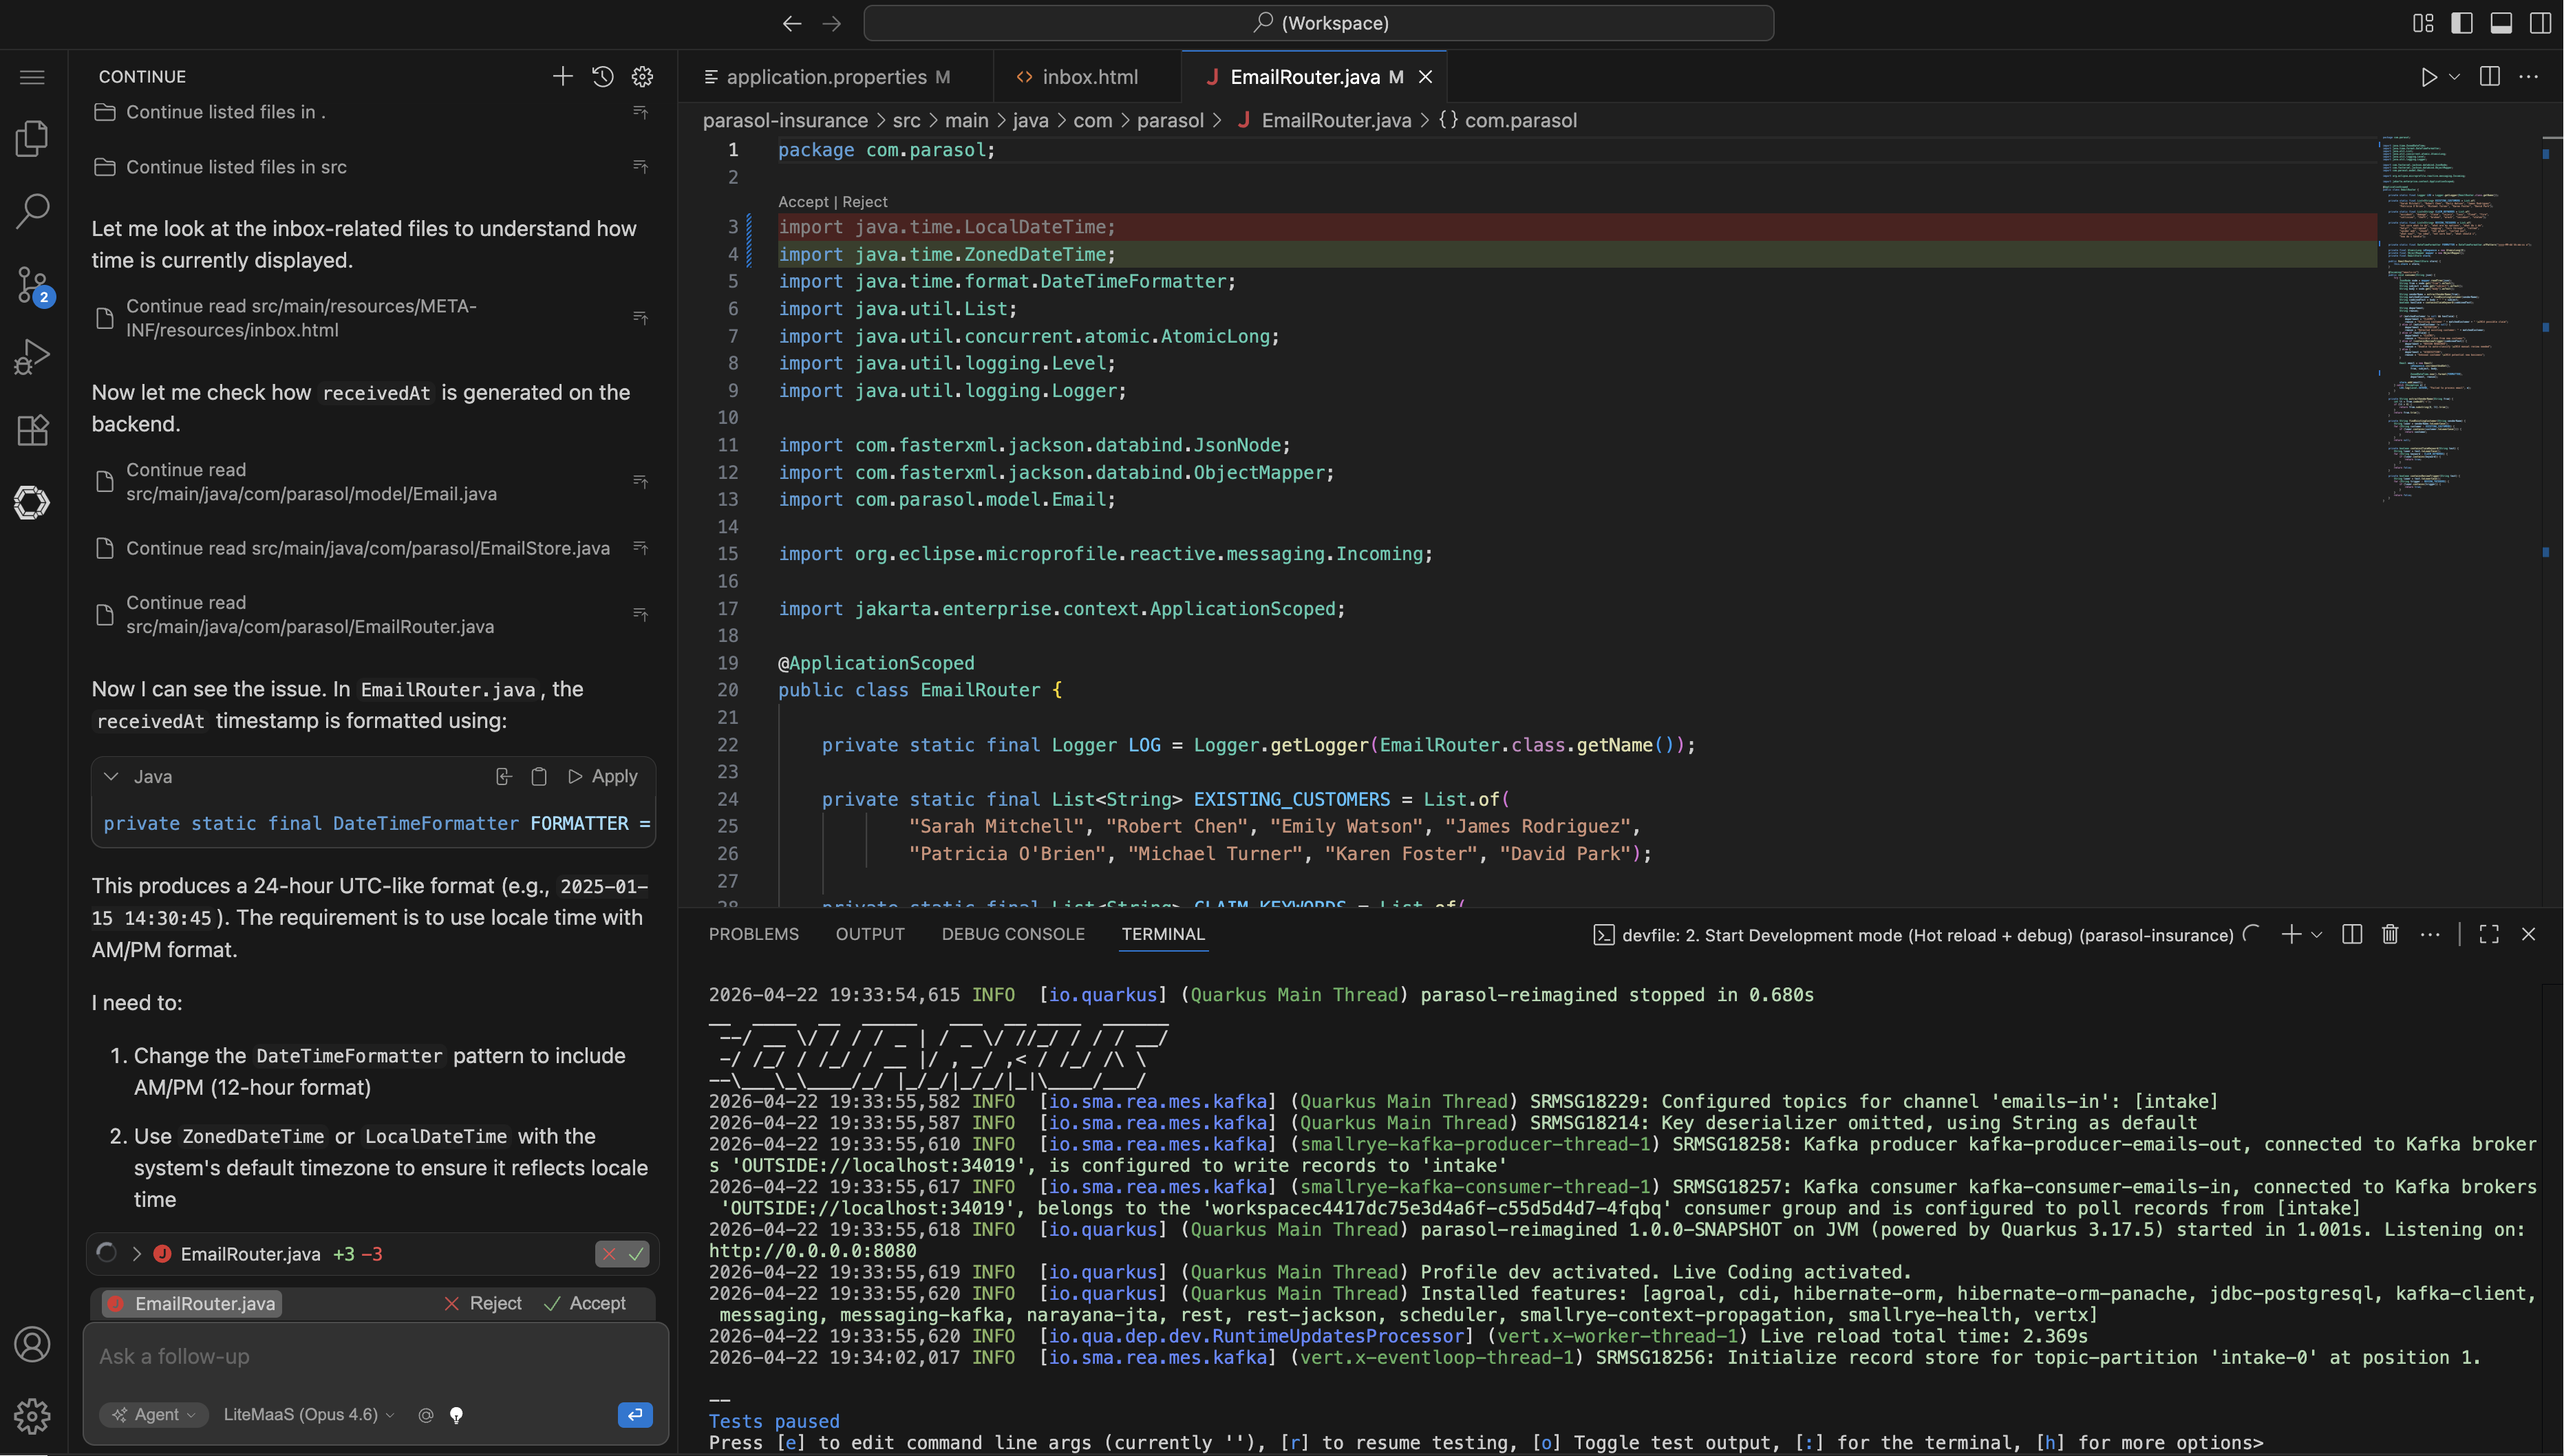 Figure 13. Continue proposing the timestamp format change
 -
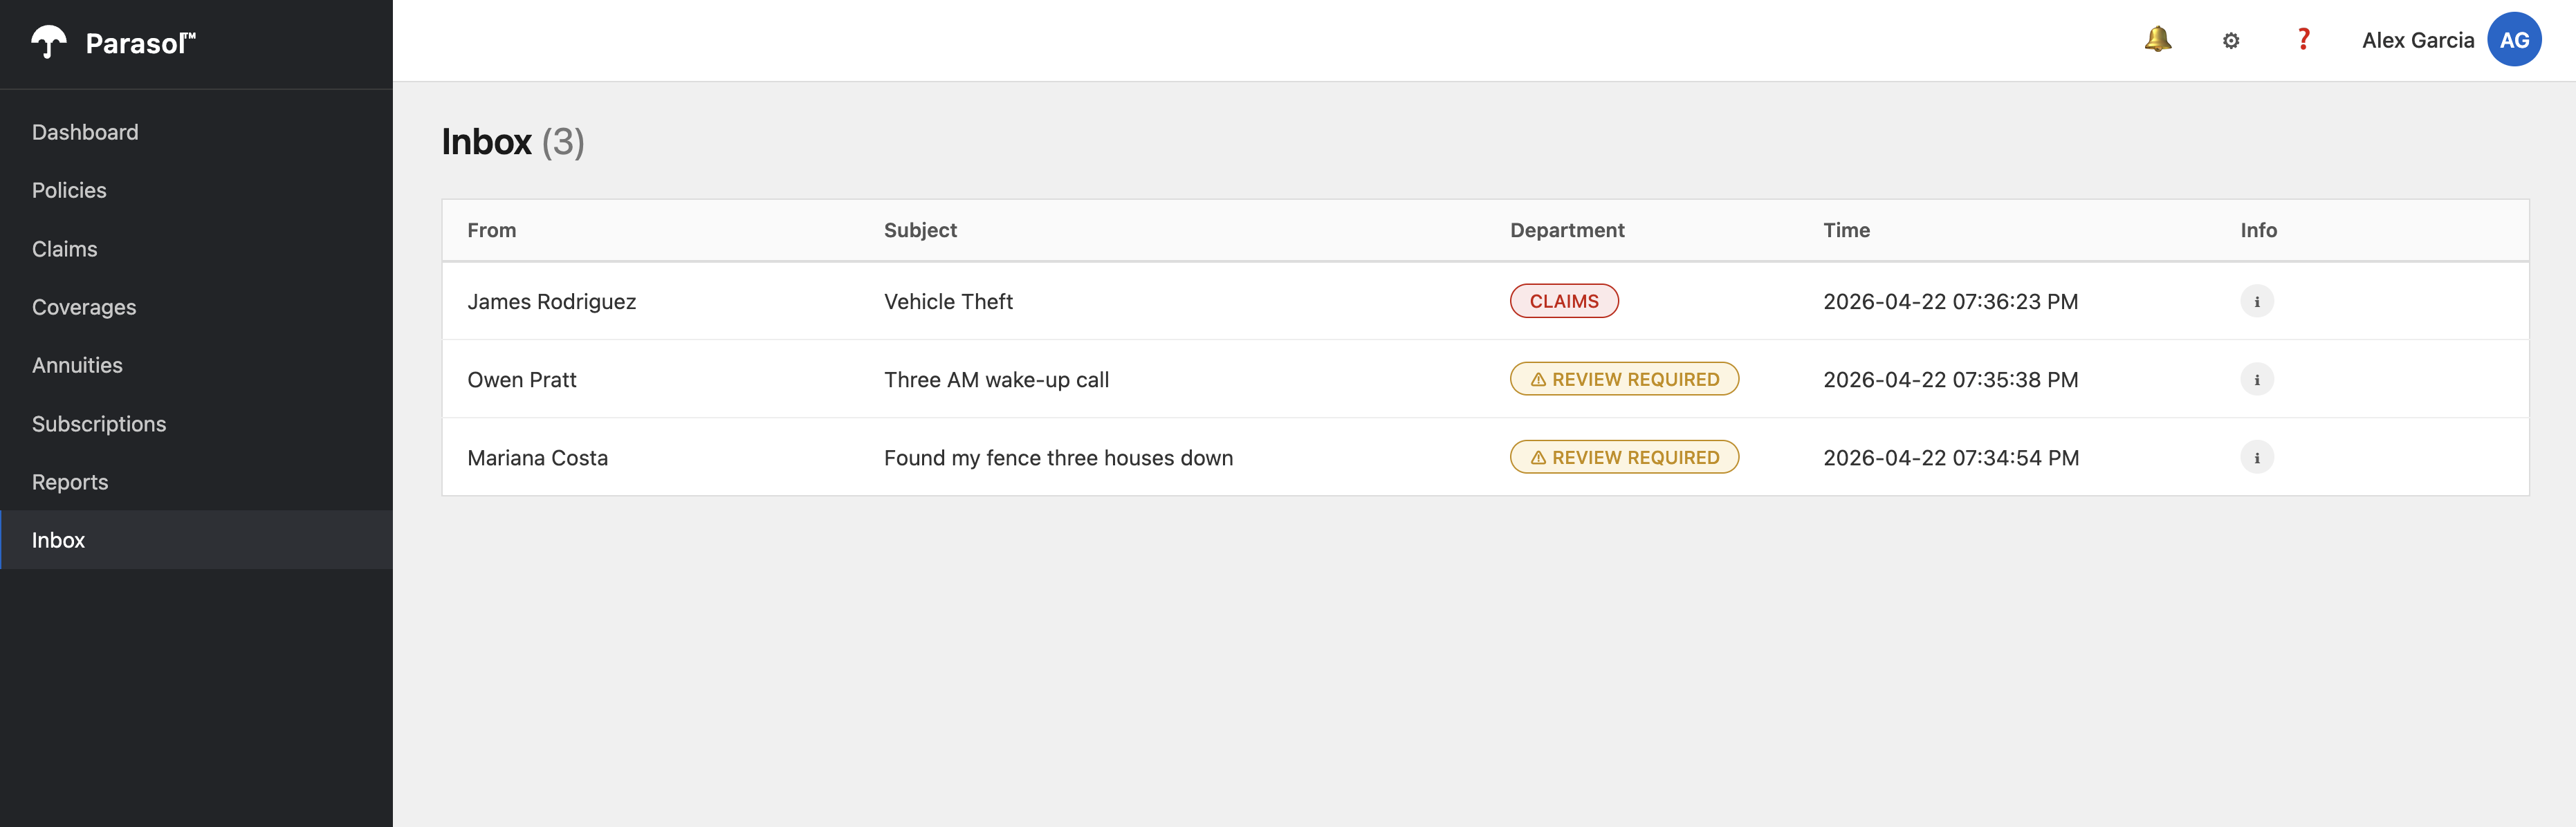
After accepting the changes, verify them in your running application:
-
Switch to the browser tab with the application preview
-
Refresh the Inbox page and wait for a new message to appear
-
Confirm the timestamps now display in a locale-friendly format with AM/PM (e.g.,
2026-04-22 07:35:38 PM)
-
Commit and push
-
In the Dev Spaces left sidebar, click the Source Control icon (the branch icon)
-
Review the changed files in the Changes section
-
Stage your changes by clicking the * icon next to each changed file (or click * next to Changes to stage all)
-
Enter a commit message, for example:
feat: display inbox timestamps in locale format with AM/PM -
Click the down arrow on the Commit button and click Commit & Push
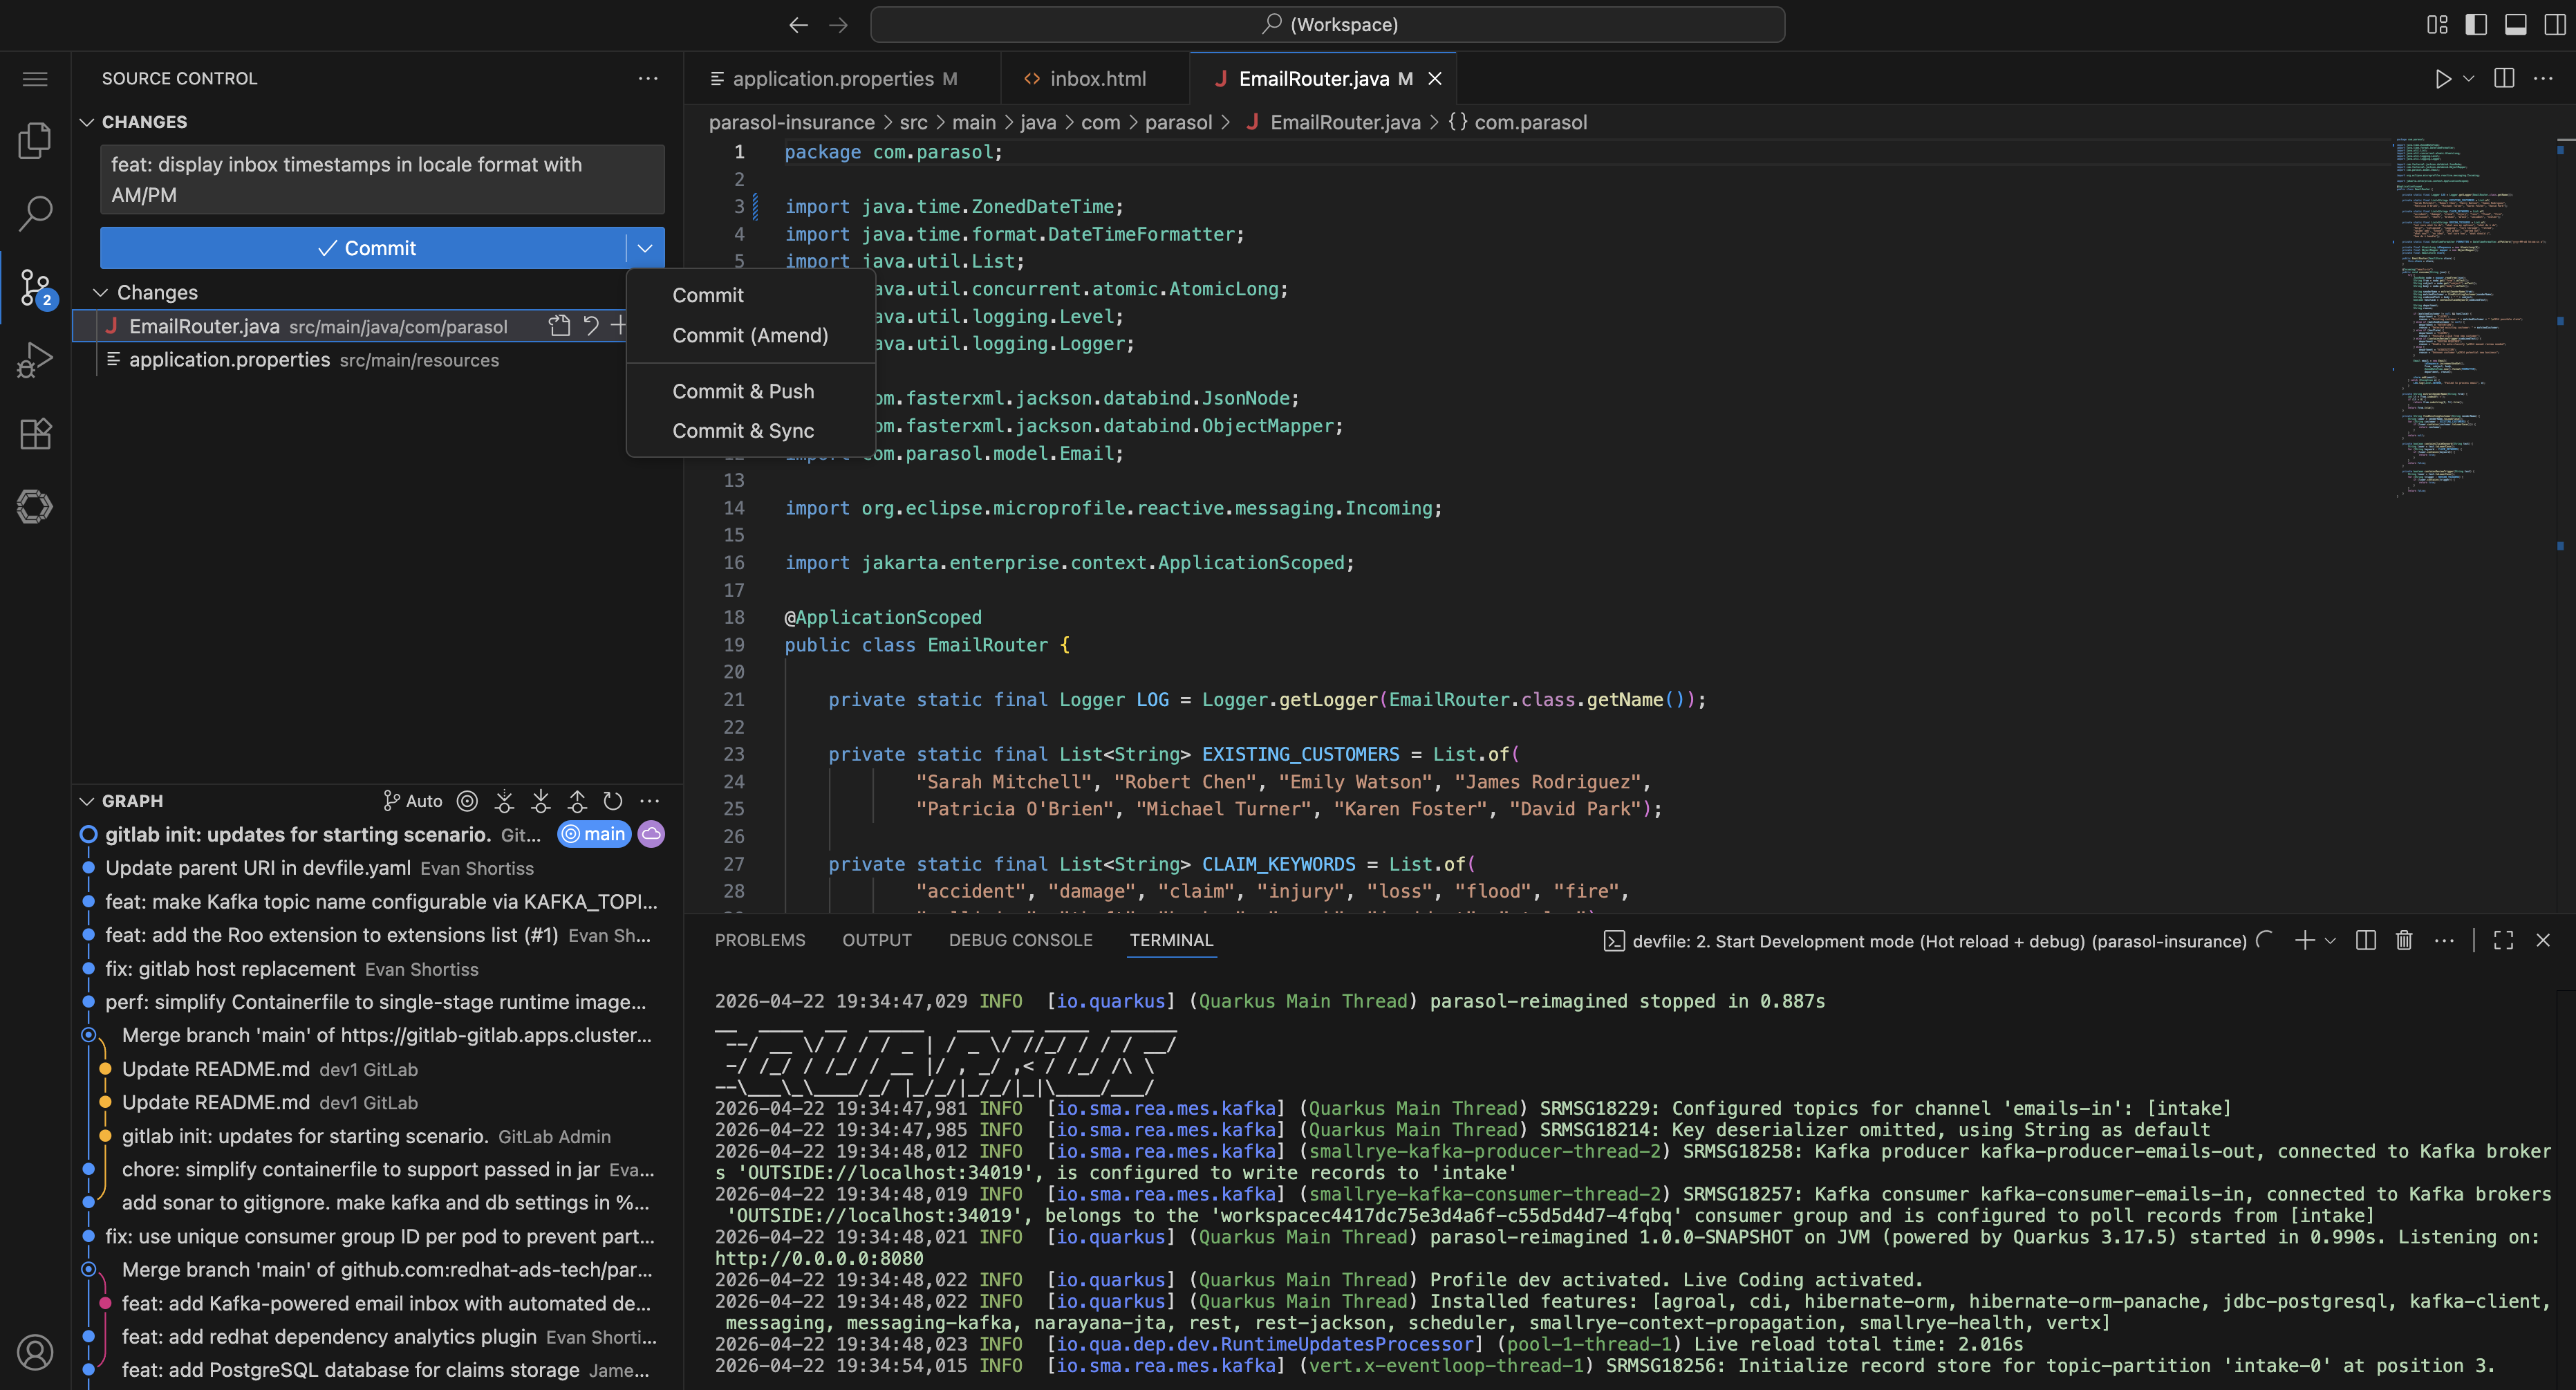 Figure 15. Committing and pushing changes from Dev Spaces
 -
Click Yes in the confirmation dialog box that appears.
Exercise 4: Watch the pipeline and verify the deployment
Your git push triggered a webhook in GitLab, which started a new PipelineRun in your build namespace.
Find the PipelineRun in OpenShift
-
In the OpenShift Console tab, expand the left menu and select Pipelines > Pipelines
-
Choose the
{user_name}-buildfrom the Project dropdown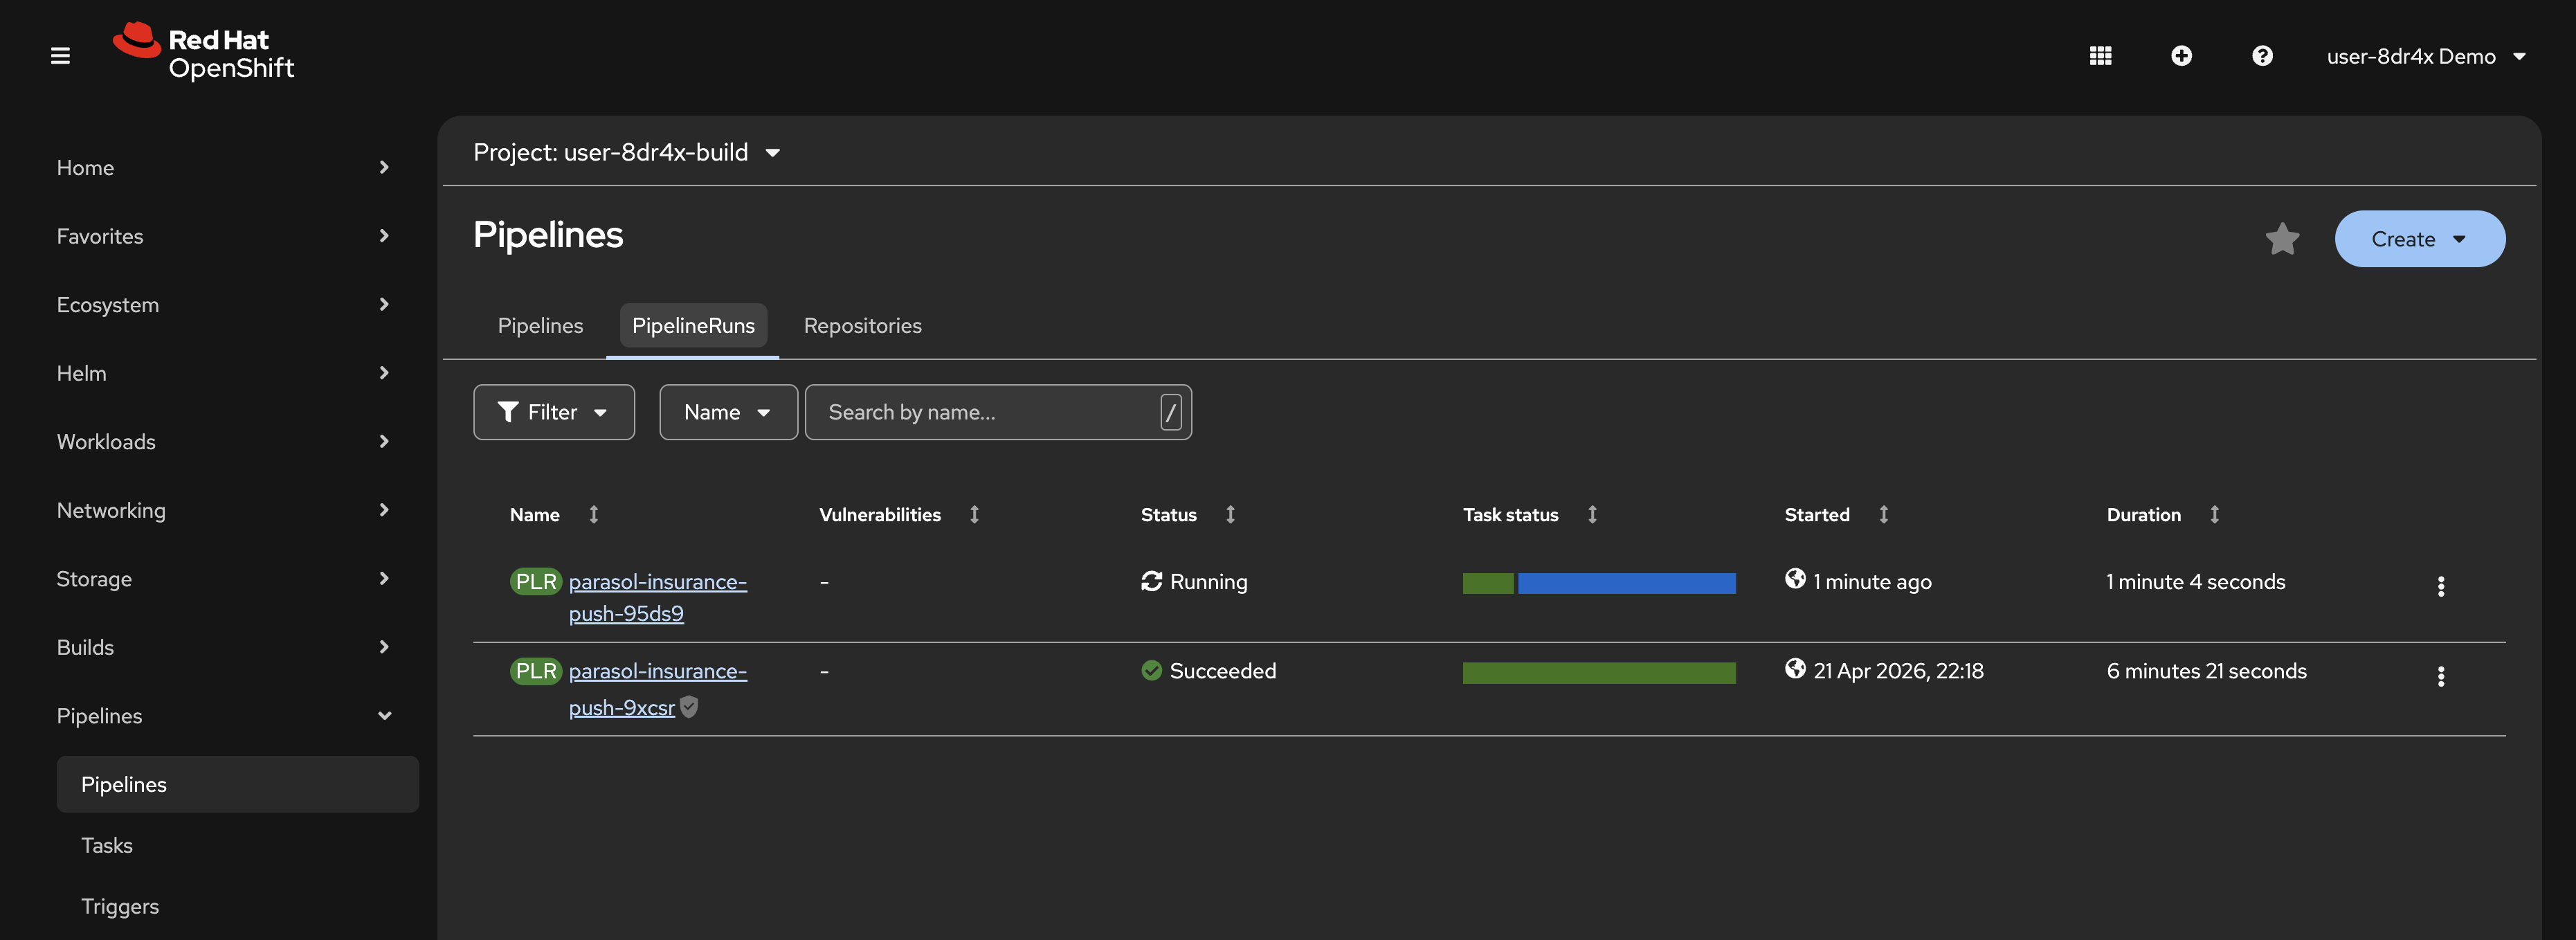 Figure 16. A new PipelineRun triggered by your push
 -
You should see a new PipelineRun in progress. Click on it to watch the stages:
-
clone — pulls your latest code from GitLab
-
maven-build — compiles the application and runs unit tests
-
sonar-scan — runs SonarQube static analysis
-
build-and-push — builds a new container image and pushes it to Quay
-
rollout-restart — triggers a rolling restart in the dev namespace
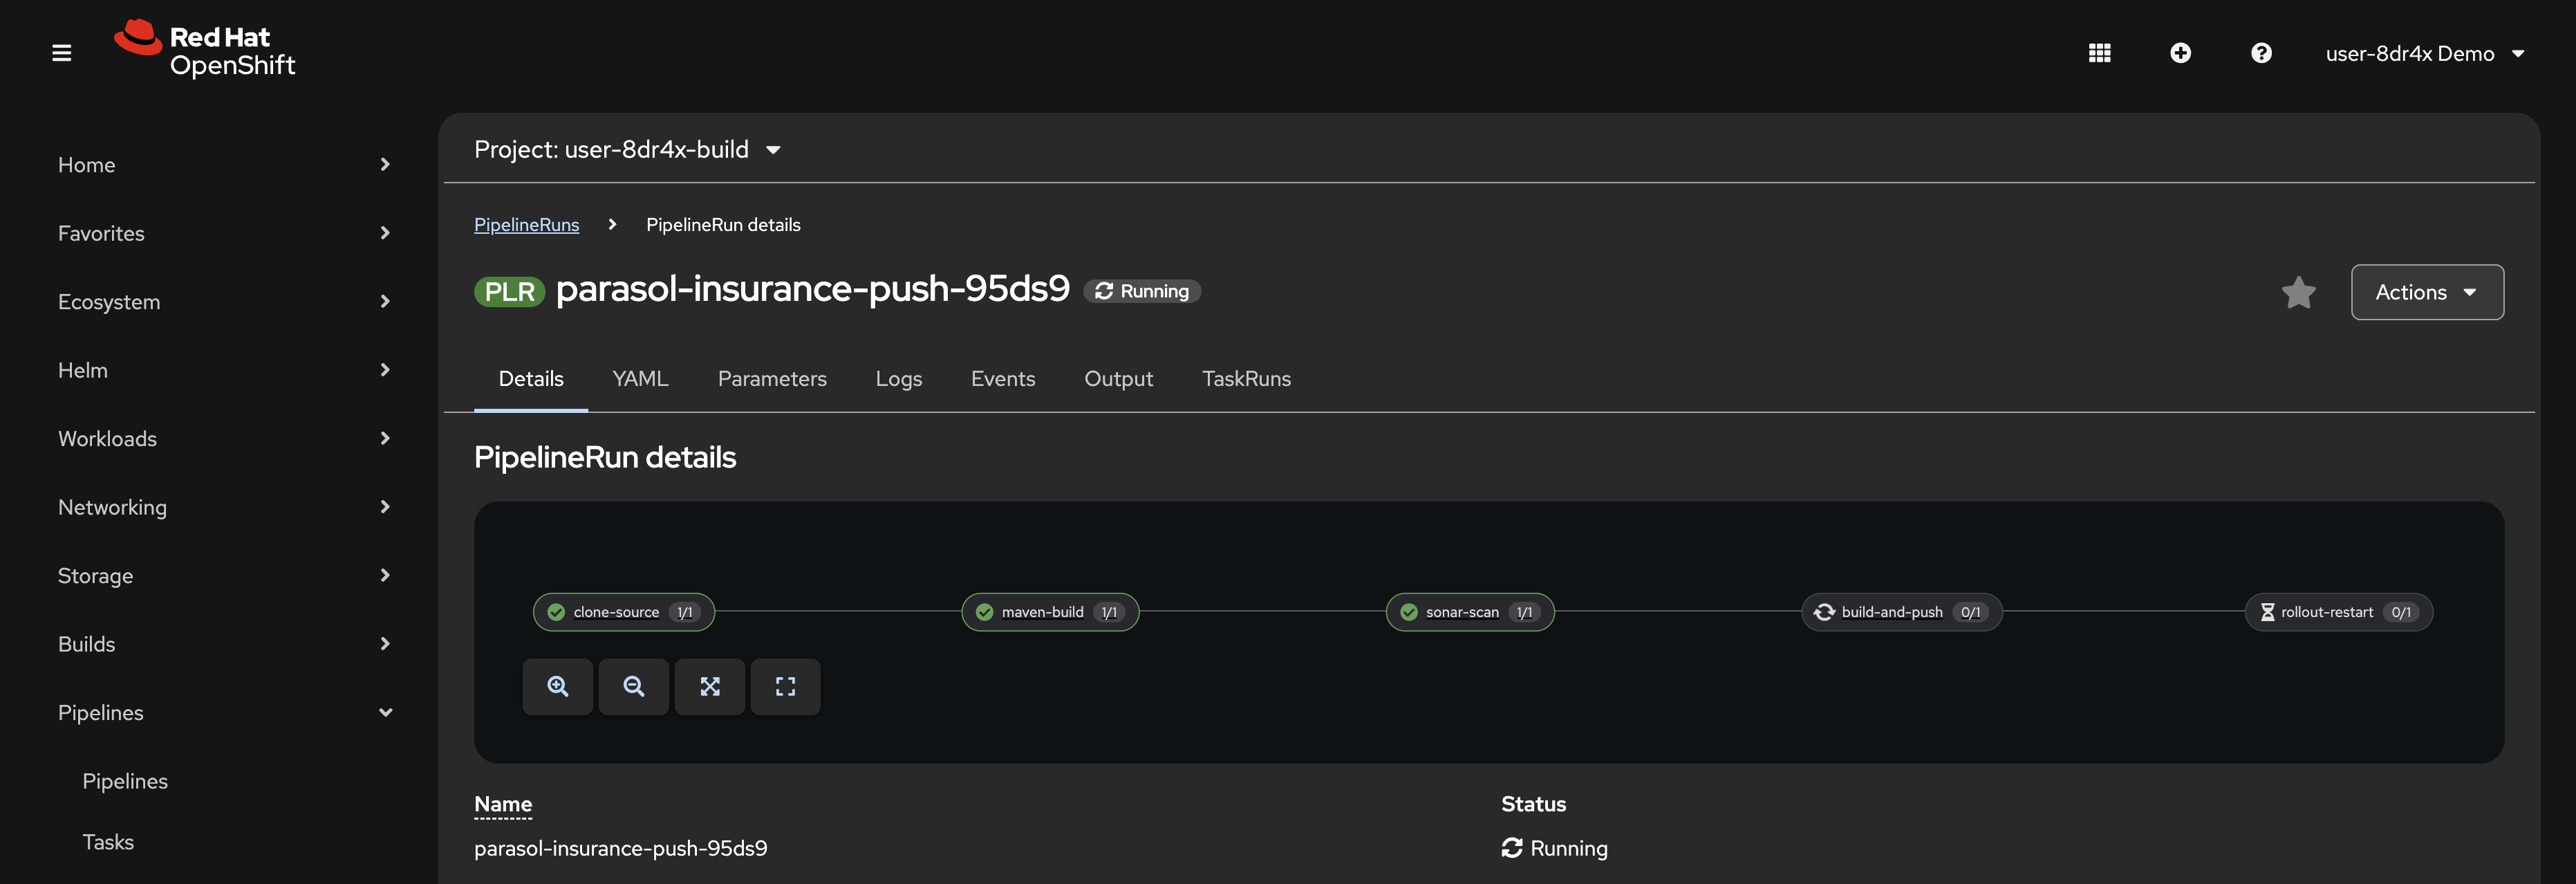 Figure 17. Pipeline stages progressing
-
-
While you wait for the pipeline to complete, proceed to the next step.
Check the SonarQube report
-
In the PipelineRun details, click on the sonar-scan task
-
Expand the task logs and look for the line that reads:
SonarQube Report: https://sonarqube-sonarqube.{openshift_cluster_ingress_domain}/dashboard?id=parasol-insurance-{user_name} -
This URL is already pre-loaded in SonarQube tab on the right side of this page. Refresh it to see the analysis report for your project. The report shows code quality metrics, potential issues, and test coverage information.
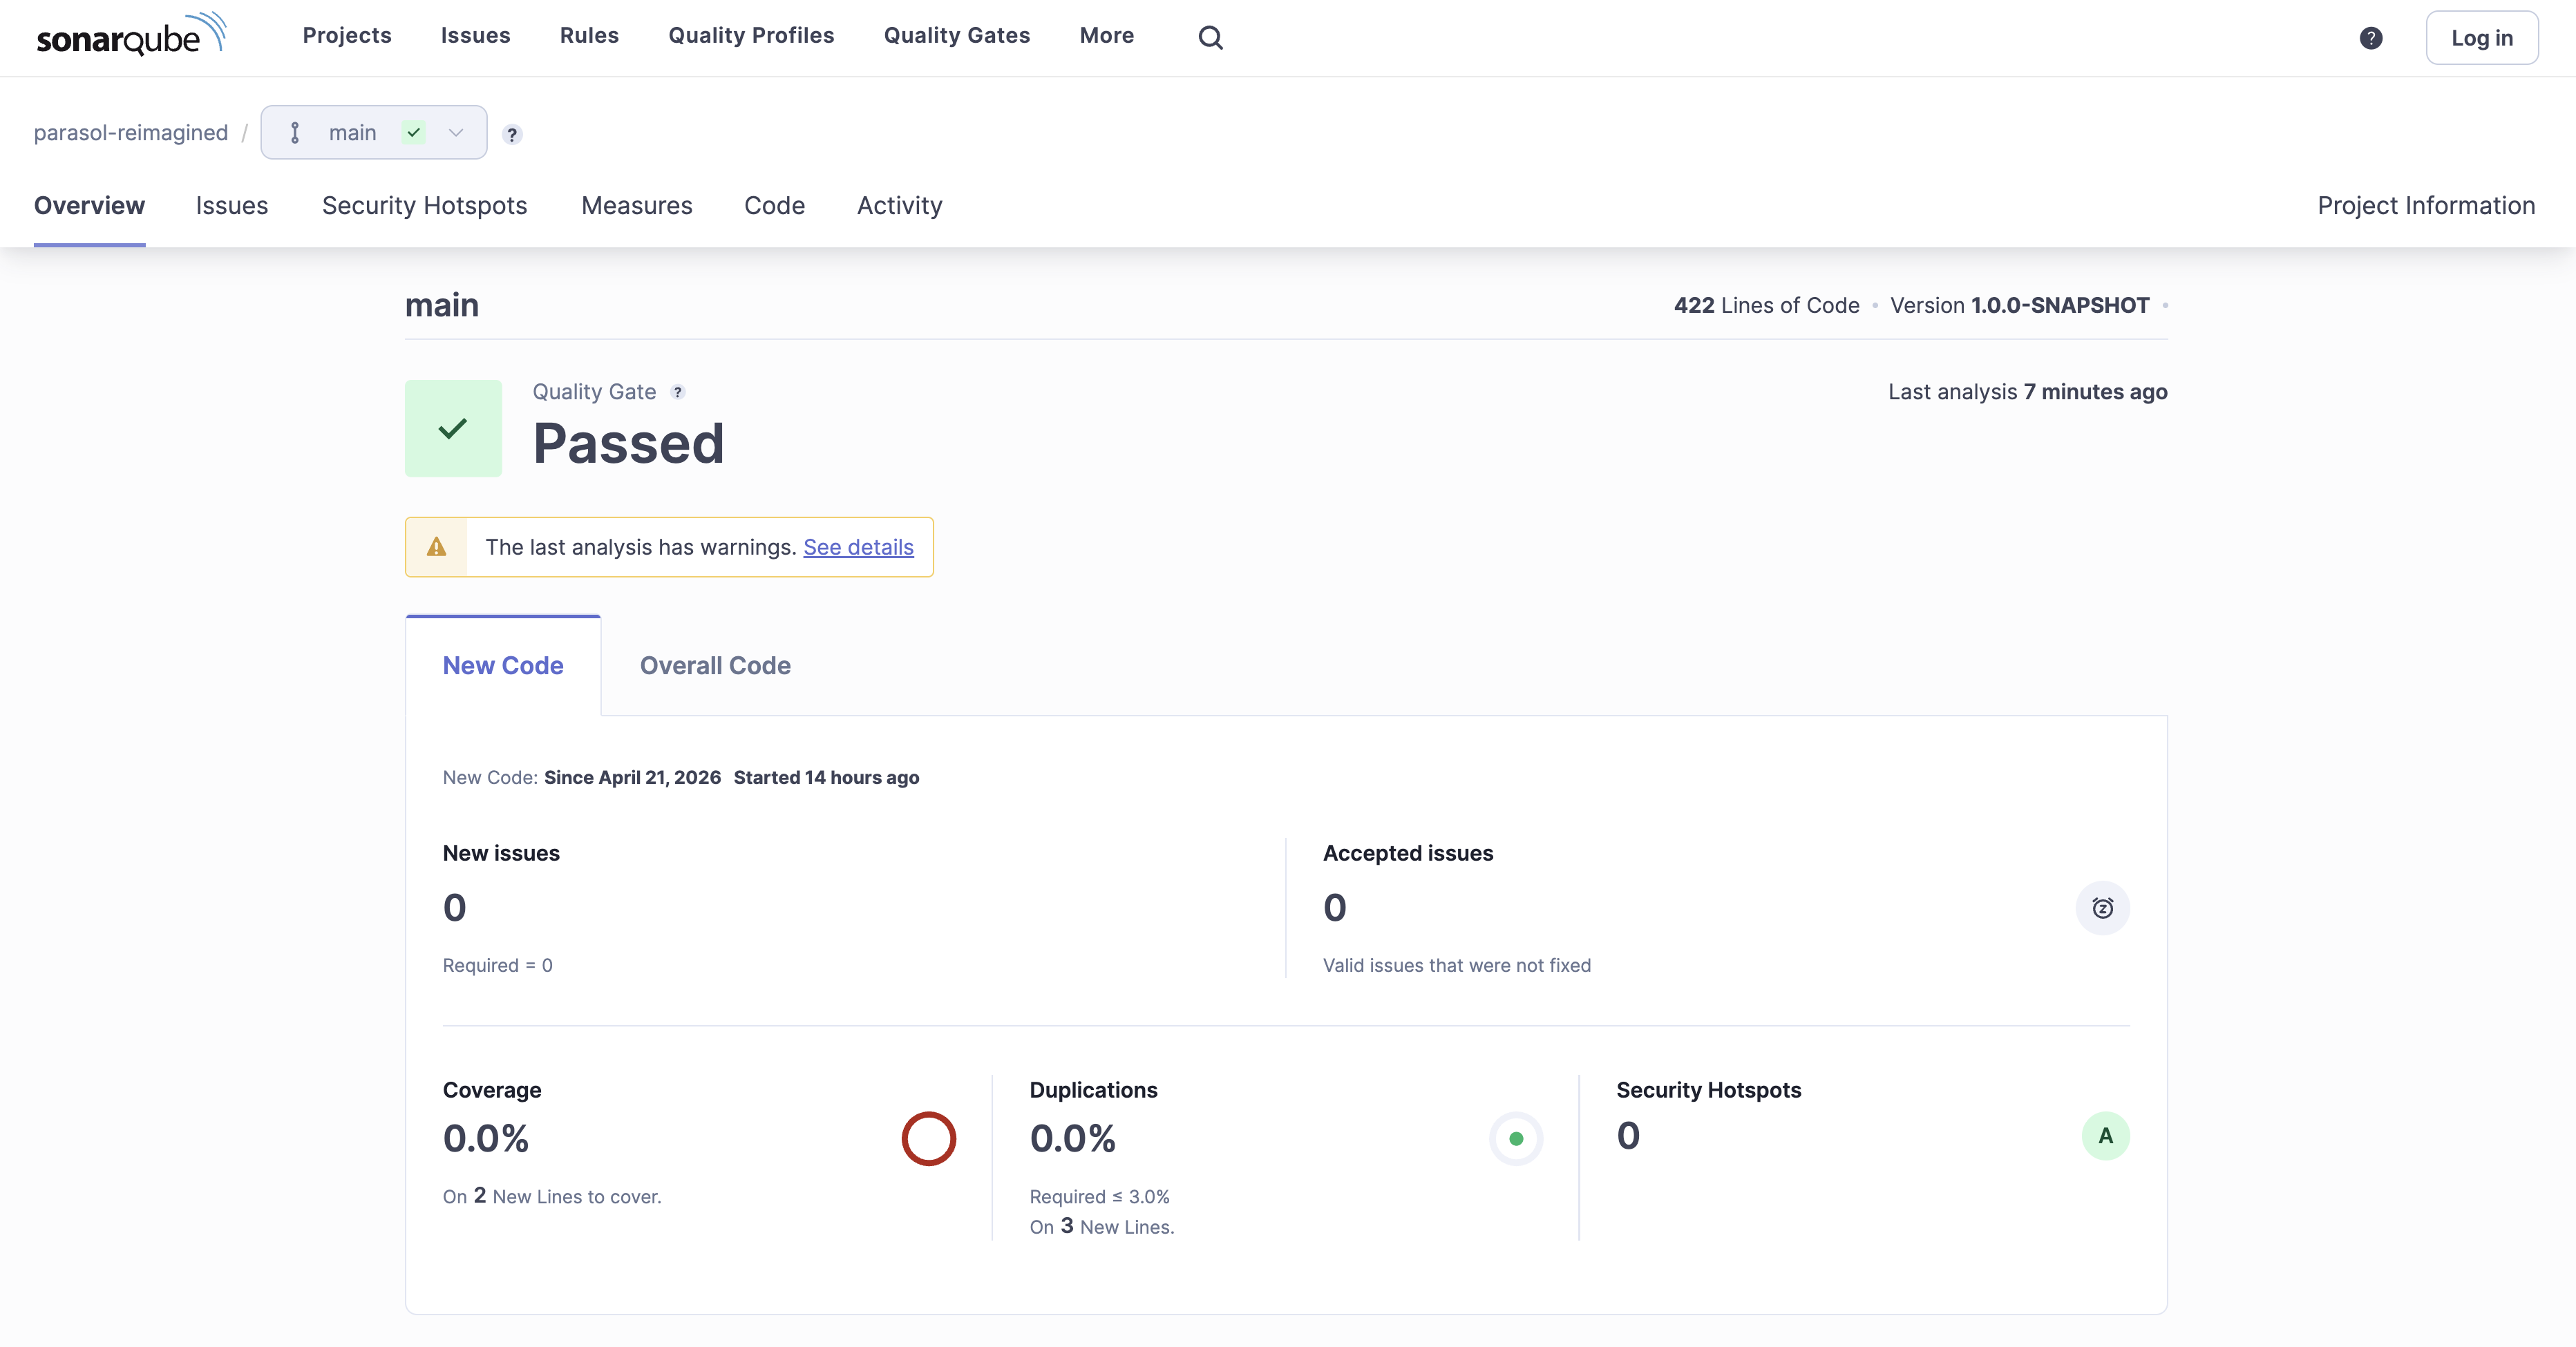 Figure 18. SonarQube analysis report
 -
Wait for the PipelineRun to finish.
Verify the deployment
-
Switch to the
{user_name}-devnamespace in the OpenShift Console -
Select Workloads > Pods from the left menu.
-
Confirm the Parasol Insurance application Pod has rolled out with the new image. Its age should be just a few minutes or seconds old.
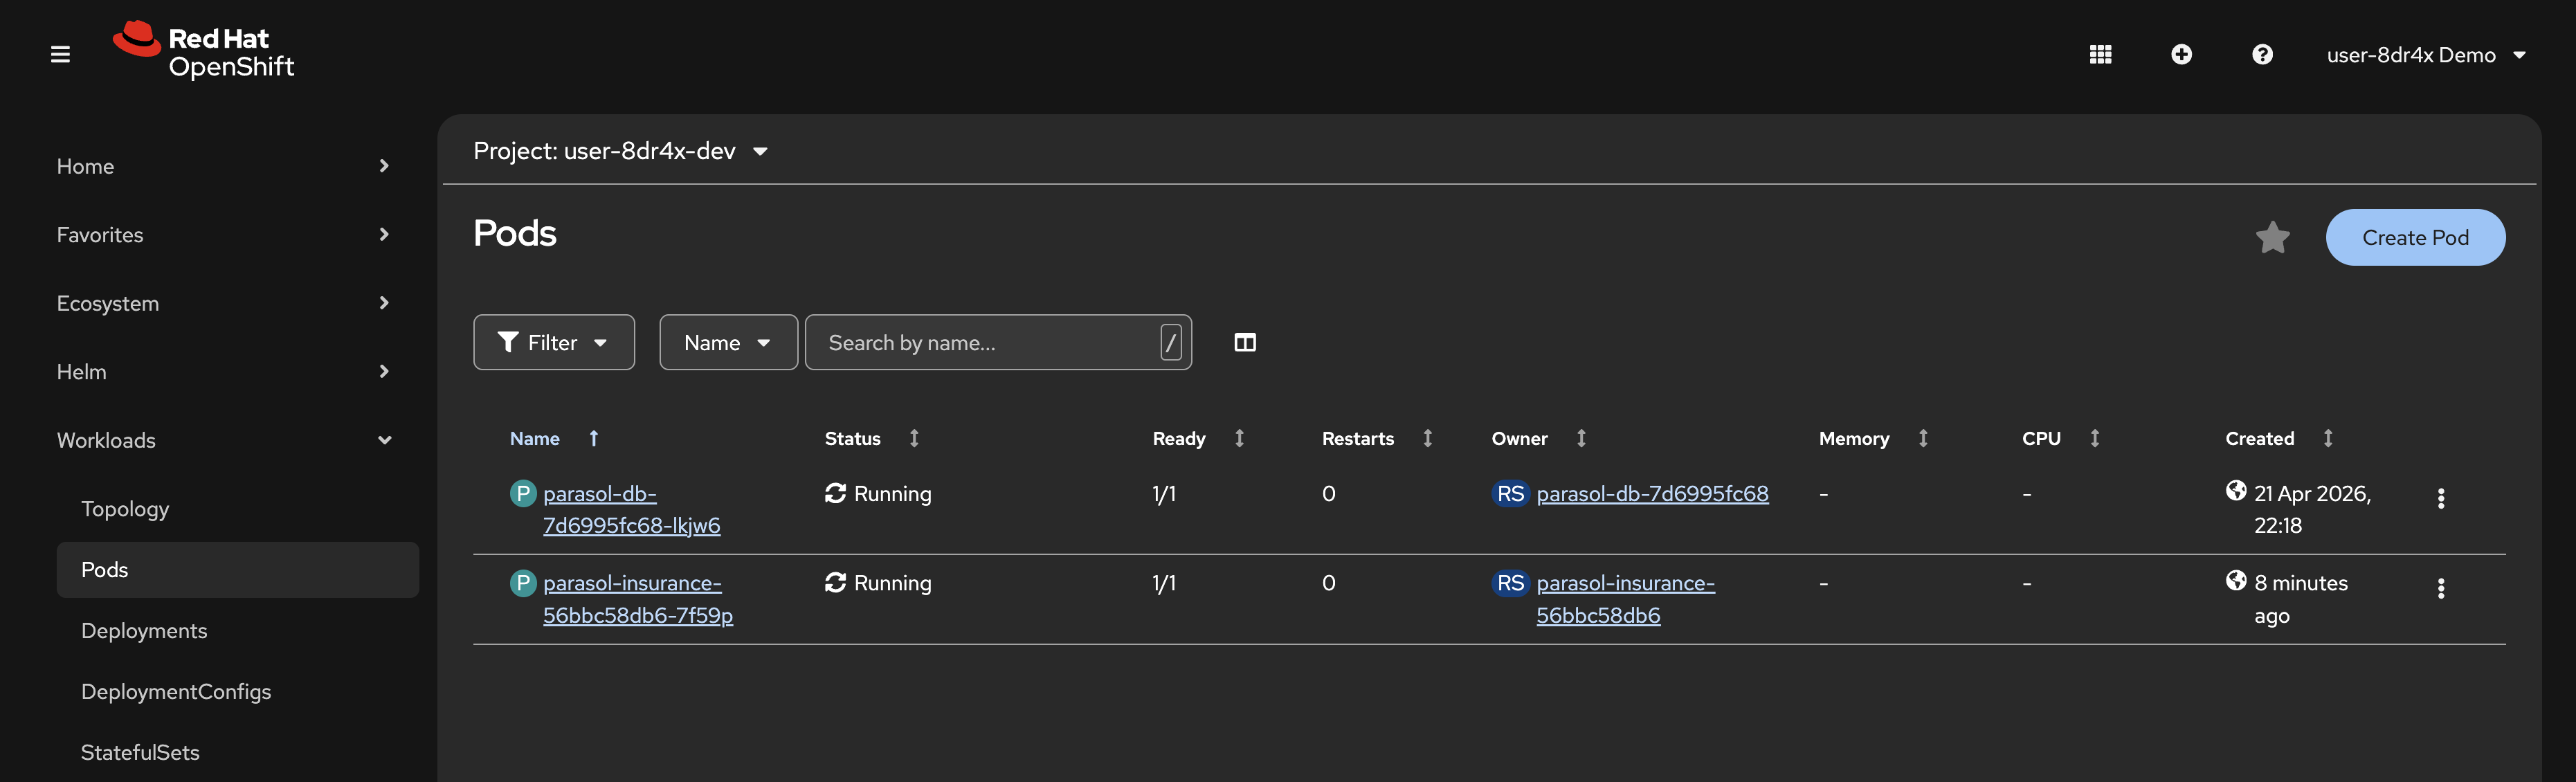 Figure 19. New pod after pipeline rollout
 -
Select Networking > Routes from the left menu and click on the URL in the Location column.
-
Navigate to the Inbox page and confirm the timestamps now display in the locale format with AM/PM
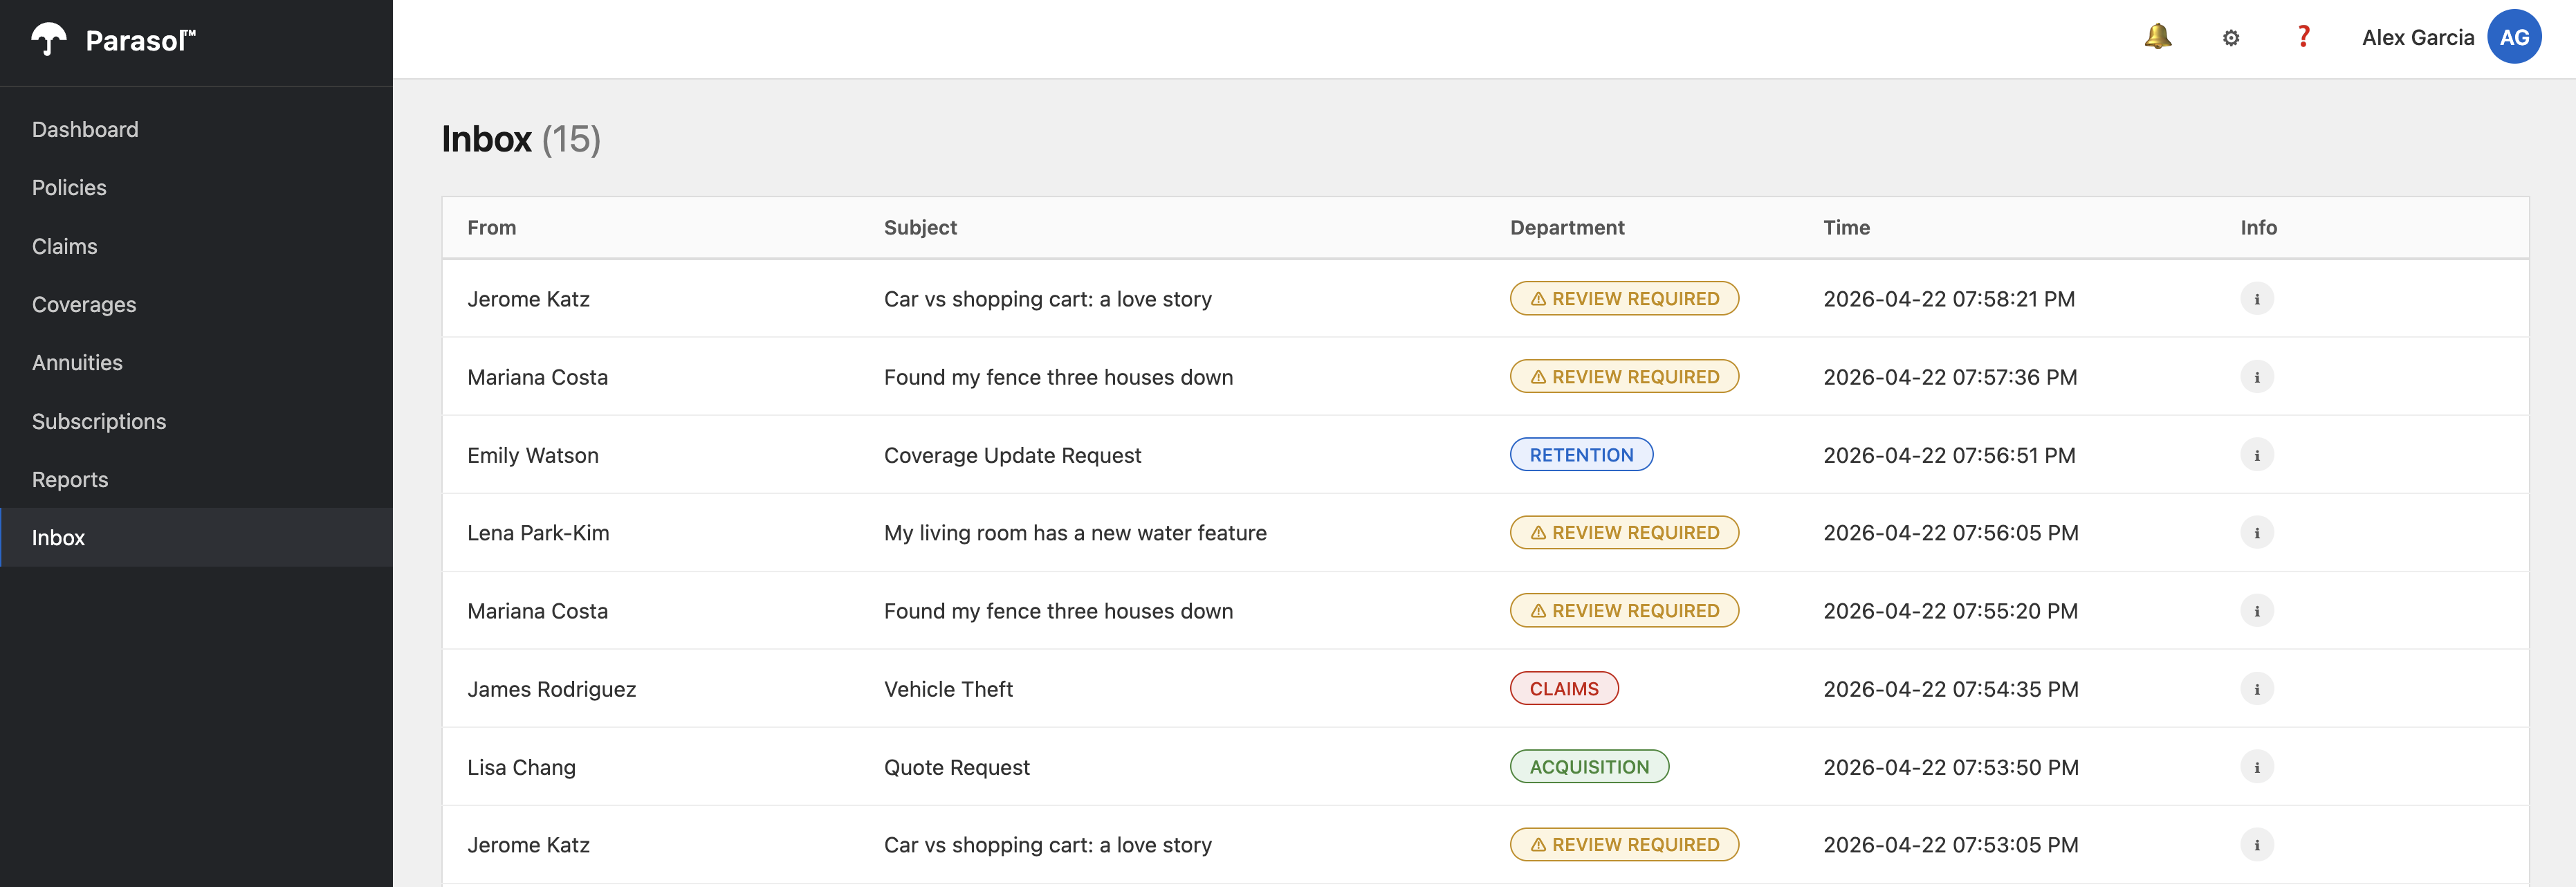 Figure 20. Deployed application showing AM/PM timestamps
Learning outcomes
By completing this module, you should now understand:
-
How OpenShift Dev Spaces provides a zero-install cloud development environment with pre-configured tools and extensions
-
How devfiles standardize development environments so every developer gets the same setup
-
How AI coding assistants like Continue can help developers explore unfamiliar codebases and implement features
-
How Quarkus dev mode with nested containers enables a full local-like development experience on the cluster
-
How a git push triggers an automated CI/CD pipeline that builds, tests, scans, and deploys your application
-
How SonarQube quality gates integrate into the pipeline to enforce code quality standards
Module summary
You have launched a cloud development environment, used an AI coding assistant, and pushed a feature through an automated CI/CD pipeline.
What you accomplished:
-
Launched a Dev Spaces workspace from the OpenShift Topology view
-
Explored the IDE, extensions, and devfile configuration
-
Used the Continue AI coding assistant to understand and modify code
-
Ran the Quarkus application in dev mode with Testcontainers
-
Changed the inbox timestamp format to use AM/PM
-
Committed and pushed code that triggered a Tekton pipeline
-
Reviewed a SonarQube quality report
-
Verified the deployment in the dev namespace
Next steps:
In Module 3 you will replace the keyword-based email classifier with an LLM-powered classification service and promote it to production.