Telegraf, Kafka, and YANG
Our goal will be to have our routers self-report when something is wrong, so that Ansible can fix it, as we simulated in the last section.
We’ll need to install some software to help us bridge the gap between the routers and Ansible, and we’ll need to find out some information about the data we need to do this.
Ultimately, we are looking to establish this stack of components:
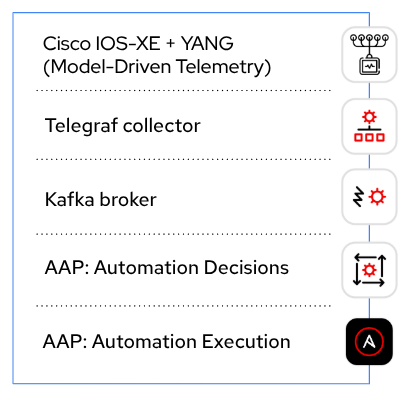
Telegraf and Kafka
Telegraf is an open-source metrics collection tool from InfluxData. We will be using it to collect telemetry messages from our routers and send it to Kafka.
Kafka is an open-source event streaming platform from Apache. We will be using it as a broker to get event data between Telegraf and Event-Driven Ansible.
We will be using a Validated Content Collection to make these tools available to us.
|
Ansible validated content is a new set of collections containing pre-built YAML content (such as playbooks or roles) to address the most common automation use cases. You can use Ansible validated content out-of-the-box or as a learning opportunity to develop your skills. It’s a trusted starting point to bootstrap your automation: use it, customize it, and learn from it. Source and more info: Red Hat Customer Portal |
Specifically, we’ll be using the validated network.telemetry collection to install a Telegraf/Kafka stack in containers, that will translate the telemetry messages coming from the Cisco device and make them consumable by Event-Driven Ansible.
The playbook to do this has been provided for you. In your student workbench, inside the playbooks directory, click on install_telemetry_stack.yml and take a look at what it does. You can see that it’s using a single role, network.telemetry.run, with a couple variables specifying what we want the role to do.
This is a major reason to check out Validated Content - in this situation, we have an easy way to do something complex (in this case, deploy two applications, which will communicate with each other, in containers).
Go ahead and run this playbook.
ansible-navigator run playbooks/install_telemetry_stack.yml| Expect this playbook to take about a minute to complete. When it finishes, there will be a popup about an application running on port 8089, which can be safely closed. |
Observing the output, we can see that we’ve deployed something in Docker. Let’s look at what’s running:
sudo docker psYou should get output that looks like this:
CONTAINER ID   IMAGE                             COMMAND                  CREATED          STATUS          PORTS                                                                         NAMES
a16e056d6d15   telegraf:latest                   "/entrypoint.sh -con…"   17 seconds ago   Up 17 seconds   8092/udp, 8125/udp, 8094/tcp, 0.0.0.0:8089->57000/tcp, [::]:8089->57000/tcp   telegraf
bd3888848d03   confluentinc/cp-kafka:7.3.2       "/etc/confluent/dock…"   7 minutes ago    Up 7 minutes    0.0.0.0:9092->9092/tcp, [::]:9092->9092/tcp                                   broker
6ab3f6677c82   confluentinc/cp-zookeeper:7.3.2   "/etc/confluent/dock…"   7 minutes ago    Up 7 minutes    2181/tcp, 2888/tcp, 3888/tcp                                                  zookeeper
On the line for Telegraf, we can see 0.0.0.0:8089→57000/tcp which means that we have port 57000 inside the Telegraf container mapped to port 8089 outside of the container.
| The use of port 8089 is specific to this lab environment. Ordinarily you would use port 57000 inside and outside of the container. |
Similarly, on the line for Kafka we can see 0.0.0.0:9092→9092/tcp which means that we have port 9092 inside the Kafka container mapped to the same port 9092 outside of the container.
The network.telemetry.run role also added some Telegraf configuration that we can look at. In your terminal, run the following:
sudo cat /home/ec2-user/telegraf/telegraf.confTelegraf’s job here is to take inputs in one format and output them in another, so that’s what we’re going to be looking for in the configuration file.
In particular, observe this section:
[[inputs.cisco_telemetry_mdt]]
transport = "grpc"
service_address = ":57000"
Telegraf comes with an input plugin that understands Cisco telemetry messages and it’s listening on port 57000, which we know from the Docker output is port 8089 on the outside.
We can also look at this section:
[outputs.kafka]
# URLs of kafka brokers
brokers = ["broker:29092"]
topic = "eda"
data_format = "json"
Again from the Docker output we know that we can access Kafka on port 9092 from the outside, but we also see here that Telegraf will use a different port (29092) to output to it. We can ignore that detail in this situation; what’s important is we know that the telemetry messages received by Telegraf will be outputted to Kafka on a topic called eda.
Let’s verify that Kafka is up and we can connect to it. In your terminal, run:
sudo docker exec -it broker kafka-console-consumer --bootstrap-server localhost:9092 --topic edaYou should get some warnings like:
[2025-03-05 22:54:56,148] WARN [Consumer clientId=console-consumer, groupId=console-consumer-14849] Error while fetching metadata with correlation id 2 : {eda=LEADER_NOT_AVAILABLE} (org.apache.kafka.clients.NetworkClient)The LEADER_NOT_AVAILABLE message means that no messages have been received on this topic, but we are successfully talking to Kafka regardless, which is what we expect at this stage. Press CTRL+C to exit out of the Kafka listener for now.
YANG models
Since that Tunnel0 interface looked important earlier, we will make it our goal to have our routers report whenever it’s configured to be down.
We’re going to want to configure our routers for Model-Driven Telemetry in order to send this data to Telegraf, but we don’t yet know the location of the data we need. We can use Ansible to figure that out, using the certified ansible.yang collection to query YANG models on our lab router.
|
Yet Another Next-Generation (YANG) was defined in RFC 6020 and has been updated in RFC 7950. The YANG data modeling language was developed by IETF to enable the reuse of data models across equipment from different network vendors. It is widely used by network operators to automate the configuration and monitoring of network devices and define the capabilities of the API. Source and more info: Cisco Model-Driven Telemetry Whitepaper |
First, we need to enable YANG, as well as NETCONF (the protocol we need to use to be able to interact with YANG). We can do that with Ansible.
In your file explorer, under playbooks, open configure_ios_yang.yml.
Looking at what this playbook does, we can see there’s a task that sets netconf-yang in the router configuration, and that’s all that is needed. The second task waits for YANG to become available, which takes about a minute.
Run the playbook:
ansible-navigator run playbooks/configure_ios_yang.yml| The second task is only in the playbook as a convenience to ensure the next step runs successfully. You can move on while it runs, if you wish. |
Next, in your file explorer, under playbooks, take a look at the playbook yang_info.yml.
This playbook targets rtr1 and has two tasks.
-
The first task pulls down a list of all YANG models that the target device says it can support.
-
The second task searches that list for a term supplied in the variable
search_for. That variable’s value is set to "interface". Therefore, what you should see when you run this playbook, is a list of YANG models supported byrtr1that are related to configuring or monitoring interfaces.
Go ahead and run it (once the previous playbook is done running).
ansible-navigator run playbooks/yang_info.ymlThe output should look like:
[student@ansible-1 telemetry]$ ansible-navigator run playbooks/yang_info.yml

PLAY [Identify YANG modules] *******************************************************************************************************************

TASK [Fetch YANG info] *******************************************************************************************************************
ok: [rtr1]

TASK [Show supported modules] *******************************************************************************************************************
ok: [rtr1] => {
    "yang_info.supported_yang_modules | select('search', search_for, ignorecase=true)": [
        "Cisco-IOS-XE-interface-common",
        "Cisco-IOS-XE-interfaces",
        "Cisco-IOS-XE-interfaces-oper",
        "Cisco-IOS-XE-yang-interfaces-cfg",
        "Cisco-IOS-XE-yang-interfaces-oper",
        "cisco-xe-openconfig-interfaces-deviation",
        "cisco-xe-openconfig-interfaces-ext",
        "ietf-interfaces",
        "ietf-interfaces-ext",
        "openconfig-interfaces",
        "openconfig-ospfv2-area-interface",
        "openconfig-pf-interfaces"
    ]
}

PLAY RECAP *******************************************************************************************************************
rtr1                       : ok=2    changed=0    unreachable=0    failed=0    skipped=0    rescued=0    ignored=0
YANG can be used for both operational data as well as configuration data. We see both kinds of results in this output. For our telemetry purposes, we want YANG modules with "oper" in the name. It looks like Cisco-IOS-XE-interfaces-oper is what we want. We can take a note of that and move on.
Now that we have the name of the module we want to work with, we need to determine where in the module the data we want is. Since YANG modules are expressed in an XML tree format, what we’re looking for now will be an "xpath" (short for XML path).
In your file explorer, under playbooks, take a look at the playbook yang_fetch.yml.
Like before, this playbook targets rtr1 and has two tasks.
-
The first task downloads the YANG file for the model specified in the
modelvariable. You can see that’s set to "Cisco-IOS-XE-interfaces-oper" which we just determined using the previous playbook. The model file will be stored locally for you to work with. -
The second task reads the model file downloaded by the first task and produces a tree schema, which we can read more easily than the model file itself.
|
You may also notice that both of these playbooks override the |
Let’s run the playbook.
ansible-navigator run playbooks/yang_fetch.ymlOnce the playbook finishes, you should now have a yang_files directory that has been created under playbooks. Find this in your file explorer on the left and expand it. You should see some .yang files and a .tree file inside.
| You may need to widen the file explorer pane to be able to see the file extensions. |
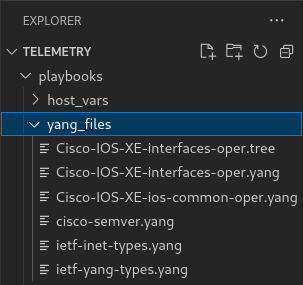
Click on Cisco-IOS-XE-interfaces-oper.yang and look for a line starting with "prefix". On line 4 you should see:
prefix interfaces-ios-xe-oper;
That’s one part of the information we need. For the other part, let’s look in Cisco-IOS-XE-interfaces-oper.tree.
module: Cisco-IOS-XE-interfaces-oper
  +--ro interfaces
     +--ro interface* [name]
        +--ro name                            string
        +--ro interface-type?                 interfaces-ios-xe-oper:ietf-intf-type
        +--ro admin-status?                   interfaces-ios-xe-oper:intf-state
        +--ro oper-status?                    interfaces-ios-xe-oper:oper-state
        +--ro last-change?                    yang:date-and-time
[truncated]
Here we have the data available in the model displayed as a hierarchical tree. We can see that there is a key called interfaces containing some promising-looking data about interface state. We’ll remember the path interfaces.
The other files under yang_files that we didn’t use are dependencies of the one we did use. They were pulled down automatically and can be ignored.
|