Extend the solution
At this point, we have a functioning Event-Driven Ansible environment, fully capable of monitoring for any kind of network condition detectable via YANG. In this section, we’ll apply what we’ve learned to extend our solution for another type of network misconfiguration. This time it will be BGP routing configuration.
YANG prefix and xpath
We’ll start in your VS Code tab. In the file explorer, under playbooks, let’s revisit the playbook yang_info.yml.
The last time we ran this, we had the search_for variable set to "interface" and we picked a module from the list that had "oper" in the name. This time let’s change the value to be "oper", which will show us every operational module available on rtr1.
Line 8 in the playbook should be changed to look like:
search_for: oper| This VS Code environment is auto-saving, so you don’t need to save files you edit before running them. |
Once edited, run the playbook:
ansible-navigator run playbooks/yang_info.ymlThe output should look like:
PLAY [Identify YANG modules] ***********************************************************************************************************************************************************************************************************************

TASK [Fetch YANG info] *****************************************************************************************************************************************************************************************************************************
ok: [rtr1]

TASK [Show supported modules] **********************************************************************************************************************************************************************************************************************
ok: [rtr1] => {
    "yang_info.supported_yang_modules | select('search', search_for, ignorecase=true)": [
        "Cisco-IOS-XE-aaa-oper",
        "Cisco-IOS-XE-acl-oper",
        "Cisco-IOS-XE-app-hosting-oper",
        "Cisco-IOS-XE-arp-oper",
        "Cisco-IOS-XE-bfd-oper",
        "Cisco-IOS-XE-bgp-common-oper",
        "Cisco-IOS-XE-bgp-oper",
        "Cisco-IOS-XE-bgp-route-oper",
        "Cisco-IOS-XE-cdp-oper",
[truncated]
There are a few BGP-related modules showing up in the list but let’s go with the simplest option, Cisco-IOS-XE-bgp-oper.
As before, we’ll note this information and move onto finding an xpath.
Let’s now revisit the playbook yang_fetch.yml.
The last time we ran this, we had the model variable set to "Cisco-IOS-XE-interfaces-oper". This time let’s change it to "Cisco-IOS-XE-bgp-oper".
Line 8 in the playbook should be changed to look like:
model: Cisco-IOS-XE-bgp-operOnce edited, run the playbook:
ansible-navigator run playbooks/yang_fetch.ymlThe playbook will again create some files in playbooks/yang_files. We now have a couple new files, including Cisco-IOS-XE-bgp-oper.yang and Cisco-IOS-XE-bgp-oper.tree.
Click on Cisco-IOS-XE-bgp-oper.yang and as before, look for a line starting with "prefix". On line 4 you should see:
prefix bgp-ios-xe-oper;
Our prefix will be bgp-ios-xe-oper.
Next, let’s look in Cisco-IOS-XE-bgp-oper.tree, which looks like:
module: Cisco-IOS-XE-bgp-oper
  +--ro bgp-state-data
     +--ro neighbors
     |  +--ro neighbor* [afi-safi vrf-name neighbor-id]
     |     +--ro afi-safi                       bgp-common-ios-xe-oper:afi-safi
     |     +--ro vrf-name                       string
     |     +--ro neighbor-id                    string
     |     +--ro description?                   string
     |     +--ro bgp-version?                   uint16
     |     +--ro link?                          bgp-ios-xe-oper:bgp-link
     |     +--ro up-time?                       string
     |     +--ro last-write?                    string
     |     +--ro last-read?                     string
     |     +--ro installed-prefixes?            uint32
     |     +--ro session-state?                 bgp-ios-xe-oper:bgp-fsm-state
[truncated]
We can see that under bgp-state-data is a key called neighbors, and under that is a key called neighbor, and under that is some promising-looking data about BGP state.
We’ll remember the xpath bgp-state-data/neighbors.
Configuring and testing telemetry
In your student workbench, under playbooks, let’s revisit the playbook configure_ios_telemetry.yml.
The last time we ran this, we had the telemetry_nodes variable set like the following:
    telemetry_nodes:
      - prefix: interfaces-ios-xe-oper
        xpath: interfaces
This is a list structure, so let’s add an item to the list for the new xpath we just found. This will preserve the existing interface monitoring, and add BGP as a second subscription.
Lines 8-12 in the playbook should be changed to look like:
    telemetry_nodes:
      - prefix: interfaces-ios-xe-oper
        xpath: interfaces
      - prefix: bgp-ios-xe-oper
        xpath: bgp-state-data/neighbors
Be careful with the spacing. It should look exactly like the above block, with the - characters aligned. You may want to copy the whole block and paste it over the existing lines 8-10.
|
Once edited, run the playbook:
ansible-navigator run playbooks/configure_ios_telemetry.ymlExpected output:
[student@ansible-1 telemetry]$ ansible-navigator run playbooks/configure_ios_telemetry.yml

PLAY [Configure IOS telemetry] ******************************************************

TASK [Enable YANG] ******************************************************************
ok: [rtr2]
ok: [rtr1]

TASK [Set subscription] *************************************************************
ok: [rtr1] => (item={'prefix': 'interfaces-ios-xe-oper', 'xpath': 'interfaces'})
ok: [rtr2] => (item={'prefix': 'interfaces-ios-xe-oper', 'xpath': 'interfaces'})
changed: [rtr2] => (item={'prefix': 'bgp-ios-xe-oper', 'xpath': 'bgp-state-data/neighbors'})
changed: [rtr1] => (item={'prefix': 'bgp-ios-xe-oper', 'xpath': 'bgp-state-data/neighbors'})

PLAY RECAP **************************************************************************
rtr1                       : ok=2    changed=1    unreachable=0    failed=0    skipped=0    rescued=0    ignored=0
rtr2                       : ok=2    changed=1    unreachable=0    failed=0    skipped=0    rescued=0    ignored=0
We can see that the only lines reporting changed are related to BGP, since the interface monitoring was alrady applied.
In your terminal, ssh to rtr1.
ssh rtr1First, we’ll verify that the telemetry configuration is looking good:
show running-config | section telemetryYou should see both subscriptions:
-
Subscription 1 using xpath
/interfaces-ios-xe-oper:interfaces -
Subscription 2 using xpath
/bgp-ios-xe-oper:bgp-state-data/neighbors
Next, ensure that the router sees the new subscription as valid:
show telemetry ietf subscription 2Expected output:
ID         Type       State      State Description
2          Configured Valid      Subscription validated
Exit the SSH session.
exitNow in your terminal, we want to validate that BGP-related messages are appearing. We will run the Kafka monitor while filtering for BGP messages:
sudo docker exec -it broker kafka-console-consumer --bootstrap-server localhost:9092 --topic eda | jq 'select(.name | contains("bgp"))' | tee bgp.jsonYou may have to wait up to 30 seconds for the next message to appear. As soon as it does, you can press CTRL+C a few times to end the monitoring.
You’ll have a new file called bgp.json visible in your file explorer. Open it to see the whole Kafka message.
As before, the data here matches what can be found in the Cisco-IOS-XE-bgp-oper.tree file from earlier.
|
We’ll need to choose something in this message to use to detect a bad BGP state. Nested under the fields key, there is a connection/state key set to established. So, let’s make a note that our condition for the rulebook, indicating bad status, will be for fields['connection/state'] to be anything other than "established".
Event-Driven Ansible on the command line
In your student workbench, open the file rulebooks/routing_status_cli.yml.
This file should look familiar. You can open the rulebook we used earlier, rulebooks/interface_status_cli.yml, and see that the two files are very similar.
This new rulebook has one change, which is the addition of another rule under the rules block. The action in the new rule is also the same, since the playbook we’ve been using applies both interface and BGP configurations.
The intent is that we will run this rulebook instead of the one we were using earlier, since it represents a more complete coverage of our routing configuration, and the source (Kafka topic "eda") is identical.
Let’s run it to test. You should still have a second terminal from the last time we ran ansible-rulebook. Switch to it using the navigation on the right side of the terminal. In this terminal, run the following command:
ansible-rulebook --rulebook rulebooks/routing_status_cli.yml -i inventoryAs before, no output from the ansible-rulebook command is expected whenever there are no matching conditions.
Switch back to your original terminal and connect to rtr1.
ssh rtr1Let’s check on the current BGP state.
show ip bgp summaryExample output:
rtr1#show ip bgp summary
BGP router identifier 192.168.1.1, local AS number 65000
[...]

Neighbor        V           AS MsgRcvd MsgSent   TblVer  InQ OutQ Up/Down  State/PfxRcd
10.200.200.2    4        65001     332     331        8    0    0 04:58:18        4
This looks good, and we want to pay attention to the very last bit of data in the bottom right, State/PfxRcd. The 4 that we see now is normal in this environment.
We want to run some commands to intentionally break BGP, by giving rtr1 the wrong AS number for its neighbor (65009 instead of 65001).
configure terminal
router bgp 65000
neighbor 10.200.200.2 remote-as 65009
end
Check the BGP summary again and we should see bad things happening to our BGP state (note the incorrect AS number and state being listed as Closing or Idle)
show ip bgp summaryOutput:
Neighbor        V           AS MsgRcvd MsgSent   TblVer  InQ OutQ Up/Down  State/PfxRcd
10.200.200.2    4        65009       0       0        1    0    0 00:00:06 Idle
Now swap back to your ansible-rulebook (python3) terminal. You should see the playbook run.
| It’s possible to get unlucky timing here. If you don’t catch the playbook kicking off, or the BGP state is not what you expect, the telemetry message may have fired right after you issued your command. |
Example output:
[student@ansible-1 telemetry]$ ansible-rulebook --rulebook rulebooks/routing_status_cli.yml -i inventory

PLAY [Configure IOS Routing] ***************************************************

TASK [Apply interfaces config] *************************************************
ok: [rtr1]

TASK [Apply BGP Global config] *************************************************
changed: [rtr1]

PLAY RECAP *********************************************************************
rtr1                       : ok=2    changed=1    unreachable=0    failed=0    skipped=0    rescued=0    ignored=0
Notice that the second task of the playbook reported "changed" this time instead of the first.
Press CTRL+C to stop ansible-rulebook.
Event-Driven Ansible in AAP
Most of the AAP elements are already set up from previous exercises. All we need to do is swap the old rulebook out for the new one.
Switch to your AAP tab. You may need to log in again.
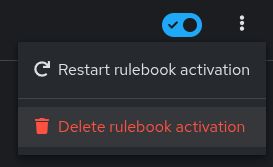
In the left side navigation, go to Automation Decisions > Rulebook Activations. Your "Interface status" activation from earlier should still be running. On the far right side, click the 3 dots and select "Delete rulebook activation".
Confirm that you want to delete the activation by checking the box next to "Interface status" and clicking the "Delete rulebook activations" button. Click the Close button on the dialog that follows.
Now we will re-make the Rulebook Activation. Click on the blue "Create rulebook activation" button. On the page that follows, fill out the form with the following information:
Name |
Routing status |
Organization |
Default |
Project |
Cisco Telemetry |
Rulebook |
routing_status_aap.yml |
Credential |
Automation Controller |
Decision environment |
Lab DE |
Wait for the Activation to start (Activation status should say "Running"), then click on the History tab. Note that you have an entry titled "2 - Routing status" which, as before, means EDA is up and listening for events.
In the left side navigation, go to Automation Execution > Jobs. For now, there is nothing new here. The last run of "Router configuration" at the top of the list is the one from earlier that fixed the shutdown interface.
We are now set up to test that the new expanded rulebook is working. Switch back to the VS Code workbench and SSH to rtr1.
ssh rtr1We’ll break BGP again.
configure terminal
router bgp 65000
neighbor 10.200.200.2 remote-as 65009
end
Once these commands have been issued, switch back to your AAP tab. Look for another instance of "Router configuration" to kick off (you may again be waiting a few seconds). Once it does, click on it to monitor the progress.
You should see:
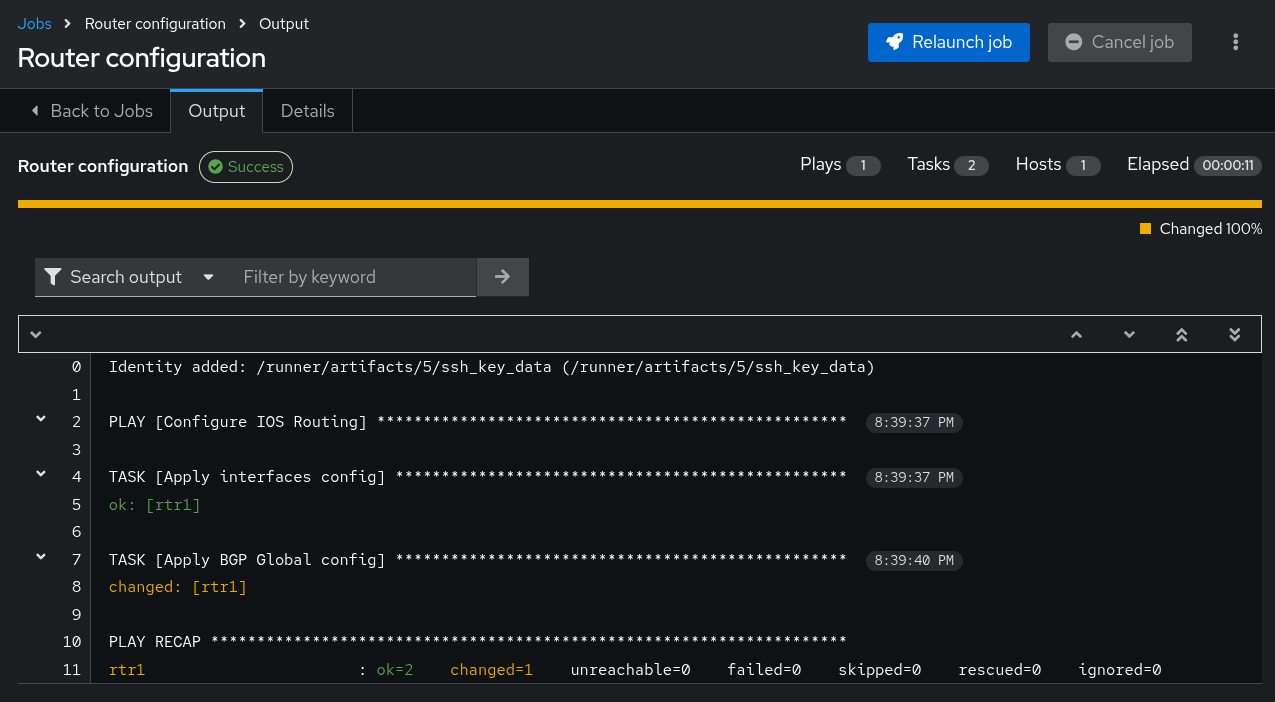
This matches what we saw on the CLI, so our new BGP monitoring is working correctly. Let’s also test that the interface monitoring is still working.
In the left side navigation, go to Automation Execution > Jobs so that we are set up again to watch for new jobs. Then, switch back to your VS Code tab. You should still be in the SSH session with rtr1. Run the commands we previously used to shutdown Tunnel0:
configure terminal
interface Tunnel0
shutdown
end
Switch back to your AAP tab and watch for a new instance of "Router configuration" to kick off. Once it does, click on it to monitor the progress.
You should see:
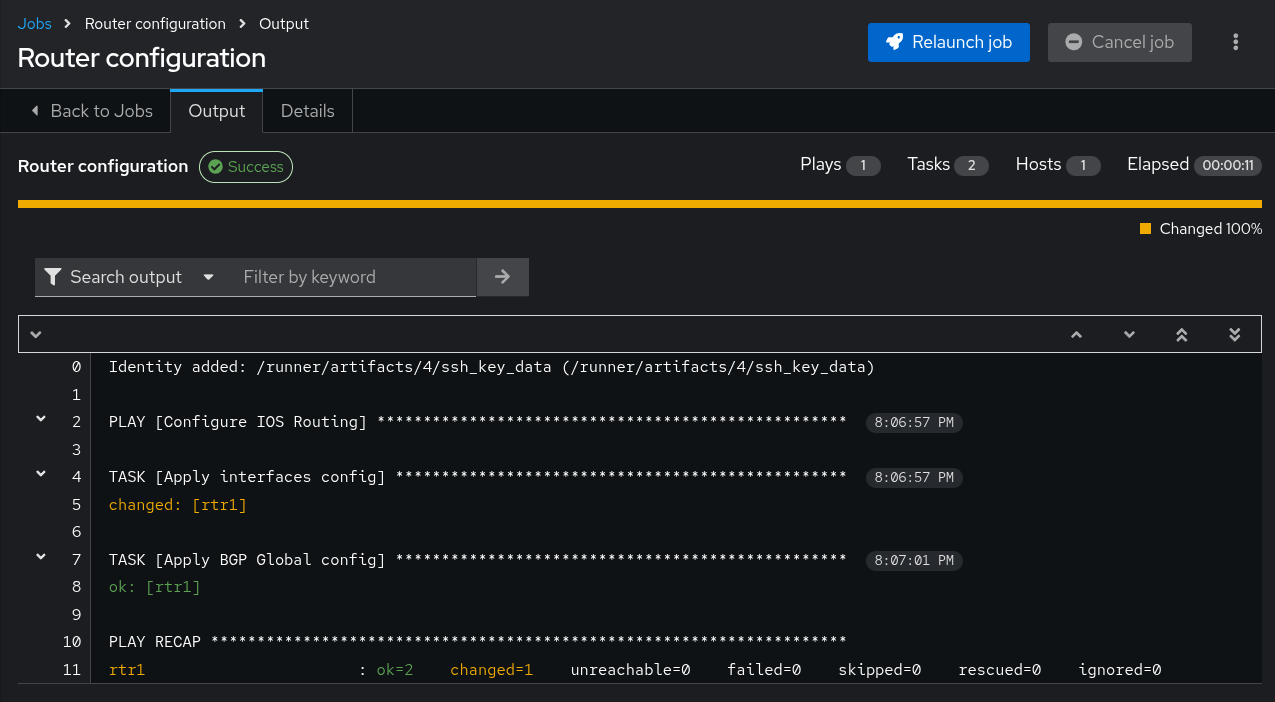
This is the same as what we were seeing before, so that is working as expected.
If desired, repeat any of these tests by breaking configurations on rtr2 instead of rtr1.
You now have both misconfiguration conditions being handled in AAP. And, you have the tools you need to extend this even further.