Section 1.2 - Remediation Workflow
Objective
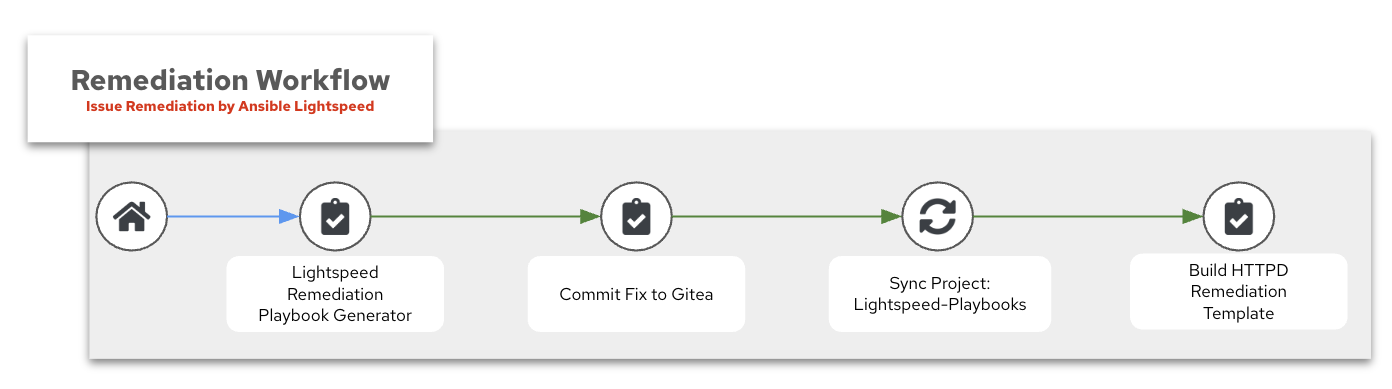
For this section, we will build another workflow called the Remediation Workflow. The goal for this workflow is to take the information we learned from Section 1 with Red Hat AI and now prompt Automation coding assistant to automatically create an Ansible Playbook to fix the issue. By combining these two workflows, we can create an AIOps workflow capable of self-healing infrastructure.
By separating these two parts into distinct workflows, we allow for manual review of the response from Red Hat AI and can take corrective action if necessary. This creates a natural stopping point in our automation workflow where we can ensure the automation is performing as expected.
⚠️ Before we get started you need to make sure you have run the first workflow.
⚠️ Reminder that the way we purposely broke httpd with the ❌ Break Apache Job Template was by inserting InvalidDirectiveHere into the configuration file and restarting the service. This crashed the httpd service as you can see by running the systemctl status httpd.service Linux command.
Learning Objectives
After completing this module, you will be able to:
-
Build a remediation workflow using AI-generated prompts
-
Use Automation coding assistant to automatically generate remediation playbooks
-
Commit AI-generated playbooks to source control (Gitea)
-
Review and validate AI-generated automation code before execution
-
Execute automated remediation to fix service failures
Verify webserver failure
-
Connect to your bastion host either via SSH or Visual Studio Code. The connection information is provided by your instructor.
-
SSH over to node1
[lab-user@bastion ~]$ sudo ssh node1
Last login: Tue Apr  8 15:56:41 2025 from 192.168.0.37
[ec2-user@node1 ~]$-
Verify httpd is down with the systemctl status httpd.service command
[ec2-user@node1 ~]$ sudo systemctl status httpd.service
× httpd.service - The Apache HTTP Server
     Loaded: loaded (/usr/lib/systemd/system/httpd.service; disabled; preset: disabled)
     Active: failed (Result: exit-code) since Tue 2025-04-08 15:56:15 UTC; 1h 11min ago
   Duration: 1min 9.506s
       Docs: man:httpd.service(8)
    Process: 4099 ExecStart=/usr/sbin/httpd $OPTIONS -DFOREGROUND (code=exited, status=1/FAILURE)
   Main PID: 4099 (code=exited, status=1/FAILURE)
     Status: "Reading configuration..."
        CPU: 58ms

Apr 08 15:56:15 node1.example.com systemd[1]: Starting The Apache HTTP Server...
Apr 08 15:56:15 node1.example.com httpd[4099]: AH00526: Syntax error on line 35 of /etc/httpd/conf/httpd.conf:
Apr 08 15:56:15 node1.example.com httpd[4099]: Invalid command 'InvalidDirectiveHere', perhaps misspelled or defined by a module not included in the server configuration
Apr 08 15:56:15 node1.example.com systemd[1]: httpd.service: Main process exited, code=exited, status=1/FAILURE
Apr 08 15:56:15 node1.example.com systemd[1]: httpd.service: Failed with result 'exit-code'.
Apr 08 15:56:15 node1.example.com systemd[1]: Failed to start The Apache HTTP Server.
[ec2-user@node1 ~]$
As you can see in the above output, the httpd.service has failed.
Create Remediation Workflow
-
Log in to the web UI for Ansible Automation Platform if you are not already logged in.
-
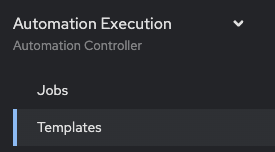
In the left navigation menu, click on Automation Execution → Templates.
-
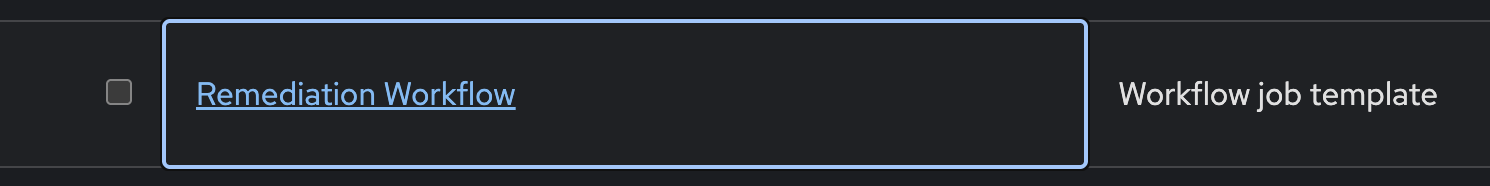
Navigate to the Templates page and select the Remediation Workflow Workflow job template
💡 The last workflow (specifically the job template Build Ansible Lightspeed Job Template) used the ansible.controller.workflow_job_template module to automatically create this blank workflow. We could have Ansible automatically create the entire workflow but we want to illustrate each part and what it is doing. The most important part is that Ansible automatically created a survey with output from Red Hat AI. You will see this called out below when we run the workflow. Ask your instructor if you need clarification.
-
Click on the blue View workflow visualizer button

-
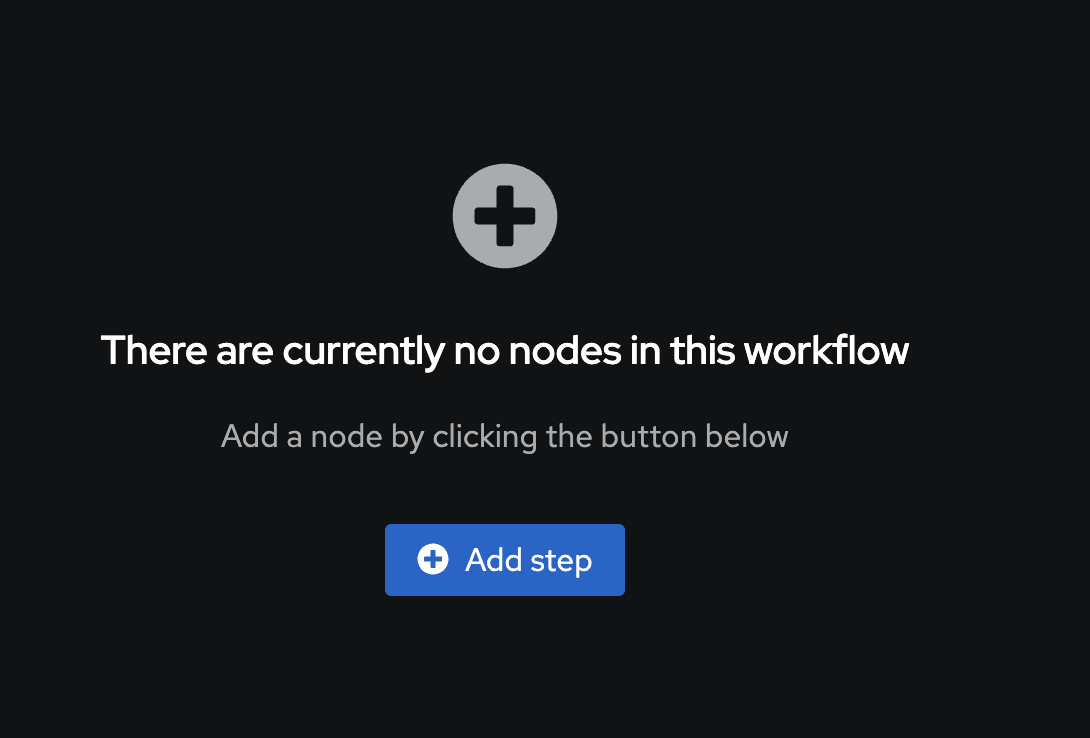
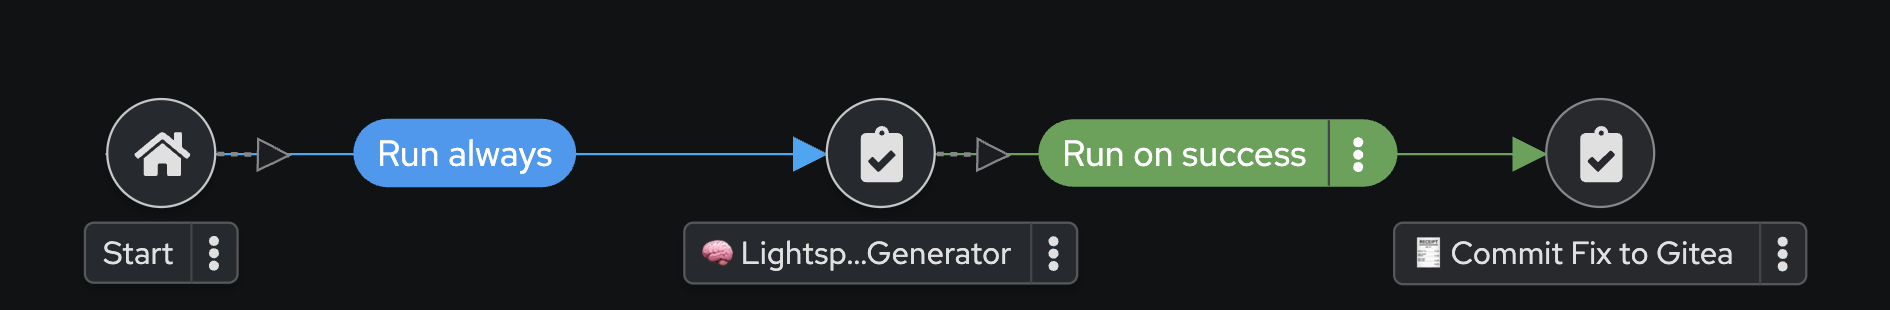
Verify you have a window that looks like this:
-
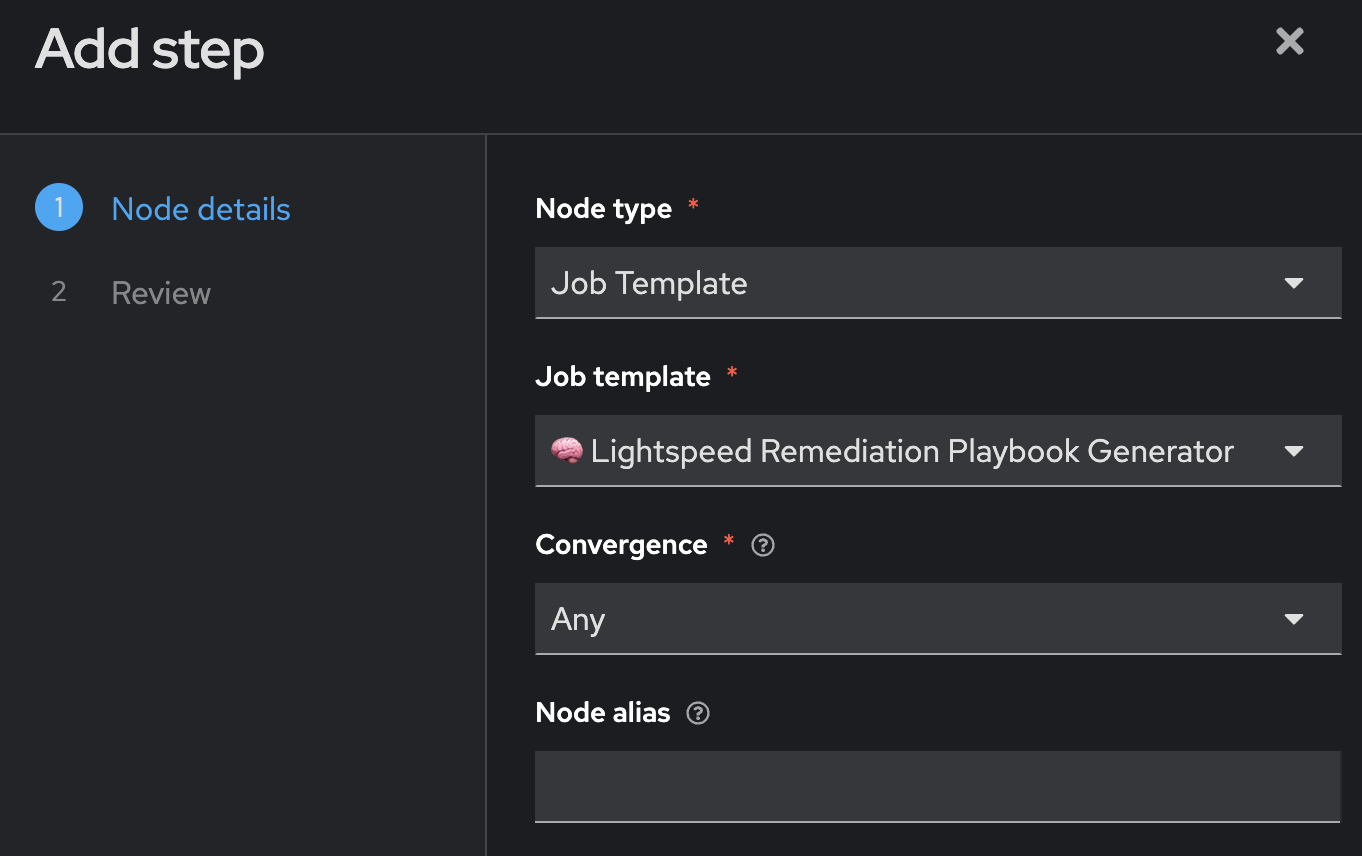
Click on the blue Add step
-
Fill out the following values
| Parameter | Value |
|---|---|
Node type |
Job Template |
Job Template |
🧠 Lightspeed Remediation Playbook Generator |
Convergence |
Any |
Node alias |
(You can leave this blank) |
-
Click on the blue Next.

-
Review and click the blue Finish button.

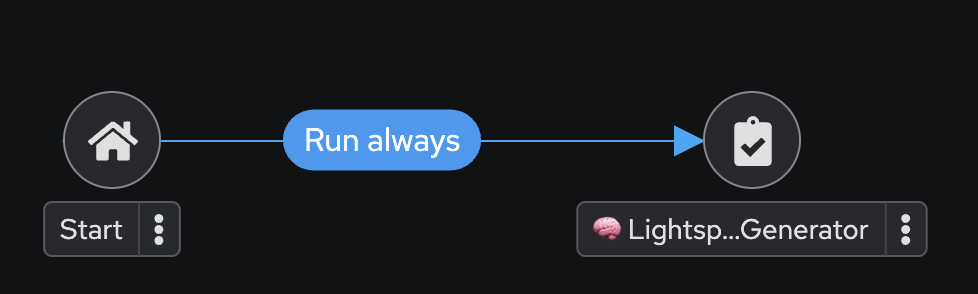
Your workflow will now look like this:
-
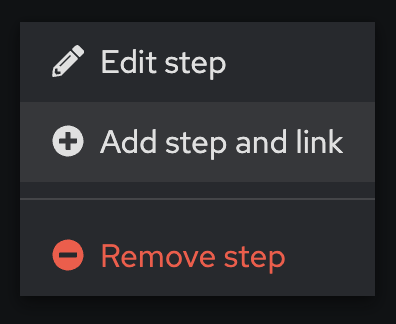
Click on the three dots (kebab menu) next to the 🧠 Lightspeed Remediation Playbook Generator node
-
Click on ⊕ Add step and link
-
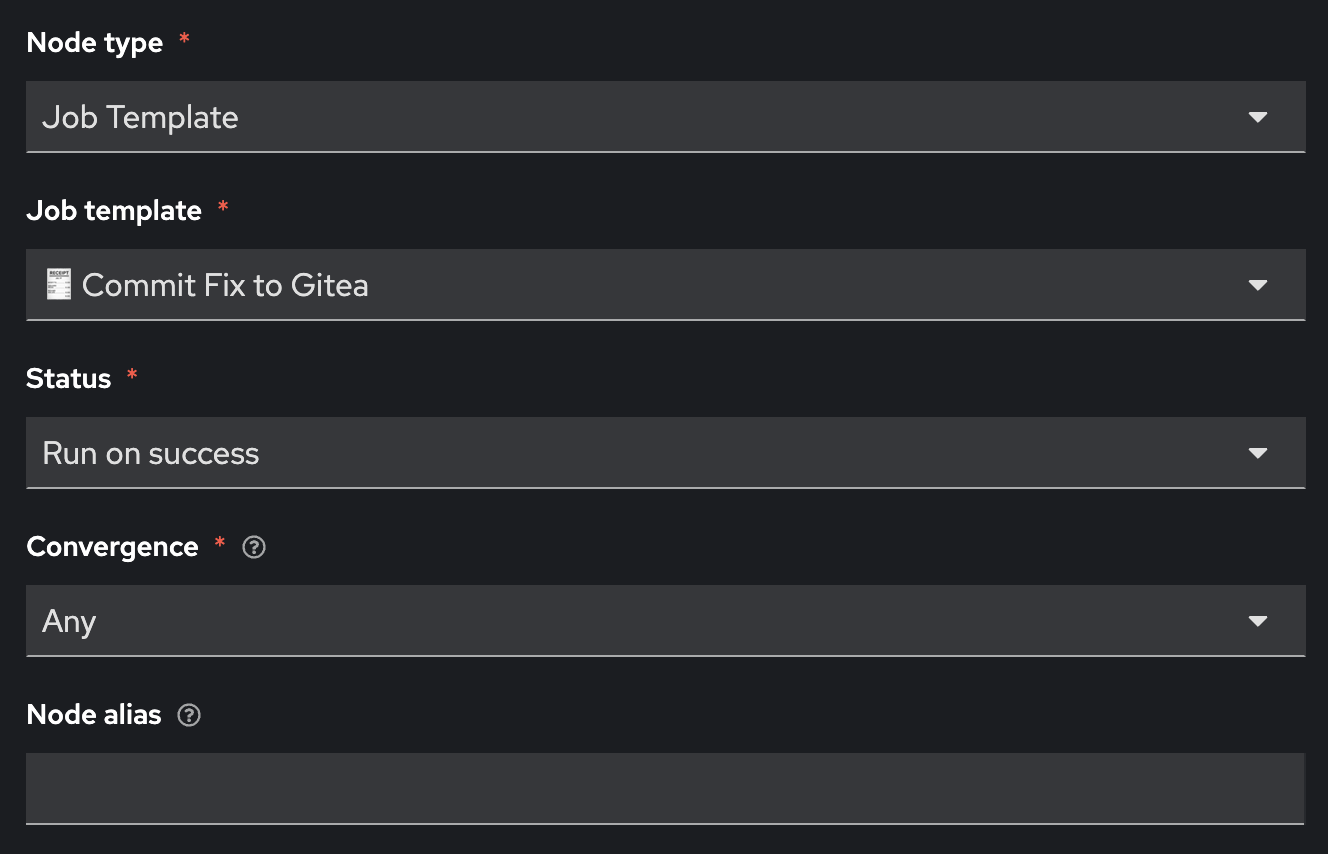
Fill out the following values
| Parameter | Value |
|---|---|
Node type |
Job Template |
Job Template |
🧾 Commit Fix to Gitea |
Status |
Run on success |
Convergence |
Any |
Node alias |
(You can leave this blank) |
-
Click on the blue Next.
-
Review and click the blue Finish button
Your workflow will now look like this:
-
Click on the three dots (kebab menu) next to the 🧾 Commit Fix to Gitea node
16 Click on ⊕ Add step and link
-
Fill out the following values
| Parameter | Value |
|---|---|
Node type |
Project Sync |
Job Template |
Lightspeed-Playbooks |
Status |
Run on success |
Convergence |
Any |
Node alias |
(You can leave this blank) |
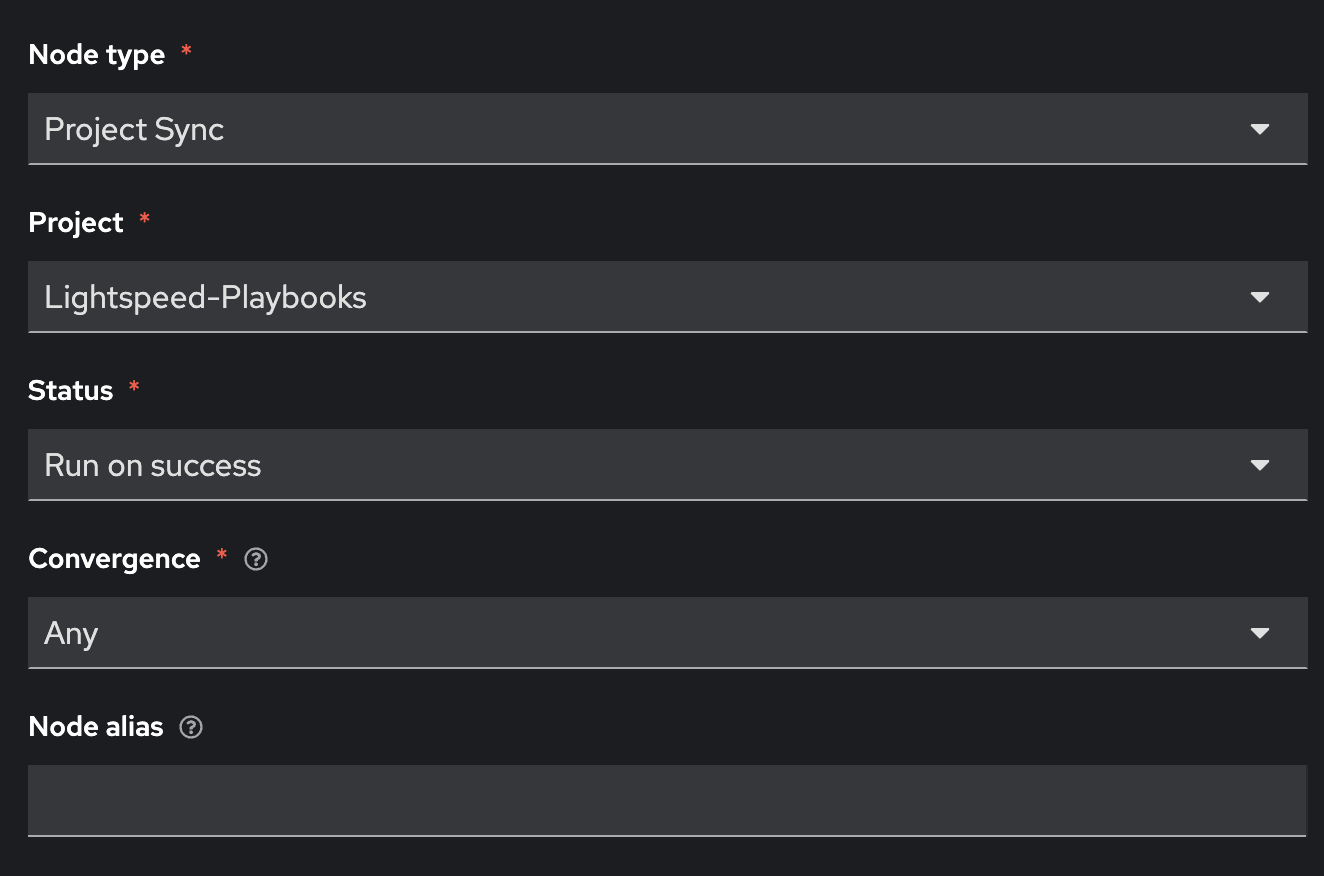
⚠️ Notice this node type is different. This is a built-in node type that will force a Project Sync to the repository that will hold our auto-generated Ansible Playbooks. This is effectively a git pull The previous node: 🧾 Commit Fix to Gitea synced the Ansible Playbook from Automation coding assistant to Gitea, now we are retrieving that playbook from Gitea to use in Ansible Automation Platform.
-
Click on the blue Next.
-
Review and click the blue Finish button.
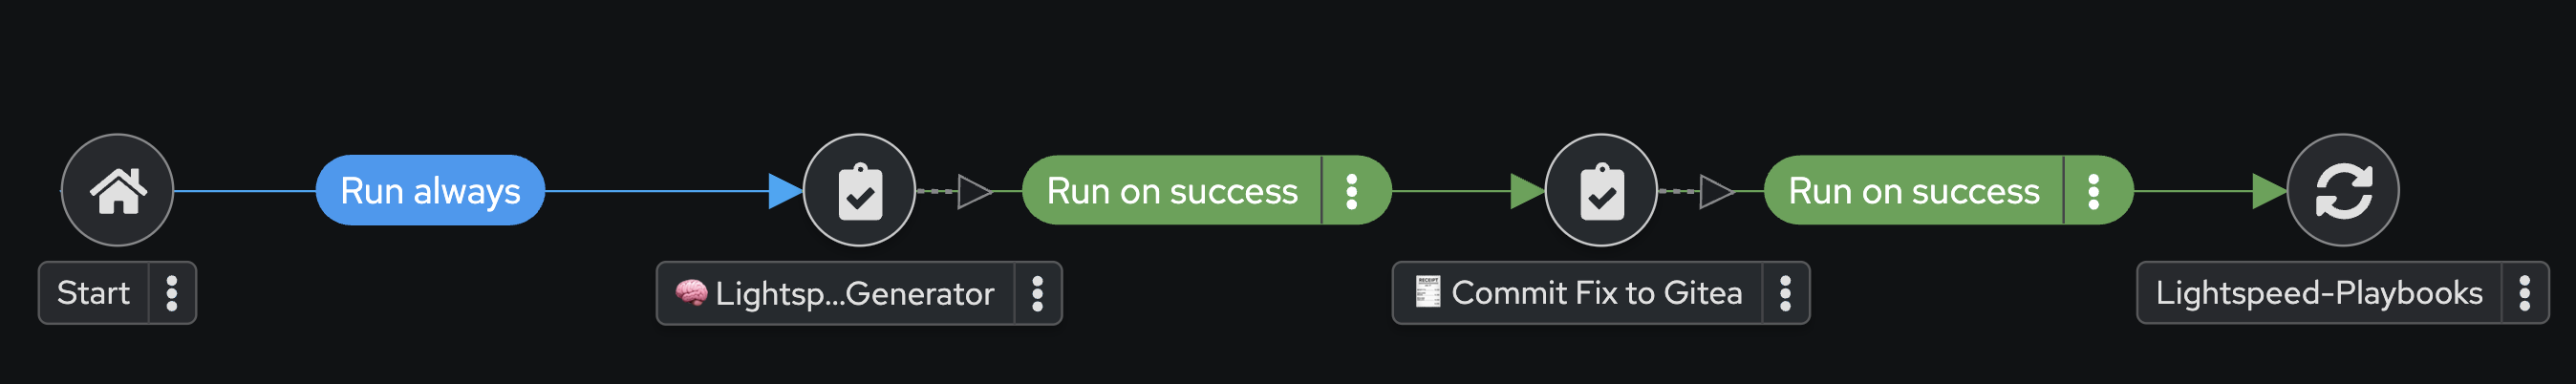
Your workflow will now look like this:
-
Click on the three dots (kebab menu) next to the 🧠 Lightspeed-Playbooks node
-
Click on ⊕ Add step and link
-
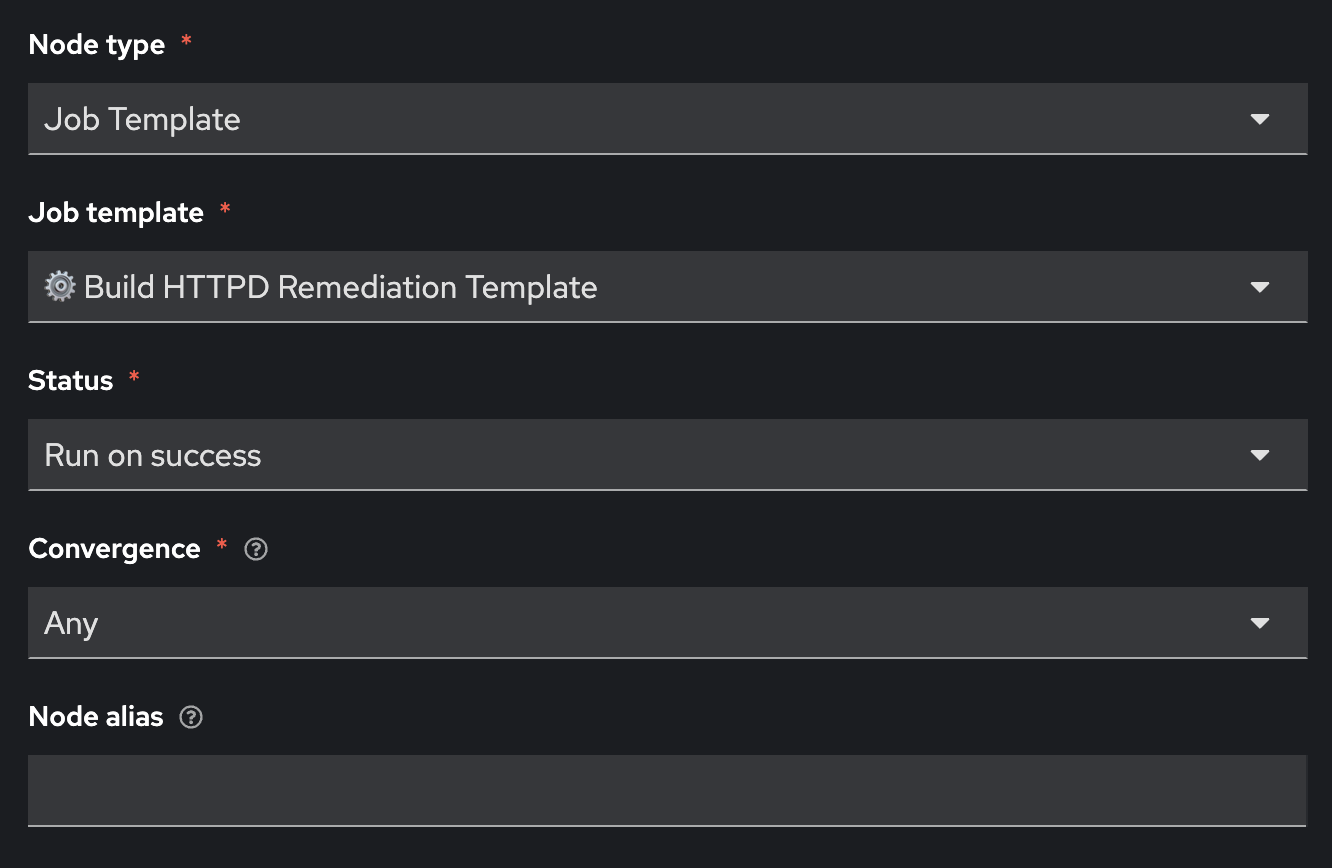
Fill out the following values
| Parameter | Value |
|---|---|
Node type |
Job Template |
Job Template |
⚙️ Build HTTPD Remediation Template |
Status |
Run on success |
Convergence |
Any |
Node alias |
(You can leave this blank) |
-
Click on the blue Next.
-
Review and click the blue Finish button
Your workflow will now look like this:
You are now done creating the workflow!
-
Click on the blue Save button at the top.

Verify workflow structure
Before launching the workflow, confirm it’s built correctly:
✅ Expected result:
-
Workflow named "Remediation Workflow" exists
-
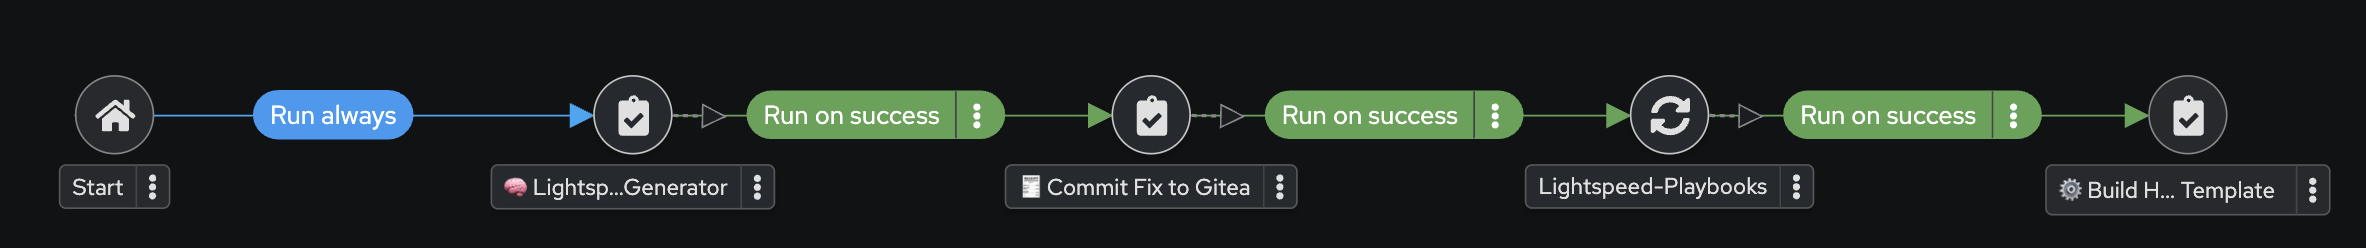
Workflow contains 4 nodes in sequence:
-
🧠 Lightspeed Remediation Playbook Generator
-
🧾 Commit Fix to Gitea
-
Lightspeed-Playbooks (Project Sync)
-
⚙️ Build HTTPD Remediation Template
-
-
All nodes connected with "Run on success"
-
Workflow is saved and ready to execute
-
Exit out of the Workflow Visualizer by clicking the x at the top right
-
Click the 🚀 Launch template button to execute the Remediation Workflow

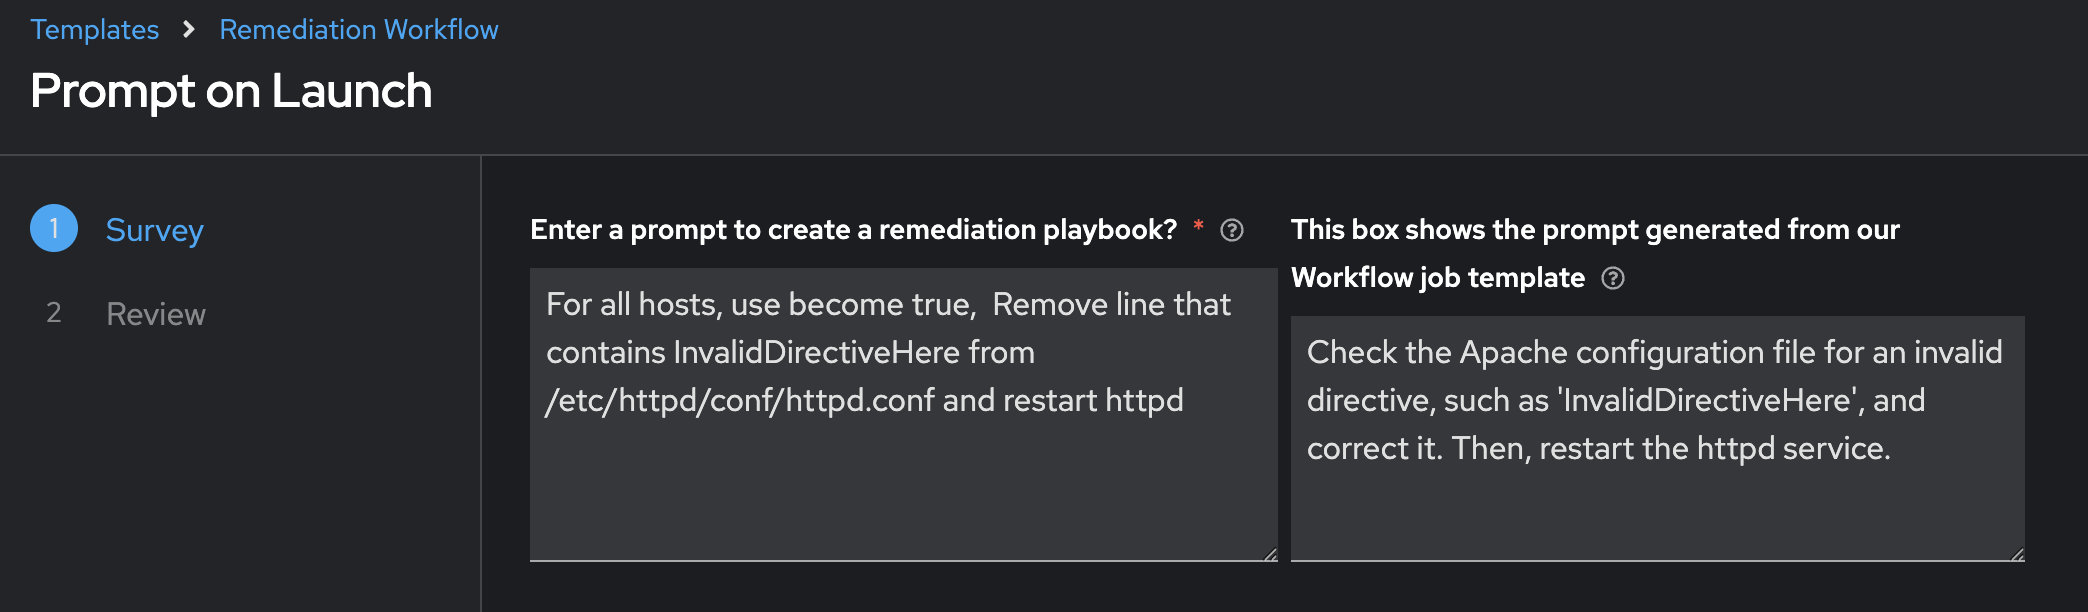
💡 This is the really cool part! A survey prompt will appear with two text boxes side-by-side:
-
Left text box (required field with red asterisk *): This is where you enter the prompt that will be sent to Automation coding assistant to generate the remediation playbook. This field is currently pre-populated with a manually crafted prompt created by the Ansible Tech Marketing team.
-
Right text box (AI-generated suggestion): This contains the prompt that was automatically generated by Red Hat AI during the previous workflow based on its analysis of the Apache failure logs.
You have the flexibility to use either prompt. If you’re satisfied with the AI-generated prompt on the right, you can copy and paste it into the left box to test the AI’s solution. This is the key benefit of separating AIOps into two workflows - it gives you (the administrator) the ability to review and validate AI-generated responses for accuracy before proceeding with automated remediation!
-
Review the AI-generated prompt (right side) and update the required field (left side with the red asterisk *) as needed. Feel free to copy and paste from the right side to the left side.
💡 Why this matters: This step allows you to course-correct any output that AI has provided. You can review what the AI suggests before prompting Automation coding assistant, ensuring the prompt is accurate and appropriate for your environment. This human-in-the-loop validation is a best practice for AI-driven automation.
-
Click on the blue Next.
-
Review and click the blue Finish button.
-
Wait for the workflow to complete
When the workflow completes you will see a green ✅ Success

🎉 You have used Ansible Automation Platform in an AIOps workflow to automatically create an Ansible Job Template to fix your issue. This has created an Ansible Job Template called 🔧✅ Execute HTTPD Remediation. You could also add this to the workflow, but it might be another natural breakpoint where you schedule this job template during an approved change window. For example, some organizations might only want to apply changes to production servers on Sundays at 3AM.
Review the AI-Generated Playbook in Gitea
Before we proceed with executing the final job, let’s take a step back and review what was automatically created for us.
Red Hat AI was able to:
-
Analyze the Apache failure logs collected by Filebeat and forwarded to RHEL AI
-
Generate a root cause explanation for the issue (RCA)
-
Create a concise and relevant prompt based on the RCA
-
Use that prompt to call Automation coding assistant
-
Automation coding assistant generated an Ansible Playbook to fix the issue
-
The playbook was automatically pushed to Gitea in the
lightspeed-playbooksrepository
This showcases a complete AI-driven automation loop — from incident detection to automated remediation content generation — all before a human steps in. Gitea here acts as the version control source of truth, where you can review the generated fix.
Gitea Access Details
Use the following information to log in to Gitea and review the generated playbook:
| Component | Value |
|---|---|
Gitea URL |
|
Username |
|
Password |
|
-
Login using the credentials provided.
-
Navigate to the
lightspeed-playbooksrepository. -
Review the most recent commits — you should see one that corresponds to the AI-generated fix.
💡 You can open the playbook file and inspect the contents. This is your opportunity to validate the AI-generated output before executing it. Just like in production systems, automated changes should be reviewed—either manually or through automated policy enforcement tools.
Pro Tip: If you’re planning to use this in a real-world setup, consider inserting an approval step here or sending the commit as a Pull Request to a staging branch. This way, your remediation workflow includes guardrails for human validation before running automated fixes.
Fix webserver issue
-
In the left navigation menu, click on Automation Execution → Templates.
-
Scroll down to the 🔧✅ Execute HTTPD Remediation job template and click the 🚀 to launch the job.
-
Type in
node1for the Limit
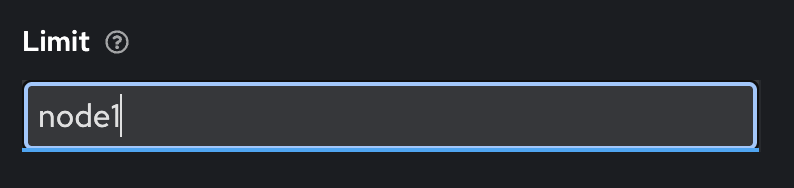
💡 A limit in Ansible Automation Platform is equivalent to--limitwith theansible-playbookcommand. The limit specifies the host or hosts you want to run the Ansible Job on versus the entire inventory, effectively limiting it to only running on those host(s).
-
Click on the blue Next.
5 Review and click the blue Finish button.
Check Success
-
Connect to your bastion host either via SSH or Visual Studio Code. The connection information is provided by your instructor.
-
SSH over to node1
[lab-user@bastion ~]$ sudo ssh node1
Last login: Tue Apr  8 15:56:41 2025 from 192.168.0.37
[ec2-user@node1 ~]$-
Verify httpd is fixed with the systemctl status httpd.service command
[ec2-user@node1 ~]$ sudo systemctl status httpd.service
● httpd.service - The Apache HTTP Server
     Loaded: loaded (/usr/lib/systemd/system/httpd.service; disabled; preset: disabled)
     Active: active (running) since Tue 2025-04-08 17:16:02 UTC; 1min 55s ago
       Docs: man:httpd.service(8)
   Main PID: 6024 (httpd)
     Status: "Total requests: 0; Idle/Busy workers 100/0;Requests/sec: 0; Bytes served/sec:   0 B/sec"
      Tasks: 177 (limit: 48028)
     Memory: 23.5M
        CPU: 193ms
     CGroup: /system.slice/httpd.service
             ├─6024 /usr/sbin/httpd -DFOREGROUND
             ├─6025 /usr/sbin/httpd -DFOREGROUND
             ├─6026 /usr/sbin/httpd -DFOREGROUND
             ├─6027 /usr/sbin/httpd -DFOREGROUND
             └─6028 /usr/sbin/httpd -DFOREGROUND

Apr 08 17:16:02 node1.example.com systemd[1]: Starting The Apache HTTP Server...
Apr 08 17:16:02 node1.example.com httpd[6024]: Server configured, listening on: port 80
Apr 08 17:16:02 node1.example.com systemd[1]: Started The Apache HTTP Server.
[ec2-user@node1 ~]$
If you see (running) above it means httpd has been fixed! You have successfully completed the lab.
Takeaways
You have
-
Created a Workflow template that automatically creates an Ansible Playbook, pushes the Ansible Playbook to Gitea and then automatically creates a Job Template to fix the issue.
-
Fixed the httpd service using the prompt generated by Red Hat AI
-
Completed an AIOps workflow, by utilizing two different AI endpoints
-
Used the limit feature in a Job Template

🎉 Congratulations! You’ve Completed Part 1!
You have successfully completed the basic introduction to AIOps! You’ve experienced firsthand how Red Hat AI, Automation coding assistant, and Ansible Automation Platform can work together to create intelligent, self-healing infrastructure.
⭐ Ready for More? Part 2 Awaits!
|
Highly Recommended! Part 2 takes the AIOps concepts you just learned and applies them to a more complex, real-world networking scenario. While Part 1 provided a basic introduction using Apache service remediation, Part 2 demonstrates the true power of AI-driven automation at scale with network infrastructure. |
In the next modules, you’ll apply everything you’ve learned to a network automation scenario involving:
-
🔍 Splunk for network observability and alerting
-
📡 Event-Driven Ansible responding to OSPF routing issues
-
🧠 Automation coding assistant generating network remediation playbooks
-
🌐 Cisco routers with OSPF configuration challenges
|
Both parts are independent. If you’ve already completed Part 2 or want to skip ahead to the Summary and Call to Actions, you can navigate there directly from the menu. However, we strongly encourage completing Part 2 for a deeper understanding of AIOps capabilities. |