Advanced Networking and Security
Introduction
With the security audit underway, our virtual machine (VM) based application architecture is becoming more distributed, spanning multiple namespaces, projects, and even different cloud environments. Our VMs and new containerized services need to communicate seamlessly, and we need clear visibility and precise control over network traffic, especially as managing both virtual machines and containers increases complexity in ensuring efficient and secure operations. In this section we will introduce how to leverage the Network Observability operator to visualize our network traffic, how to shape and secure our network by implementing Network Policies, and how to automatically segregate our projects and their virtual workloads using UDN.
Configure Network Policies to Manage Cluster Egress
In some secure environments network traffic is not allowed to leave the cluster without first passing through a proxy or some other secure gateway. Likewise, many network configurations allow for cluster egress by default. In this section of the lab we will be configuring a network policy that secures our cluster by blocking egress to outside websites.
Confirm Network Egress on Virtual Machines
-
On the left side navigation menu, click on Virtualization then click VirtualMachines, and select the rhel9-vm1 virtual machine under the vms-aap-day2 project in the center column.
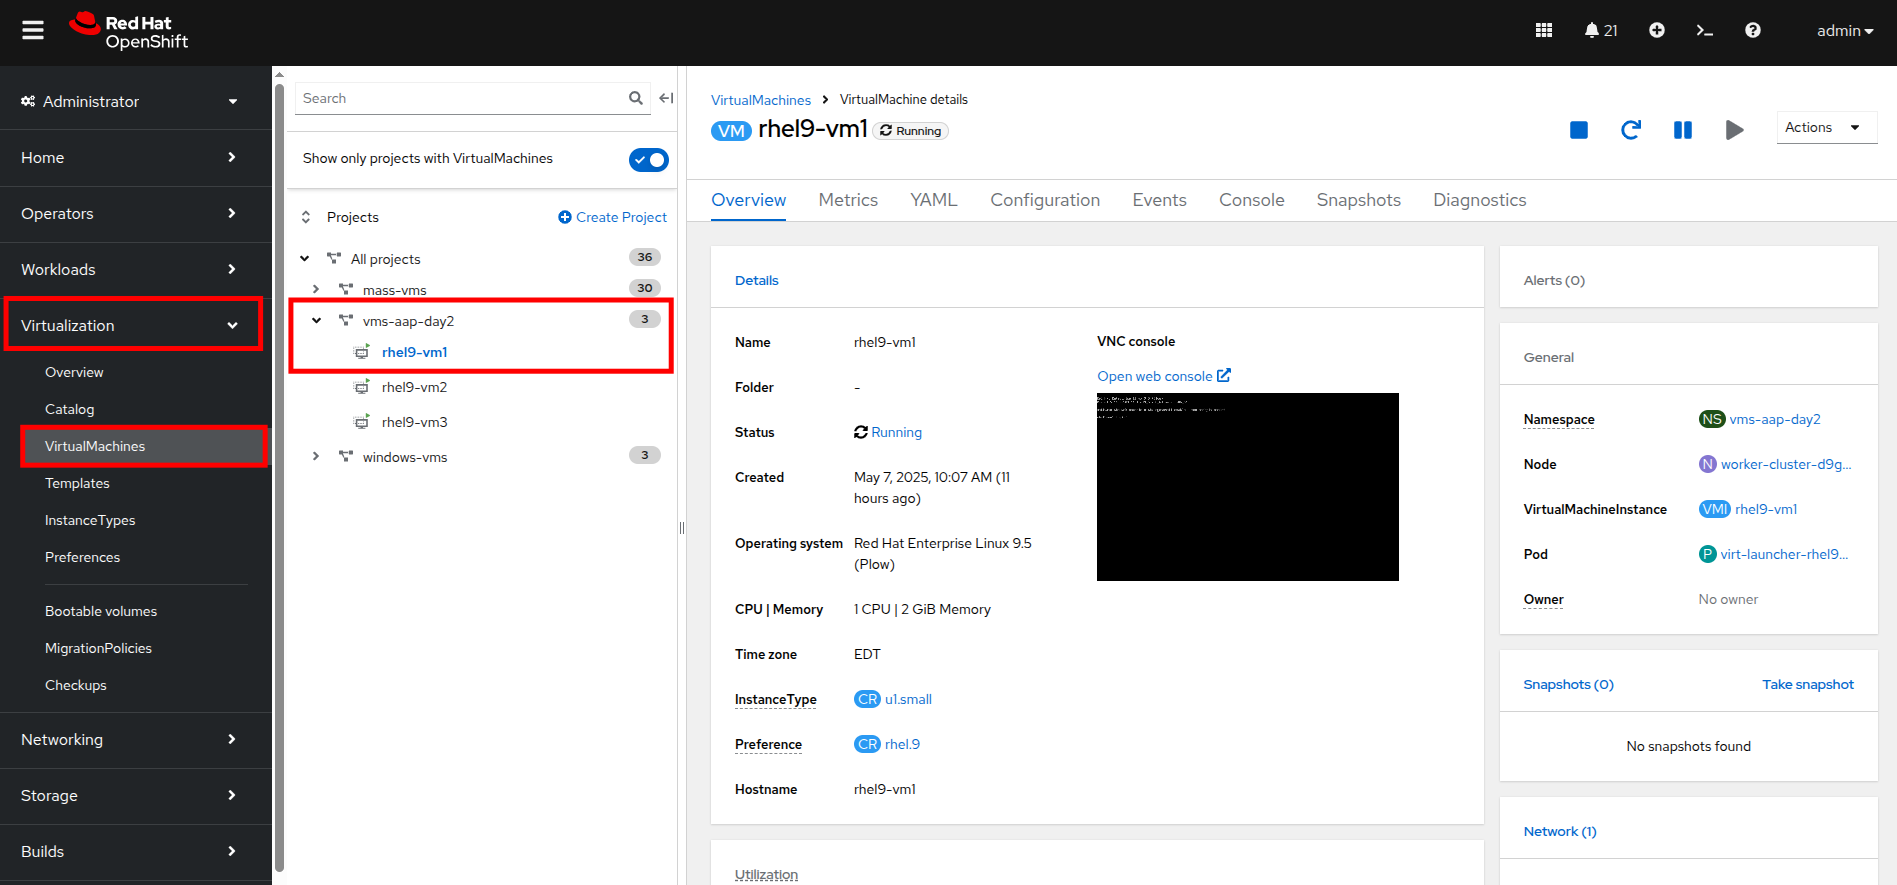 Figure 1. View VM
 -
Click on the Console tab and use the provided credentials, and the built in copy/paste functionality to authenticate to the VM.
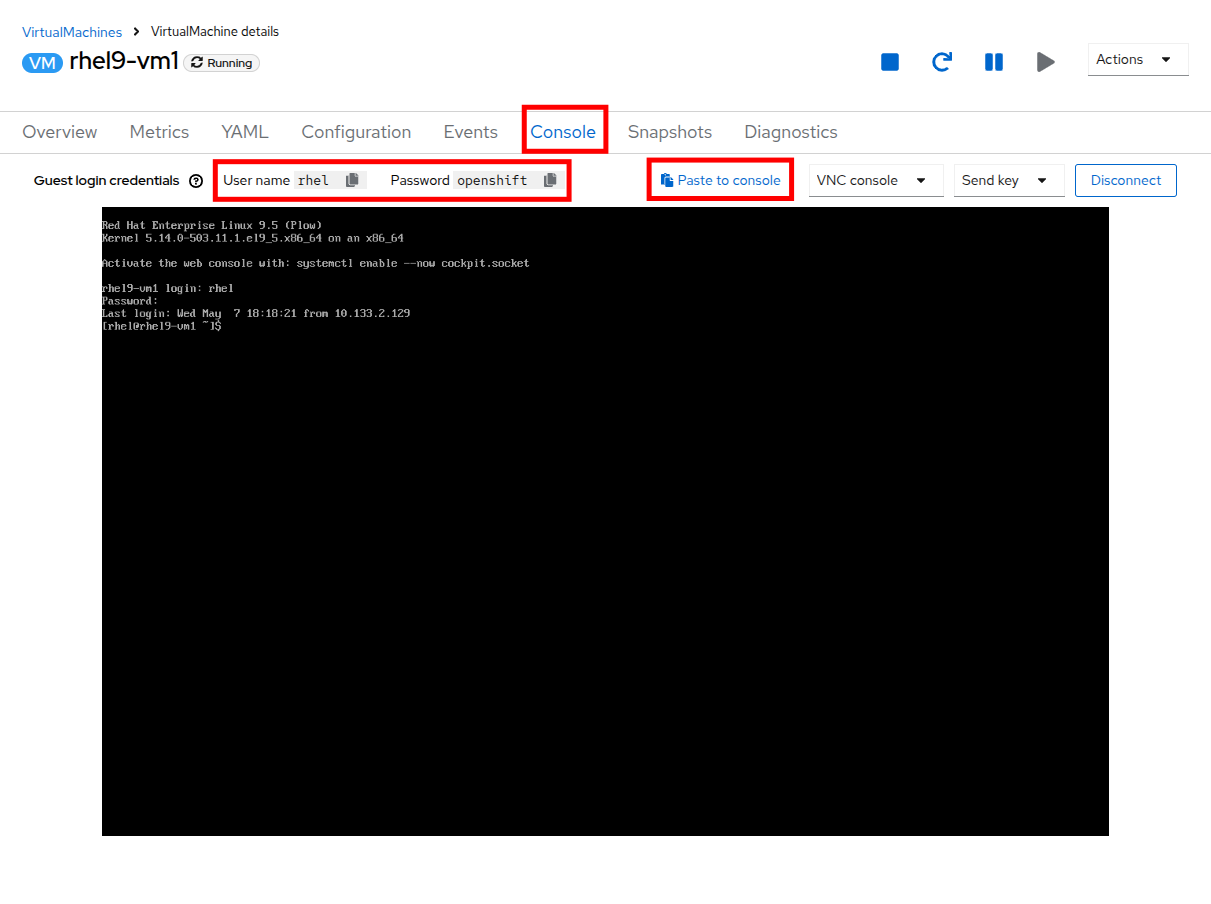 Figure 2. Login to VM
You may see a popup that asks you to enable the copy/paste functionality. If prompted click Allow. -
Once you are logged in, execute the following command to start an outward bound ping to Google:
ping www.google.com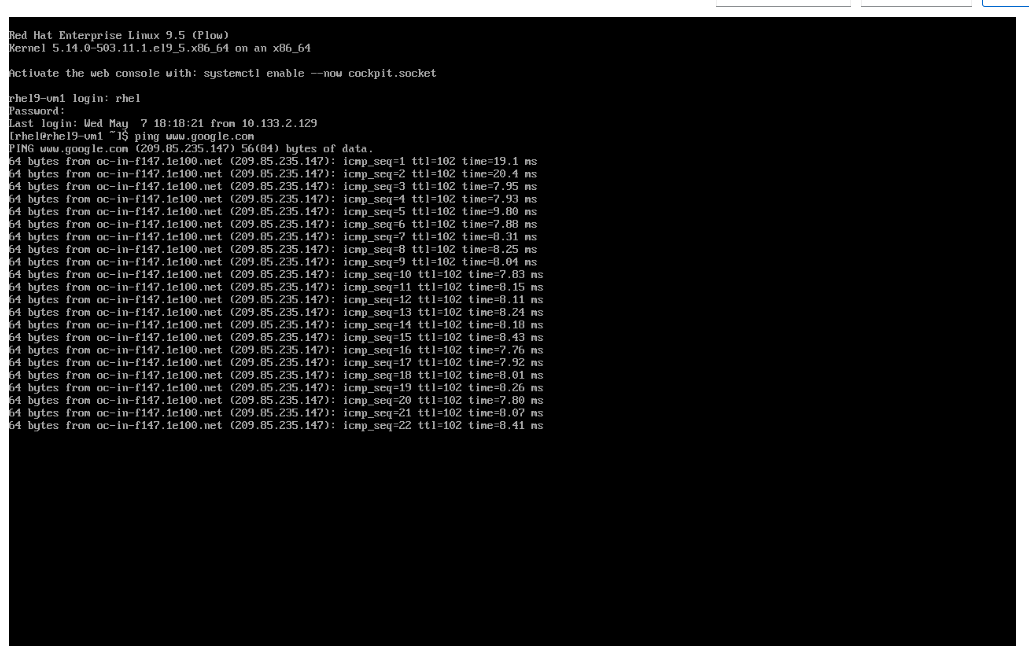 Figure 3. Ping Google
 -
Press Control+C to stop the ping.
-
From the left side navigation menu, click on Workloads and then Pods, and then click on the virt-launcher pod for the one that represents the VM rhel9-vm1 to view the pod details.
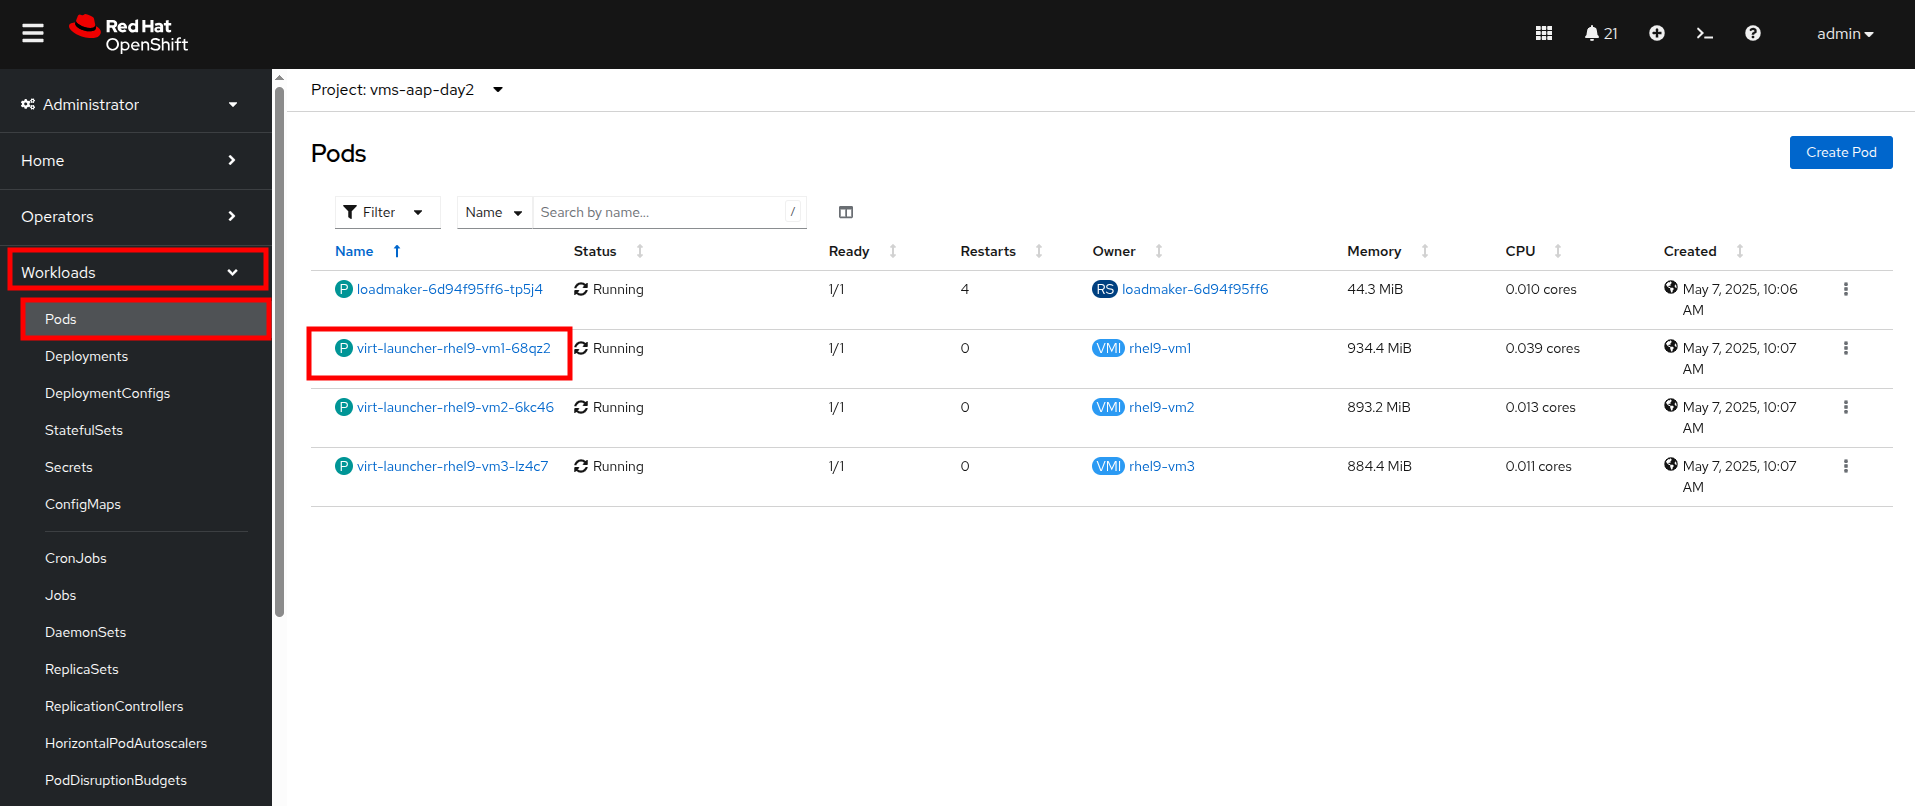 Figure 4. Select Pod
Pod names are randomly generated, so yours will most likely not match the screenshot above. -
On the Pod details page, click the Edit option on the Labels section.
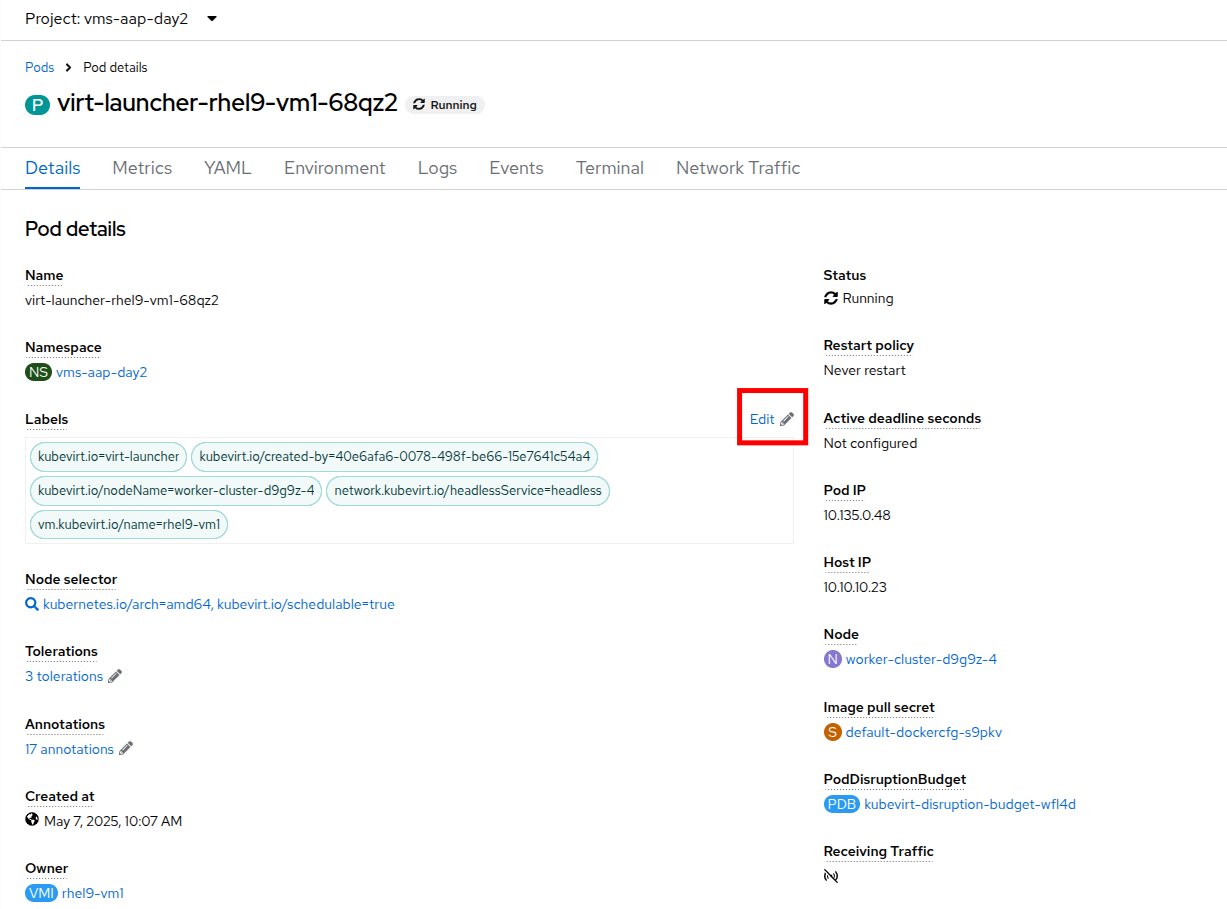 Figure 5. Edit Pod Details
 -
An Edit labels window will appear, you can click into the center box and add a label for
app=network-policy-deny, press the Enter key to commit it, and then click the Save button.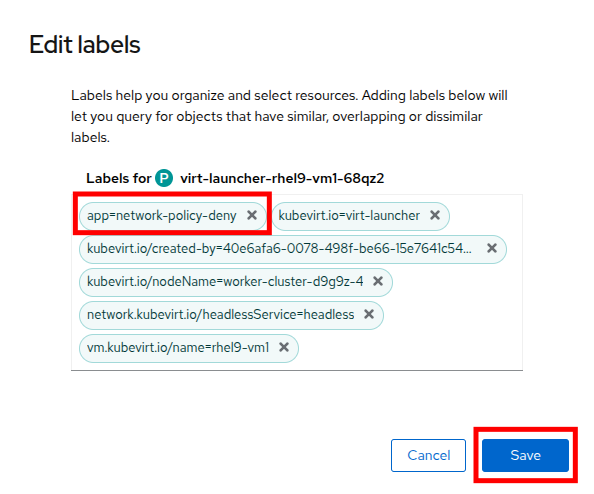 Figure 6. Edit Pod Labels
 -
Repeat the same process for the rhel9-vm2 virtual machine.
Create the Network Policy
-
From the left side navigation menu, click on Networking and then click on NetworkPolicies, then click on the Create NetworkPolicy button in the center of the screen.
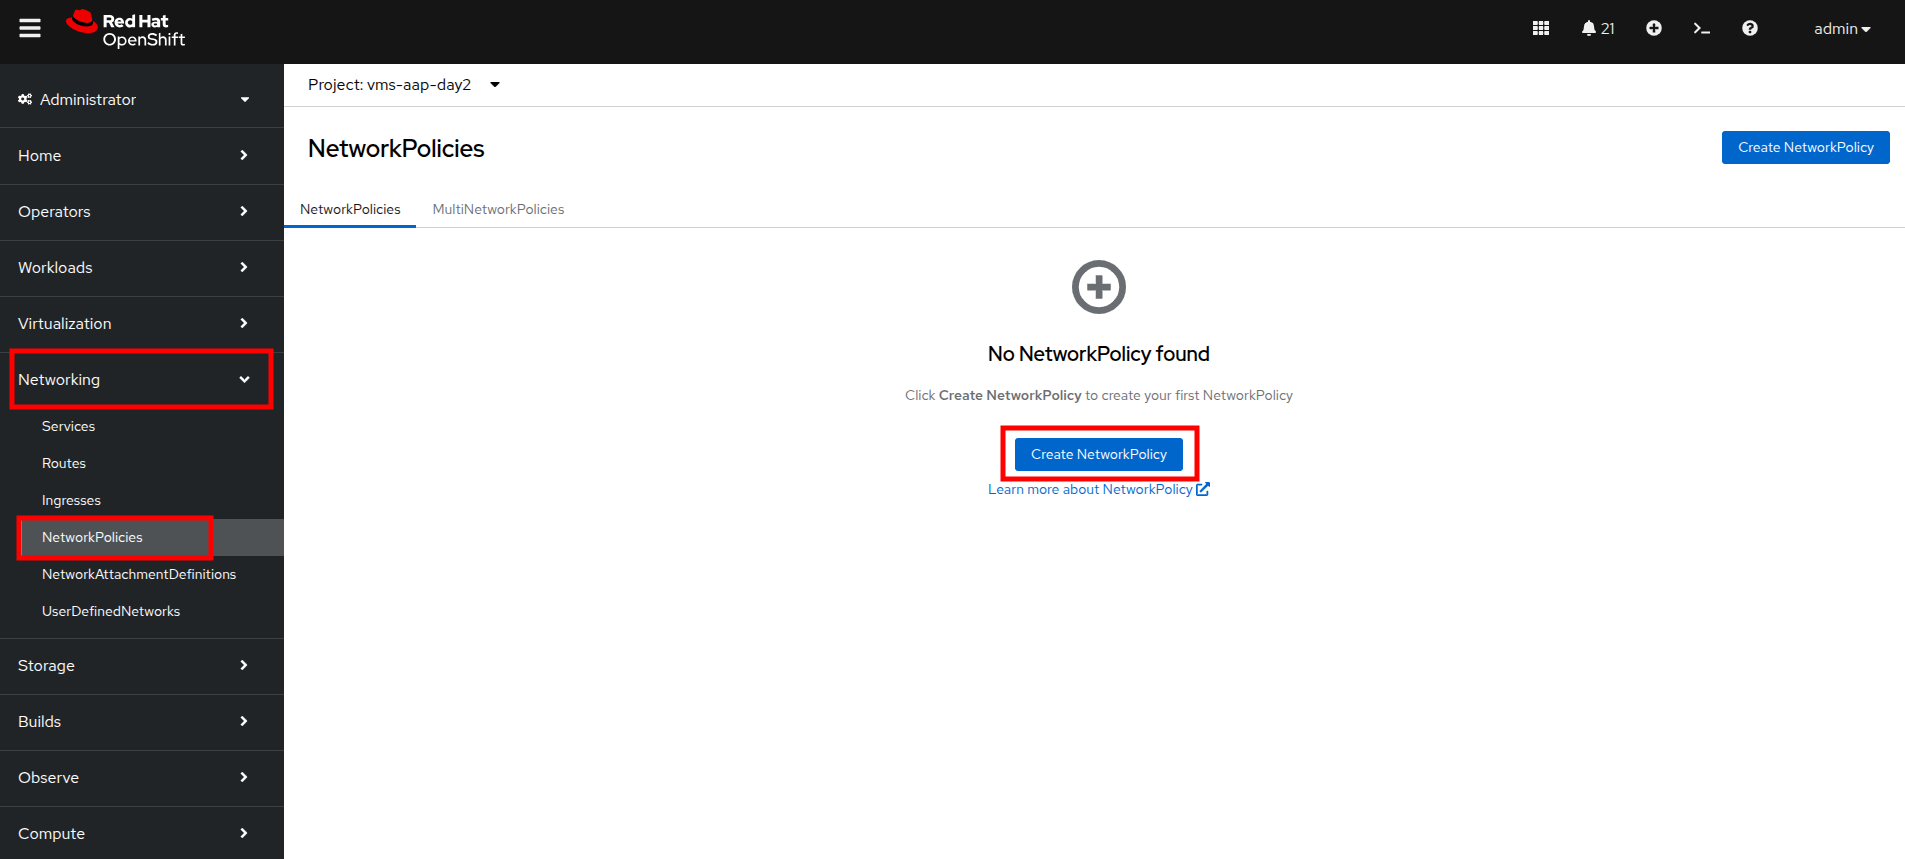 Figure 7. Network Policy
 -
In NetworkPolicies fill out the following fields:
-
Policy name:
ping-egress-deny -
Key:
app -
Value:
network-policy-deny -
Deny all egress traffic checkbox: checked
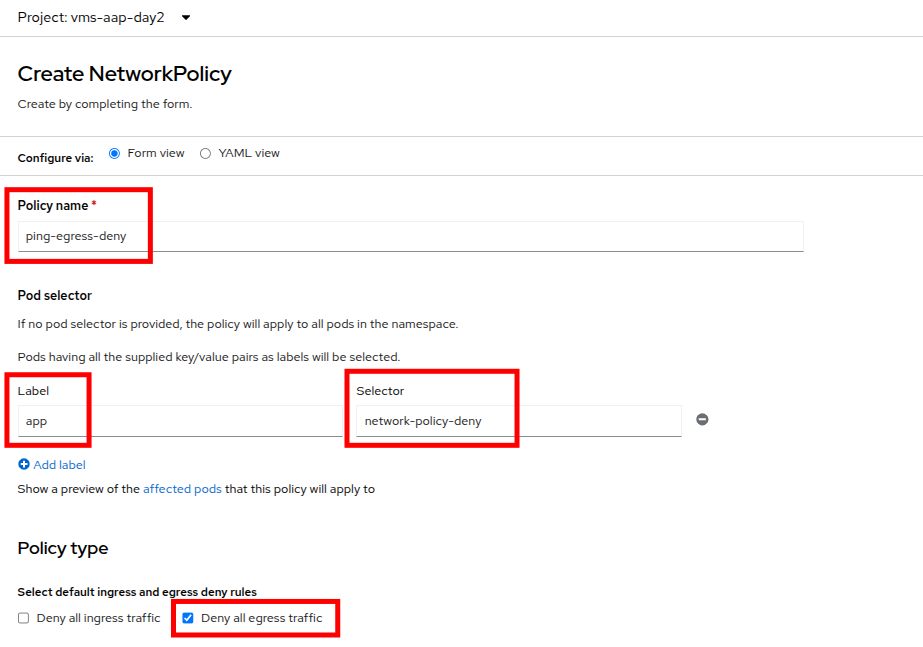 Figure 8. Configure Network Policy
-
-
With the values filled out, you can click the affected pods link under the Pod selector section to show which pods are affected by this policy. Once you are satisfied with your settings you can click the Create button.
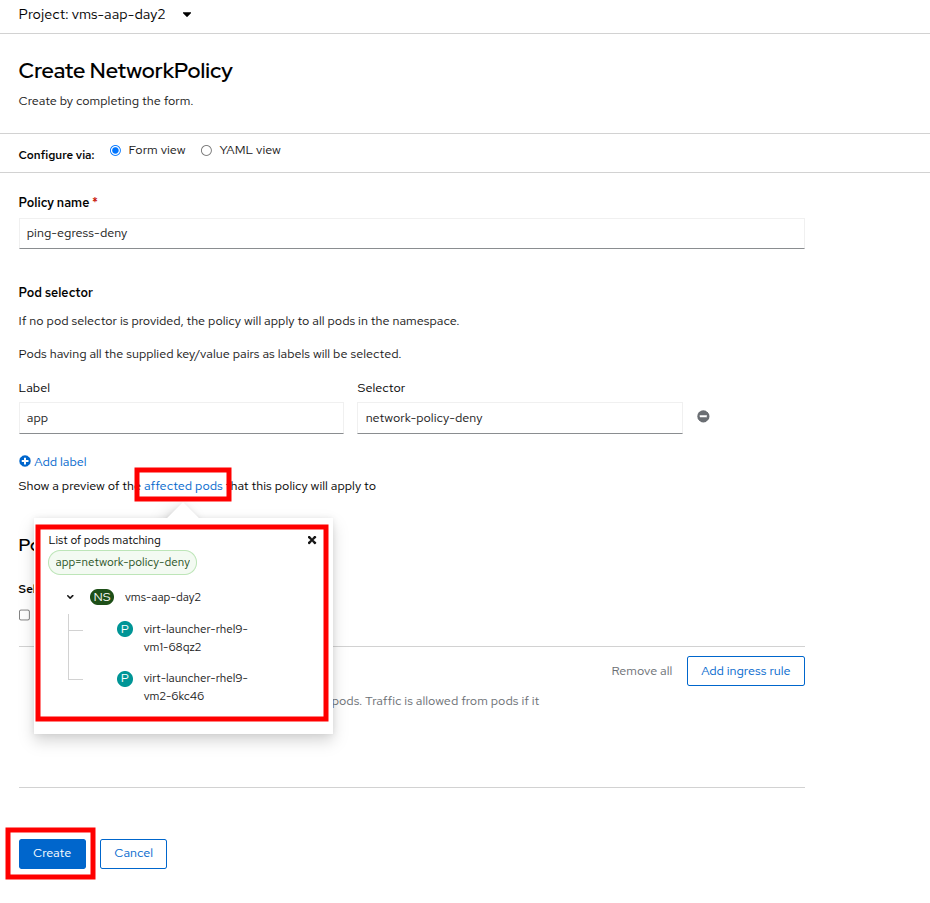 Figure 9. Affected Pods
 -
With the policy created, go test it out.
Confirm the Effects of the Network Policy on the VM.
-
Return to the console of the rhel9-vm1 virtual machine to test our policy.
-
Using the left side navigation menu, click on Virtualization, then VirtualMachines, and select rhel9-vm1 from the center column.
-
Click the Console tab of the VM, you should still be logged in from before.
-
Copy and paste the following syntax to test out the new Network Policy:
ping www.google.com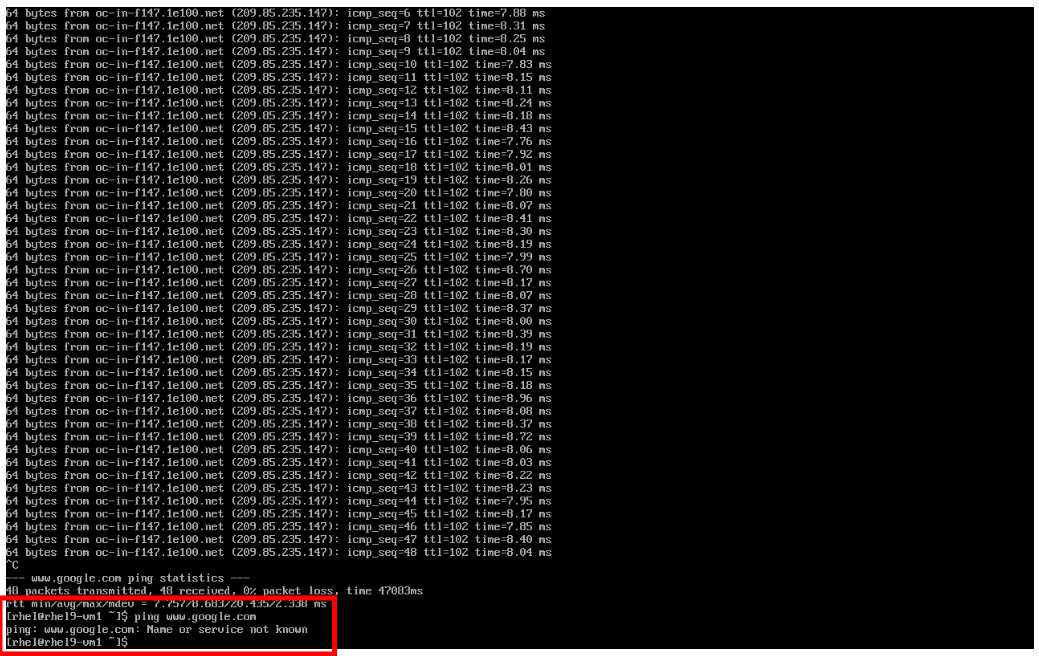 Figure 10. Egress Blocked
 -
Egress from the cluster is completely blocked, including DNS lookups.
-
Once you have completed this exercise, return to Networking and NetworkPolicies and delete the ping-egress-deny policy using the three-dot menu on the right, and confirming in the popup box.
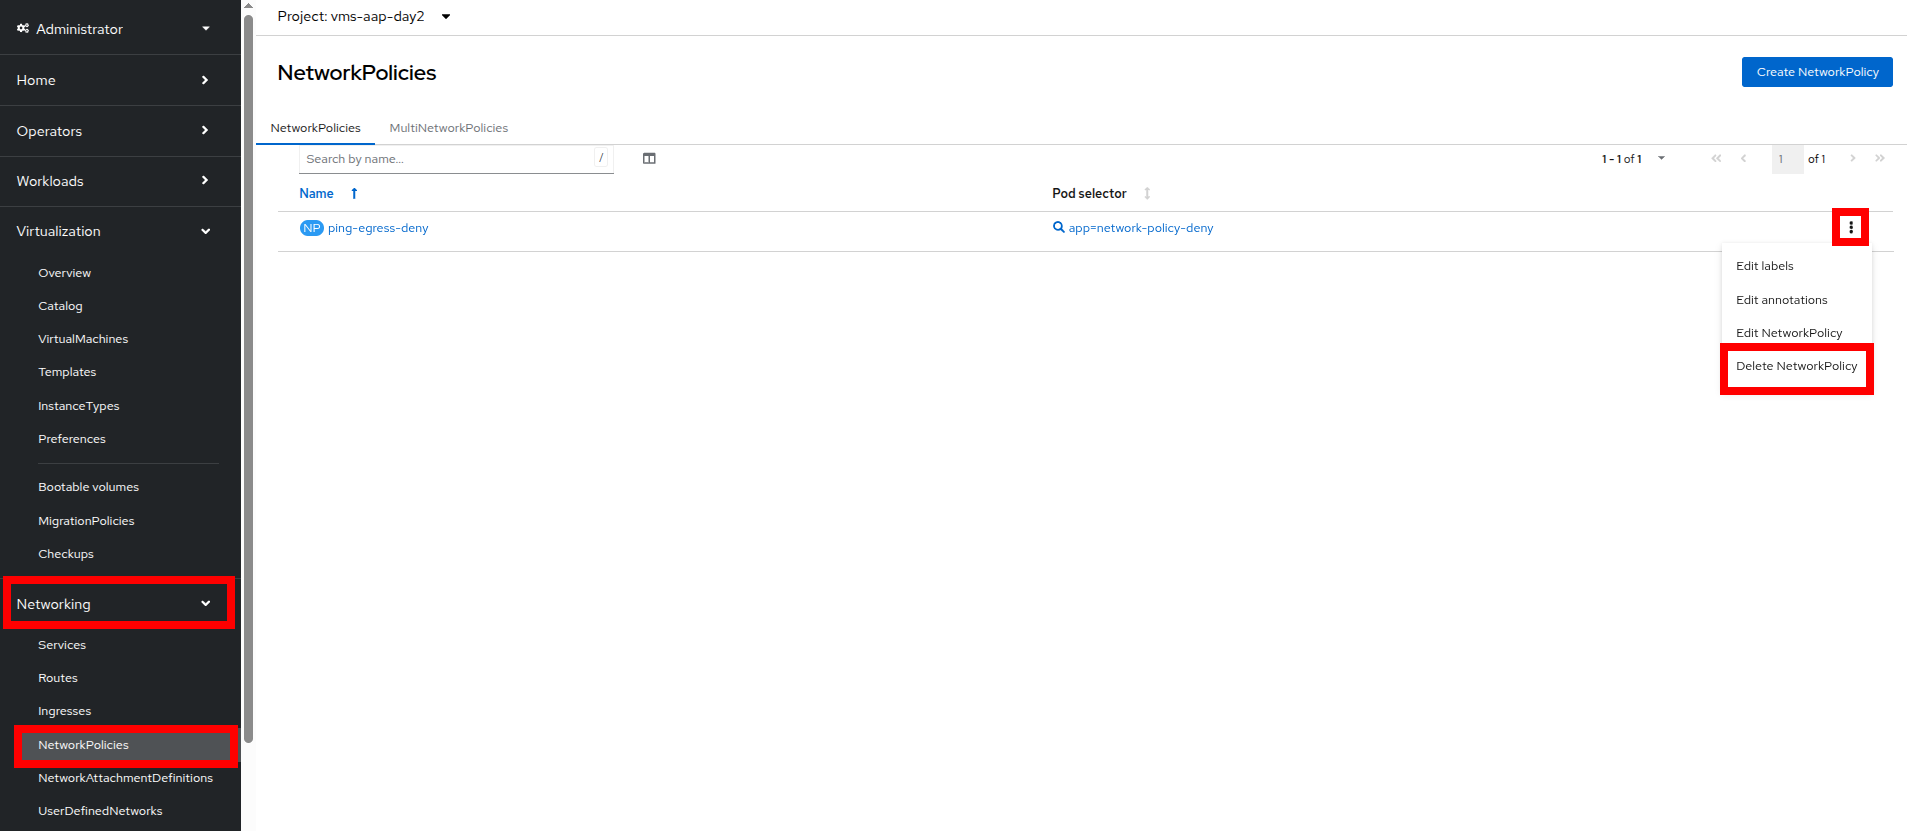 Figure 11. Delete Policy
Configure UDN to Manage VM Traffic Between Projects
While it may seem like a basic security configuration to ensure that virtual machines are unable to reach unwanted external website, network policy also provides us with a diverse set of tools that allow us to shape traffic between our VMs and the projects in which they reside.
| For this section we are going to make use of UDN (User Defined Networks) and configure our three namespaces for dev, test, and production so that they have limited network traffic between the resources defined in each one. Currently for a namespace to make use of Primary UDN functionality it must have a specialized label applied at creation that allows it to override the default cluster networking configuration. |
Create UDN Enabled Namespaces
-
From your OpenShift console, click on Administration, followed by Namespaces and the Create Namespace button in the corner.
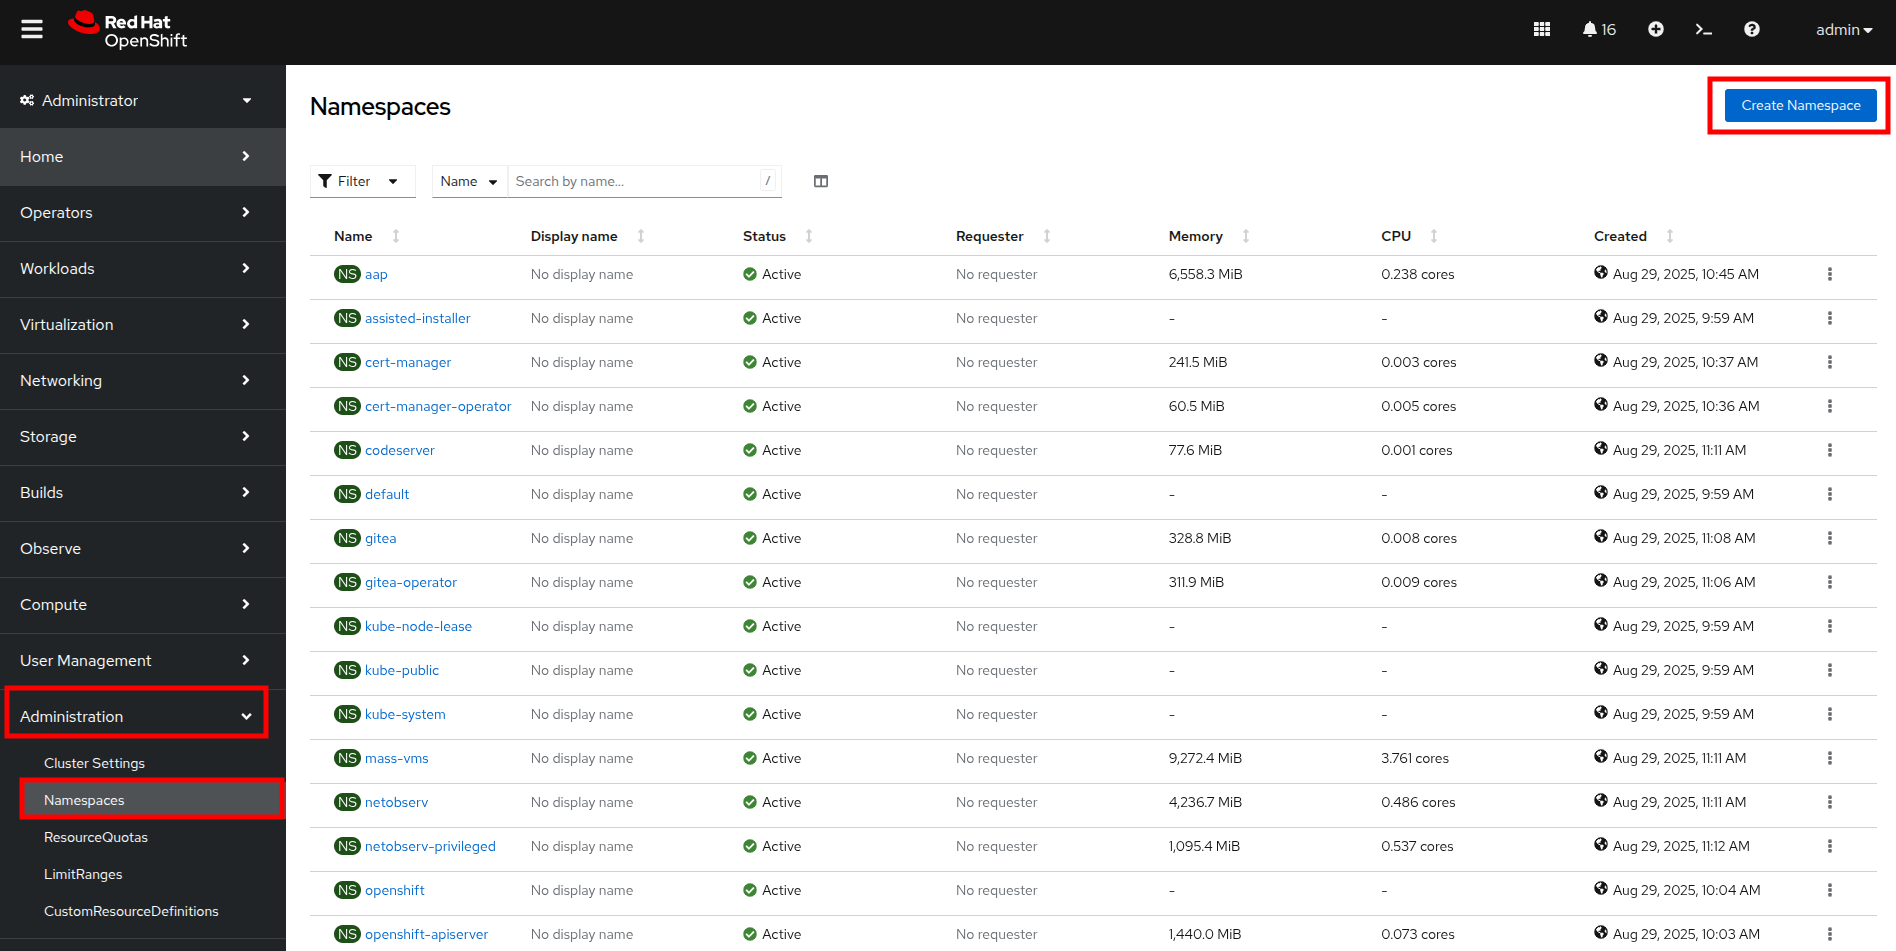 Figure 12. Create Namespace
 -
The Create Namespace prompt will open, and give you the option to enter a name, and add any custom labels to the namespace. Type in the name
devand add the following label:k8s.ovn.org/primary-user-defined-network, and click the Create button.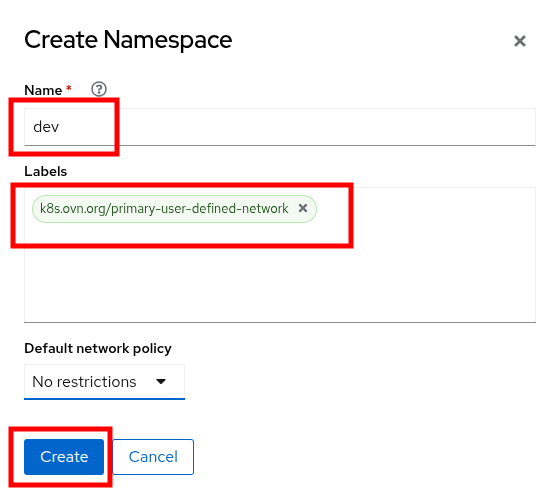 Figure 13. Create Namespace Dialog
 -
When the namespace is created, you will be taken to the Namespace details page where you should see the label you applied listed.
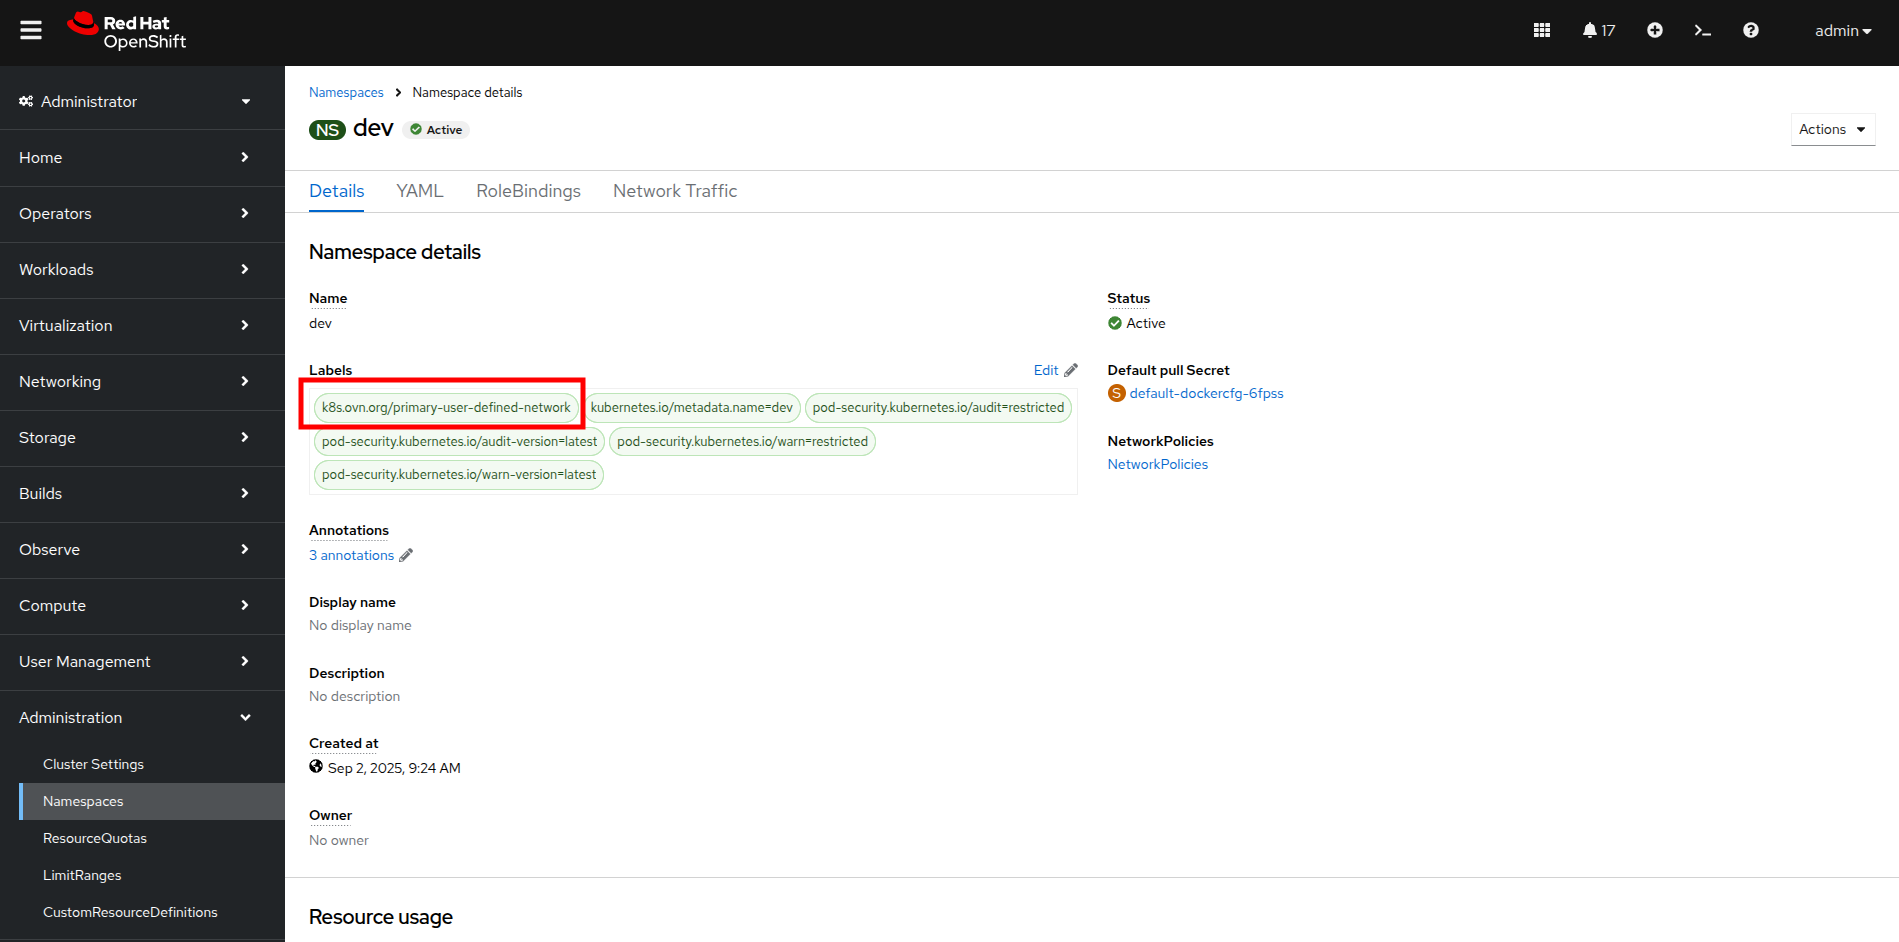 Figure 14. Namespace Details
 -
Repeat these steps to create namespaces for the
testandprodnamespaces as well.
Create UDNs For Each Namespace
-
Click on Networking followed by UserDefinedNetworks. Confirm that you are in your dev project and click the Create button in the center of the screen and select UserDefinedNetwork from the dropdown menu.
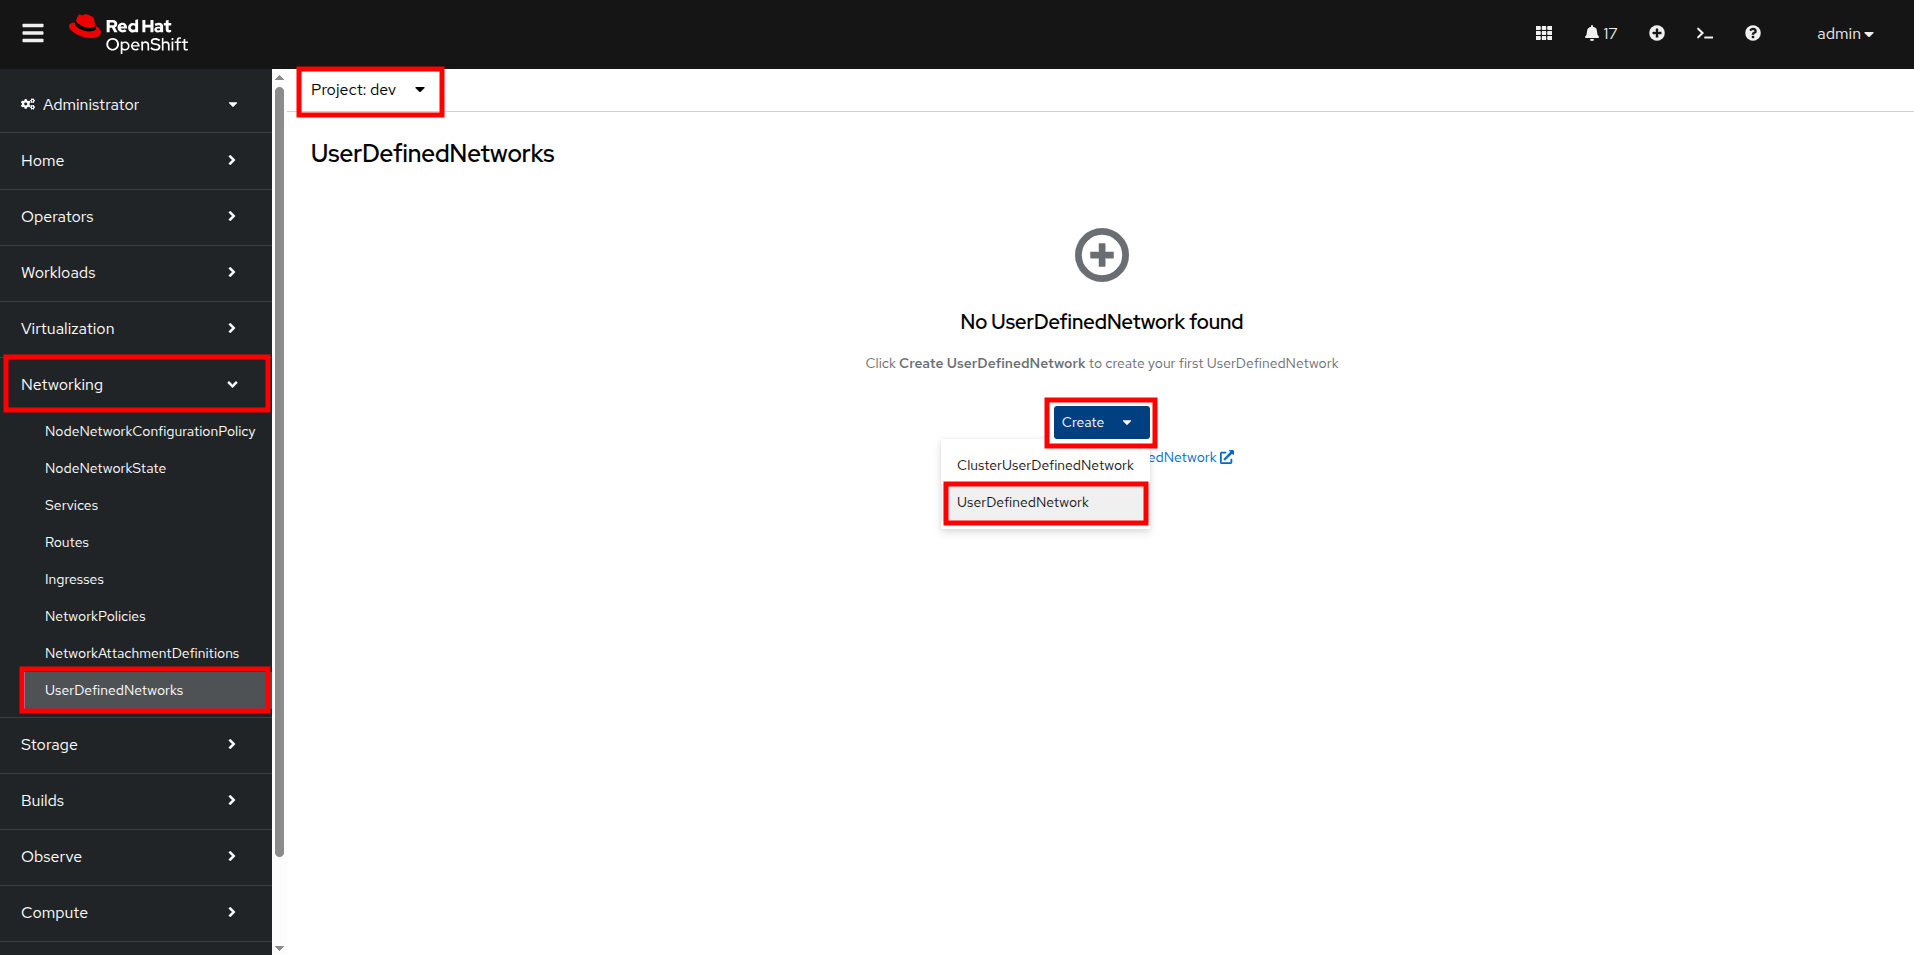 Figure 15. Create UDN
 -
In the dialog box that appears your project name will already be defined, you just need to enter the subnet you want to use. Type
192.168.253.0/24into the box for the dev project, and click the Create button.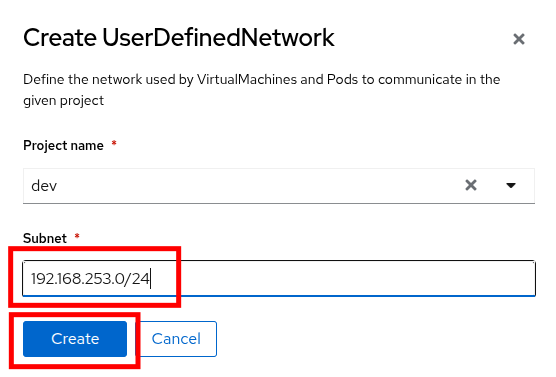 Figure 16. Create UDN Dialog
 -
You will be taken to the UserDefinedNetwork details page which shows information about the UDN you just created including details such as its namespace, topology, subnet, and shows you that it has automatically created a Network Attachment Definition for you to connect your virtual machines.
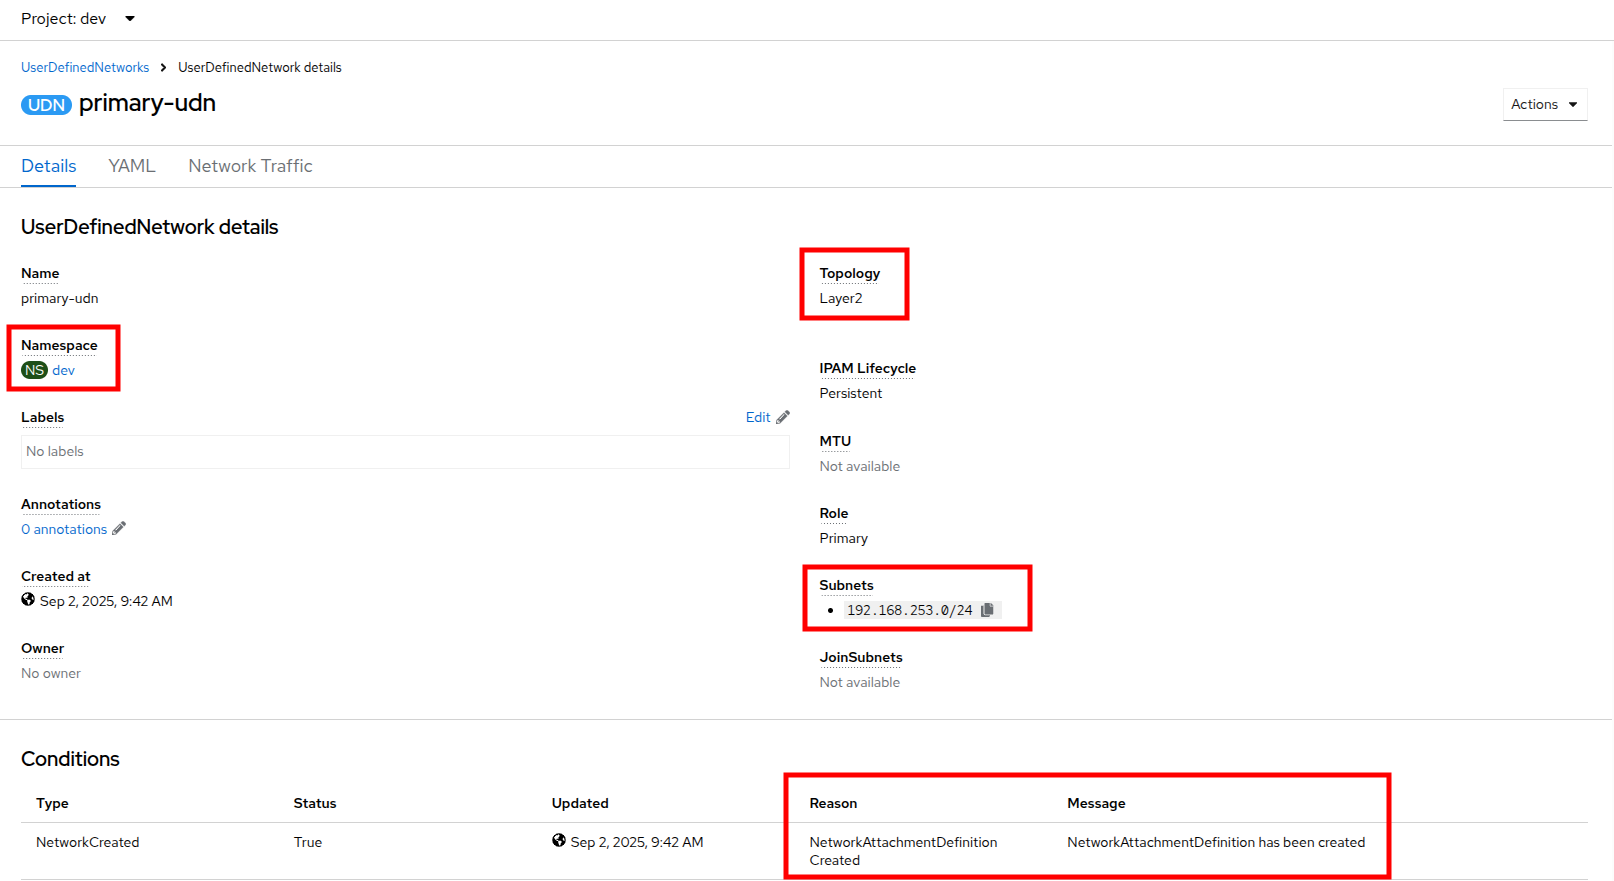 Figure 17. UDN Details
 -
Repeat these steps to create a UDN in the test namespace with subnet
192.168.254.0/24and in the prod namespace with the subnet192.168.255.0/24. -
Once all three are created you should be able to click the Project dropdown at the top of the page and select All Projects to see them all listed.
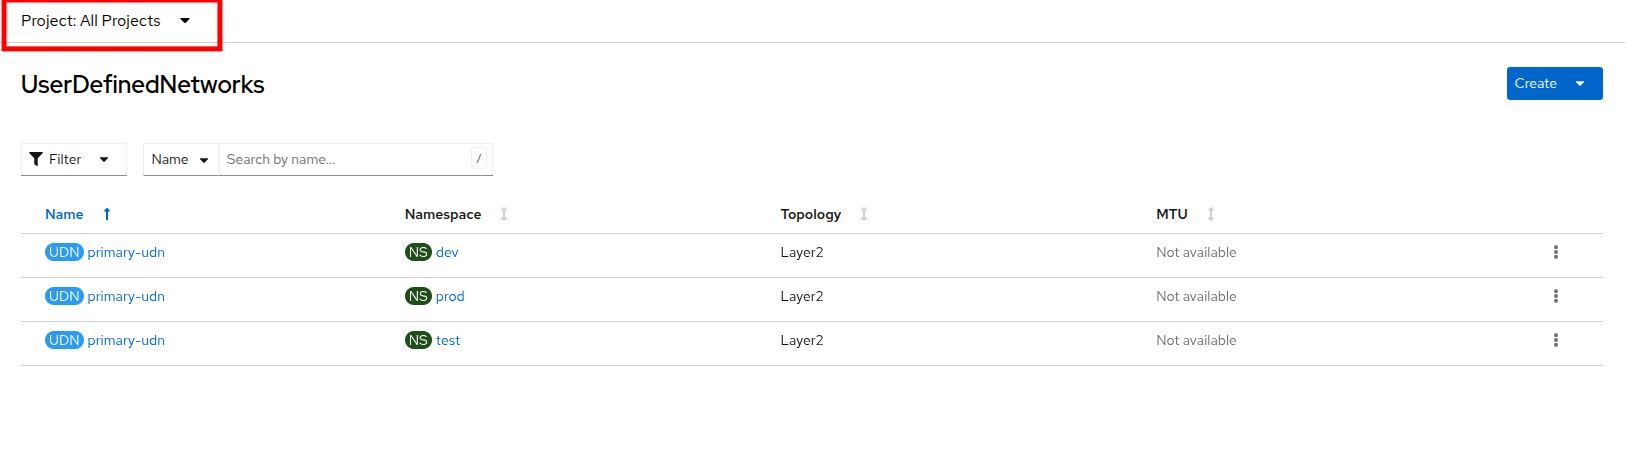 Figure 18. UDN List
Create VMs and Attach Them to the UDNs
Now that we have defined our namespaces and created our UDNs, we need to put them in practice by creating a few virtual machines to test out connectivity.
-
Click on Virtualization and Catalog. Ensure that you are in the dev project, and select the tile for the Fedora VM template.
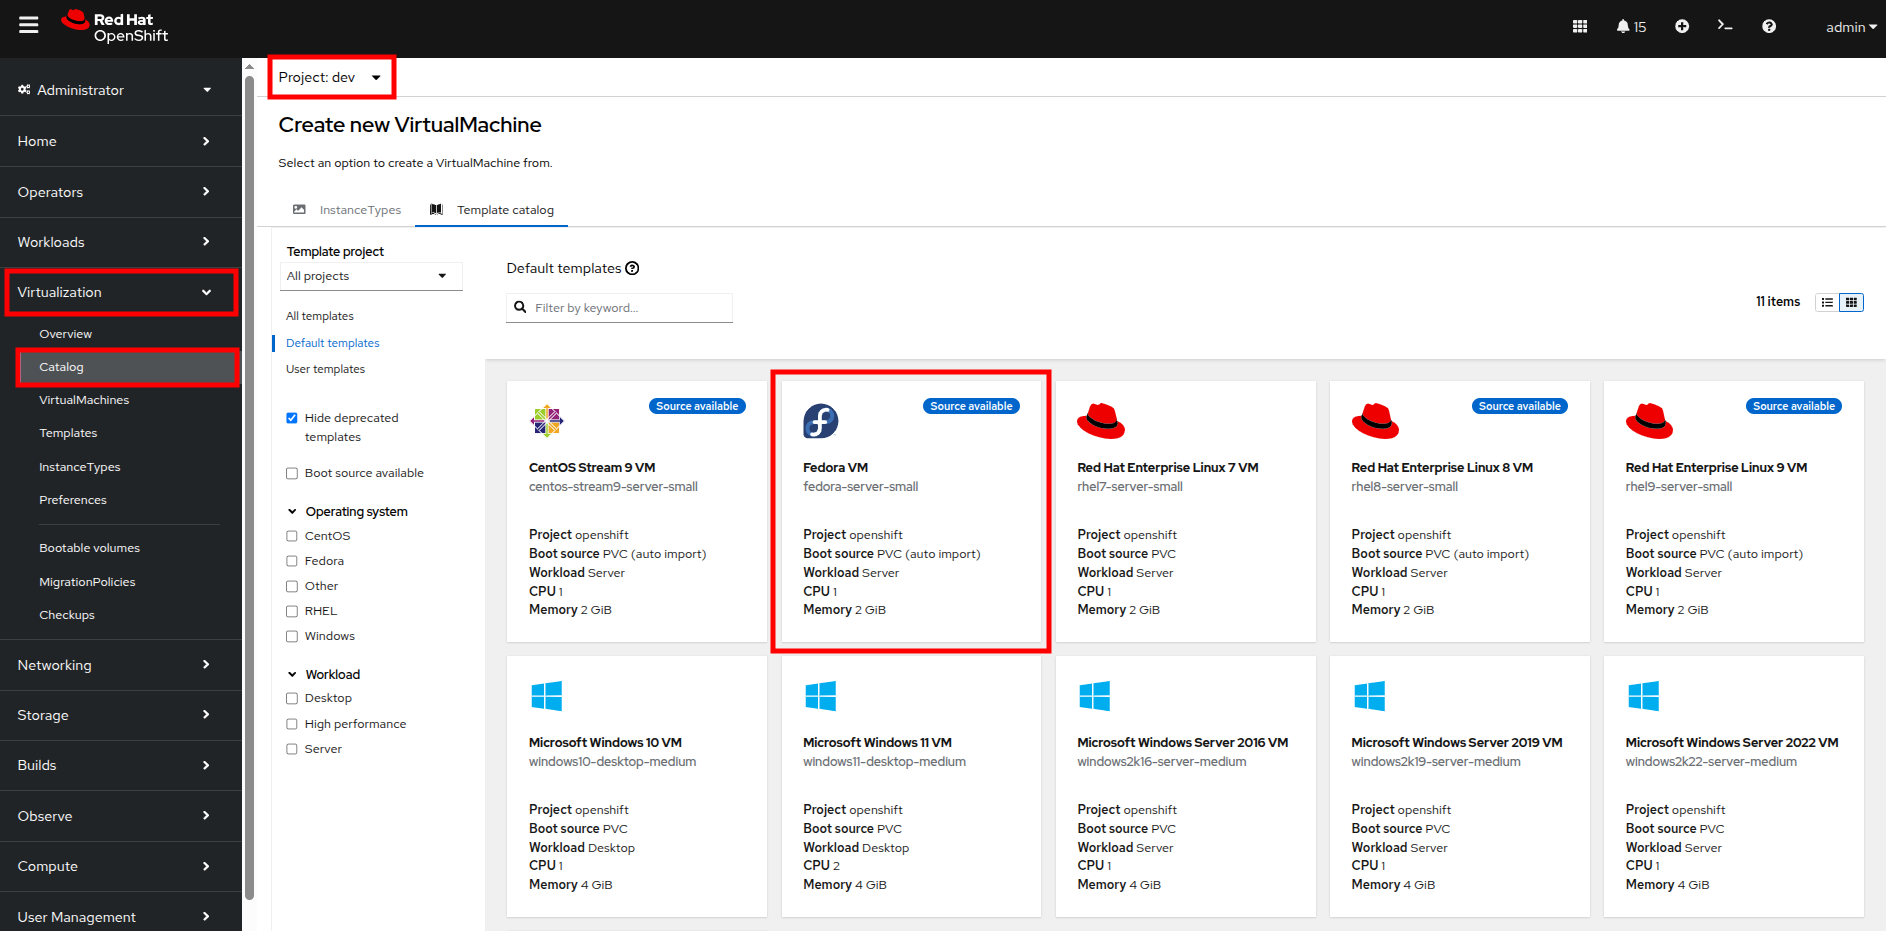 Figure 19. VM Catalog
 -
After clicking you will be presented with the Fedora VM dialog. Notice that the VM template shows that it is connected to the OpenShift pod network by default, however because of the label we placed on the namespace, it knows that it should default to using the UDN. Name your first VM
fedora-dev01, and click on the Quick create VirtualMachine button.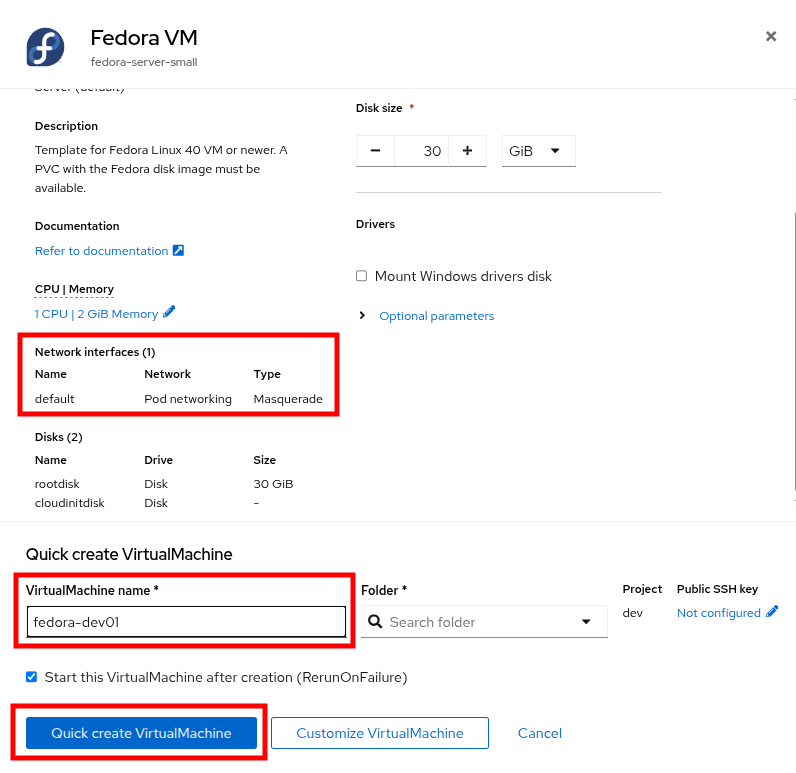 Figure 20. Create VM Dialog
 -
With this VM started, please repeat the steps to create an additional VM
fedora-dev02in the dev namespace, followed byfedora-test01in the test namespace, andfedora-prod01in the prod namespace. -
With the list of VMs created we can now test how traffic flows and doesn’t flow between the VMs both within and between projects.
Testing VM Connectivity
-
To validate connectivity within namespaces we can just attempt a few simple pings between our virtual guests.. Click on Virtualization and VirtualMachines in the left side menu, and click on your dev namespace to see the two VMs that you provisioned there.
-
Notice that they both have IP addresses from your UDN subnet, make note of these two IP addresses.
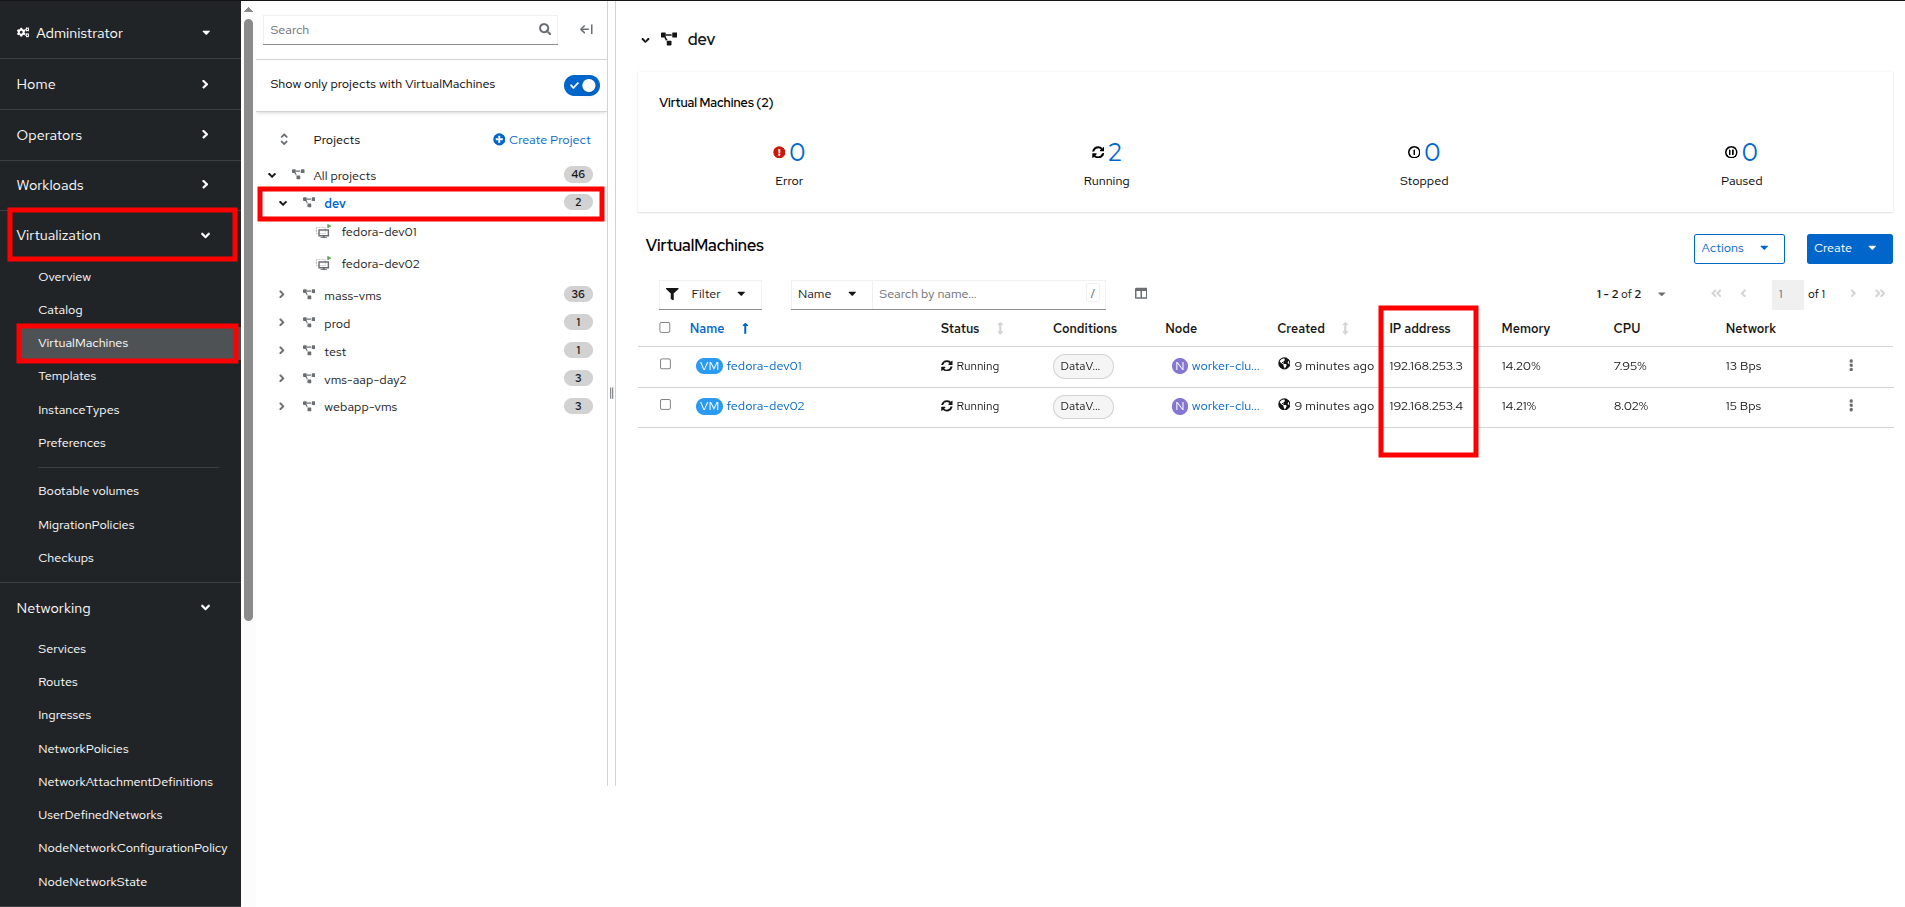 Figure 21. Dev VMs
 -
Click on fedora-dev01, and click the button to launch its web console.
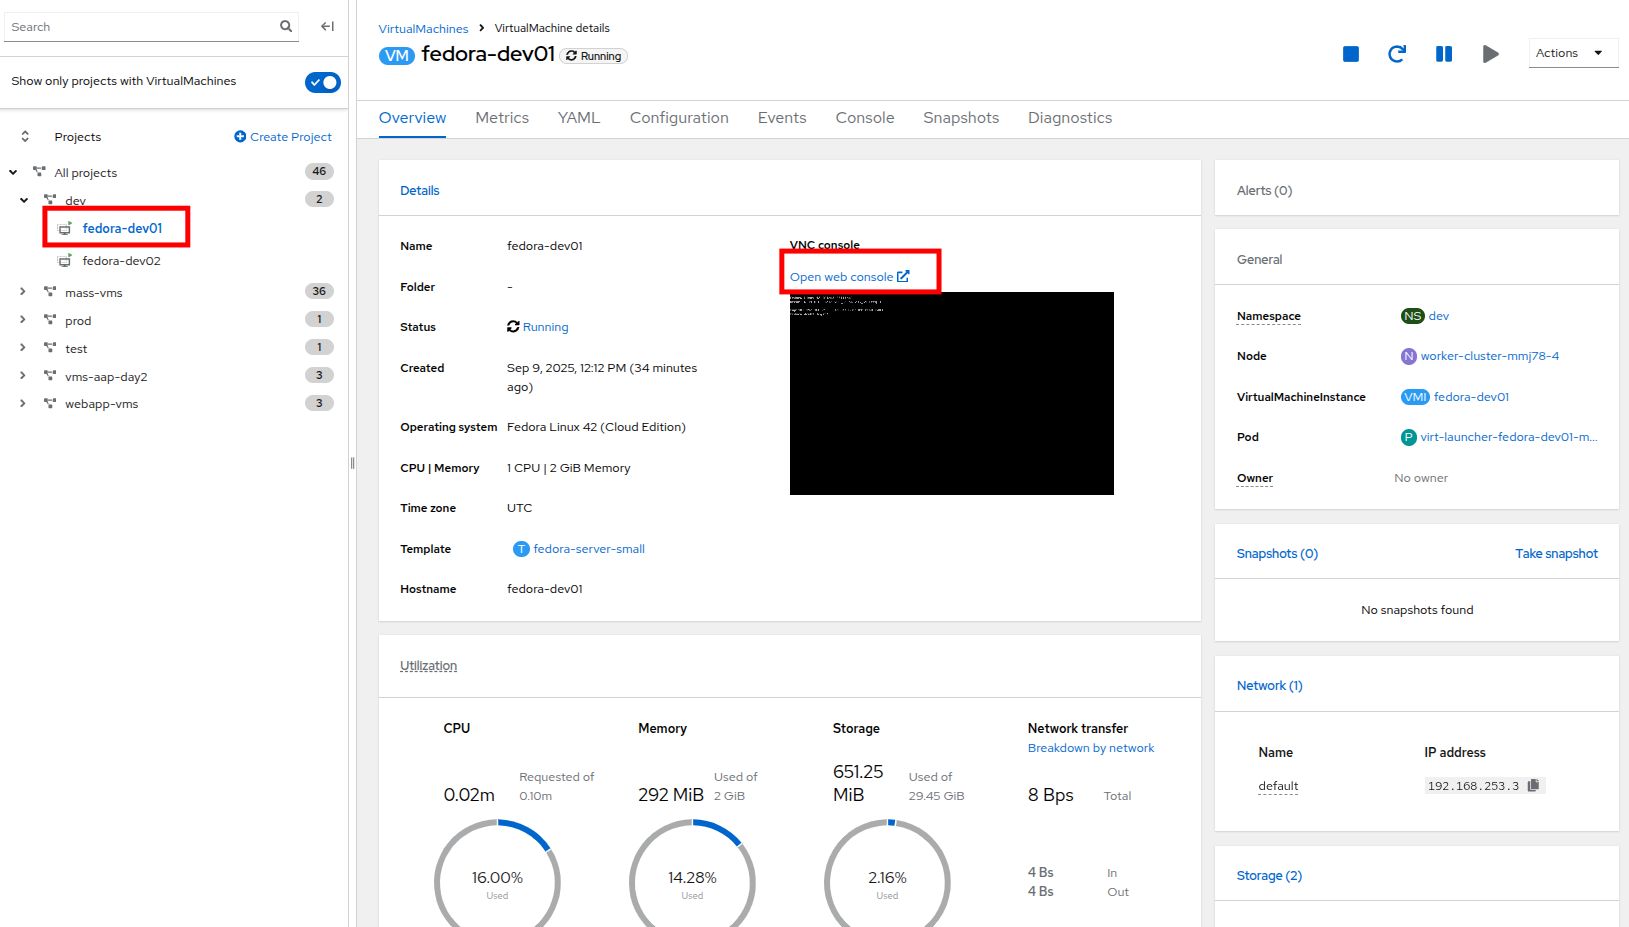 Figure 22. Fedora-Dev01 Details
 -
Use the built-in Copy/Paste functionality to log into the system with the credentials provided.
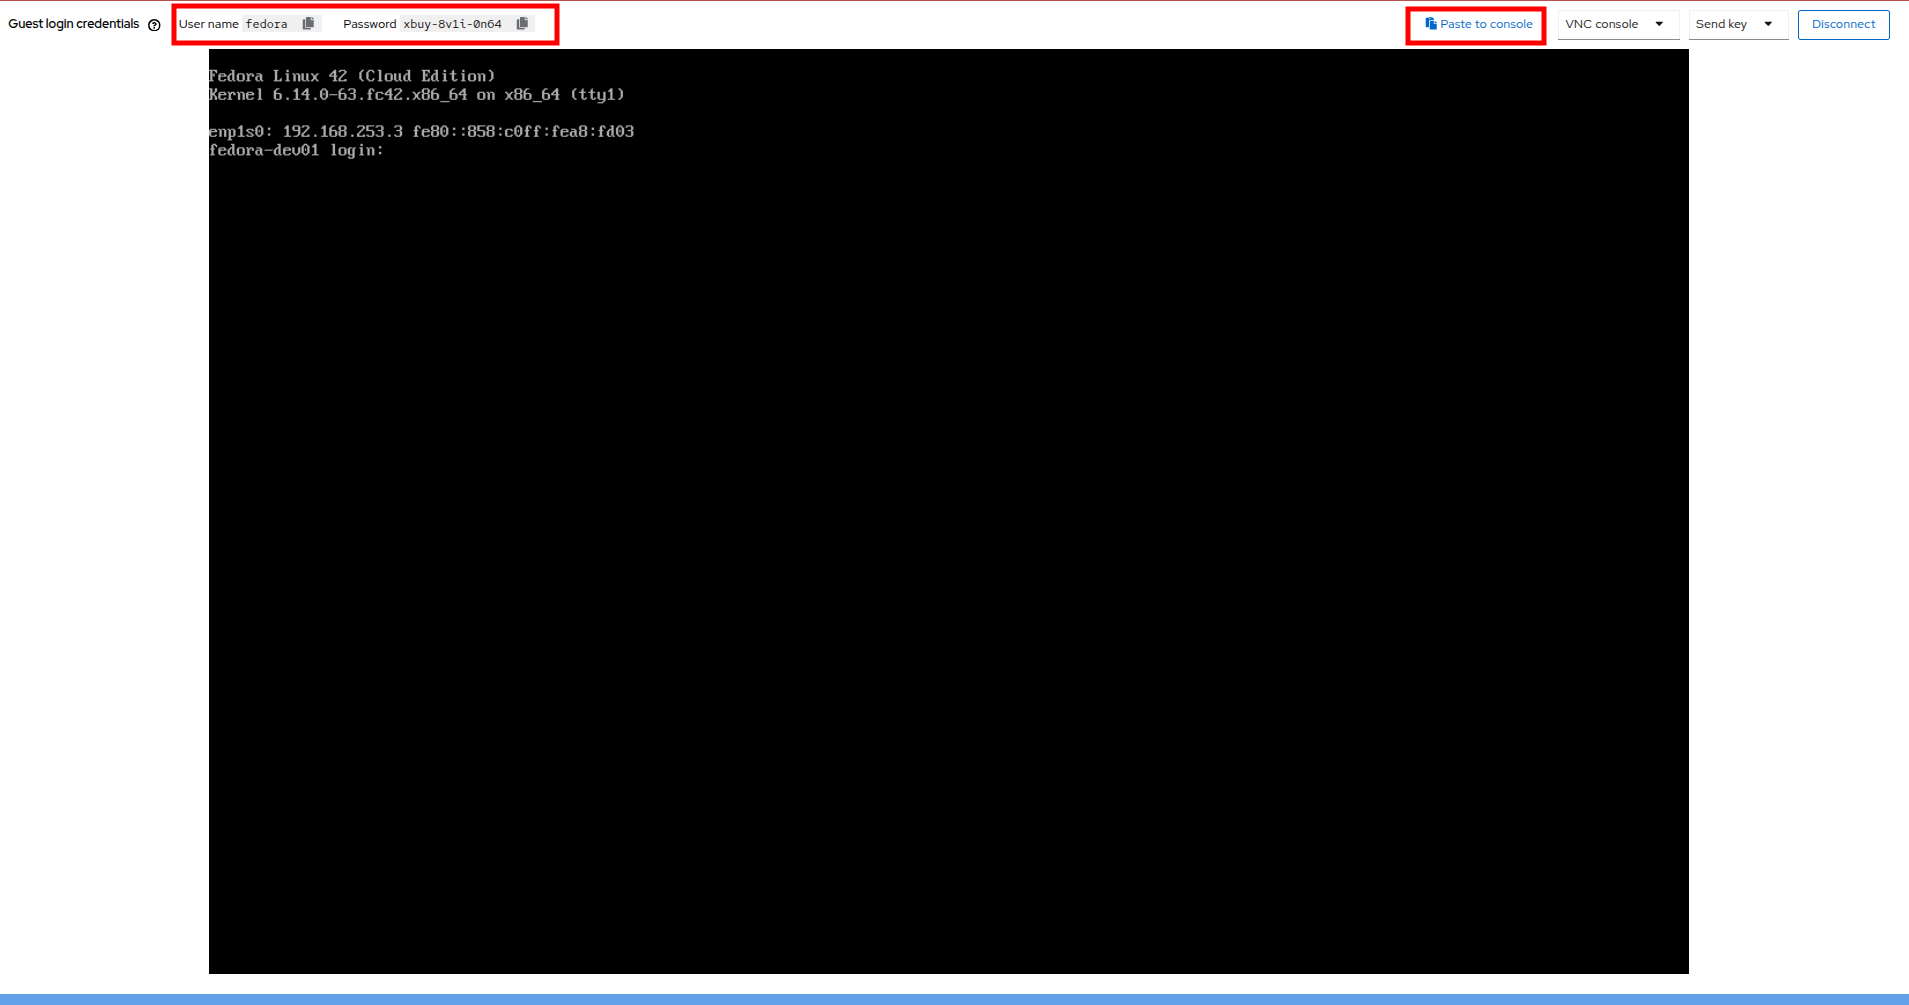 Figure 23. Fedora-Dev01 Console
You may recieve a prompt to allow this feature, click the Allow button. -
When you are logged in, attempt to ping the other VM in our dev namespace fedora-dev02. The IP pings successfully.
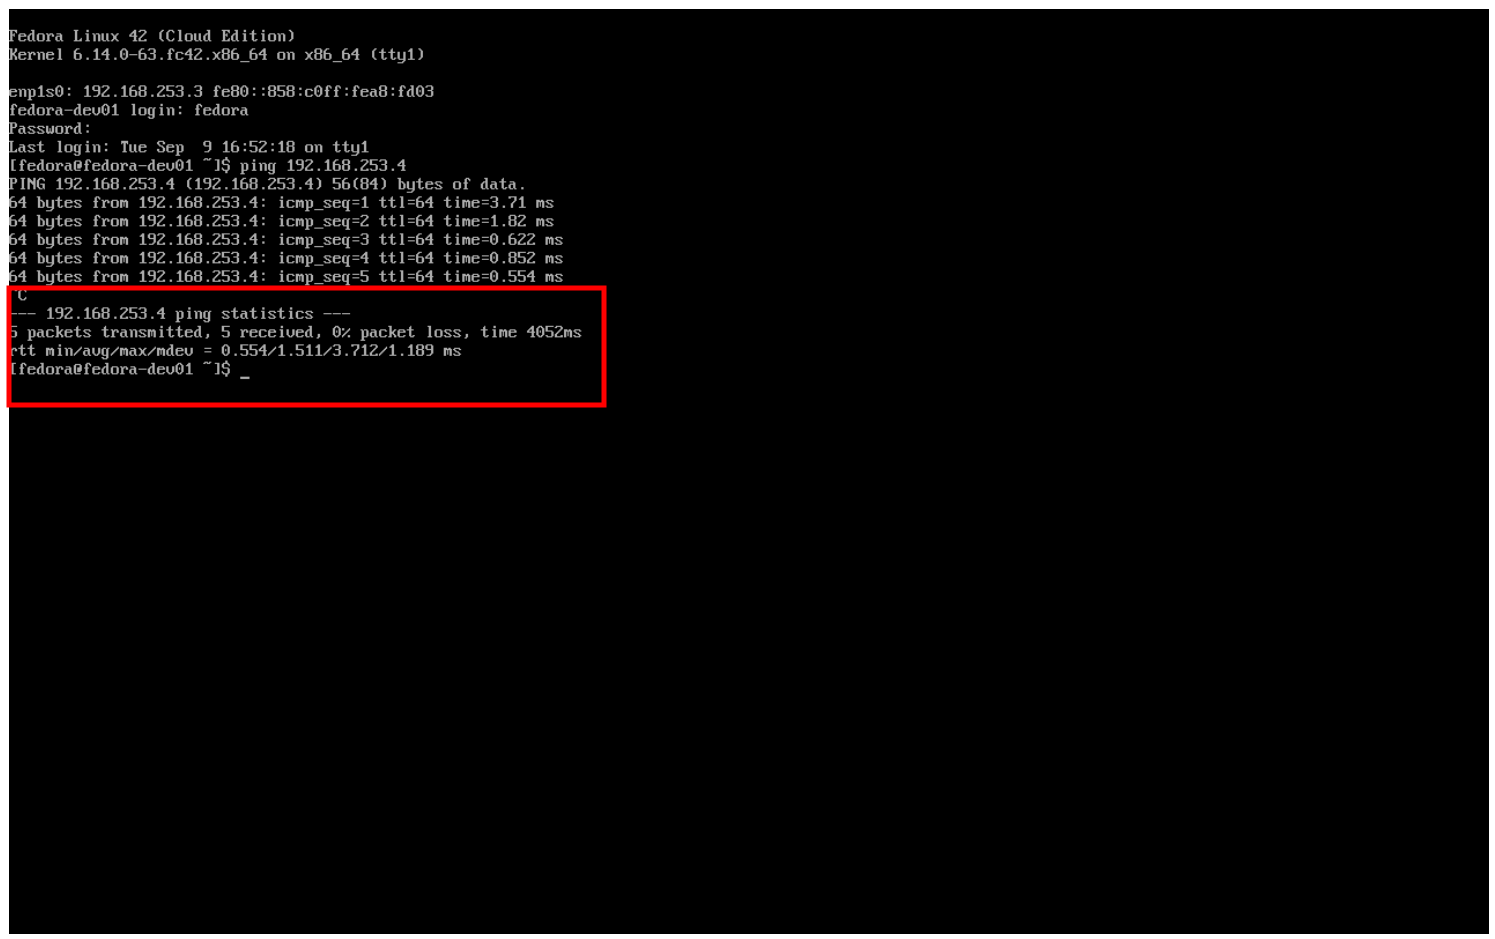 Figure 24. Fedora-Dev02 Ping Success
 -
Now that we have tested the ping within our namespace, lets try between namespaces and networks to see what happens.
-
Return to the tab where you have the fedora-dev01 details pulled up and click on the test project in the center column.
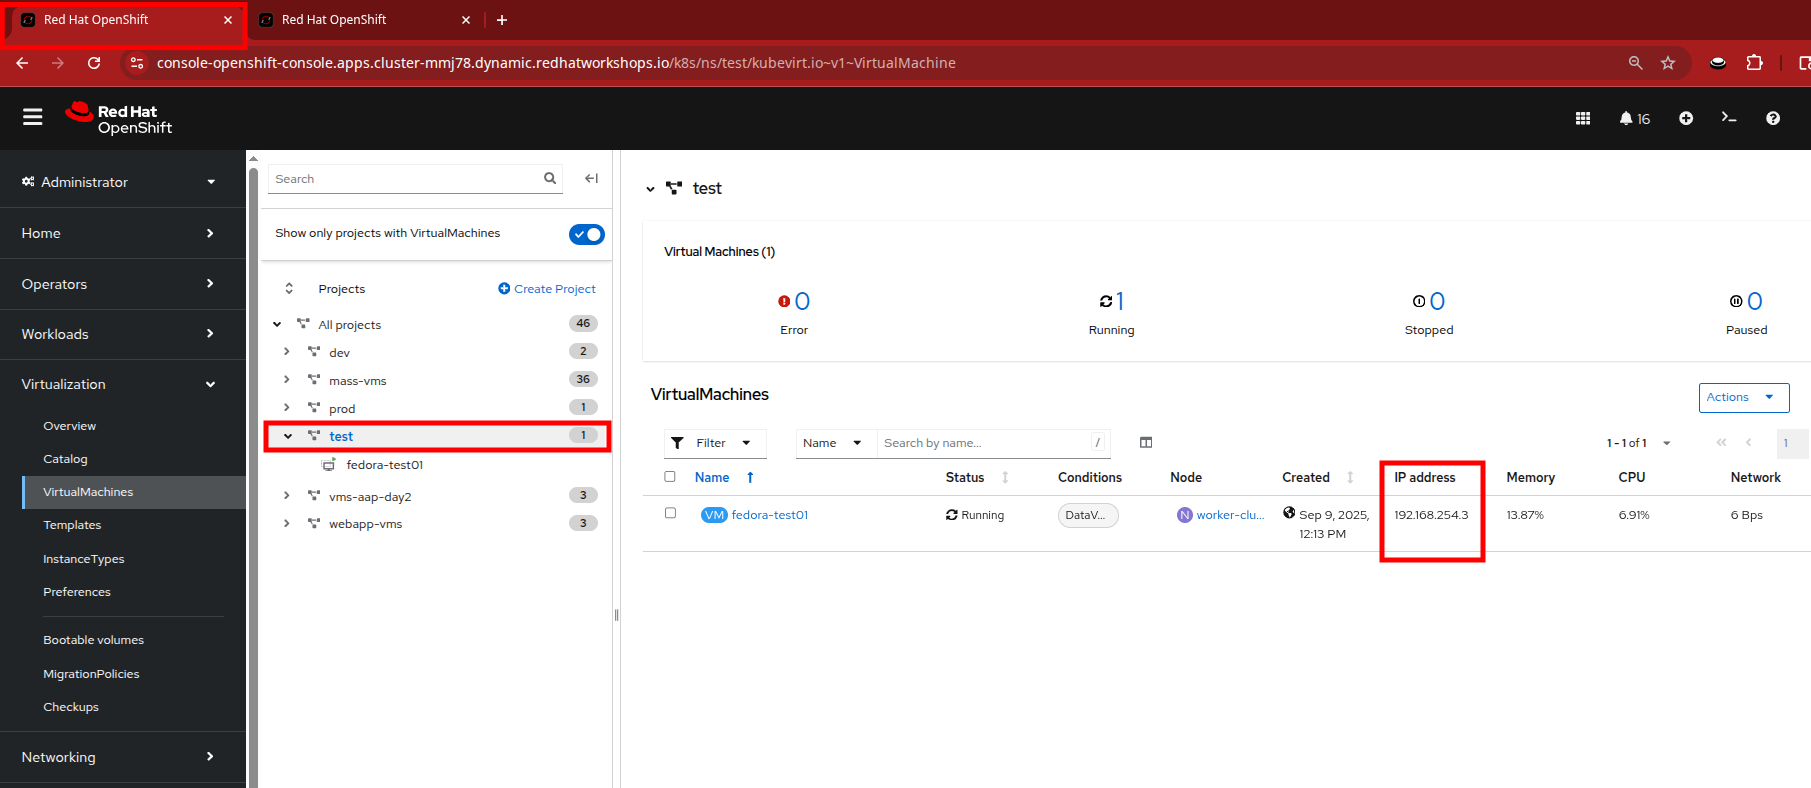 Figure 25. Fedora-Test01
 -
Make note of the IP address that the fedora-test01 VM has.
-
Now return to the tab where you have the console for fedora-dev01 open and attempt to ping this IP address.
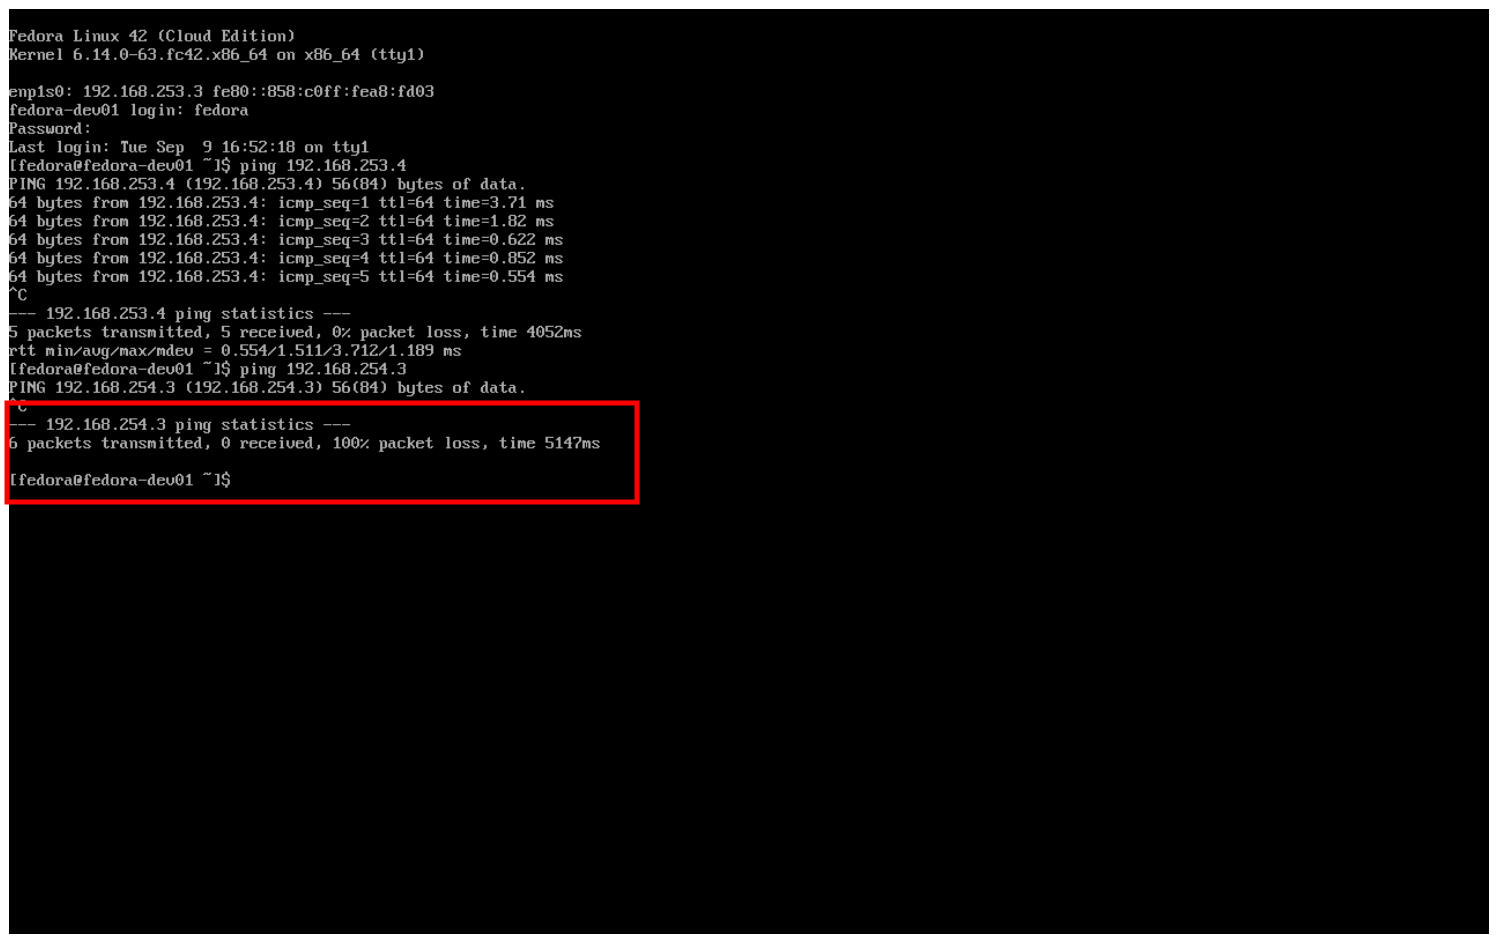 Figure 26. Fedora-Test02 Ping Fail
 -
You can see that the ping attempt, across networks and namespaces fails, showing how UDN helps segregate networks and workloads by default.
With advanced networking configurations it is possible to enable routing between these subnets, but that is currently out of scope for this lab.
Examining Network Traffic with the Network Observability Operator
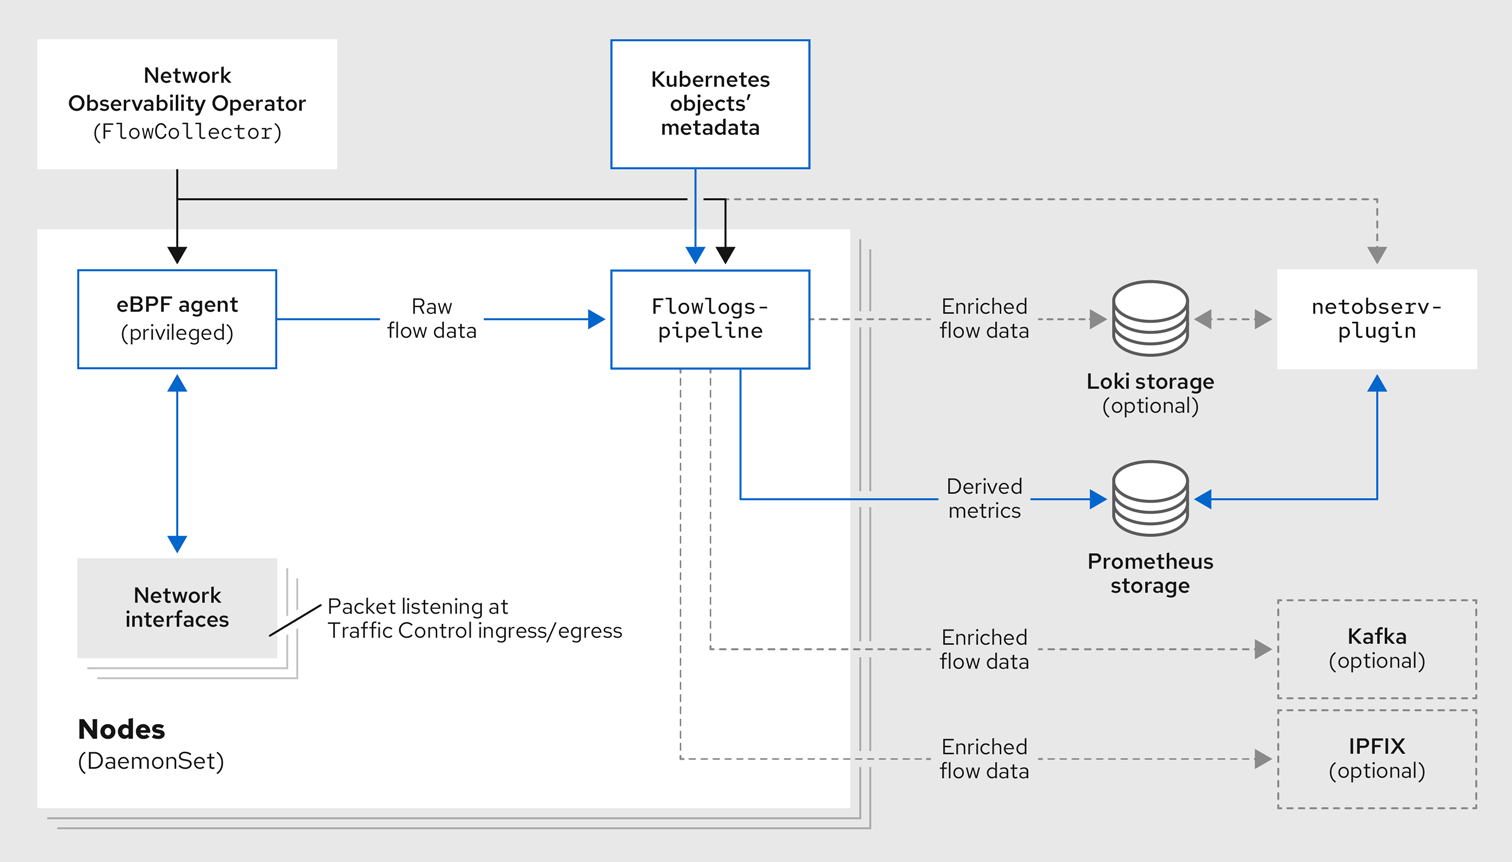
Another powerful tool that can be used to manage your networking environment is the Network Observability operator. The Network Observability operator analyzes traffic entering and leaving the cluster, and traveling between namespaces to help you vizualize what your virtual and container-based workloads are communicating with.
This is a look at how it the operator is configured, and how it collects the data to create the graphs.
-
To get started with the Network Observability operator, we want to click on Observe on the left side menu, and then on Network Traffic. The initial view is called the Overview and shows us node view by default, where our top five average byte rates produced by current workloads, and shows a graph of our workflows. These views can be adjusted over time range of collected data, and be set up to refresh automatically if desired.
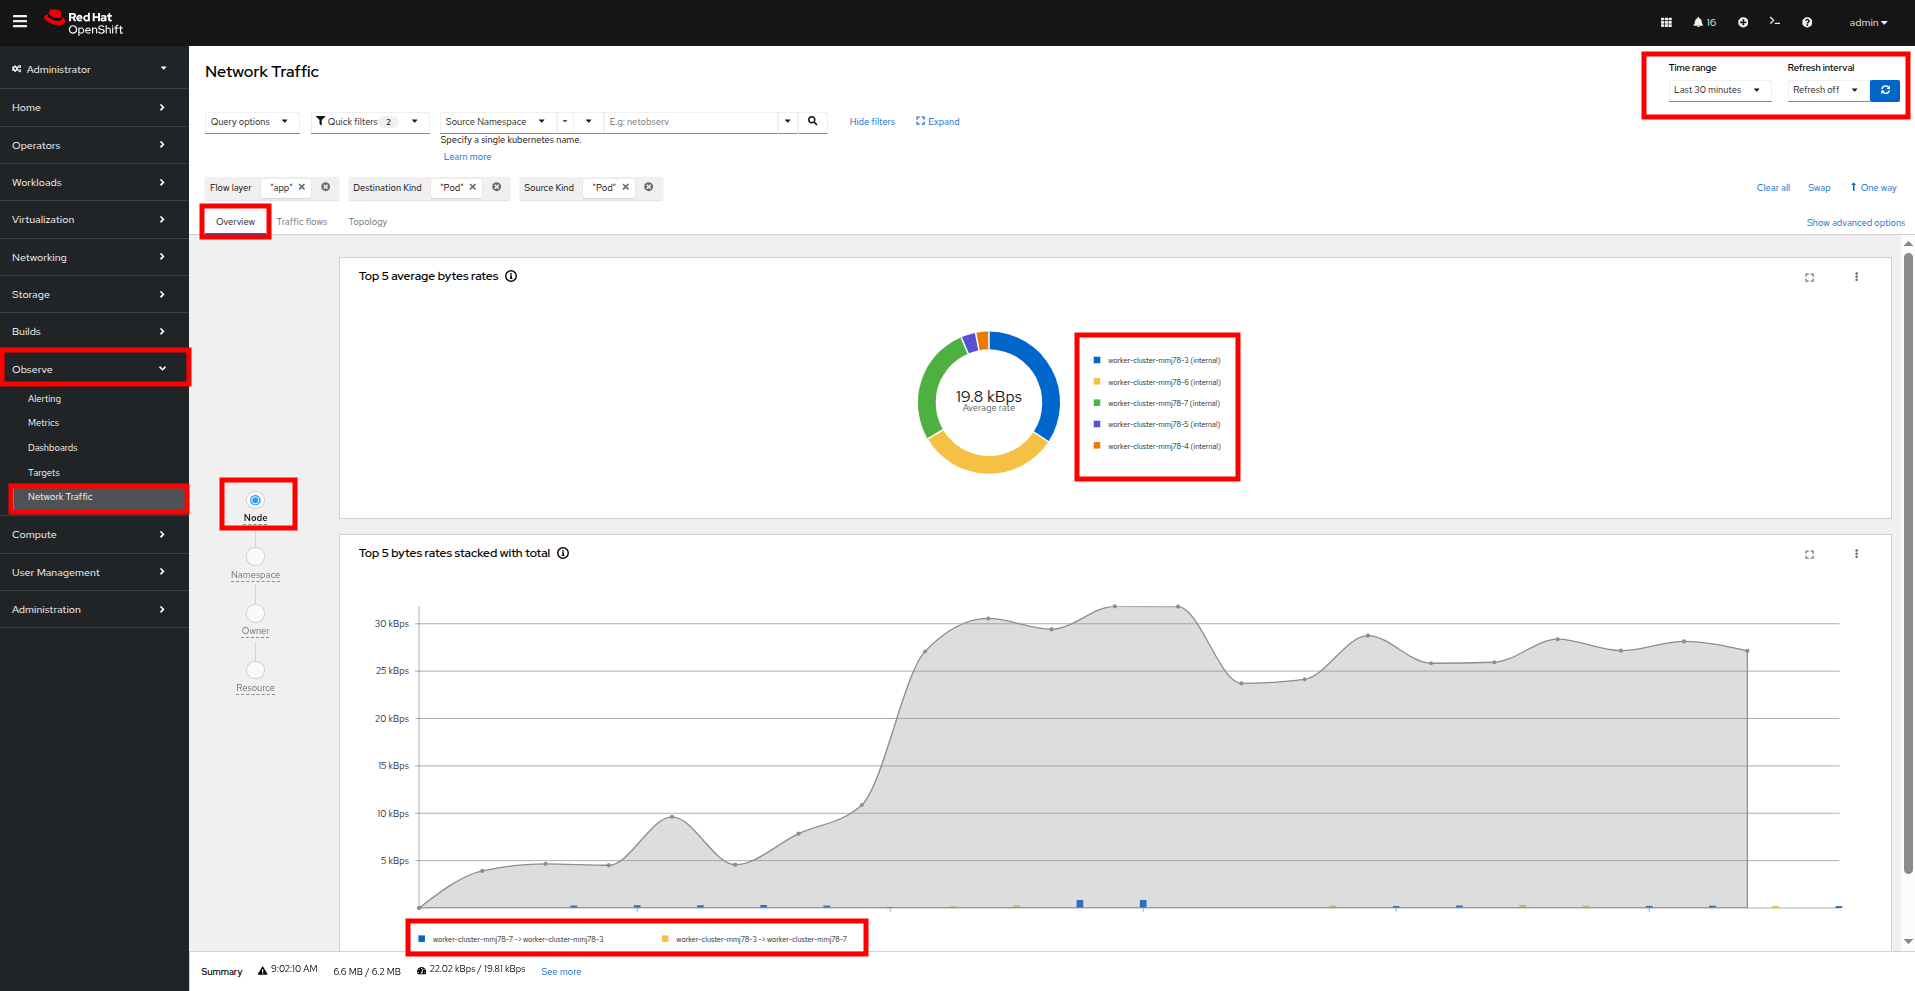 Figure 28. Network Traffic Node
 -
As you explore the screen, you notice that a majority of our traffic is local, between the worker nodes, and most of it is generated by the loadmaker from earlier sending requests against our webapp application.
-
The graph at the bottom shows the workloads stacked to show total throughput points and you can see peaks from individual worker nodes represented as bars near the bottom.
-
There are also options to view traffic by namespace, workload owner, and managed resource. Click through and explore each of these at your leisure.
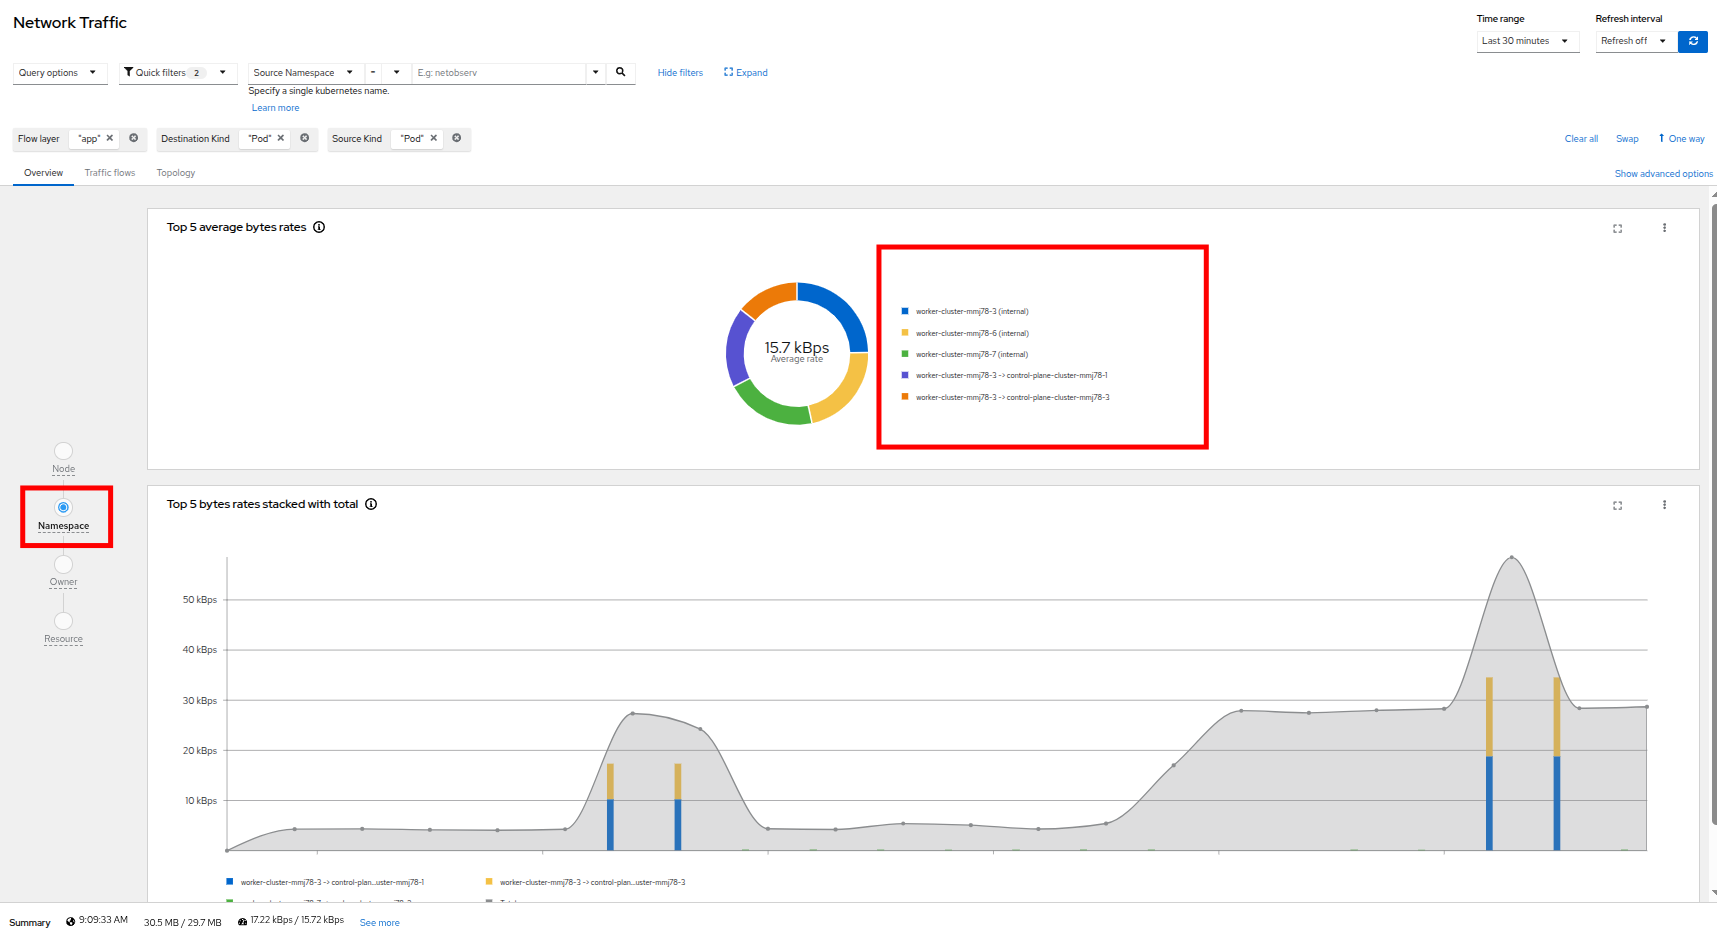 Figure 29. Network Traffic Namespace
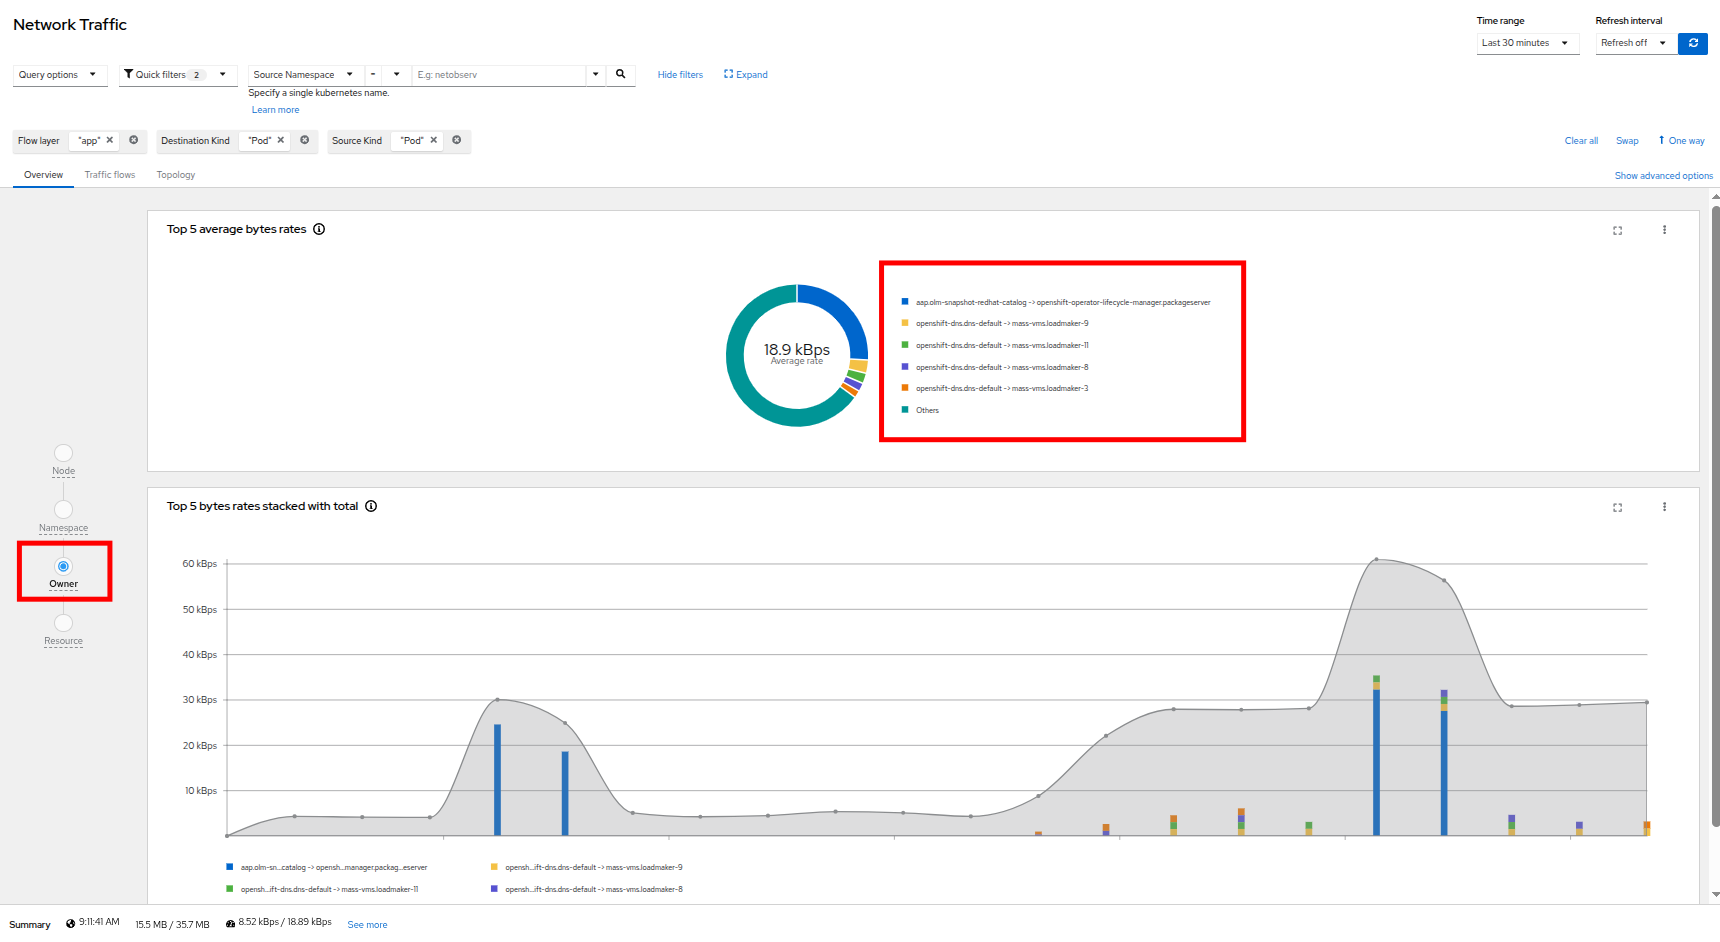 Figure 30. Network Traffic Owner
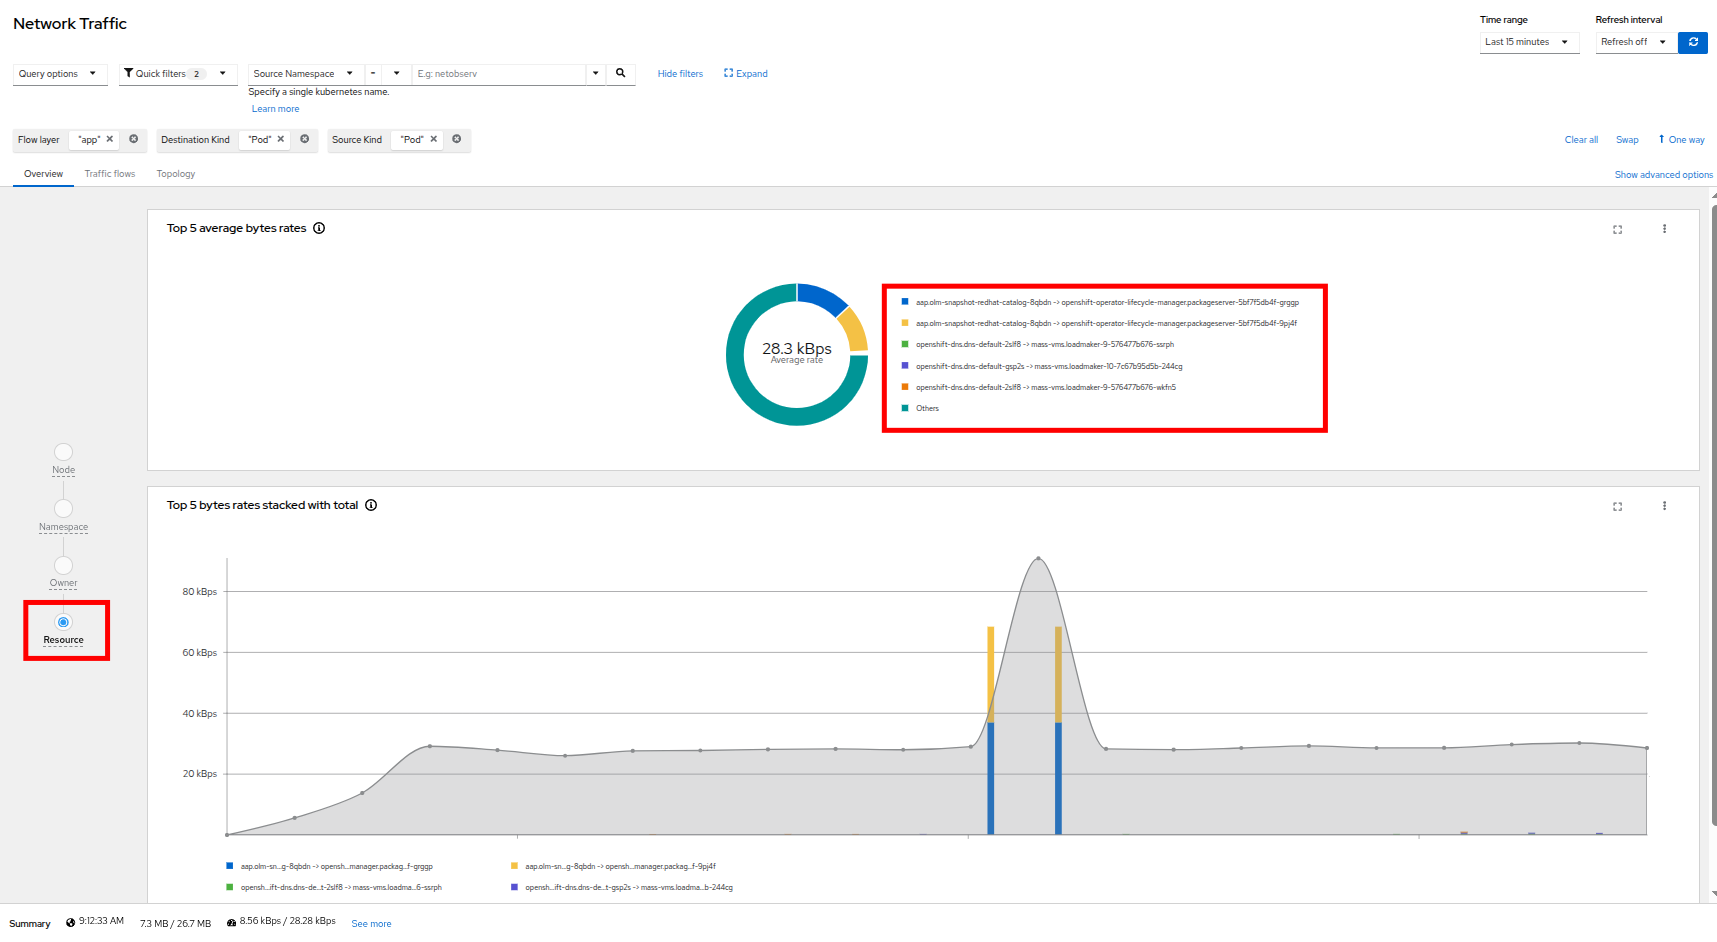 Figure 31. Network Traffic Resource
 -
The next thing we can dig down into is actual traffic flows across our environment, by clicking on the Traffic flows tab next to Overview. Here we can see records of each of the pods and namespaces that are initiating a network request, what port they are sourced from, and what destination pod, namespace, and port is receiving that. Set the refresh interval to 15 seconds so that we can see these requests update in realtime.
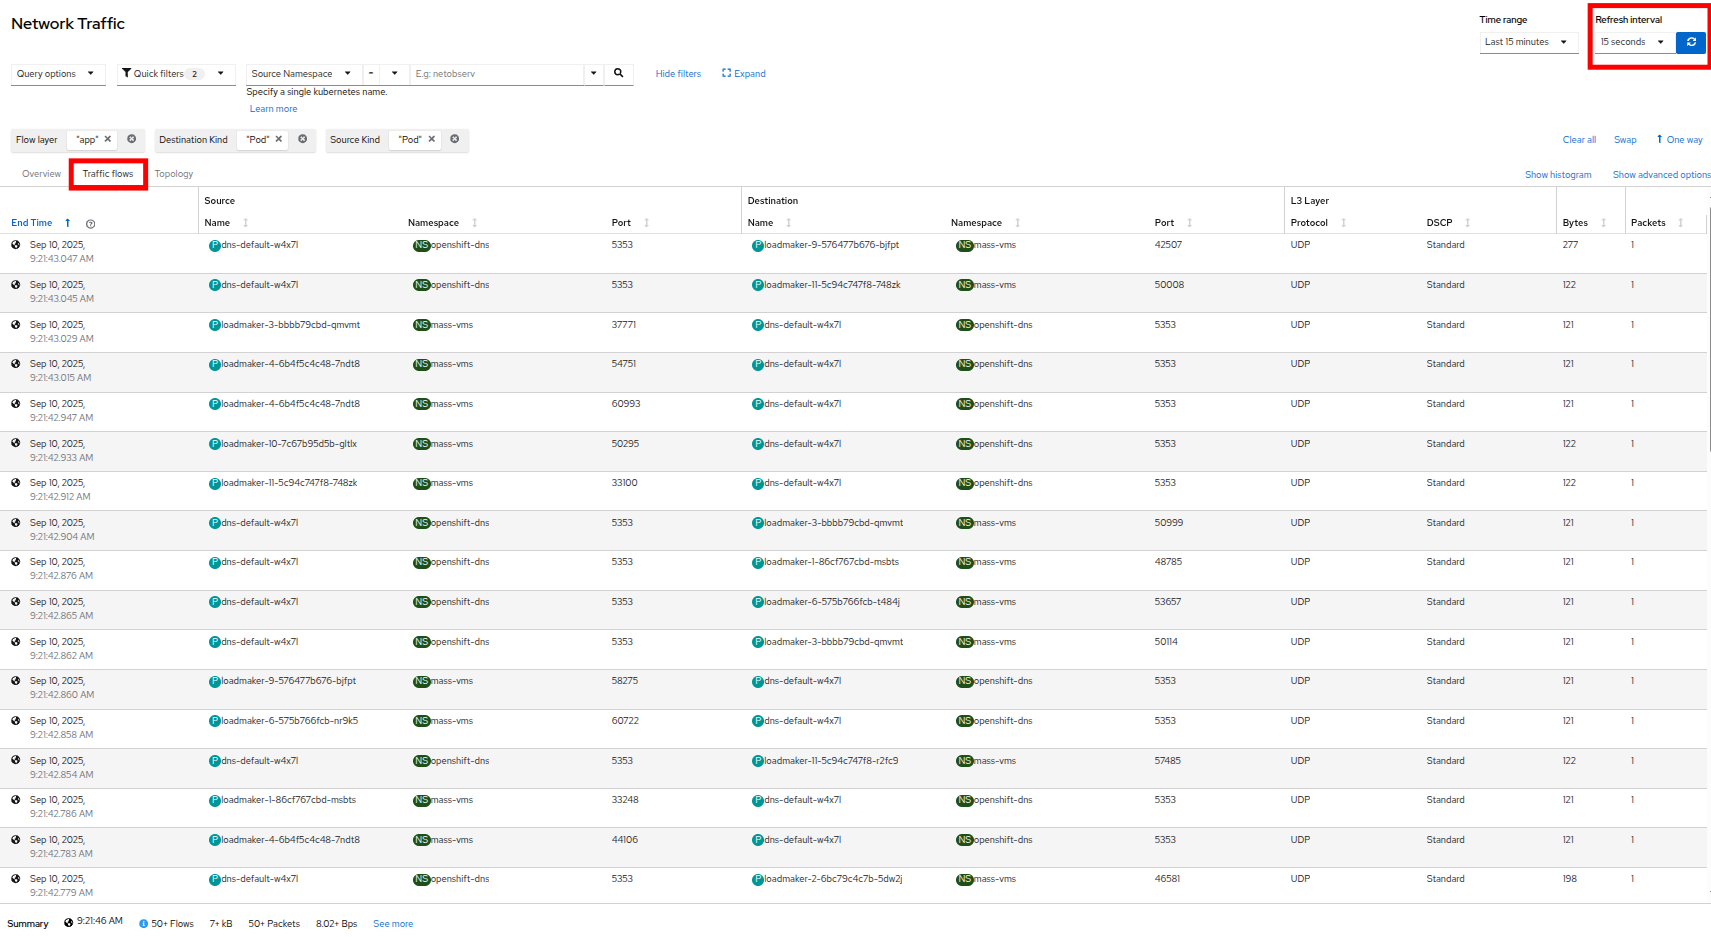 Figure 32. Traffic Flows
 -
An additional, but sometimes chaotic, graphic that is on our list is that of the topology map, which helps to visualize further incoming and outgoing traffic from specific pods. Like the Overview it can be sorted by Node, Namespace, Owner, and Resource. Click on the Topology tab to initalize this view, and sort by Namespace for a clean view of our cluster applications and their network traffic.
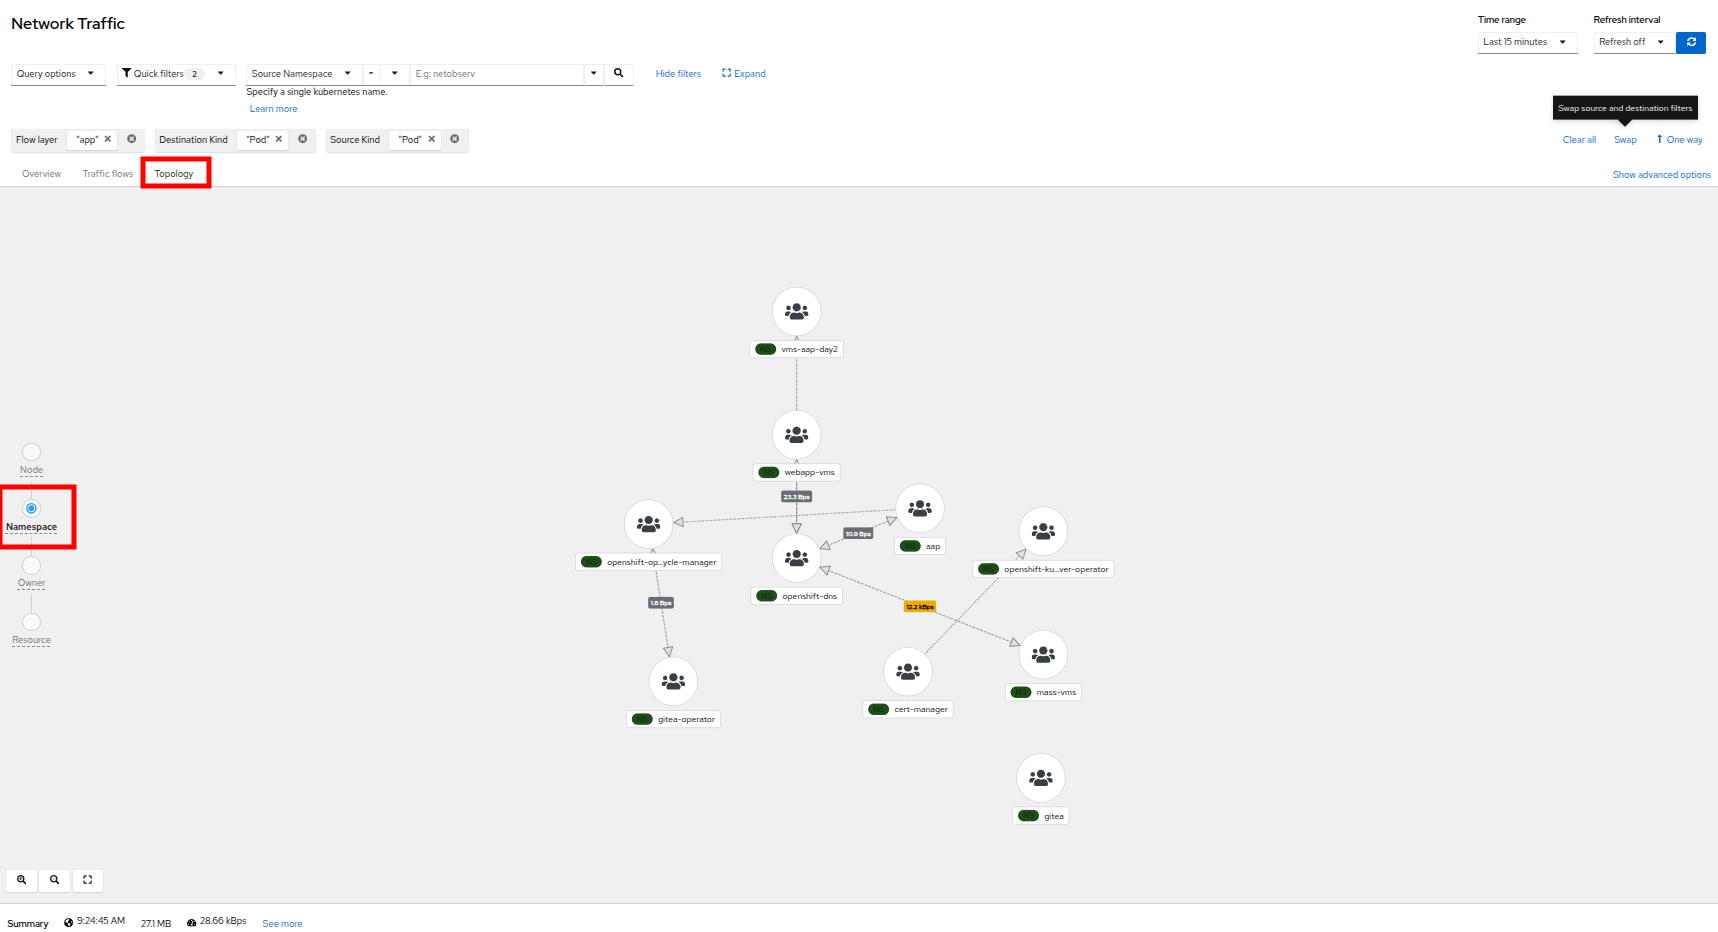 Figure 33. Topology Namespace
 -
For fun, click on Resource to see a more chaotic view. Please note that the icons on the graph can be clicked and dragged to make the view easier.
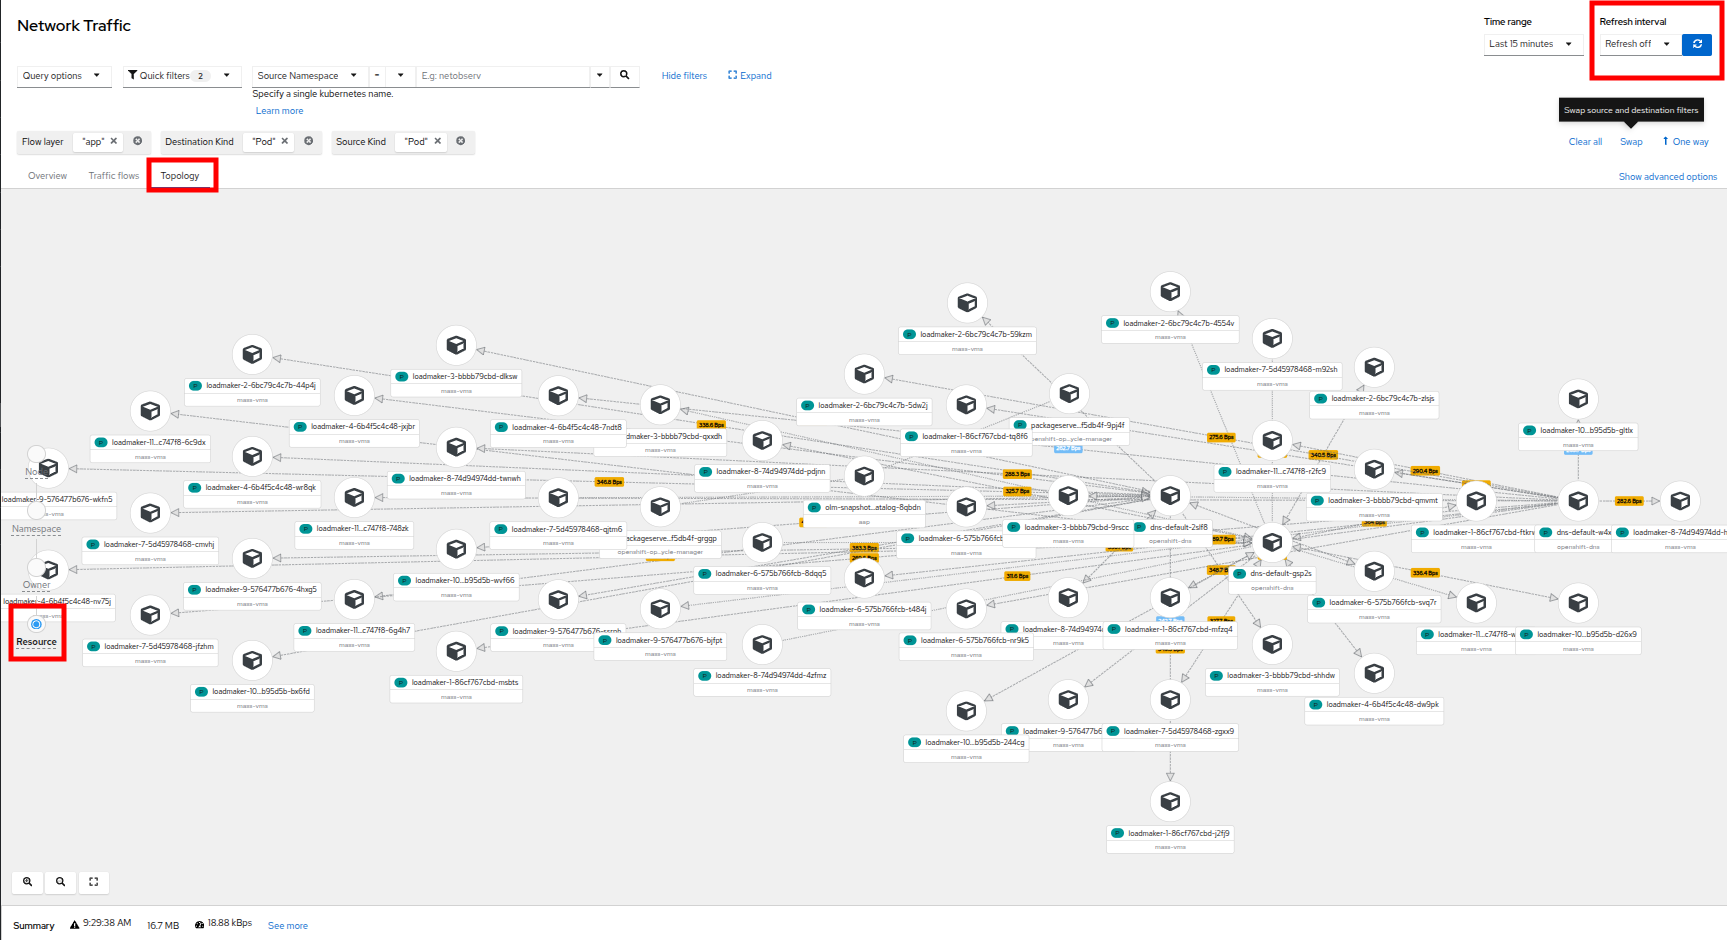 Figure 34. Topology Resource
It can be helpful here to turn off the refresh interval to have a chance to examine the graphs. -
It is also helpful to know that in addition to the Network Traffic plugin to the OpenShift console, that there are also default dashboards created for Network Observability, similar to the ones we used in module 1 for VMs.
-
To take a look at these click on Observe in the left menu, and click on Dashboards. From the Dashboard dropdown select NetObserv/Main.
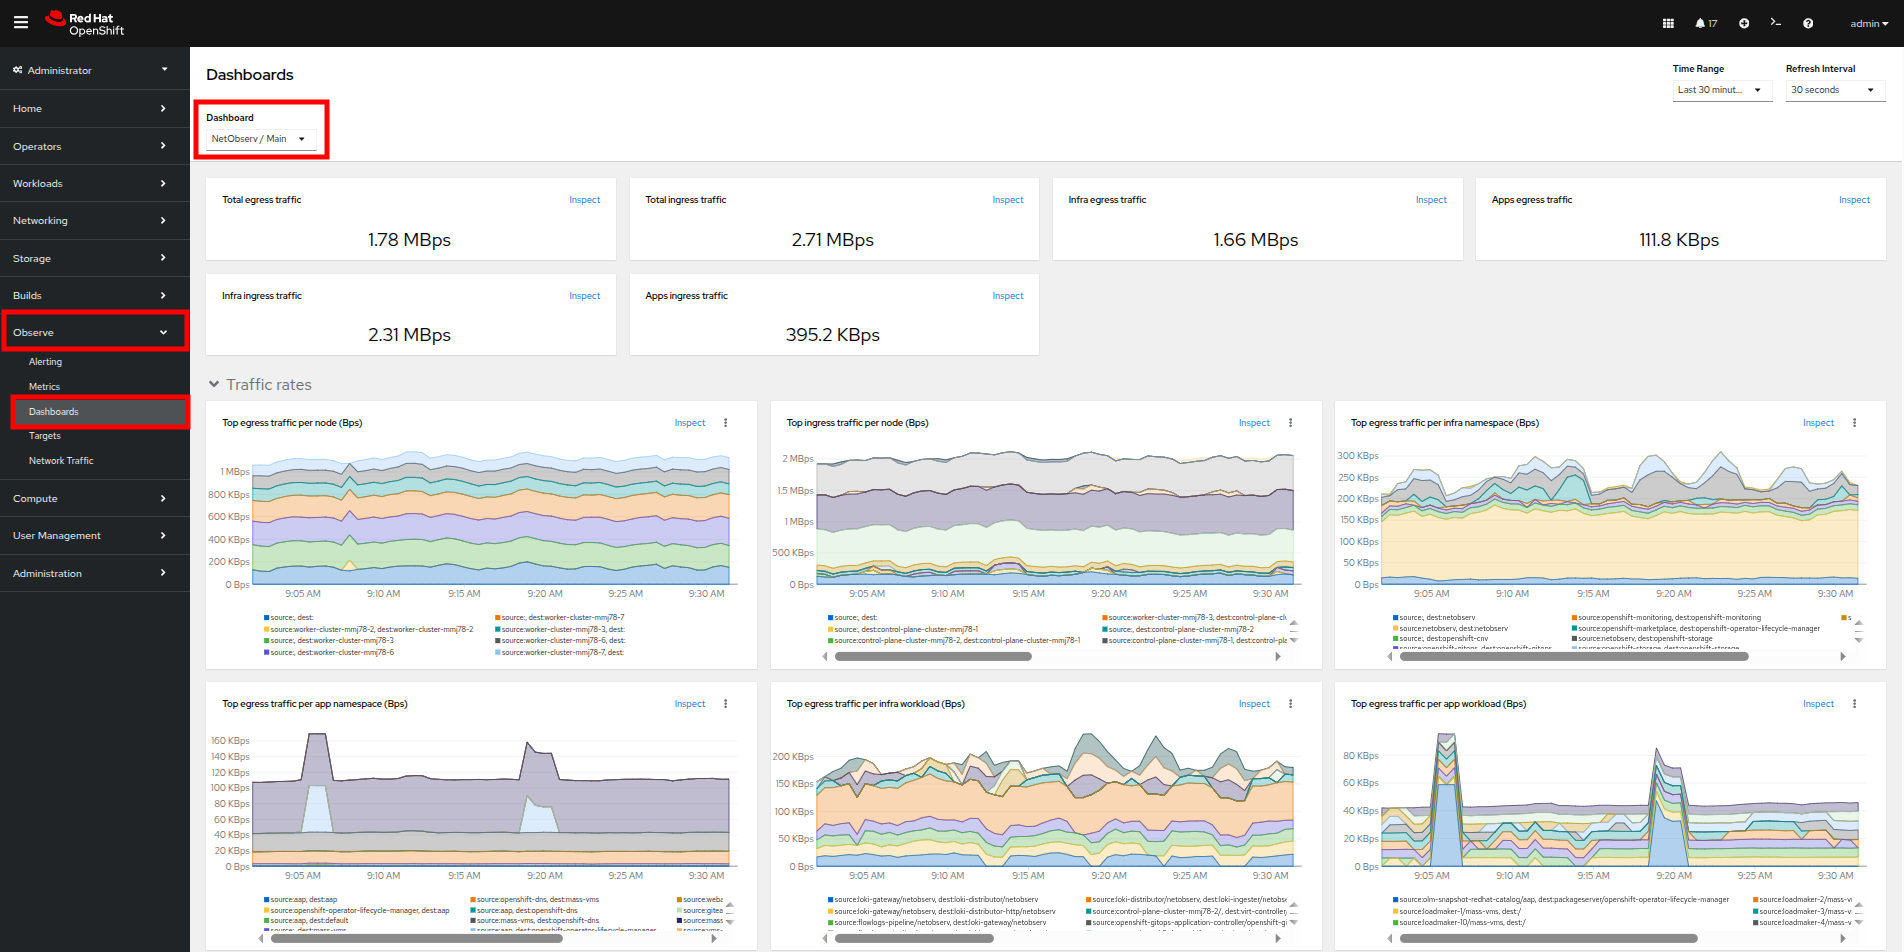 Figure 35. NetObserv Dashboard
 -
The dashboard provides a number of default graphs that would be useful to network administrators when trying to visualize the network traffic in their cluster.
The Network Observability operator is a very powerful tool for OpenShift that equips both network and virtual machine administrators to ensure the security of their environment, and confirm that no unexpected traffic is entering or leaving their cluster.
Summary
In this section we learned how to create and apply a simple network policy to block egress traffic from a virtual machine to a public website, and as an advanced example we learned to isolate traffic between virtual guests and projects on the same cluster by leveraging UDN’s native network segregation. We also took a brief look at the benefits provided by the Network Observability operator, and how it can make visualizing the network traffic flow in your cluster much easier.