Usage Analytics and Reporting
In this module, you’re stepping into the role of a technical decision maker or platform stakeholder - someone responsible not just for building AI services, but for understanding and reporting on their business impact.
You’ve deployed, exposed, and consumed a model. Now it’s time to ask:
-
How is it being used?
-
Who’s using it the most?
-
What’s the cost and what’s the return?
Let’s walk through how to leverage a Grafana dashboard and platform level metrics from the Prometheus observability stack to answer those questions.
Why This Matters
As AI adoption grows, visibility is critical. Organizations need to track:
-
Model/API usage by team or model
-
Call volume over time
-
Popular endpoints
-
Cost-to-value
-
Infrastructure impact (e.g. GPU usage)
This insight enables:
-
Cost attribution (per team, per model, per environment)
-
Capacity planning (predict future infrastructure scaling needs)
-
Understanding ROI for AI workloads
Check Model Usage
-
Go to the
Grafanaapplication from your cluster’s navigation menu:
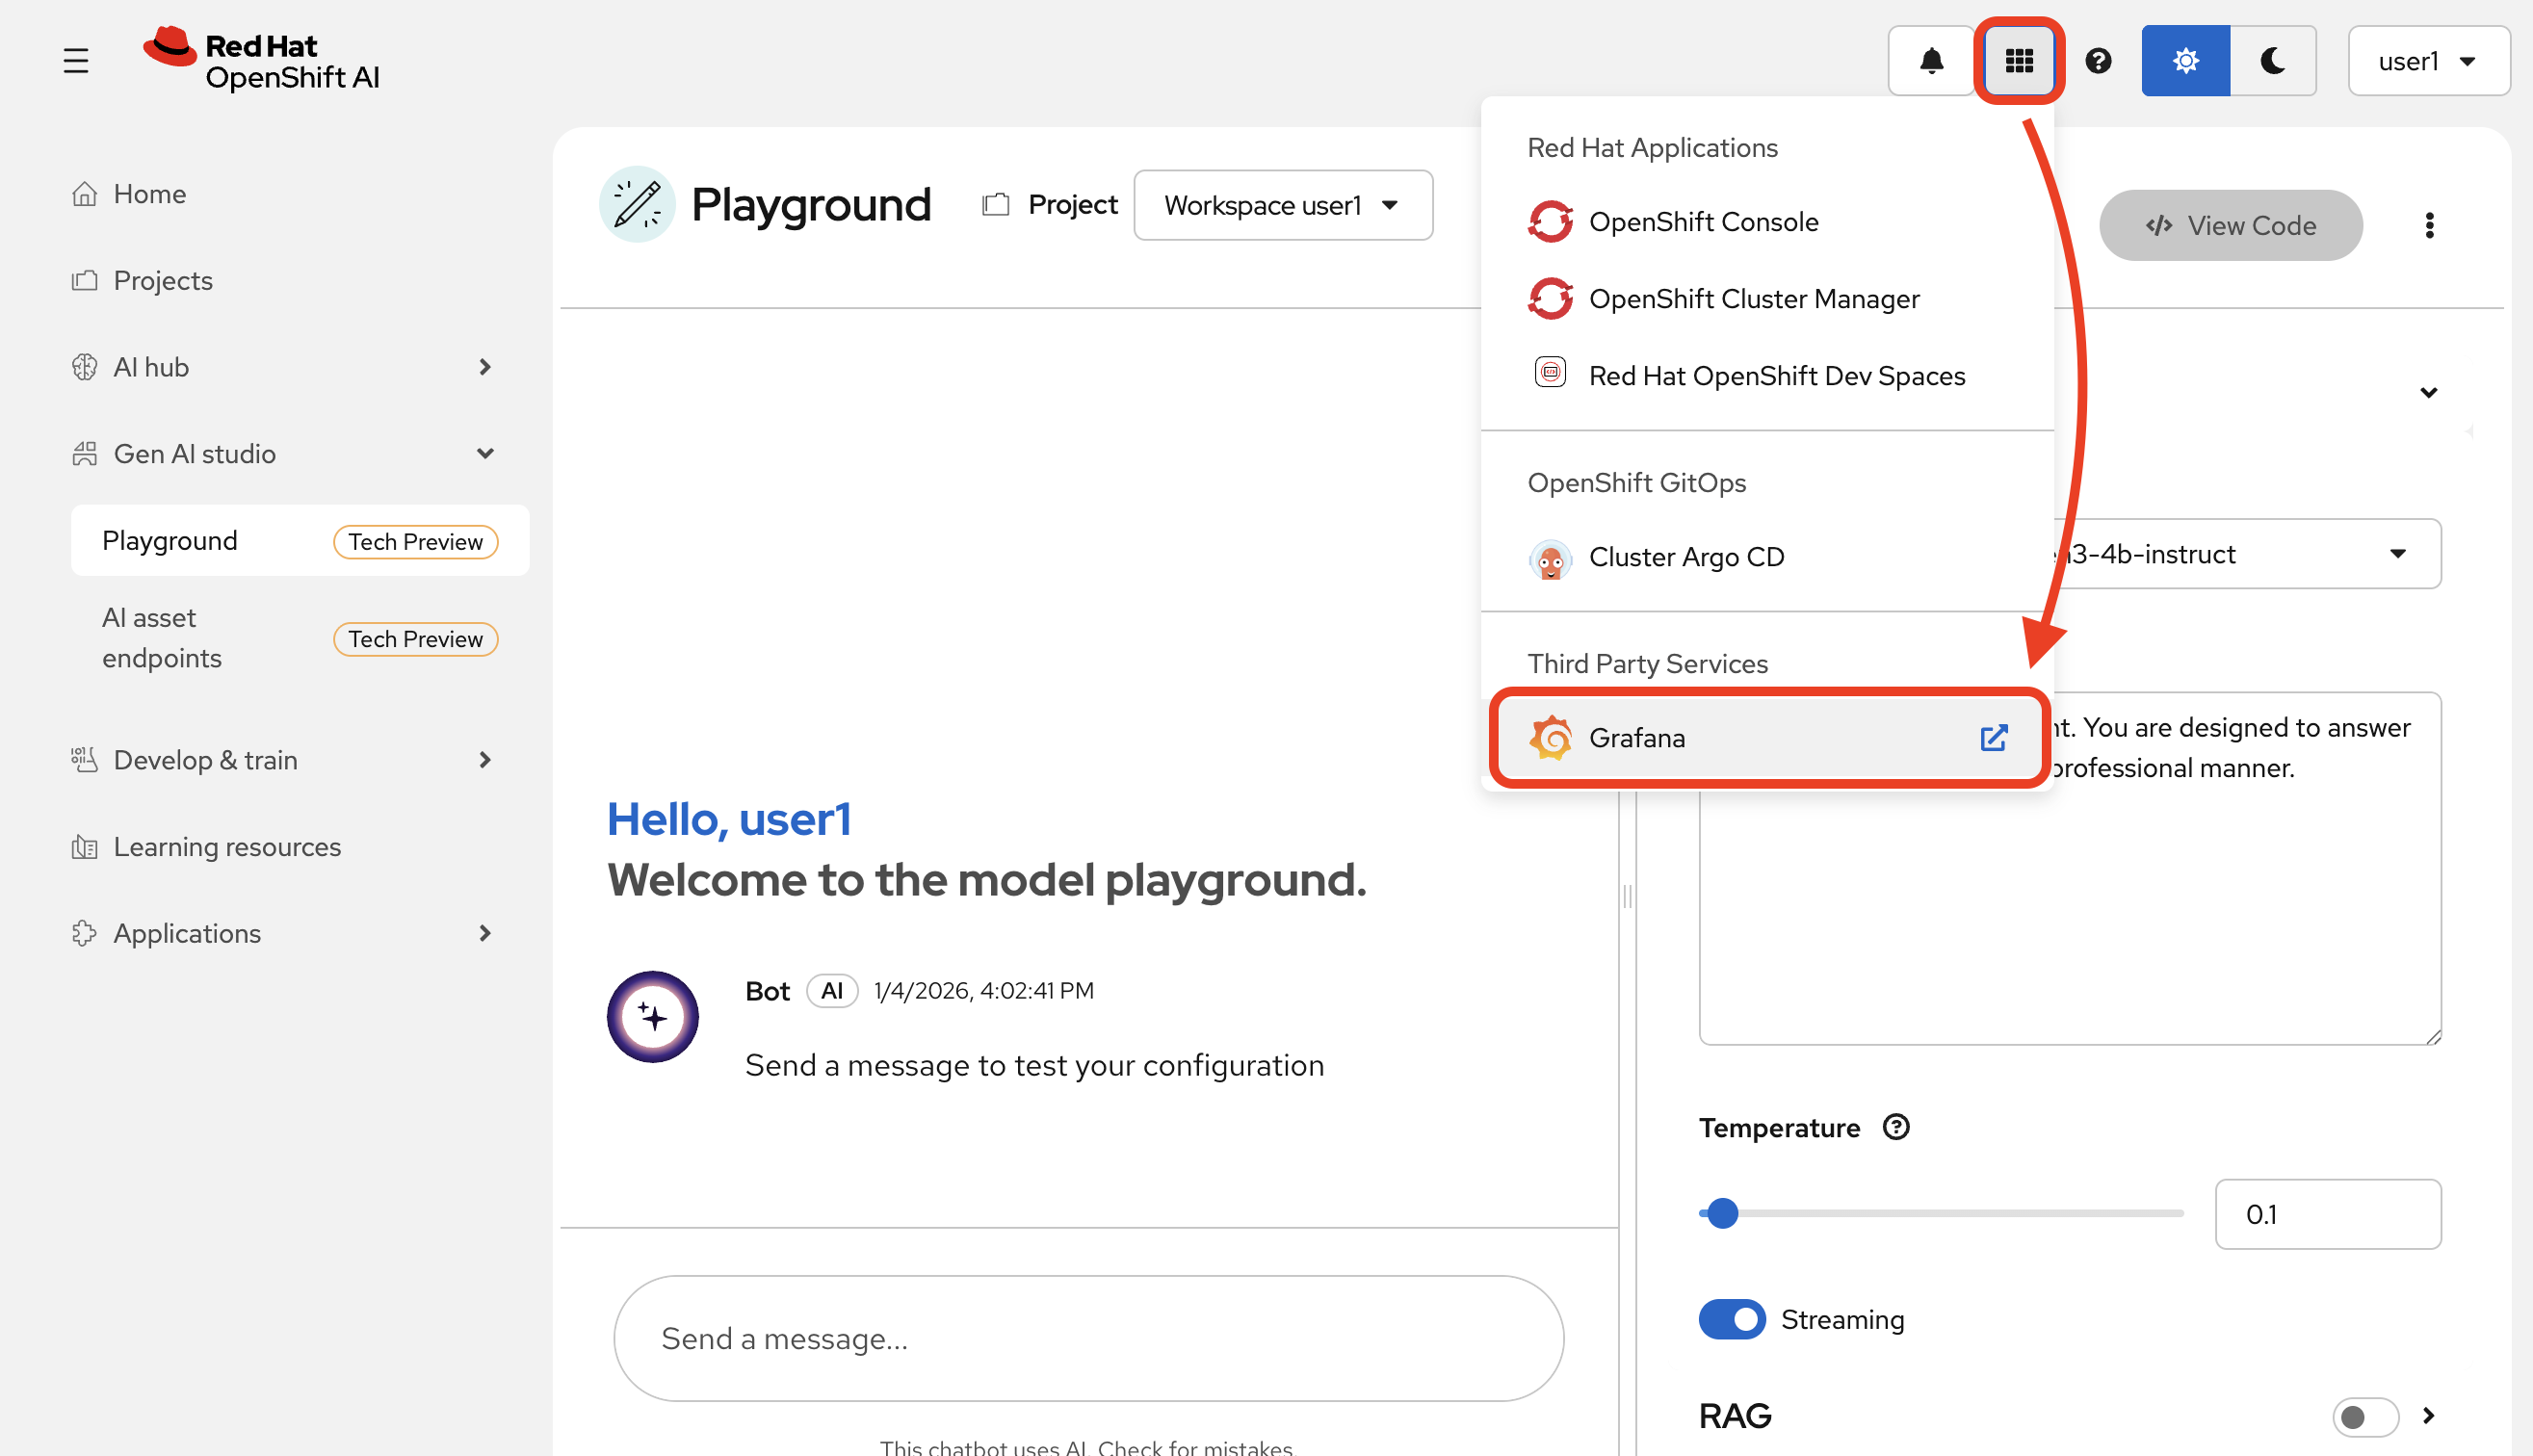
-
Select
grafanafrom the dashboard page.
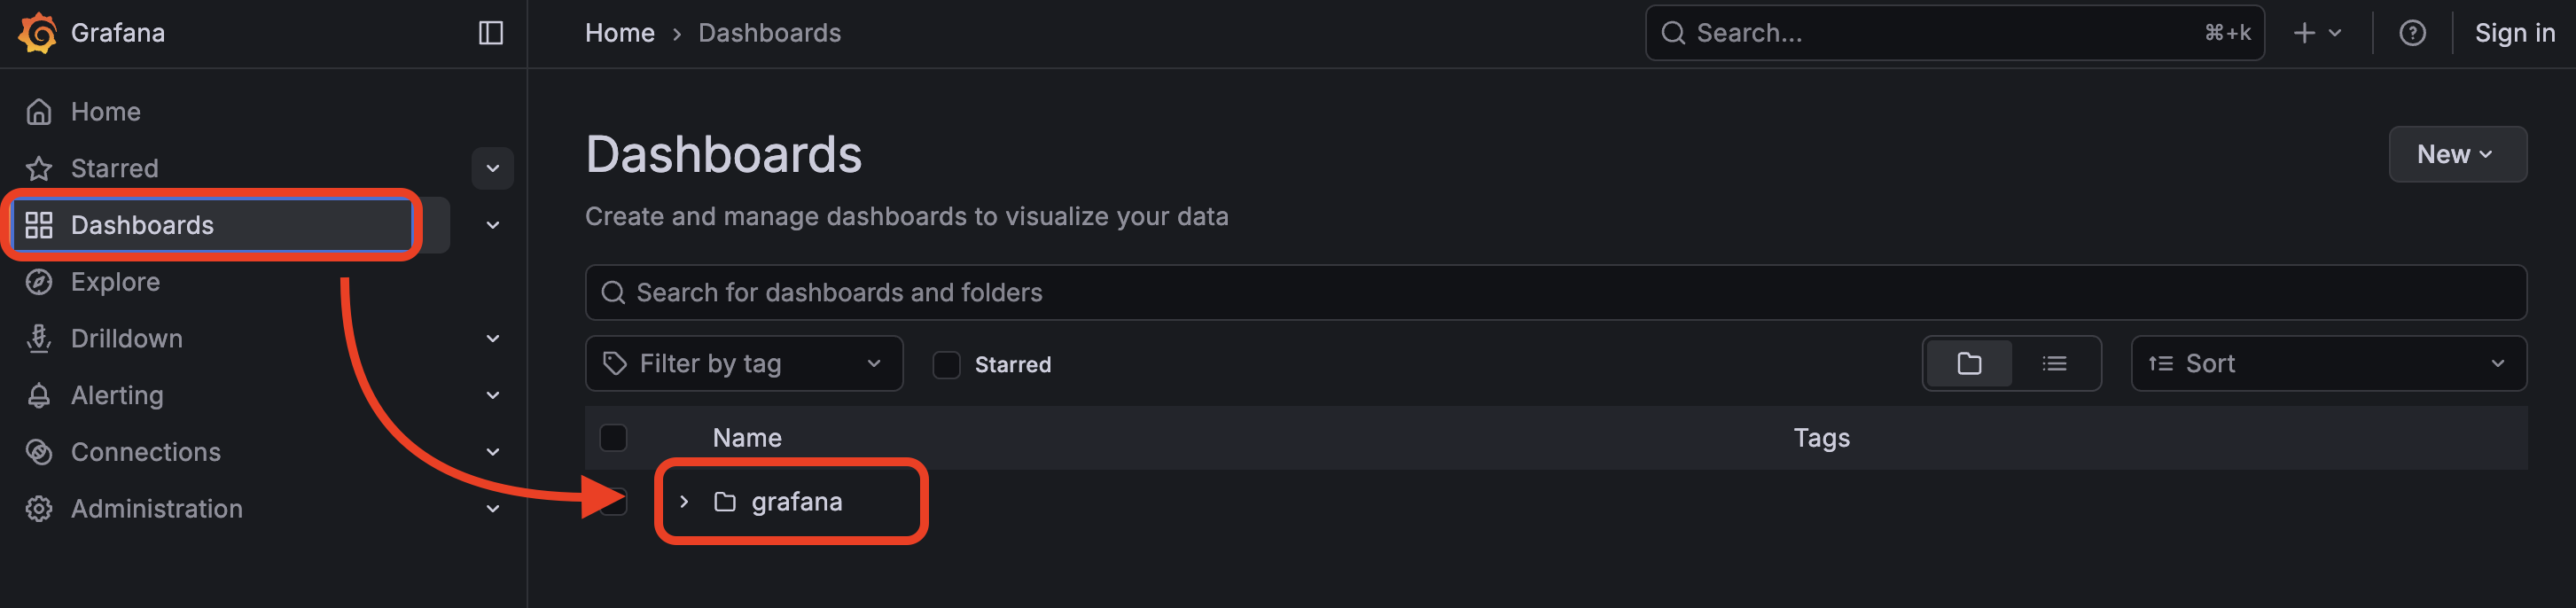
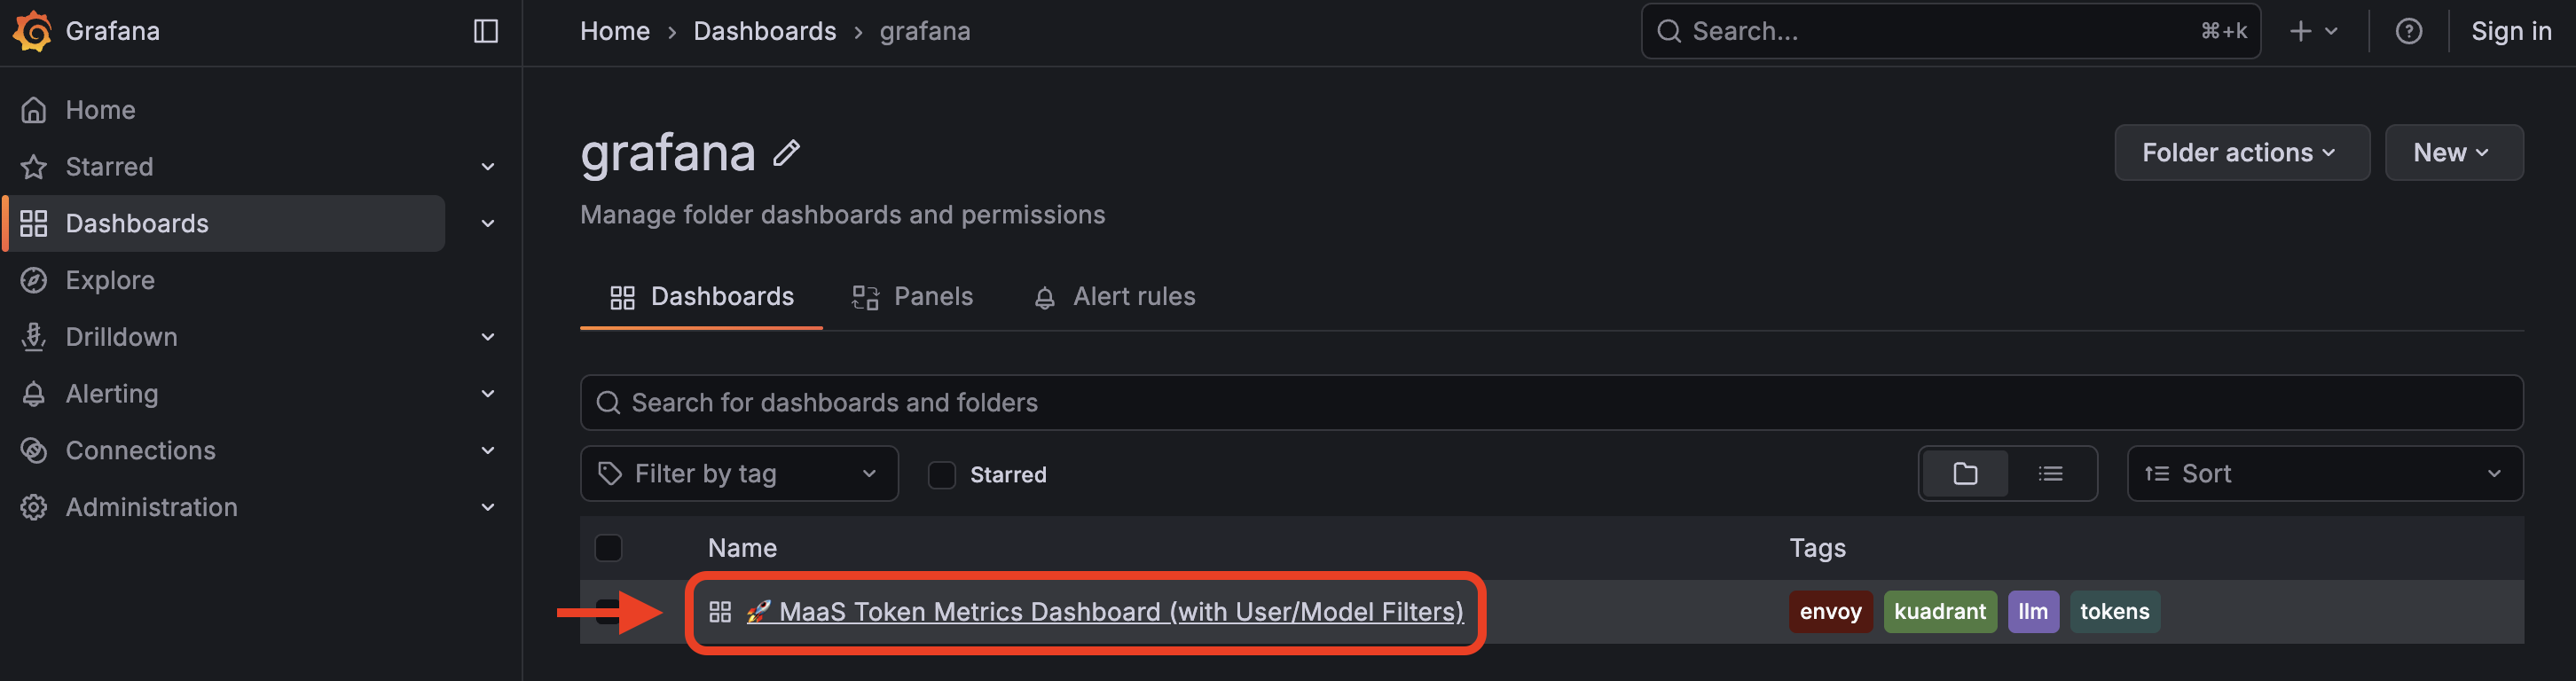
-
Select
MaaS Token Metrics Dashboard
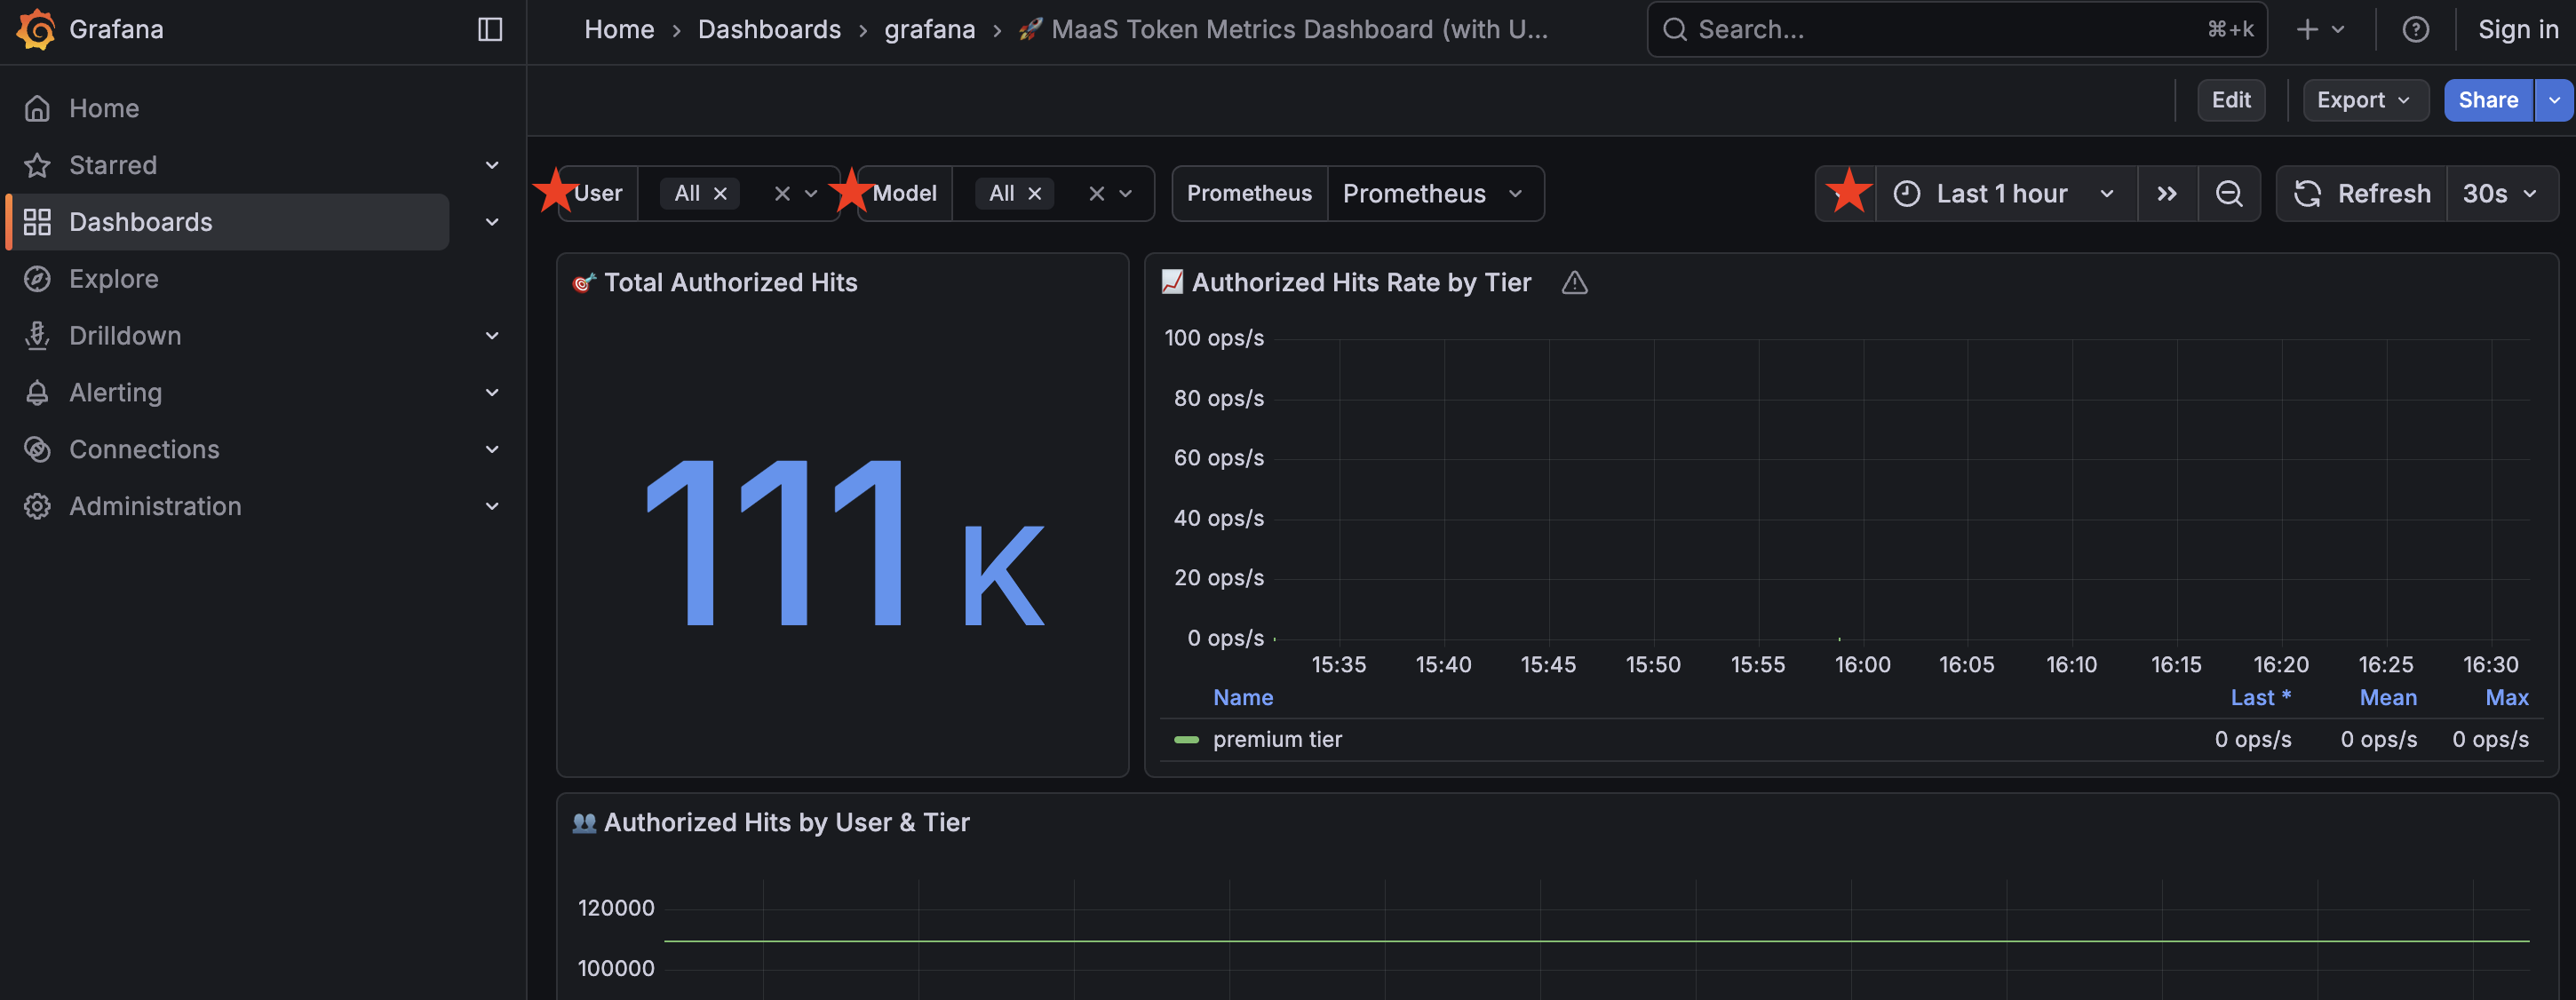
Grafana has access to view all user metrics, so you will see other users in the dashboard stats in addition to yourself (assuming other users in the cluster have used the model at this point in the workshop!).
You may filter information based on user, model (we only have one in this workshop), as well as time frame.
Understanding the data
Total Authorized Hits
This represents the total token count.
Authorized Hits by User and Tier
Separates token count by selected user and their tier (in this case, all users are given the Premium tier)
Top 10 Users by Hits
Top users based on token usage.
Hourly Authorized Hits by User
Token usage, in hourly increments, filtered by user.
Total Authorized Hits by Tier (Time Range)
Token usage filtered by tier in a given time range.
Top 5 Users by Cost (Based on Tier Pricing)
Top users based on cost, as determined by tier pricing.
Detailed Metrics Table
Dive into the details of each user in this table.
Using the data
In a dashboard like this (you can create your own based on your organization’s needs), you can view the statistics of any model you have deployed in use and monitor their usage over time.
This helps you monitor how your AI service is actually being used by your teams.
Usage metrics aren’t just operational, they inform:
-
Future capacity planning
-
Internal billing models (chargeback)
-
Service quality assessments
-
Product direction based on user trends.