Declarative IaC for Automating VM Resources
Introduction
One of the advantages of OpenShift and Kubernetes is that its configuration is managed with declarative YAML manifests. The configuration of VMs running on OpenShift is the same. In other systems, automating the creation of new virtual machine instances or managing the configuration of existing virtual machines often requires an understanding of complex IaC languages.
In this module you will increase the CPU resources dedicated to a VM using techniques easily adopted by any IaC system.
Verifying Initial CPU Core Count
-
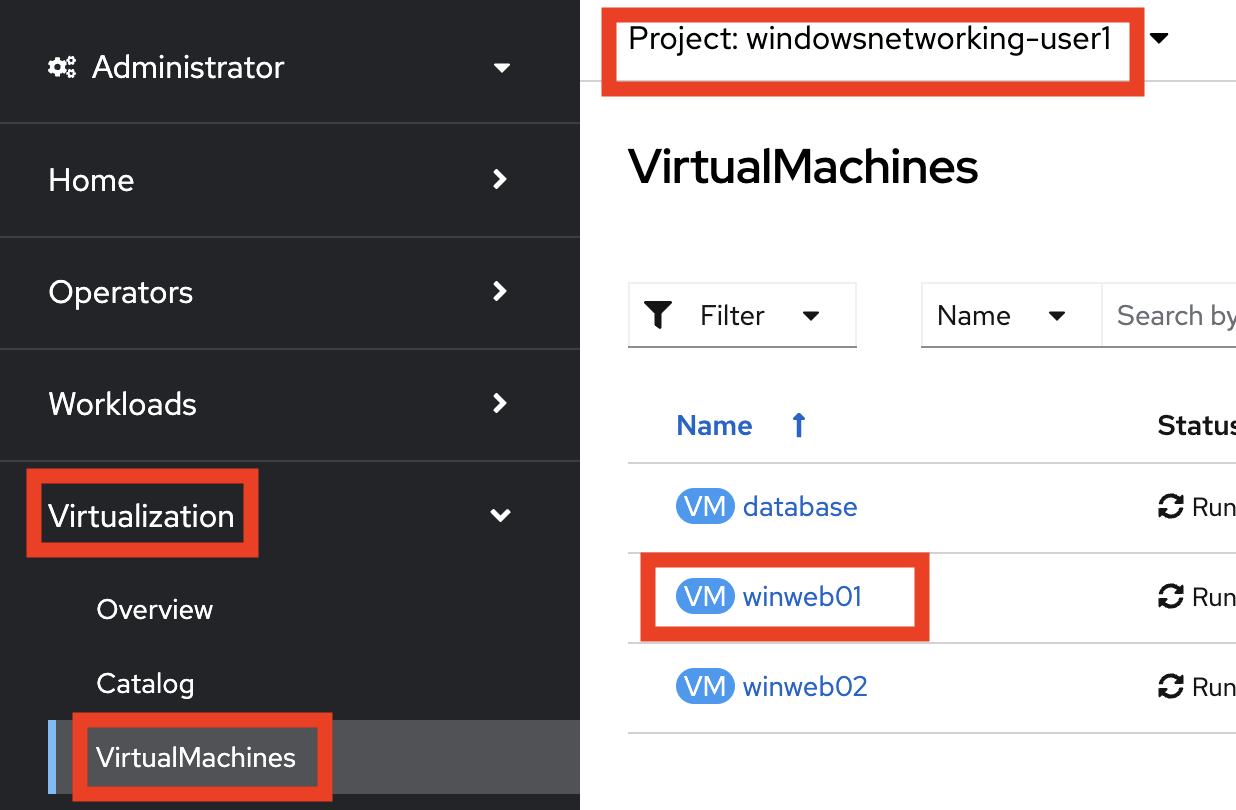
To find the VM to change, click on the left bar, click Virtualization → VirtualMachines On the top bar, select the Project
windowsnetworking-sample_username. -
Click on the
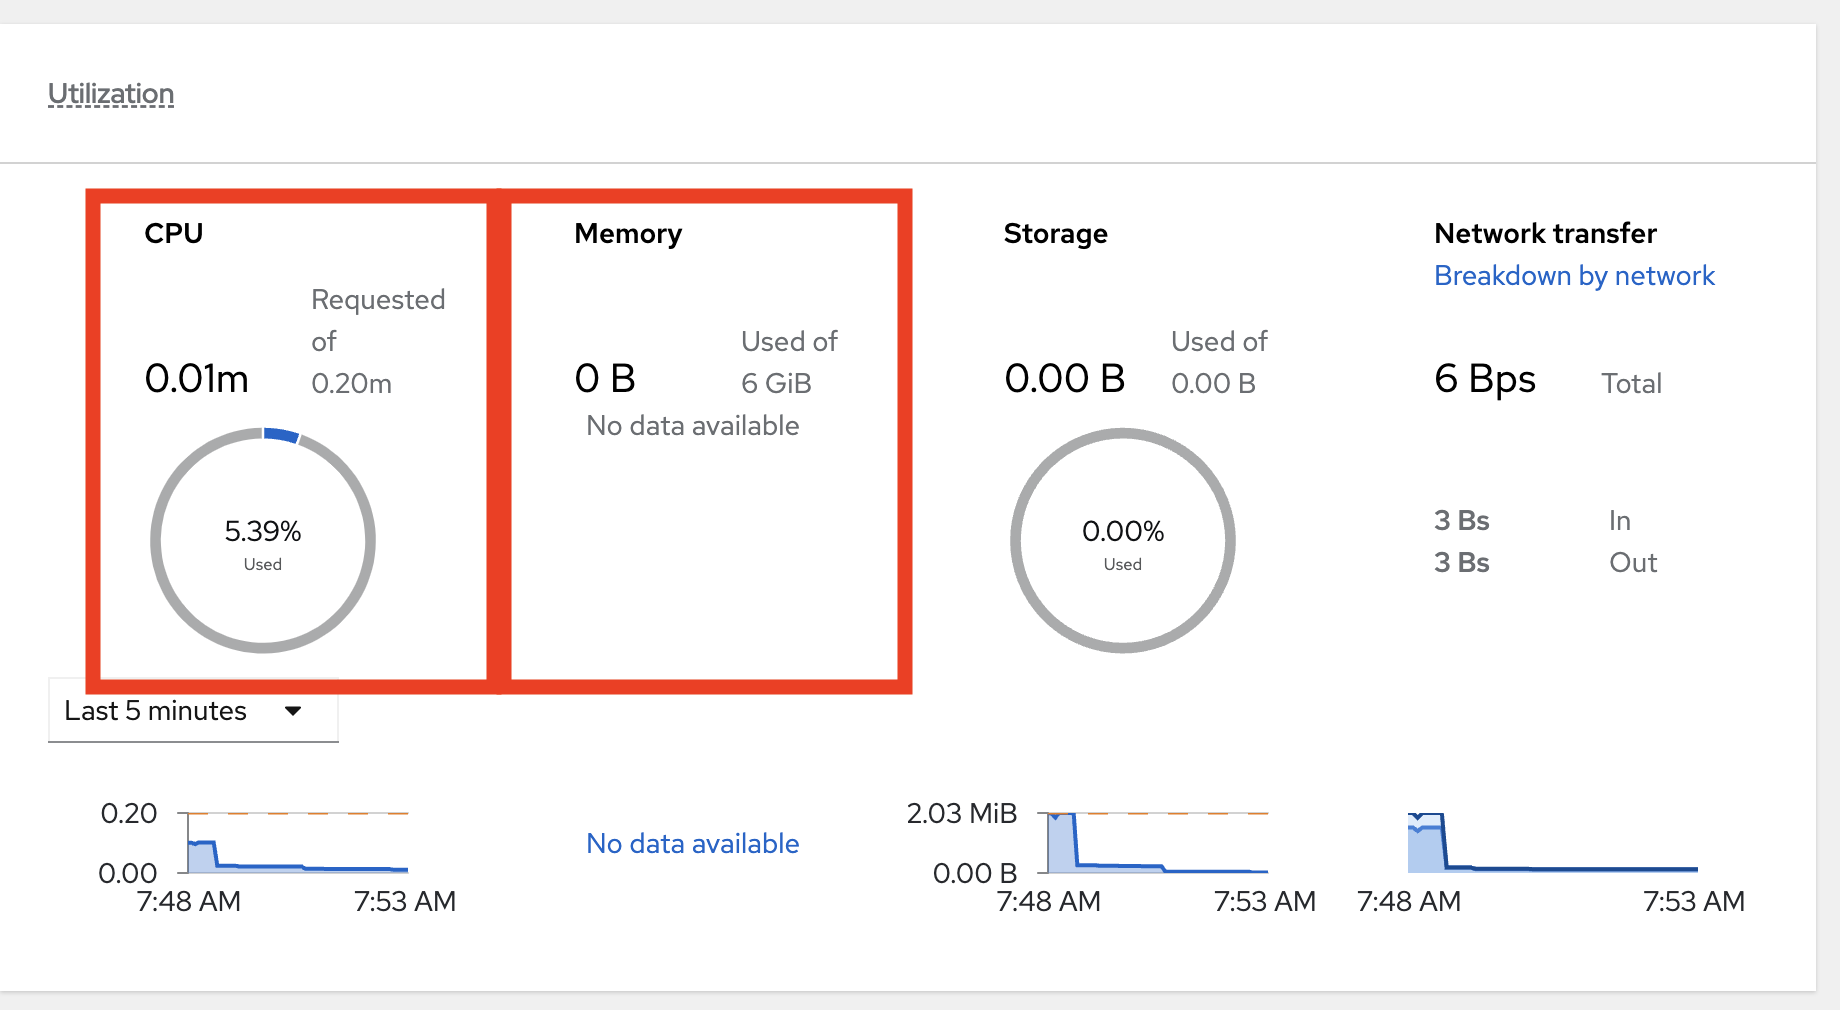
winweb01VM. Notice the CPU | Memory section on the Overview tab. -
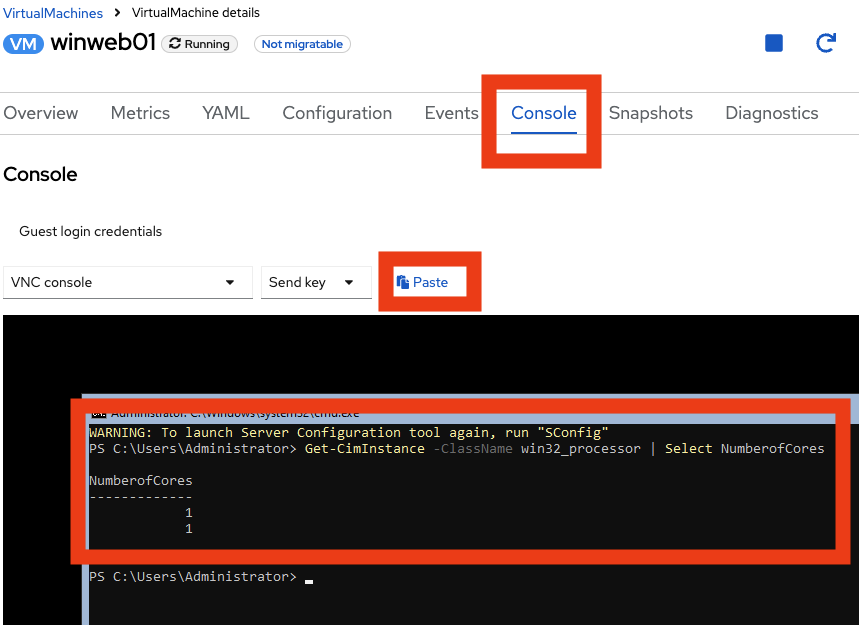
Verify the number of cores via powershell in the
winweb01console. -
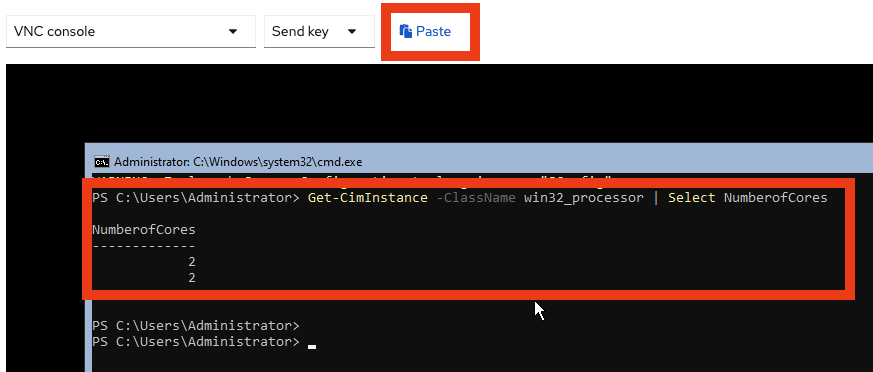
Now paste it into the VM console with the Paste button.
Increasing CPU Core Count
-
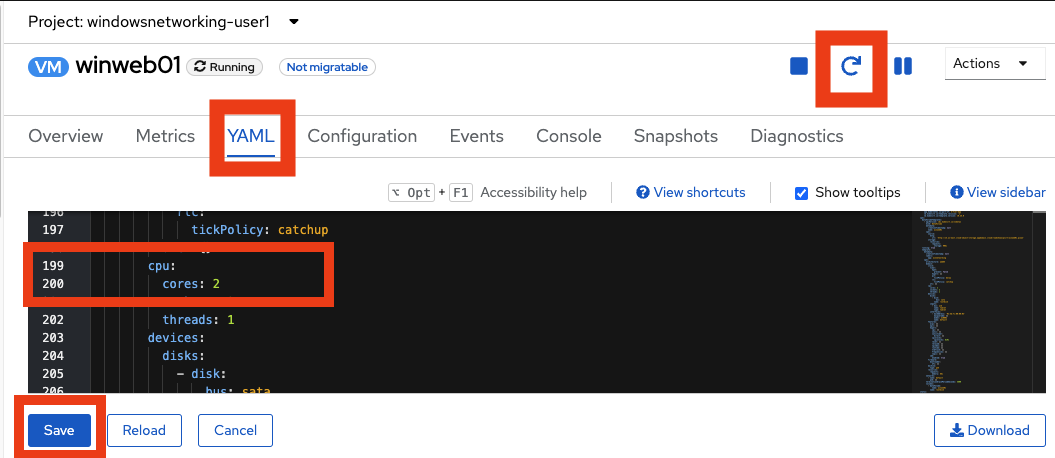
To increase the CPU core count via IaC, click the YAML tab and scroll down until you see
cpu. On approximately line 190, modifycoresto increase the core count from 1 to 2. -
Click Save
-
To restart the winweb01 VM, click the circular arrow ↻.
-
Wait for the
winweb01VM to restart. -
Verify the number of cores via Powershell in the
winweb01console.-
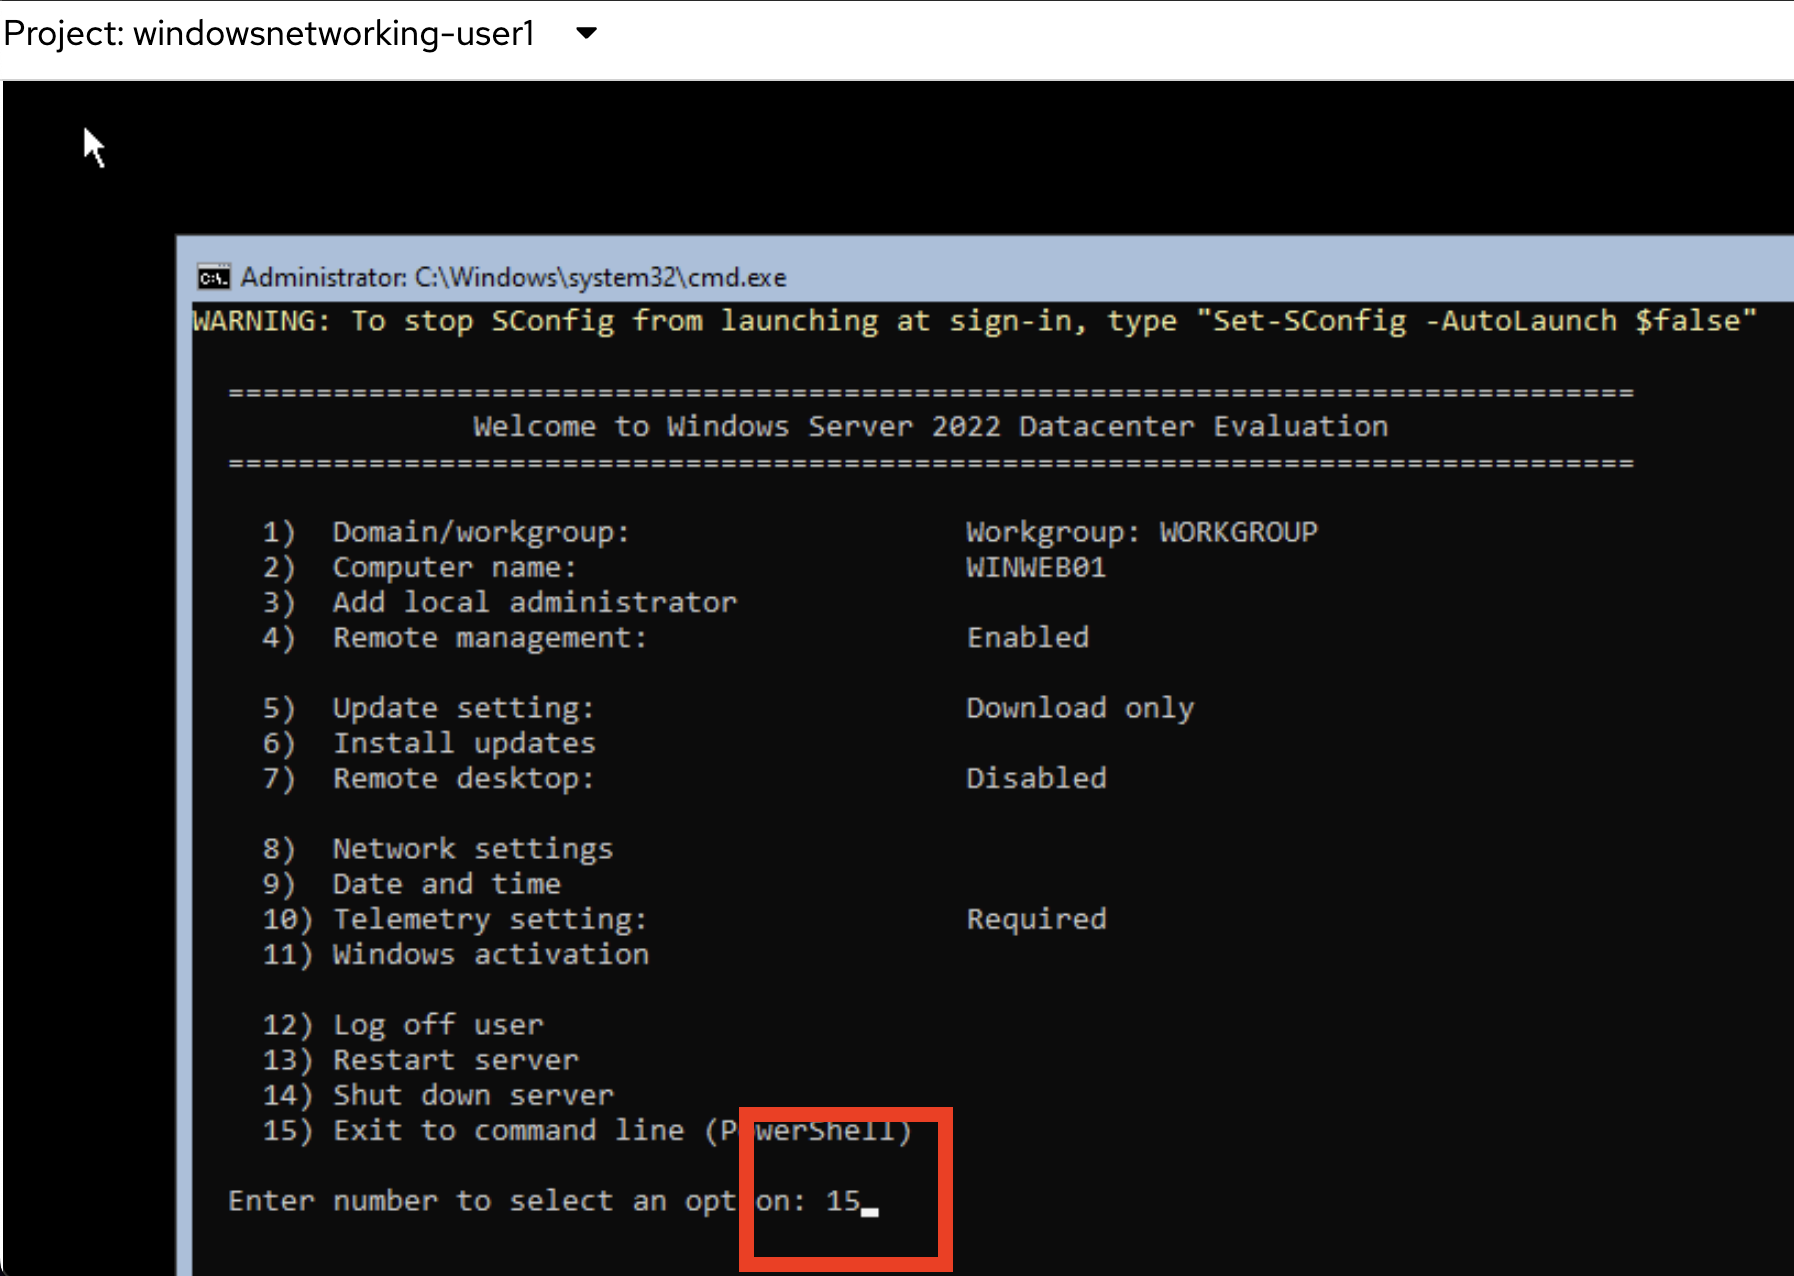
Click on the Console tab, and click into the black console box to activate input into the VM console.
-
As before, start Powershell by entering 15 in the menu.
-
To reveal the new number of cores, Copy/Paste the following command into the VM console with the Paste button.
Get-CimInstance -ClassName win32_processor | Select NumberofCores
-
You can also use Infrastructure as Code to trigger the necessary restart.
You could implement a pipeline that reconfigures the virtual machine, then uses a Job running virtctl to restart the virtual machine.
|
