Module 6: Istio Traffic Management
In the world of containers, service mesh (or Isitio more specifically) is considered one of the most desirable and transformational kubernetes features. Whenever we talk about service mesh, it’s in the context of words like modernized, 12 factor, SOA and containerized apps - never with legacy virtual machines.
UpLift and Shift is about giving additional feature functionality without requiring rewriting or replatforming your applications.
Imagine the situation where a web application is running in Windows IIS and customers are reporting intermittent errors/latency. What tooling exists for those legacy virtual machines to troubleshoot?
In this final section, we’ll show how we can use the advanced network telemetry from Istio and Kiali to easily troubleshoot these issues with our legacy windows virtual machines.
Access Kiali
-
Log in to the Kiali web interface with your username
sample_usernameand passwordsample_password. -
Within Kiali, click Services on the left.
-
From the namespace drop-down on the top bar, select your namespace:
windowsmesh-sample_username. -
Notice that we have a service called
winmesh.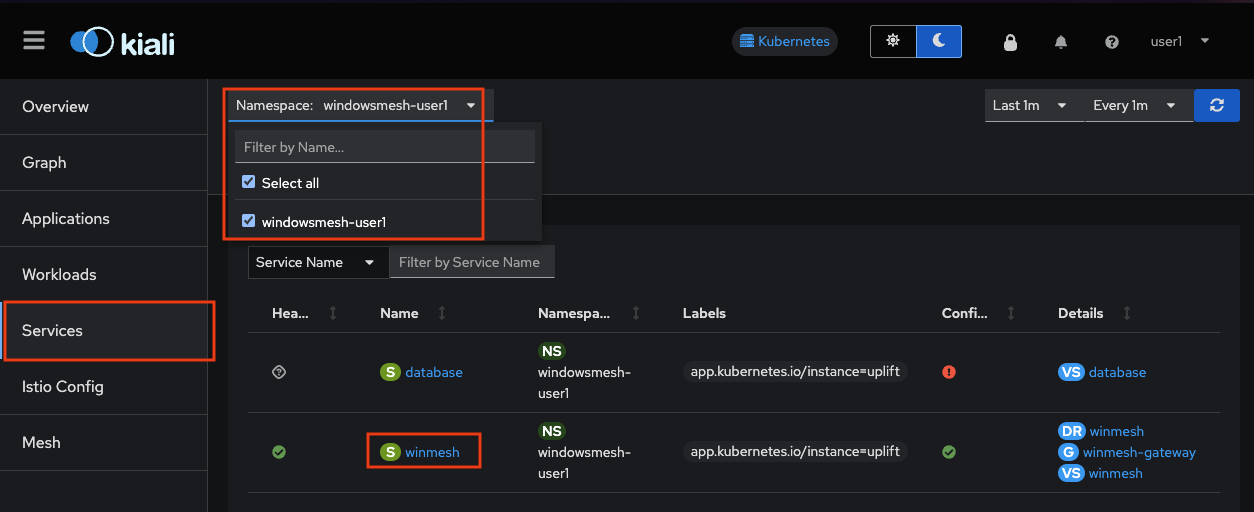
-
Click the
winmeshservice - notice that there are two workloads, which are our virtual machines,winweb01andwinweb02. Though named similarly, these are different virtual machines from the earlier modules virtual machines. They have OpenShift Service Mesh enabled, and are in a different Project/namespace.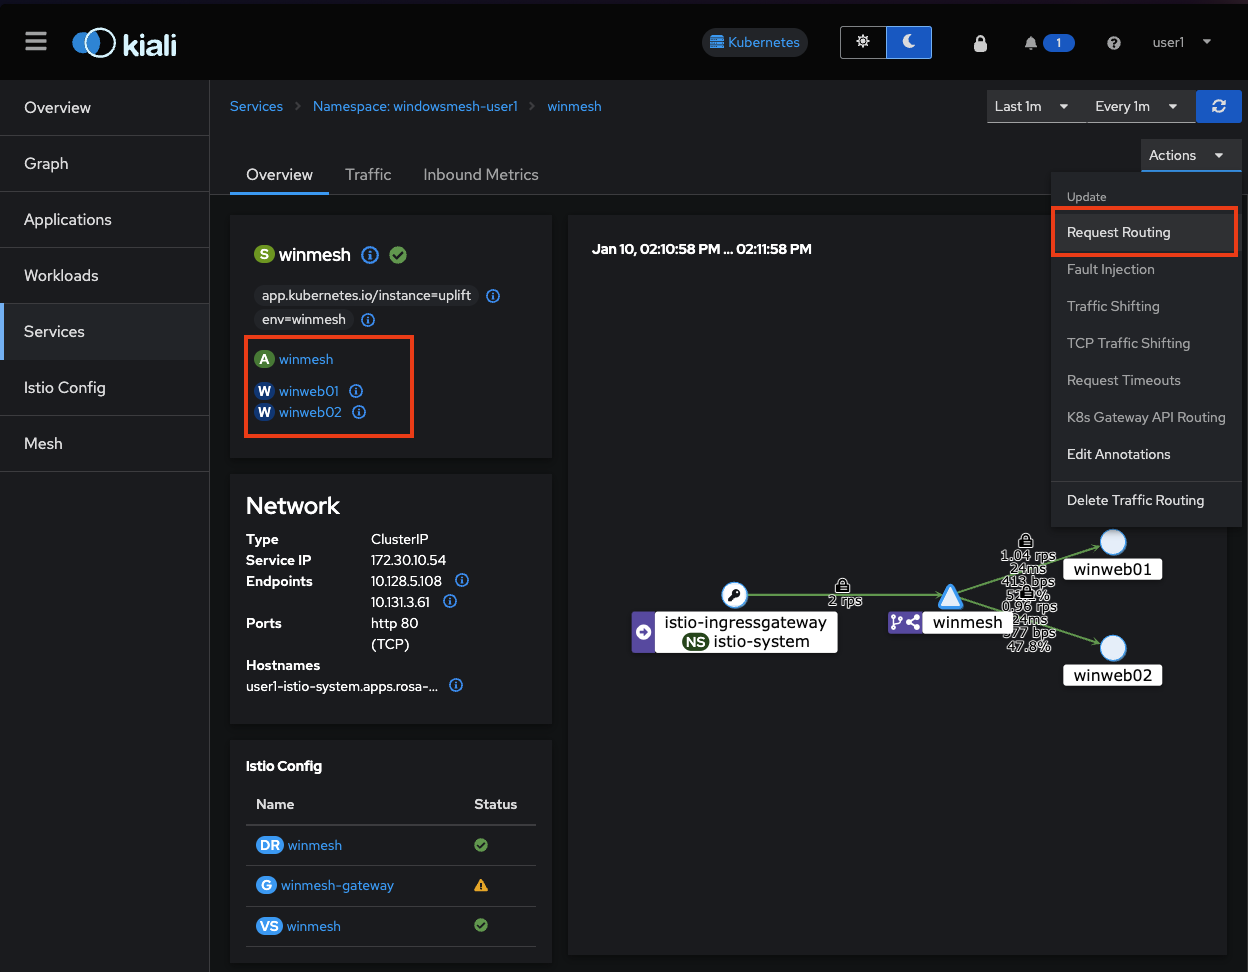
-
In the top right corner, click Actions and Request Routing
-
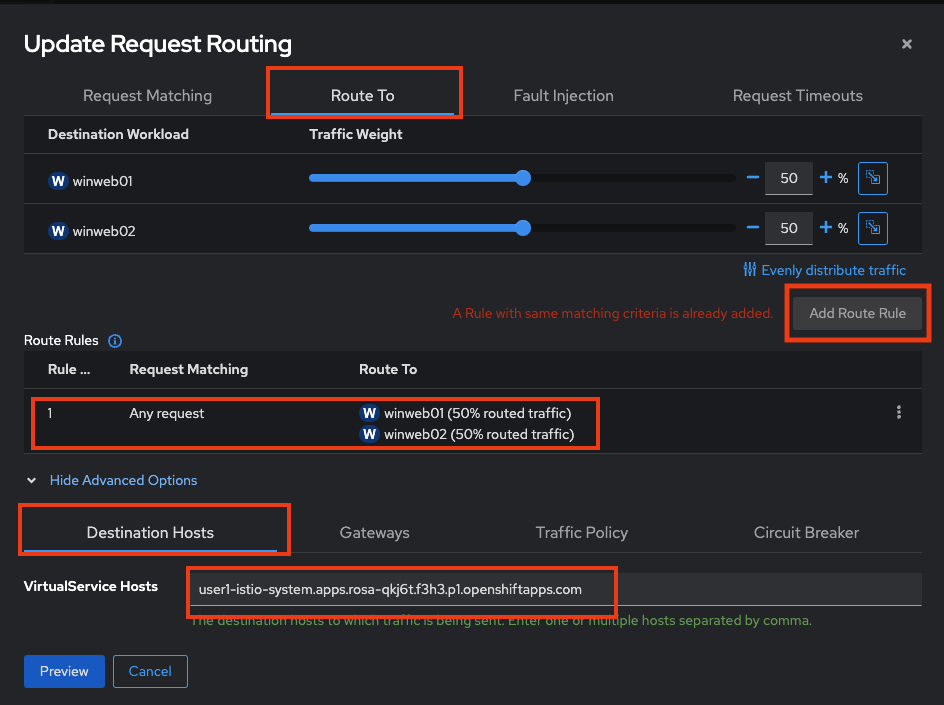
Now examine the existing Request Routing configurations.
-
Click Route To and notice the two virtual machines are listed.
-
Notice that there’s already a Route Rule to do 50/50 load balancing.
-
Click Show Advanced Options at the bottom. Notice the VirtualService Hosts are prefixed with your username: sample_username.
-
-
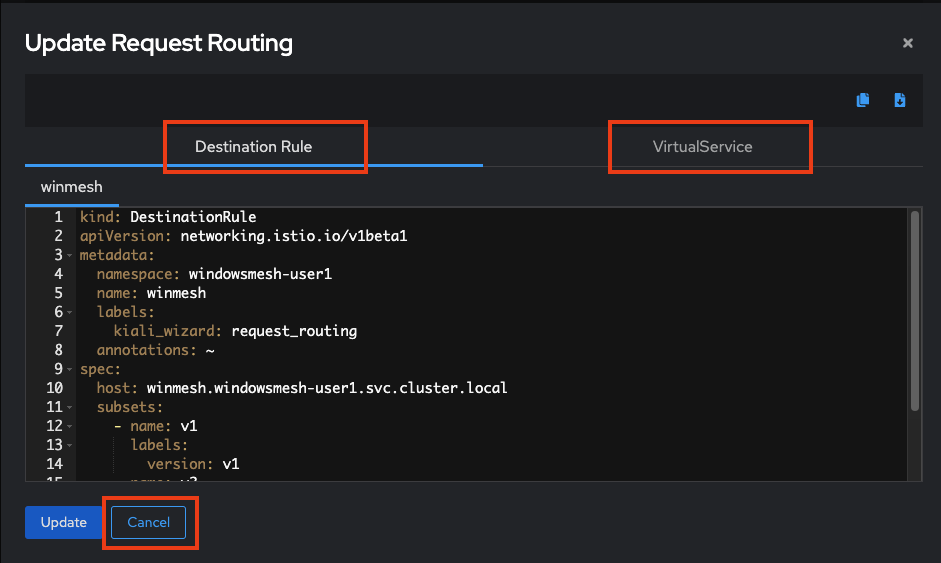
Click Gateways and click Add Gateway. Click Create Gateway then click Preview.
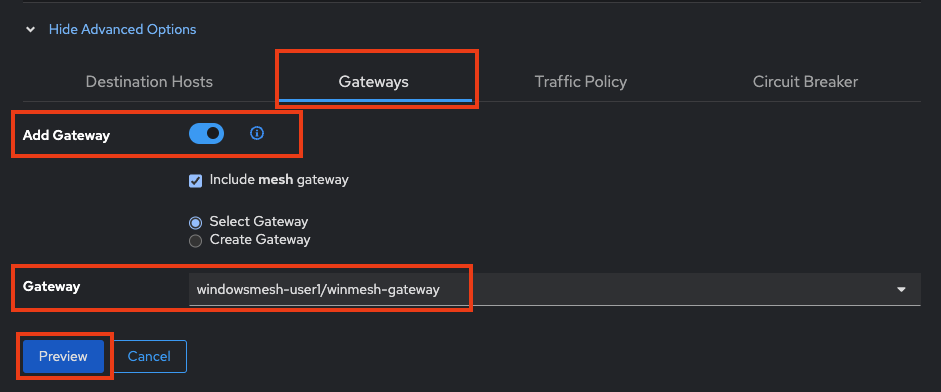
In the Preview popup window you’ll see the DestinationRule and VirtualServices. The DestinationRule indicates which resources will be part of the VirtualService. The VirtualService indicates what percentage of traffic is routed to each of the destinations.
-
There’s no need to change any of the settings, so just click Cancel.
-
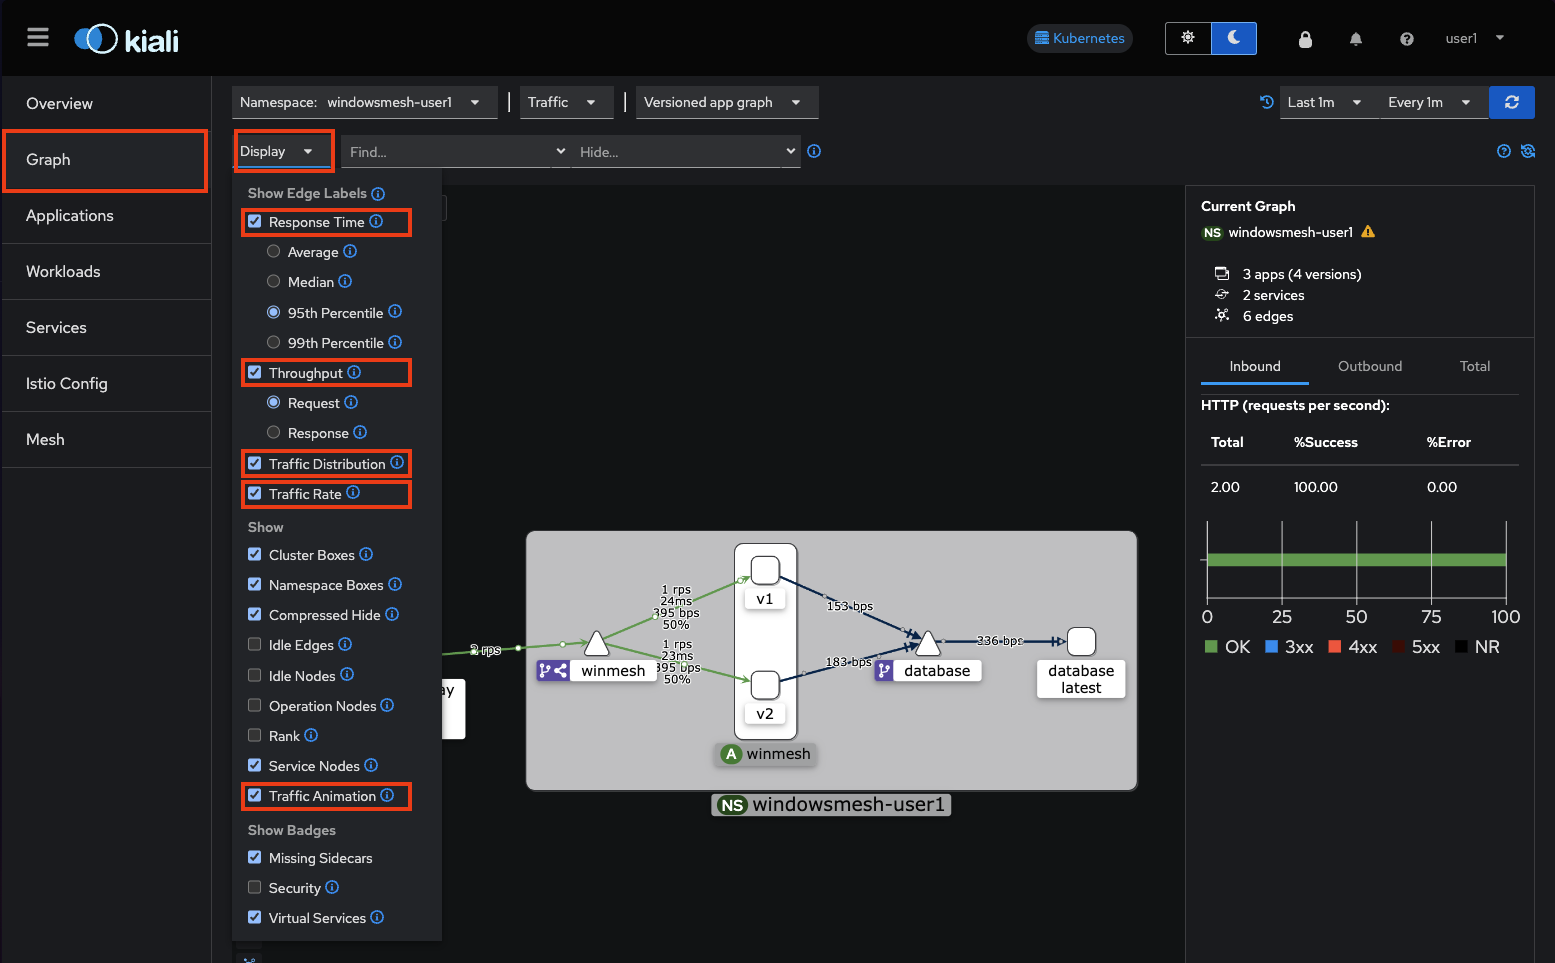
Click Graph on the left side.
-
Click the Display drop-down box
-
Tick Response Time to see request latency.
-
Tick Throughput checkbox to see data transfer rate.
-
Tick Traffic Distribution checkbox to view load balancing percentage.
-
Tick Traffic Rate checkbox to see how many requests per second are being sent
-
Tick Traffic Animation checkbox to see little dots representing individual requests.
-
-
Notice the panel on the right side that shows request response code (200, 300, 400, 500s)
Zoom in and out of the graph to see traffic details.
Conclusion
The Cloud Native features already present in OpenShift provide a far most robust and complete platform than competing platforms.
We hope this workshop has helped you understand the UpLift and Shift vision, and how you can get far more than simple replatforming when your new platform is OpenShift.