Module 3: Integrating and Observing Virtual Machines in OpenShift Service Mesh
All assets for this module are in the folder lab-3. Please change the directory into this folder.
|
cd $HOME/virt-ossm-workspace/lab-3Task 1: Explore the Service Mesh Observability Stack
Firstly, find the URLs of the service mesh observability components by executing the following commands in your terminal.
echo "https://$(oc get route kiali -o jsonpath='{.spec.host}' -n istio-system)"
echo "https://$(oc get route jaeger -o jsonpath='{.spec.host}' -n istio-system)"
echo "https://$(oc get route grafana -o jsonpath='{.spec.host}' -n istio-system)"
The Service Mesh components have been installed by the platform team in the istio-system namespace, therefore you can you can also find the observability URLs in the namespace istio-system at Networking → Routes menu of the OpenShift console.
|
Tracing with Jaeger
Jaeger is an open-source distributed tracing system designed to monitor and troubleshoot transactions in microservices architectures. It helps track requests as they flow through services, providing insights into latency, dependencies, and bottlenecks. Jaeger is widely used for performance optimization, root cause analysis, and observability in cloud-native applications.
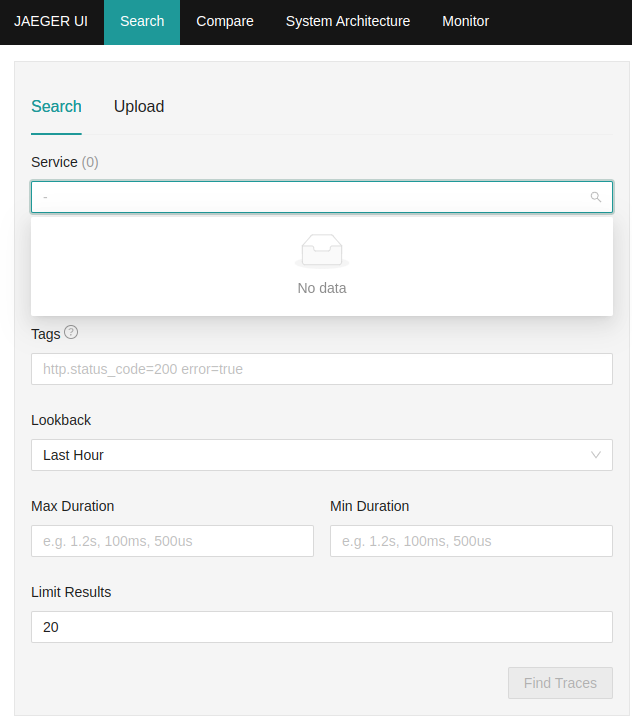
The Jaeger dashboard offers the capability to inspect traces of the traffic exchanged within the Travel Booking application.
Login to the dashboard at the Jaeger URL by using credentials:
-
username: username
-
password: password
At the Authorize Access page select Allow selected permissions.
The Jaeger console shows traces of the traffic flowing between services that are already part of the mesh.
You can select from the Service drop down list the service you wish to inspect traces originating from.
|
Currently, you don’t see any services listed. That is correct! Challenge Yourself with this QuestionCan you figure out, based on the information provided in the introductory section of this module, why that is the case? |
Leave the Jaeger dahsboard open in your browser as we will come back to it a little bit later and lets explore the next observability tool.
Grafana Dashboards
Access the Grafana dashboard by following the link to the Grafana URL with credentials:
-
username: username
-
password: password
In the Dashboard go to Dashboards → Browse → Istio → Istio Mesh Dashboard to access the Grafana dashboard that shows all the services in the mesh, the traffic volume they receive as well as HTTP codes of success or failure of the requests.
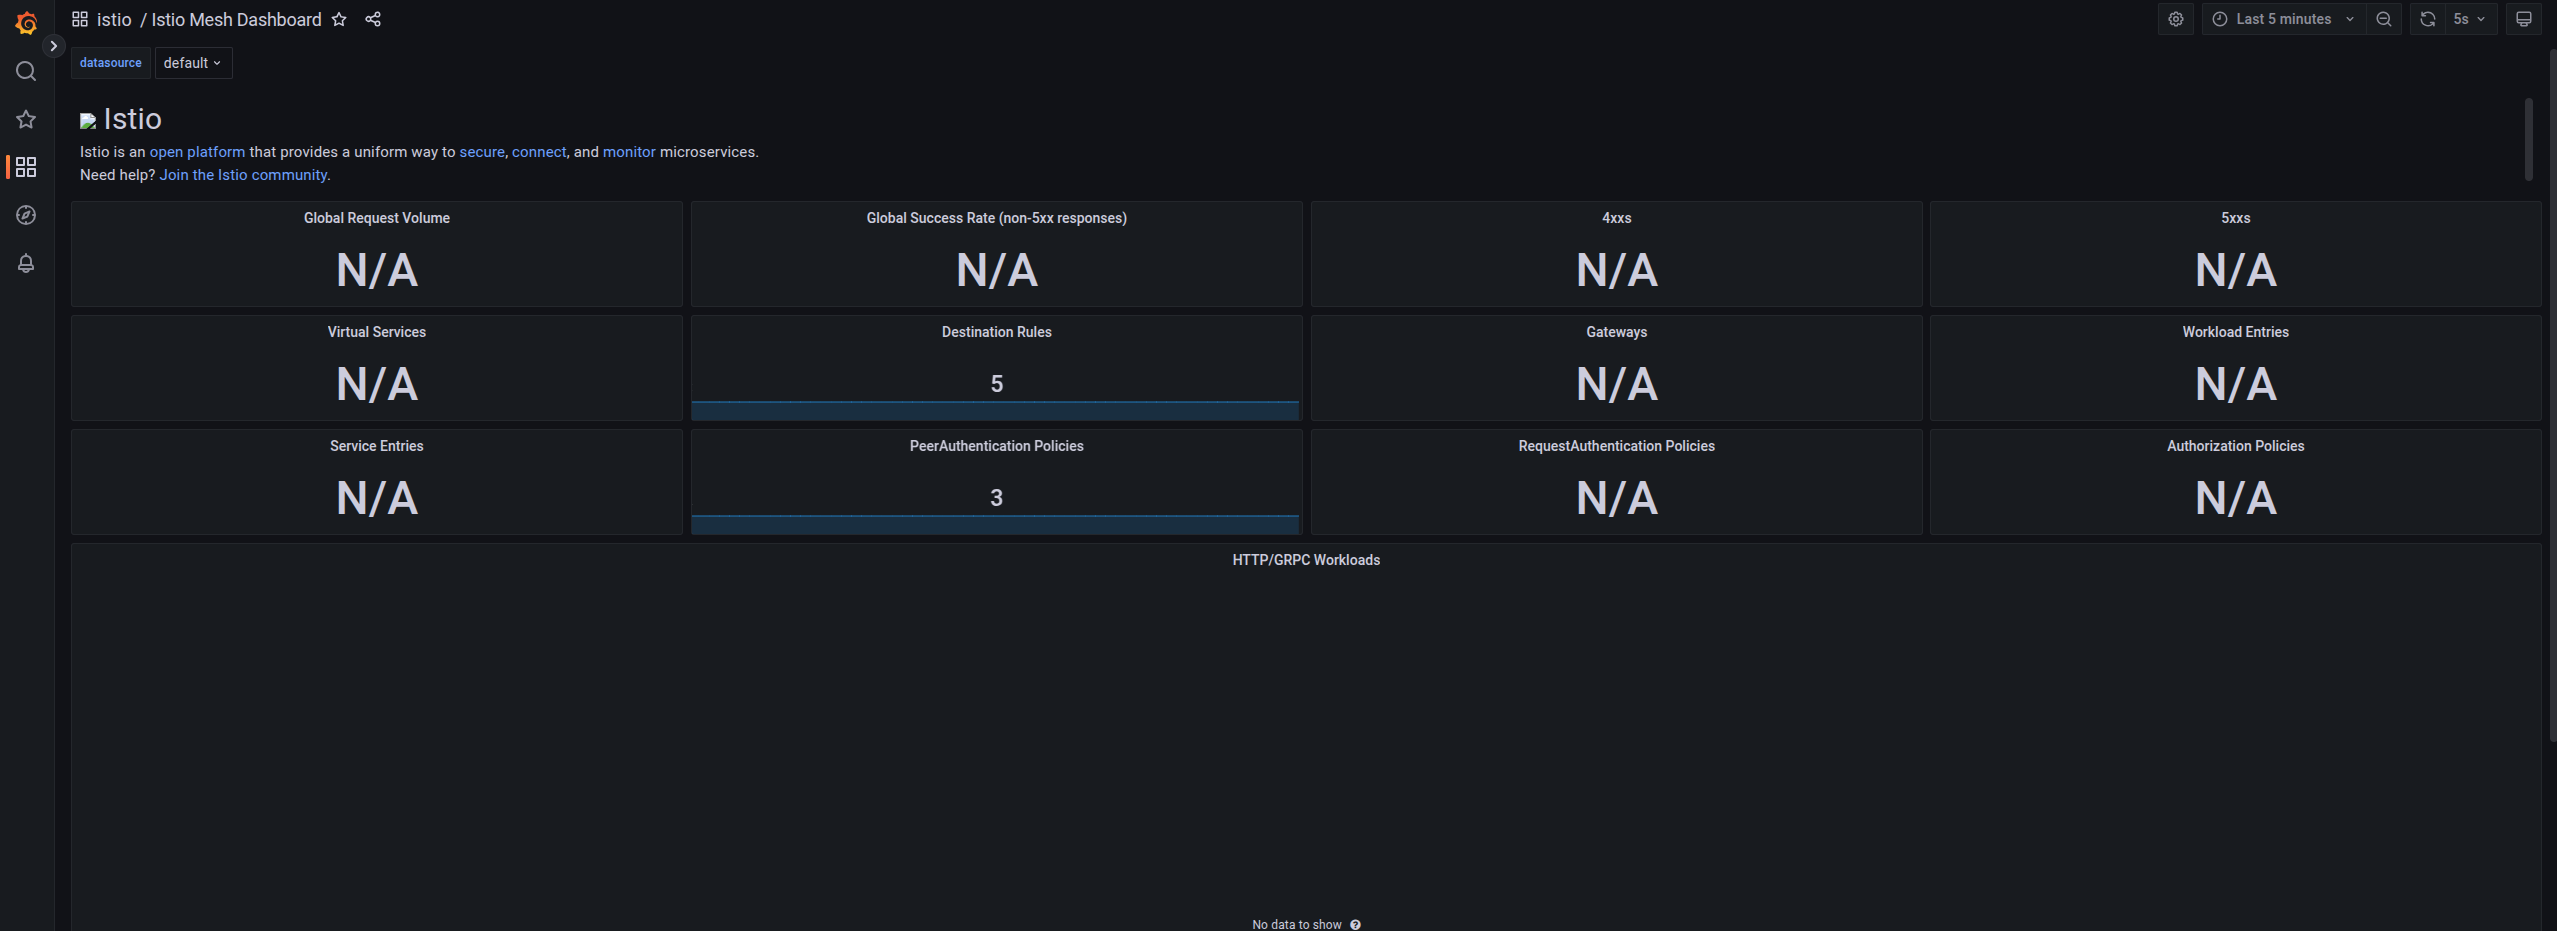
| Again there there are no services listed or traffic flowing. You must be suspecting something is not quite right by now. Can you point your finger at the problem? |
There are additional dashboards under Dashboards → Browse → Istio to help you monitoring the dataplane (VMs, containers) as well as the controlplane (the istio components) of the service mesh.
Leave the Grafana dahsboard open in your browser as we will come back to it a little later and lets explore Kiali.
Mesh Visualization in Kiali Console
Access Kiali to explore a visualisation of the Travel Booking application in the mesh. Login by using credentials:
-
username: username
-
password: password
Once logged in, at the left hand side menu select Graph and choose the Select All option of the Namespace drop-down menu (at the top).
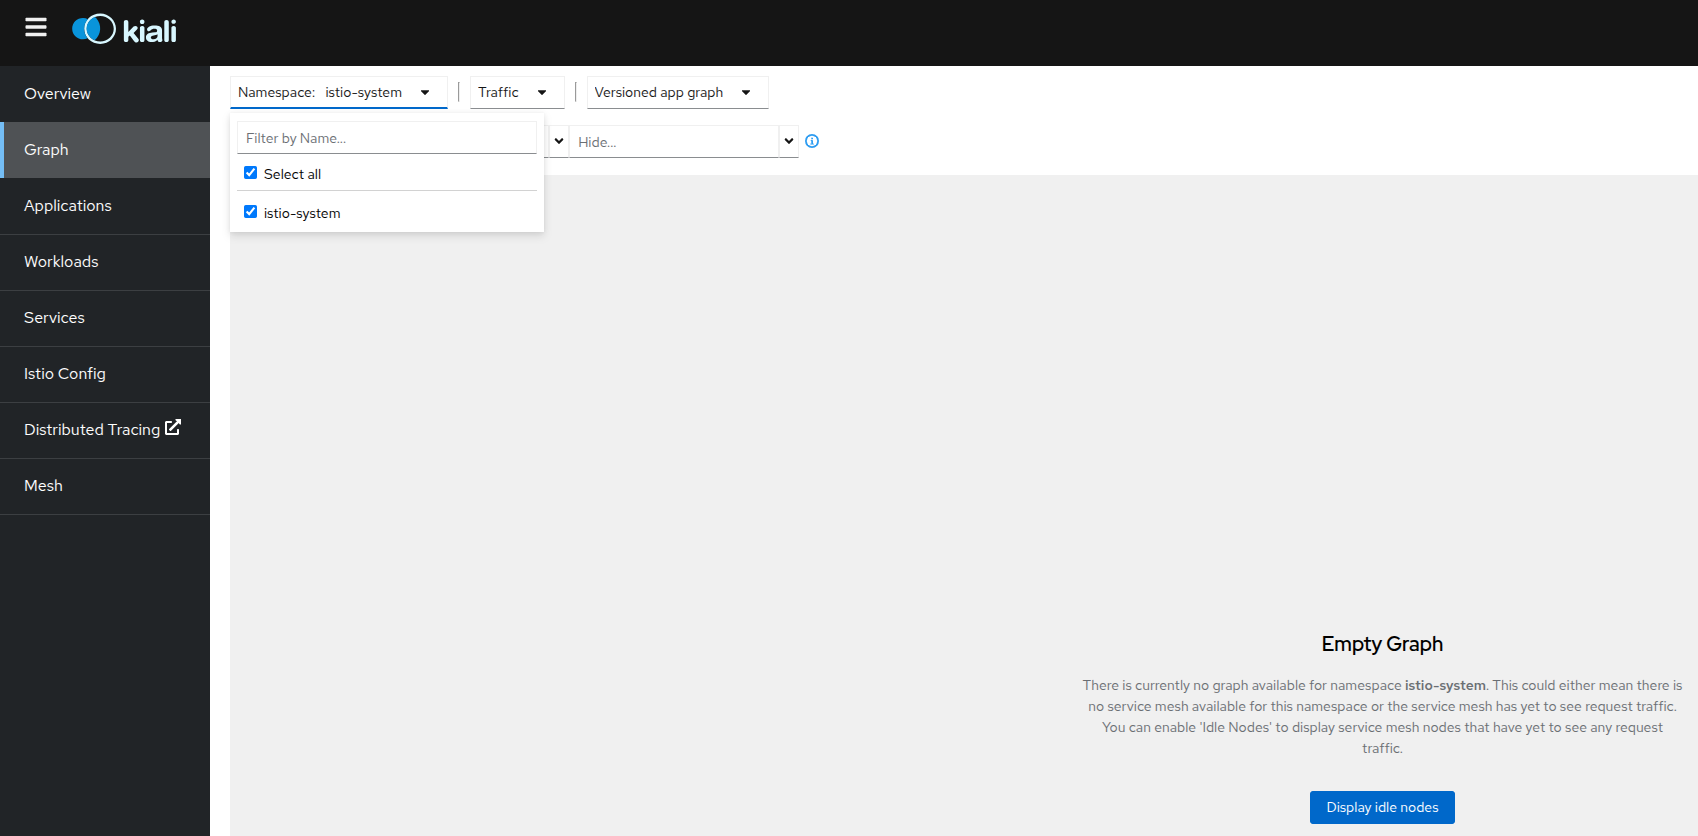
| Again there is no Graph visualisation of any service Travel Booking application. |
Leave the Kiali dahsboard in your browser and proceed to the next task.
| Why can’t you see any services? |
Despite the lack of data you have been successfull! You have now successfully accessed and explored the additional observability tools provided by OpenShift Service Mesh.
Task 2: Add the Travel Booking VMs & Containers to OpenShift Service Mesh
If it was not apparent until now, you can only apply policies (security, observability etc.) to VMs and containers that are part of the mesh!
| In order to become part of the mesh each Travel Booking namespace must be configured to be a member of the mesh, and each workload component needs to have an additional sidecar container injected, which will intercept the traffic to/from your VM. |
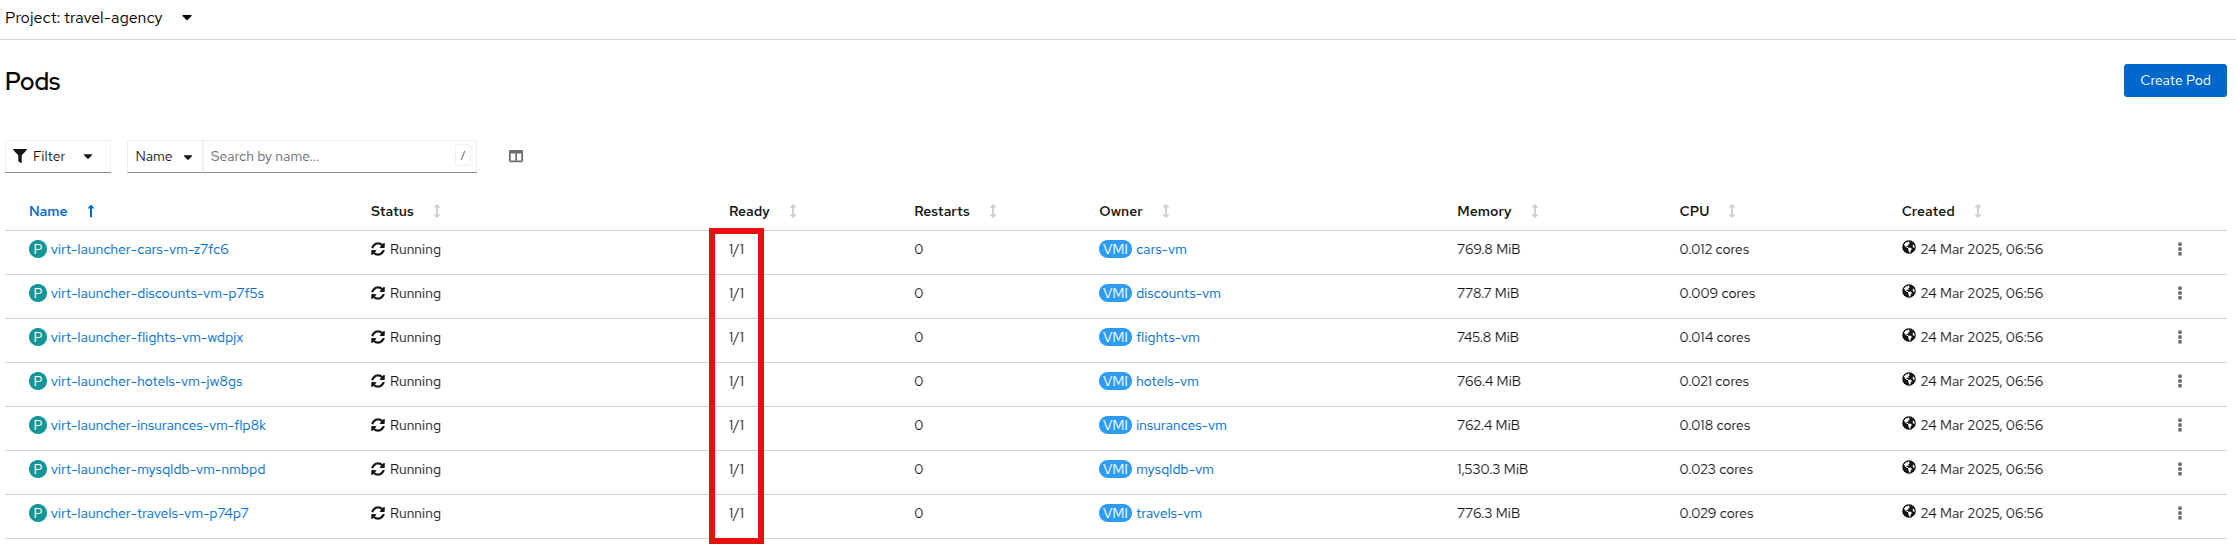
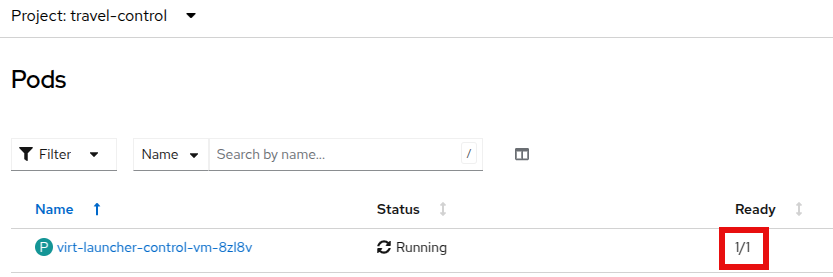
Right now though, the VMs pods have a single container!
Lets add the Travel Booking application to the service mesh.
First we create a ServiceMeshMember resource for each of the 3 namespaces of the Travel Booking application, which will include them to the mesh. (click for details of the configuration servicemeshmember.yaml). Now execute in the Terminal the following:
oc apply -f servicemeshmember.yamlThen we add the sidecar container to each of the workloads (VMs and containers).
This forms the actual dataplane of the mesh, and consists of an envoy-proxy (namely the istio-proxy container).
The provided scripts will insert the injection annotation sidecar.istio.io/inject in each workload and also restart them, so that service mesh can inject the istio-proxy container and start applying the configured policies.
Execute in the Terminal the following scripts:
./add-envoy-to-travel-agency-services-domain.sh./add-envoy-to-travel-portal-domain.sh./add-envoy-to-travel-control.sh| For details of how this is done see the scripts at add-envoy-to-travel-agency-services-domain.sh, add-envoy-to-travel-portal-domain.sh, add-envoy-to-travel-control.sh. |
Now we have included all Travel Booking VMs and Containers in the mesh, and each POD is made up of 2 containers (the workload and the istio-proxy container)
This is it!! The VMs can now take advantage of all the service mesh features.
Task 3: Validate that the Travel Booking application is part of the mesh
Mesh Visualization in Kiali Console
Go back to the Kiali Dashboard.
We are now able to visualise network information about the Travel Booking services.
Kiali can give you a lot more than just visualisation of the network. You can review the applied mesh configurations, modify them or apply new ones.
|
In the Kiali Dashboard, click the Select All option, from the Select Namespace drop-down menu (at the top). You should now see 3 Travel Booking namespaces listed.
The Versioned App Graph shows the whole network of microservices (VMs and containers) and the traffic flowing between them.
| Wow this is truly brilliant. Containers and VMs working side by side within the platform and the mesh is integrating them without distinguishing on the technology of their runtime. You only had to make 1 annotation change to the VM resource. |
| You can explore additional features of Kiali in the optional Task 5. |
Tracing with Jaeger
Go back to the Jaeger Tracing console which now contains traces of the requests.
From the services menu select the travels-vm.travel-agency and click Find Traces. By default you will receive the last 20 Traces captured in the last hour but you can increase that to up to 1500 Traces as well as configure the time these were captured at from the menu.
The console displays a top-level overview of:
-
the requests in/out of the VM (each dot in the graph and each Trace line entry below represent a request passing through the travels-vm.travel-agency)
-
showing both successful and failed traced requests (a blue dot indicates successful requests, a red dot failed ones)
-
the services the request traverses, (The Trace line entry identifies the services this request has traversed, spans created and total request time)
-
overall time of the trace.
Click now on one Trace line, it will give you additional information on each individual step (span):
-
success or failure HTTP code (HTTP 200 vs HTTP 500),
-
the time elapsed.
The animated icon showcases reviewing successful and failed requests.
Grafana Dashboards
Finally, go back to the Grafana dashboard.
The Istio Mesh Dashboard now has been populated with information about the application that you can use to undertand the healthiness, content and usage of the solution.
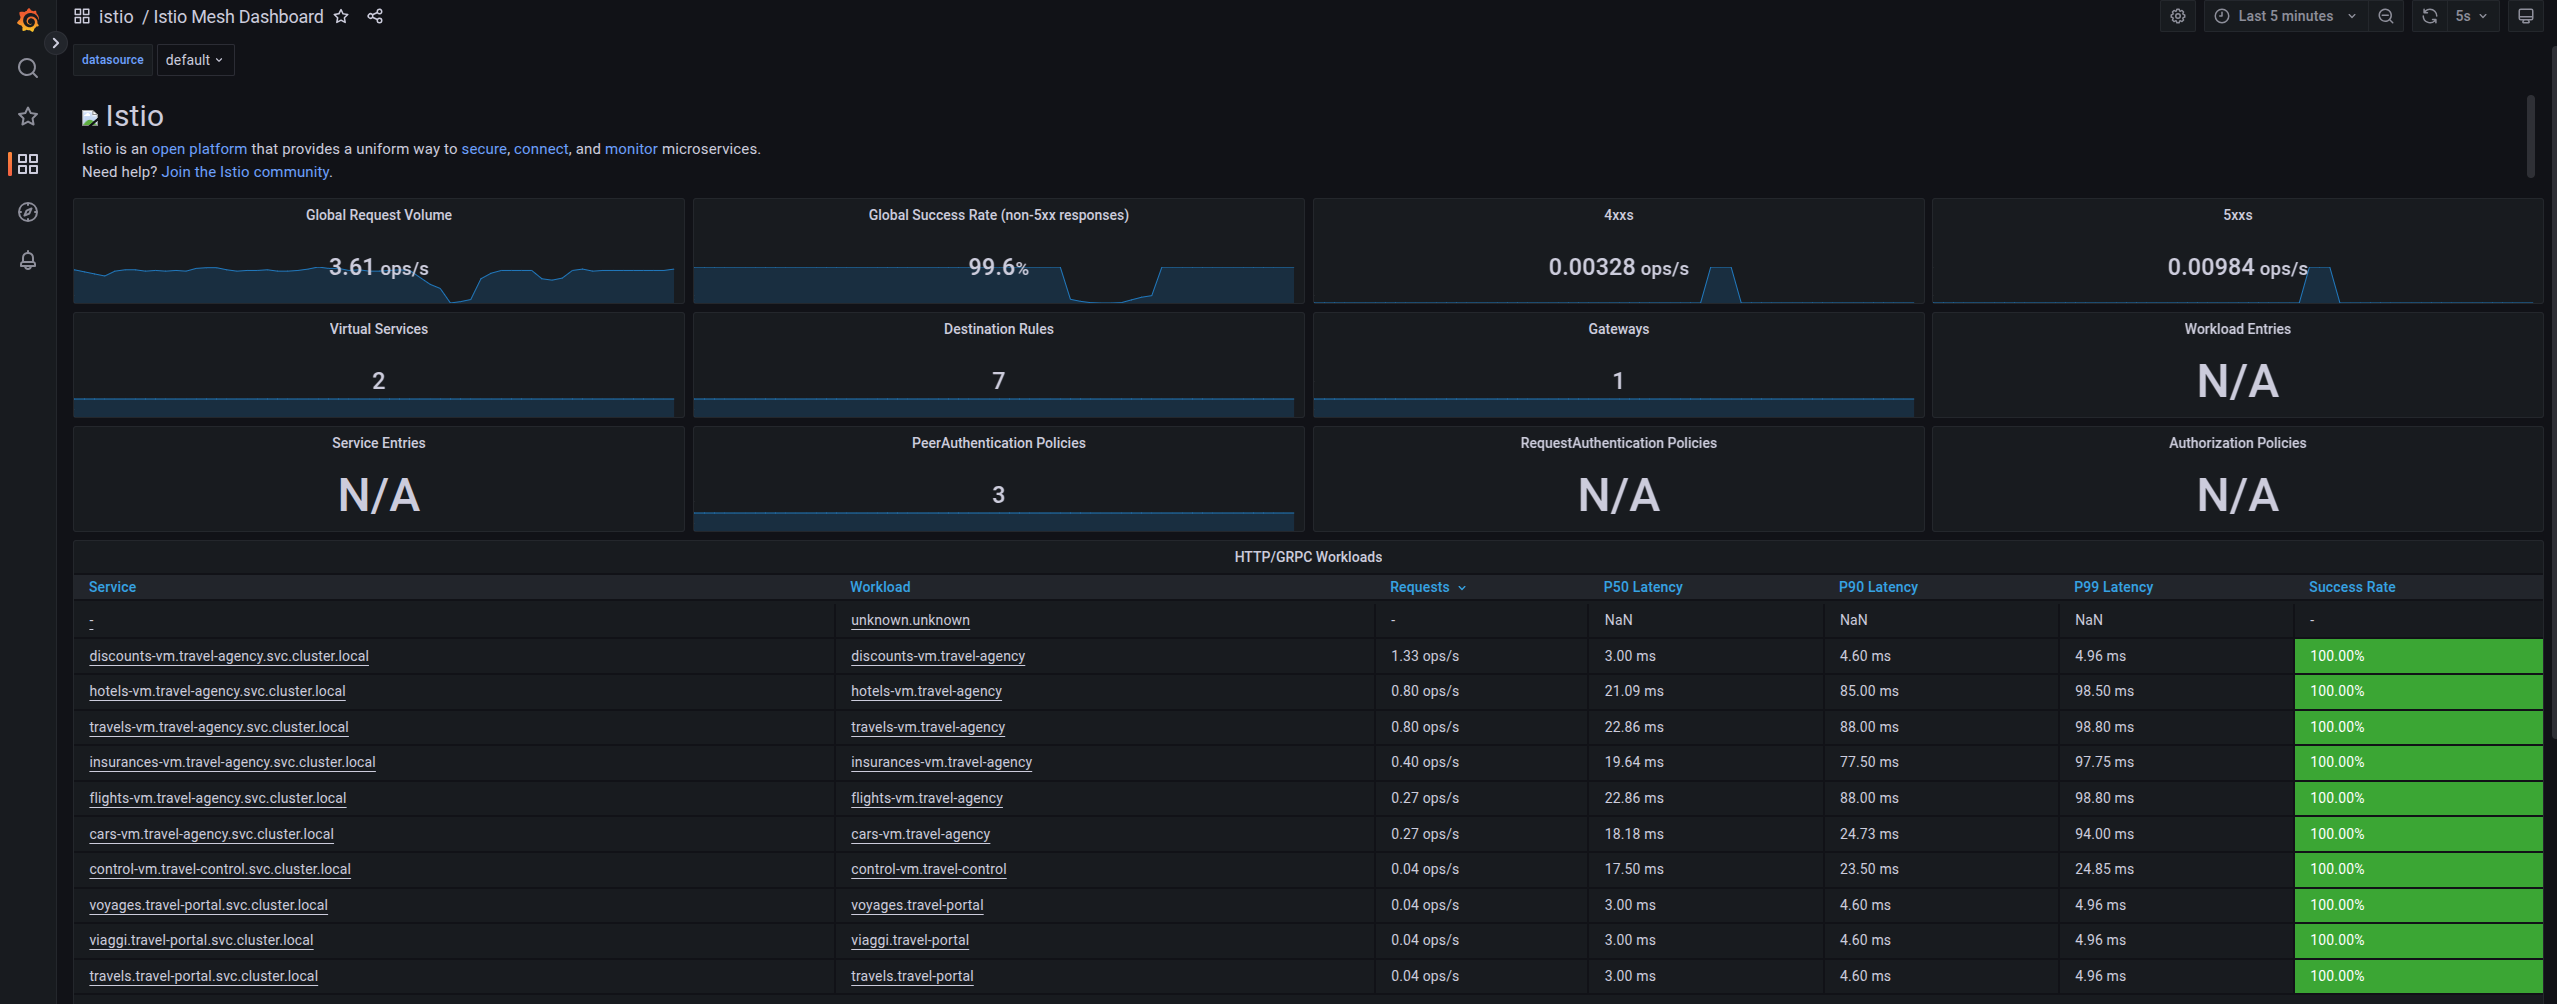
| Congratulations for making it through all the steps!!! That was a lot of information and they are at the operator’s fingertips with one simple annotation insertion. |
Task 4: Validate that the Travel Booking application is working correctly
In the final step, test if the Travel Booking application is operational.
Access the Travel Business dashboard https://travel-dashboard-travel-control.apps.cluster-guid.guid.sandbox.opentlc.com.
Challenge Question
Why is the dashboard not accessible?
| You have to configure the mesh to expose services to the outside. We will perform this in the next module. |
Since, the user interface is not accessible yet, we will test the solution through internal service-to-service communications. We are going to simulate a booking request by sending a request for a travel quote from the travels portal in the travel-portal namespace to the travels-vm VM in the travel-agency namespace:
oc -n travel-portal exec $(oc -n travel-portal get po -l app=travels|awk '{print $1}'|tail -n 1) -- curl -s travels-vm.travel-agency.svc.cluster.local:8000/travels/London |jqYou should receive a quote similar to the one following:
{
  "city": "London",
  "coordinates": null,
  "createdAt": "2025-03-24T13:58:06Z",
  "status": "Valid",
  "flights": [
    {
      "airline": "Red Airlines",
      "price": 1018
    },
    {
      "airline": "Blue Airlines",
      "price": 368
    },
    {
      "airline": "Green Airlines",
      "price": 318
    }
  ],
  "hotels": [
    {
      "hotel": "Grand Hotel London",
      "price": 590
    },
    {
      "hotel": "Little London Hotel",
      "price": 116
    }
  ],
  "cars": [
    {
      "carModel": "Sports Car",
      "price": 1090
    },
    {
      "carModel": "Economy Car",
      "price": 336
    }
  ],
  "insurances": [
    {
      "company": "Yellow Insurances",
      "price": 325
    },
    {
      "company": "Blue Insurances",
      "price": 74
    }
  ]
}
Task 5 (Optional): Explore Additional Kiali Features
Go back to the Kiali Dashboard.
Kiali also has a Replay feature, and you can find the replay icon  next to the Last 1 minute link. Explore this additional capability to look at the state of the network at an earlier time, selecting different options. next to the Last 1 minute link. Explore this additional capability to look at the state of the network at an earlier time, selecting different options.
|
You can go beyond the basic visualization to explore the default security configurations the mesh has already applied.
Click on Graph and select Display → Security in the drop down menu. This reveals through the lock icon that all communications have now been encrypted via a mesh generated and rotated TLS certificate.
Click on the line connecting the travels v1 service to travels vm and notice on the right hand-side menu under mTLS Enabled, it shows the principals in the spiffe certificates exchanged.
| Just like that we have ensured no man in the middle loophole!! |
But, that is not all:
The Display menu gives you the ability to visualise the % of Traffic Distribution, Throughput request/response, Response Time (by percentile). Go ahead and use these options to explore the information as the following animated guide also shows.
The mesh is by default also capturing network metrics of the workloads (including the VMs). You can use it to check more details on the throughput size and latency in/out of the travels-vm VM.
Go to Workloads → travels-vm → Inbound Metrics, and increase the time metrics from the top right drop-down menu from the default Last 1 minute to 1 hour.
You can also select from the Reported from drop down Source (to see the metrics reported on the source service) and tick the Tredline option.
You are now able to hover and explore per service in the travel-agency namespace the throughput and duration of requests towards travels-vm.
Now changing to the Outbound Metrics tab, you can perform the same review for the services called by travels vm (the animated guide below shows the pages retrieved through these actions). The Tredline will help to understand if things are going up or down.
Finally, as we said earlier, Kiali enables the operator to also manage mesh configurations.
Go to Istio Config → Namespace (drop down) → Select all travel-xxx namespaces.
You should see that there are no custom added configurations as we have not yet started to configure the mesh with additional authorization, traffic or resillience mesh configurations.
Select instead Istio Config → Namespace (drop down) → istio-system and now you will see the default configurations added by the mesh.
The default DestinationRule, as also shown by the animated icon below, enforces ISTIO_MUTUAL TLS policy to all destinations with a suffix of *.cluster.local in service name and this includes all the services you created in Module 1.
We do explore DestinationRule(s) and additional mesh configurations more extensively in the next module.
Take a moment to pause and reflect on what has happened! The change of annotating the VirtualMachine resource with sidecar.istio.io/inject has achieved all this. The VMs did not get altered but you are already getting a whole new experience.
|