Module 2: CI/CD pipeline (securing what you build)
Presenter note: This module continues directly from Module 1. The developer pushes code with code smells (improper logging and empty exception handling), the Tekton pipeline catches them via SAST/Sonarqube, the developer fixes the issues in DevSpaces, and Argo CD handles deployment. The pipeline is viewed in the OpenShift web console and the deployment sync is viewed in the Argo CD console. Target duration: 15 minutes across 3 parts.
Part 1 — Triggering the pipeline
Know
The developer from Module 1 has added a new feature and is ready to push their code. A git push triggers a Tekton pipeline that automates the build, test, and security scanning process. This is the outer loop: the platform’s guardrails that ensure code quality and security standards are met before anything reaches production.
Business challenge:
-
Manual build and deployment processes introduce inconsistency and risk
-
No automated quality gates between development and production
-
Security scanning happens late (or not at all), leading to costly remediation
-
Developers rely on manual processes to get code deployed
Value proposition:
Tekton pipelines automate the entire CI process, triggered by a simple git push. Every code change goes through the same standardized quality gates: build, test, scan, and package. This removes human error, enforces standards consistently, and gives developers fast feedback on their changes.
Show
What I say:
"Our developer is happy with the claims statistics endpoint they added in Module 1. They tested it locally with Quarkus dev mode and it works. Now they are going to push the code. Watch what happens next. The developer does not need to file a ticket, notify a build engineer, or trigger anything manually. The platform handles it."
What I do:
-
In DevSpaces, use the Source Control view in the left sidebar:
-
Click the Source Control icon (branch icon) in the activity bar
-
The new
ClaimsStatsResource.javafile appears under "Changes" -
Stage the file by clicking the + icon next to it
-
Enter a commit message:
Add claims statistics API endpoint -
Click the dropdown arrow next to the Commit button and select Commit & Push
-
"That is all the developer does. A commit and push from the IDE. The platform takes it from here."
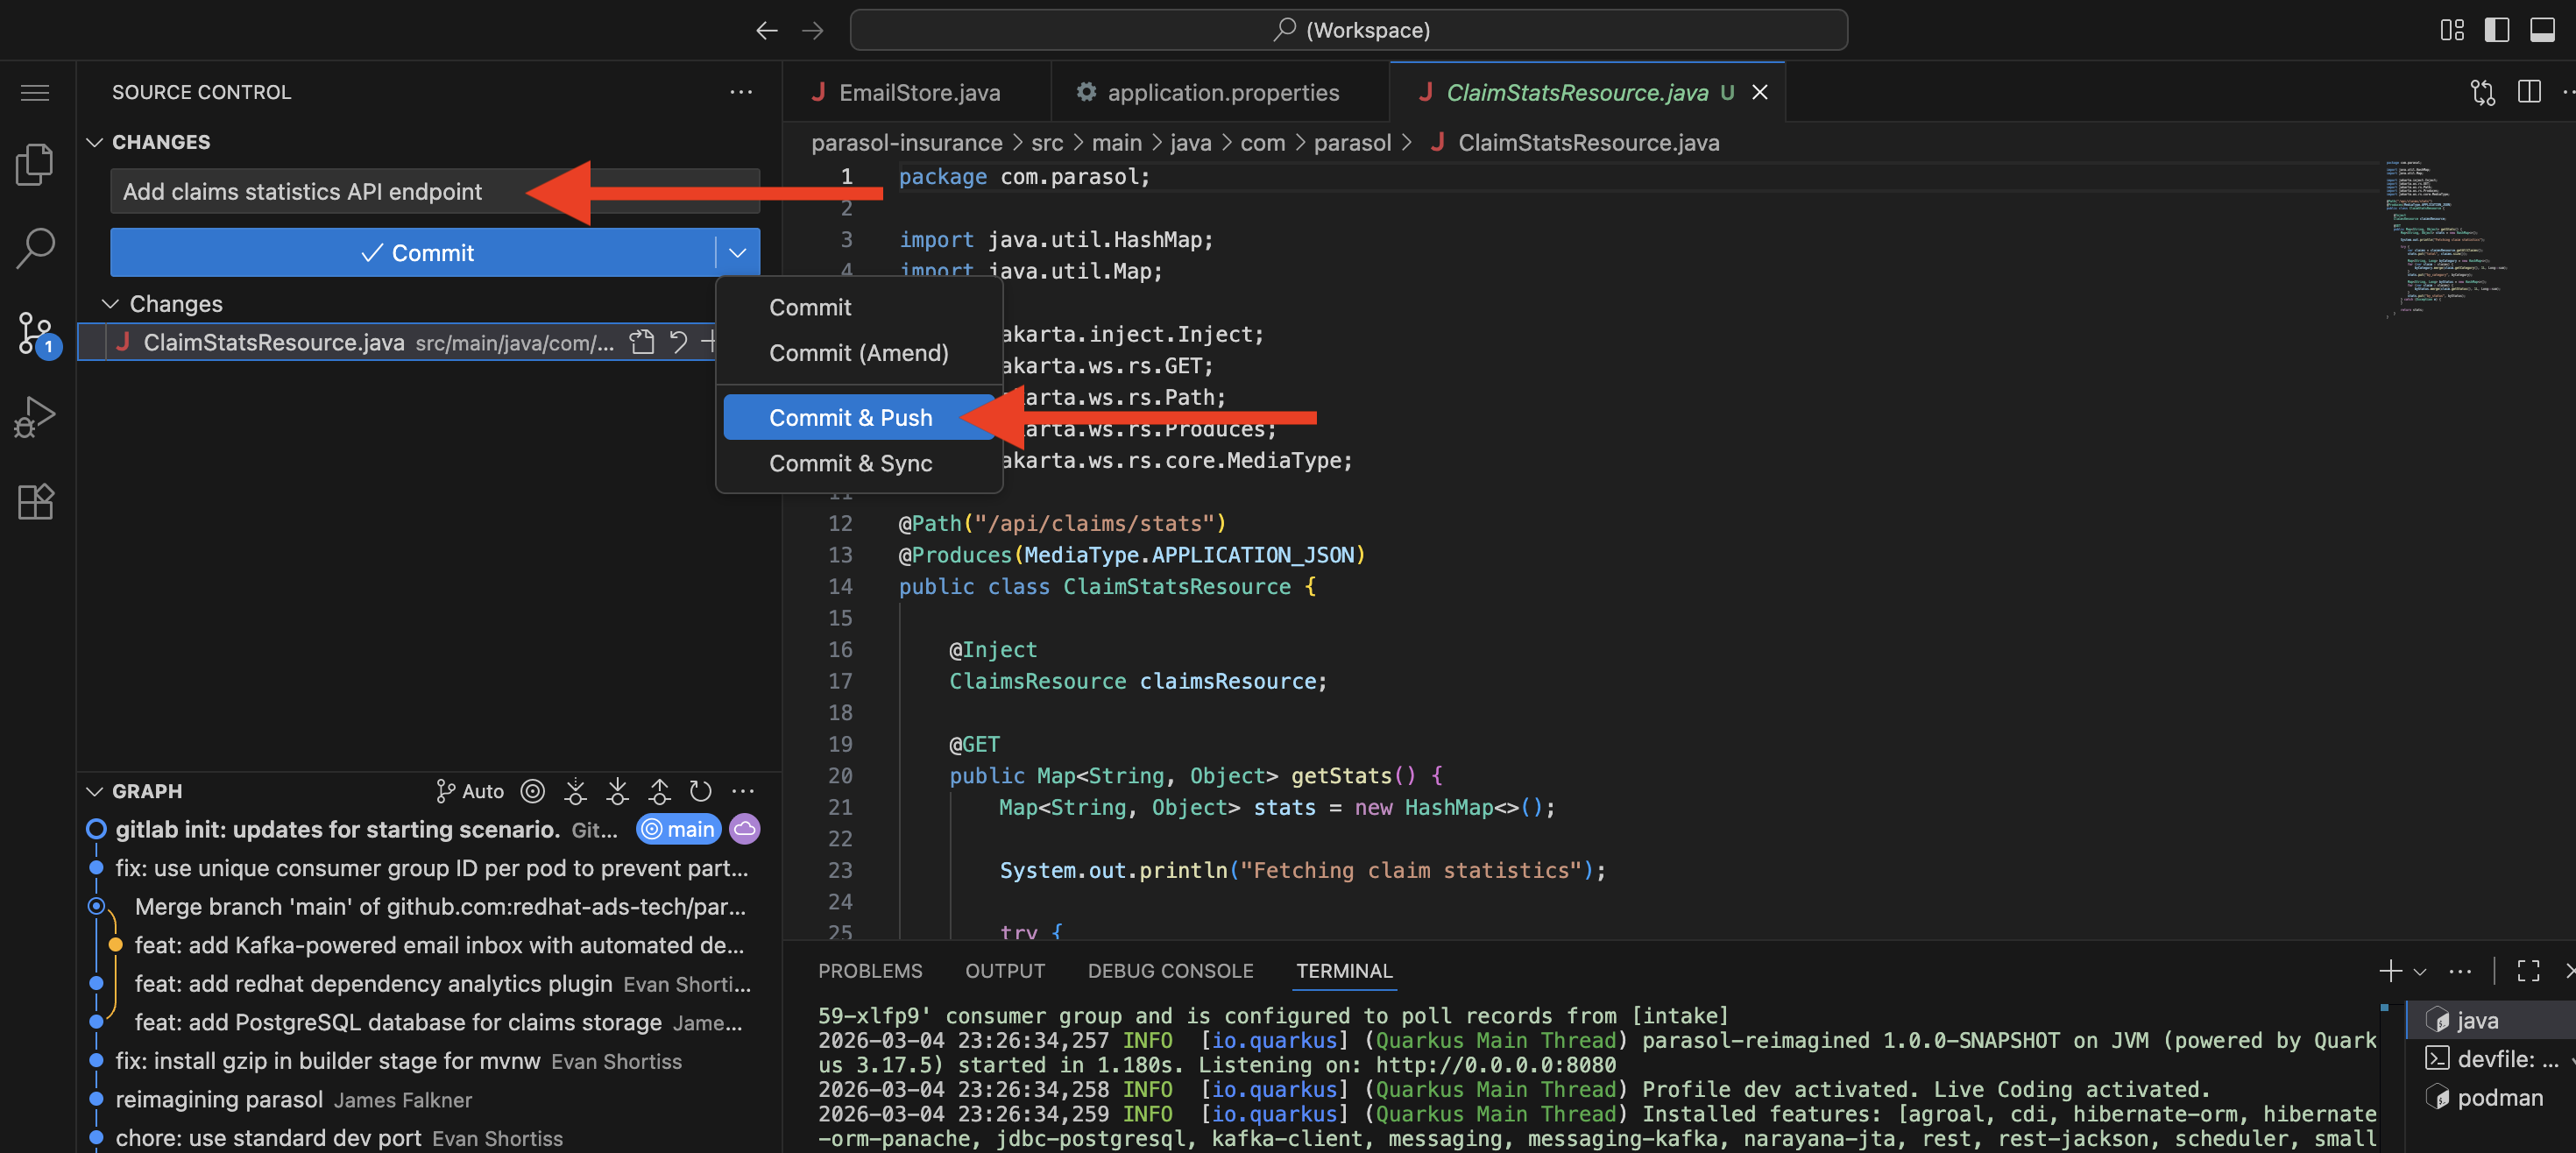 Figure 1. Developer commits and pushes code from the IDE, triggering the CI pipeline
-
-
Switch to the OpenShift web console at {openshift_cluster_console_url}[{openshift_cluster_console_url}^] (logged in as
dev1/{common_password}) -
Navigate to the Pipelines section in the
parasol-insurance-buildnamespace:-
Show the pipeline run that was triggered automatically by the git push
-
"The developer did not click a 'Build' button. The git push triggered a webhook that started the Tekton pipeline automatically."
 Figure 2. Pipeline run triggered automatically by git push
-
-
Walk through the pipeline stages as they execute:
-
Clone — Source code pulled from the Git repository
-
Sonarqube SAST — Static analysis and security scanning
-
Build and Push — Quarkus application compiled, container image built and pushed to the registry
-
Re-rollout app — The updated application is re-deployed in the dev environment
-
"Every code change goes through the exact same stages. No shortcuts, no skipping steps, no variation between teams."
-
-
Point out that the pipeline is still running:
-
"Let’s watch this for a moment. Remember those code shortcuts our developer took? In Part 2, we will see what happens when the pipeline reaches the Sonarqube SAST stage."
-
What they should notice:
-
The developer only did a git push. No manual pipeline trigger, no tickets, no handoffs.
-
The pipeline started automatically within seconds of the push
-
Every stage is visible in the OpenShift web console. The developer can track progress in real time.
-
The same pipeline runs for every code change from every developer. Consistency is enforced by the platform.
Business value callout:
"At Parasol today, getting code from a developer’s machine into a running environment takes 3-5 days of manual handoffs. What you just saw happened in seconds. The developer pushed code and the platform immediately started building, testing, and scanning it. No tickets, no waiting, no human bottleneck."
If asked:
- Q: "Can we use our existing Jenkins pipelines?"
-
A: "Yes. OpenShift supports both Tekton (the built-in pipeline engine) and external CI systems like Jenkins, GitLab CI, or GitHub Actions. Many organizations run both during a transition period. The key point is that the pipeline is automated and standardized, regardless of which engine runs it."
- Q: "Who defines the pipeline stages?"
-
A: "The platform engineering team defines the pipeline templates as Tekton resources in the cluster. Developers do not need to write pipeline configurations. When the application repository is set up, the pipeline is already wired to trigger on push."
- Q: "How long does a typical pipeline run take?"
-
A: "A full pipeline run with build, test, and scanning typically completes in 3-5 minutes for a Quarkus application. The exact time depends on the application size, test suite, and scan depth."
Part 2 — Pipeline catches code smells
Know
The pipeline’s SAST/Sonarqube stage fails because the developer’s new claims statistics endpoint contains code smells: System.out.println instead of proper logging and an empty catch block that silently swallows exceptions. Sonarqube’s quality gate enforces coding standards, and these violations prevent the code from moving forward. This is the platform’s guardrail in action: the CI pipeline enforces code quality standards that the developer’s inner loop does not. The developer fixes the issues in DevSpaces, pushes again, and the pipeline passes.
Business challenge:
-
Code smells and lack of automated code quality enforcement accumulates technical debt, making the codebase harder to maintain over time
-
Improper logging (
System.out.println) makes production debugging expensive and time-consuming -
Swallowed exceptions hide failures, causing silent data corruption or incorrect behavior
-
Manual code review alone cannot catch all quality issues consistently across teams
Value proposition:
Automated quality gates in the pipeline catch code smells that manual processes miss. Sonarqube enforces organizational coding standards — proper logging frameworks, meaningful exception handling, code complexity limits — on every commit. When the pipeline fails, the developer gets specific, actionable feedback and can fix the issues immediately in DevSpaces. The platform enforces quality without becoming a bottleneck.
Show
What I say:
"Remember, our developer added the claims statistics endpoint and it works. But they took a couple of shortcuts: they used System.out.println for logging instead of a proper logging framework, and they wrapped everything in a try-catch block with an empty catch — silently swallowing any exceptions. Let’s see what the platform has to say about that."
What I do:
-
In the OpenShift web console, show the pipeline run reaching the Sonarqube SAST stage:
-
The stage turns red (failed status)
-
"The pipeline caught it. The Sonarqube quality gate failed because of code smells in the new endpoint."
-
-
Click on the failed step for the failed Sonarqube SAST stage:
-
Scroll to the end of the log output
-
Point out the Sonarqube report URL at the end of the log (it is also present on the details tab)
-
"The pipeline log includes a direct link to the full Sonarqube report. Let’s open that."
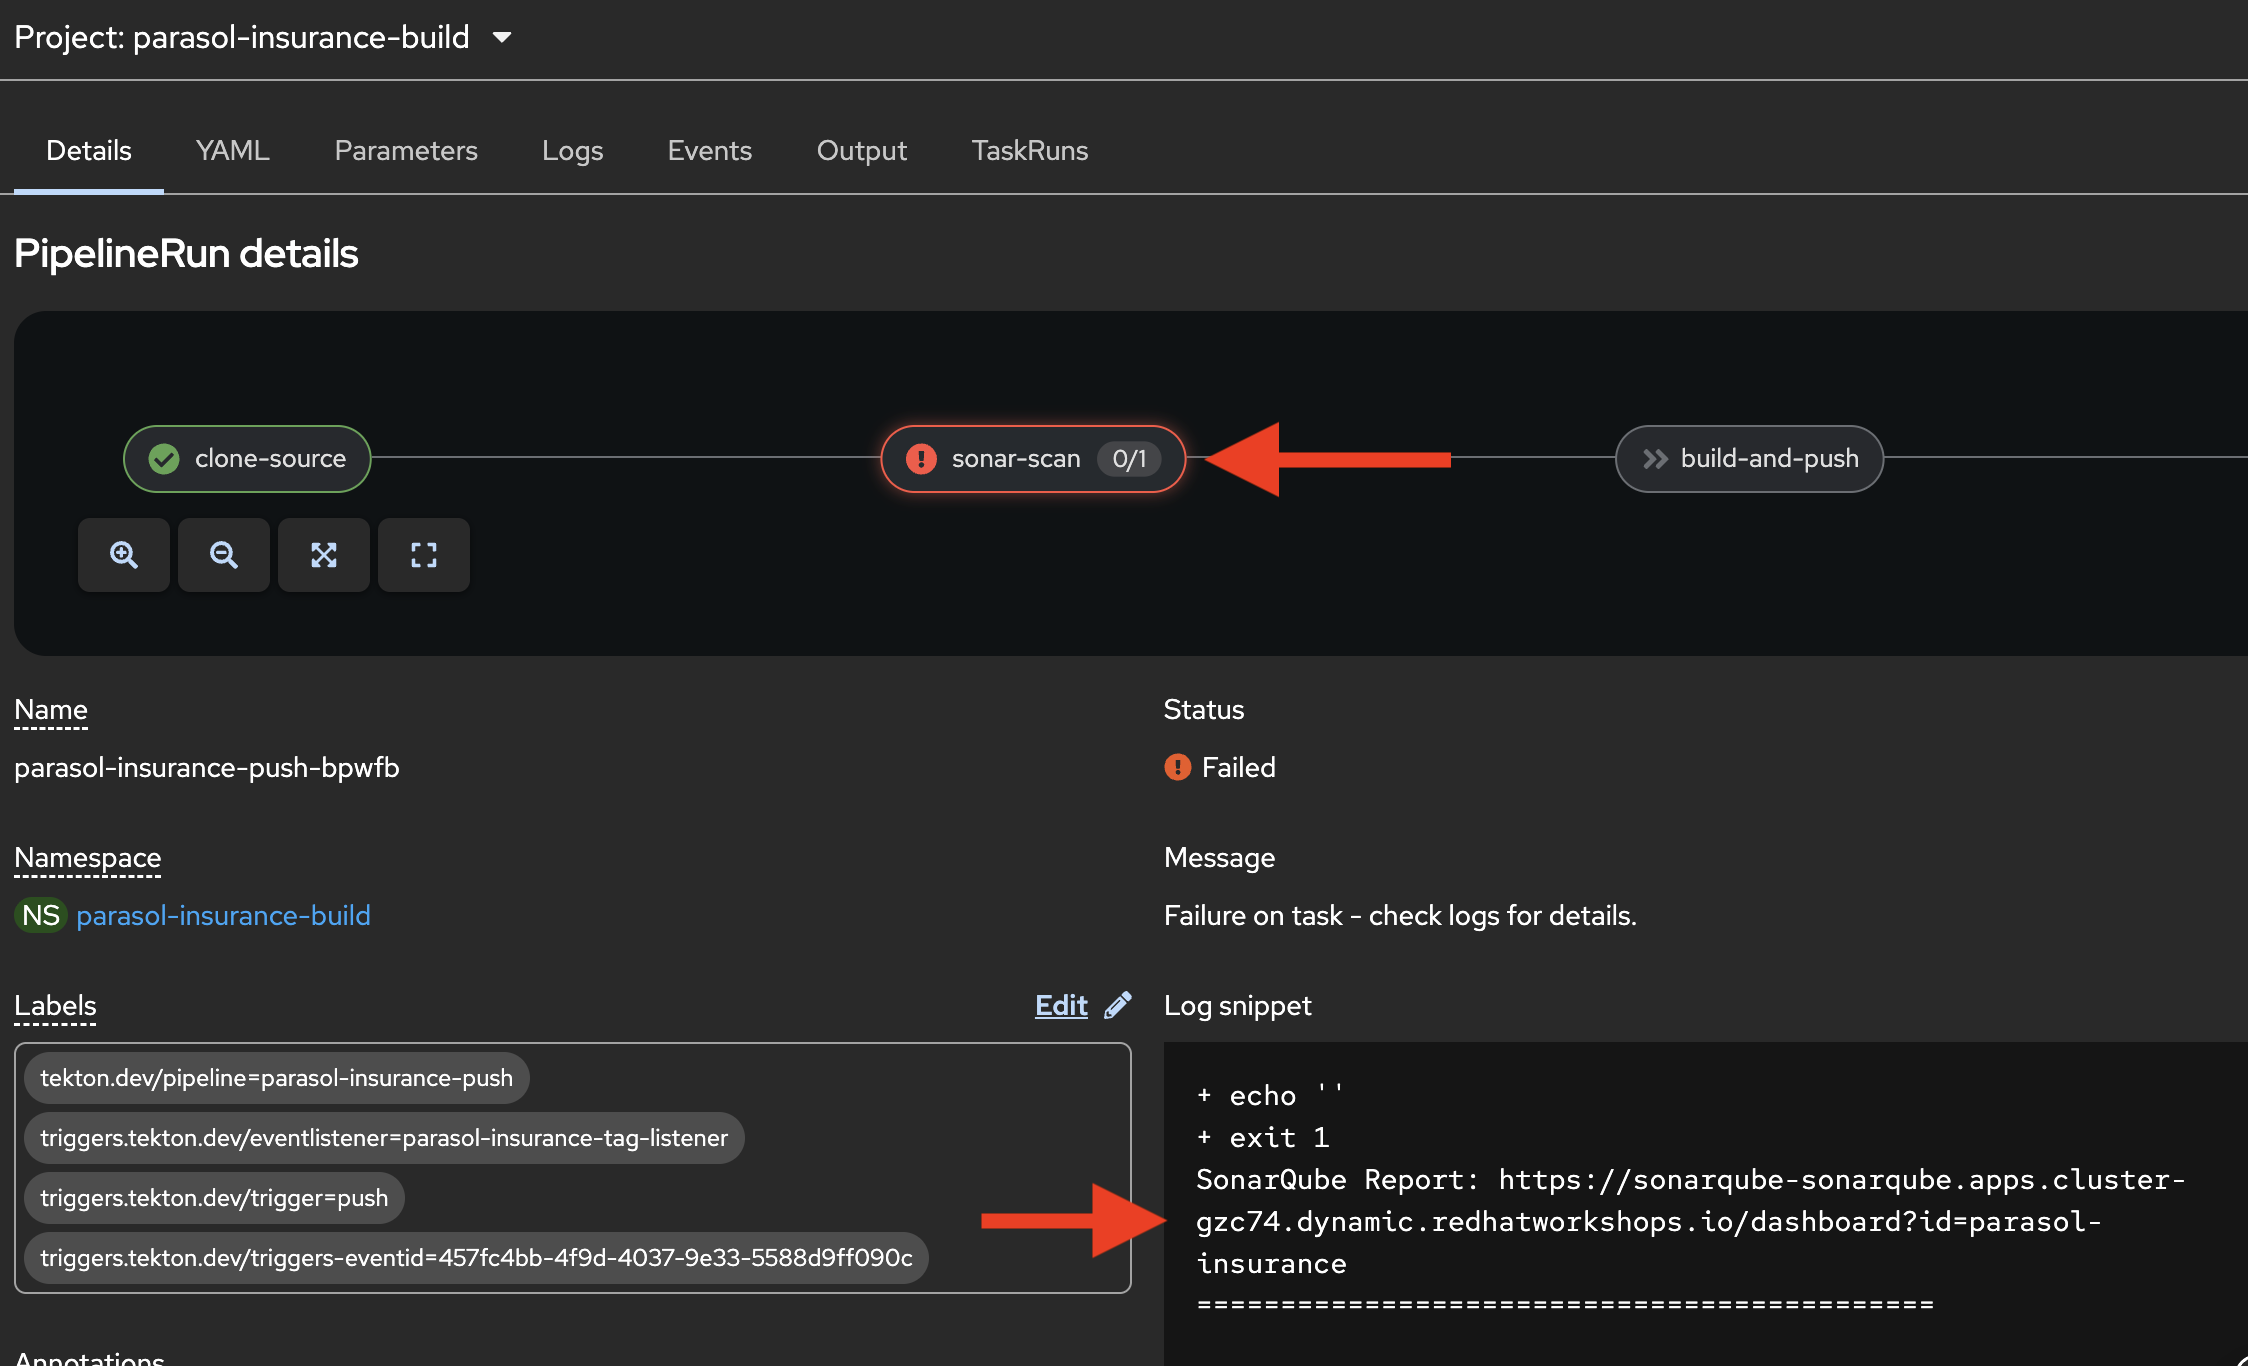 Figure 3. Pipeline log with Sonarqube report URL
-
-
Open the Sonarqube report URL from the log to show the two code smells:
-
System.out.printlnusage — Standard output should not be used for logging in production code. Use a proper logging framework instead. -
Empty catch block — Exceptions should not be silently swallowed. Either handle the exception, log it, or let it propagate.
-
Field Injection issues - Sonarqube flags the use of field injection (e.g.
@Inject ClaimsResource claimsResource;) as a code smell because it can lead to issues with testability and hidden dependencies. Constructor injection is generally recommended instead.-
"These are not suggestions. They are hard gates. Code with these quality violations does not move forward. The platform enforces the same standard for every developer on every commit."
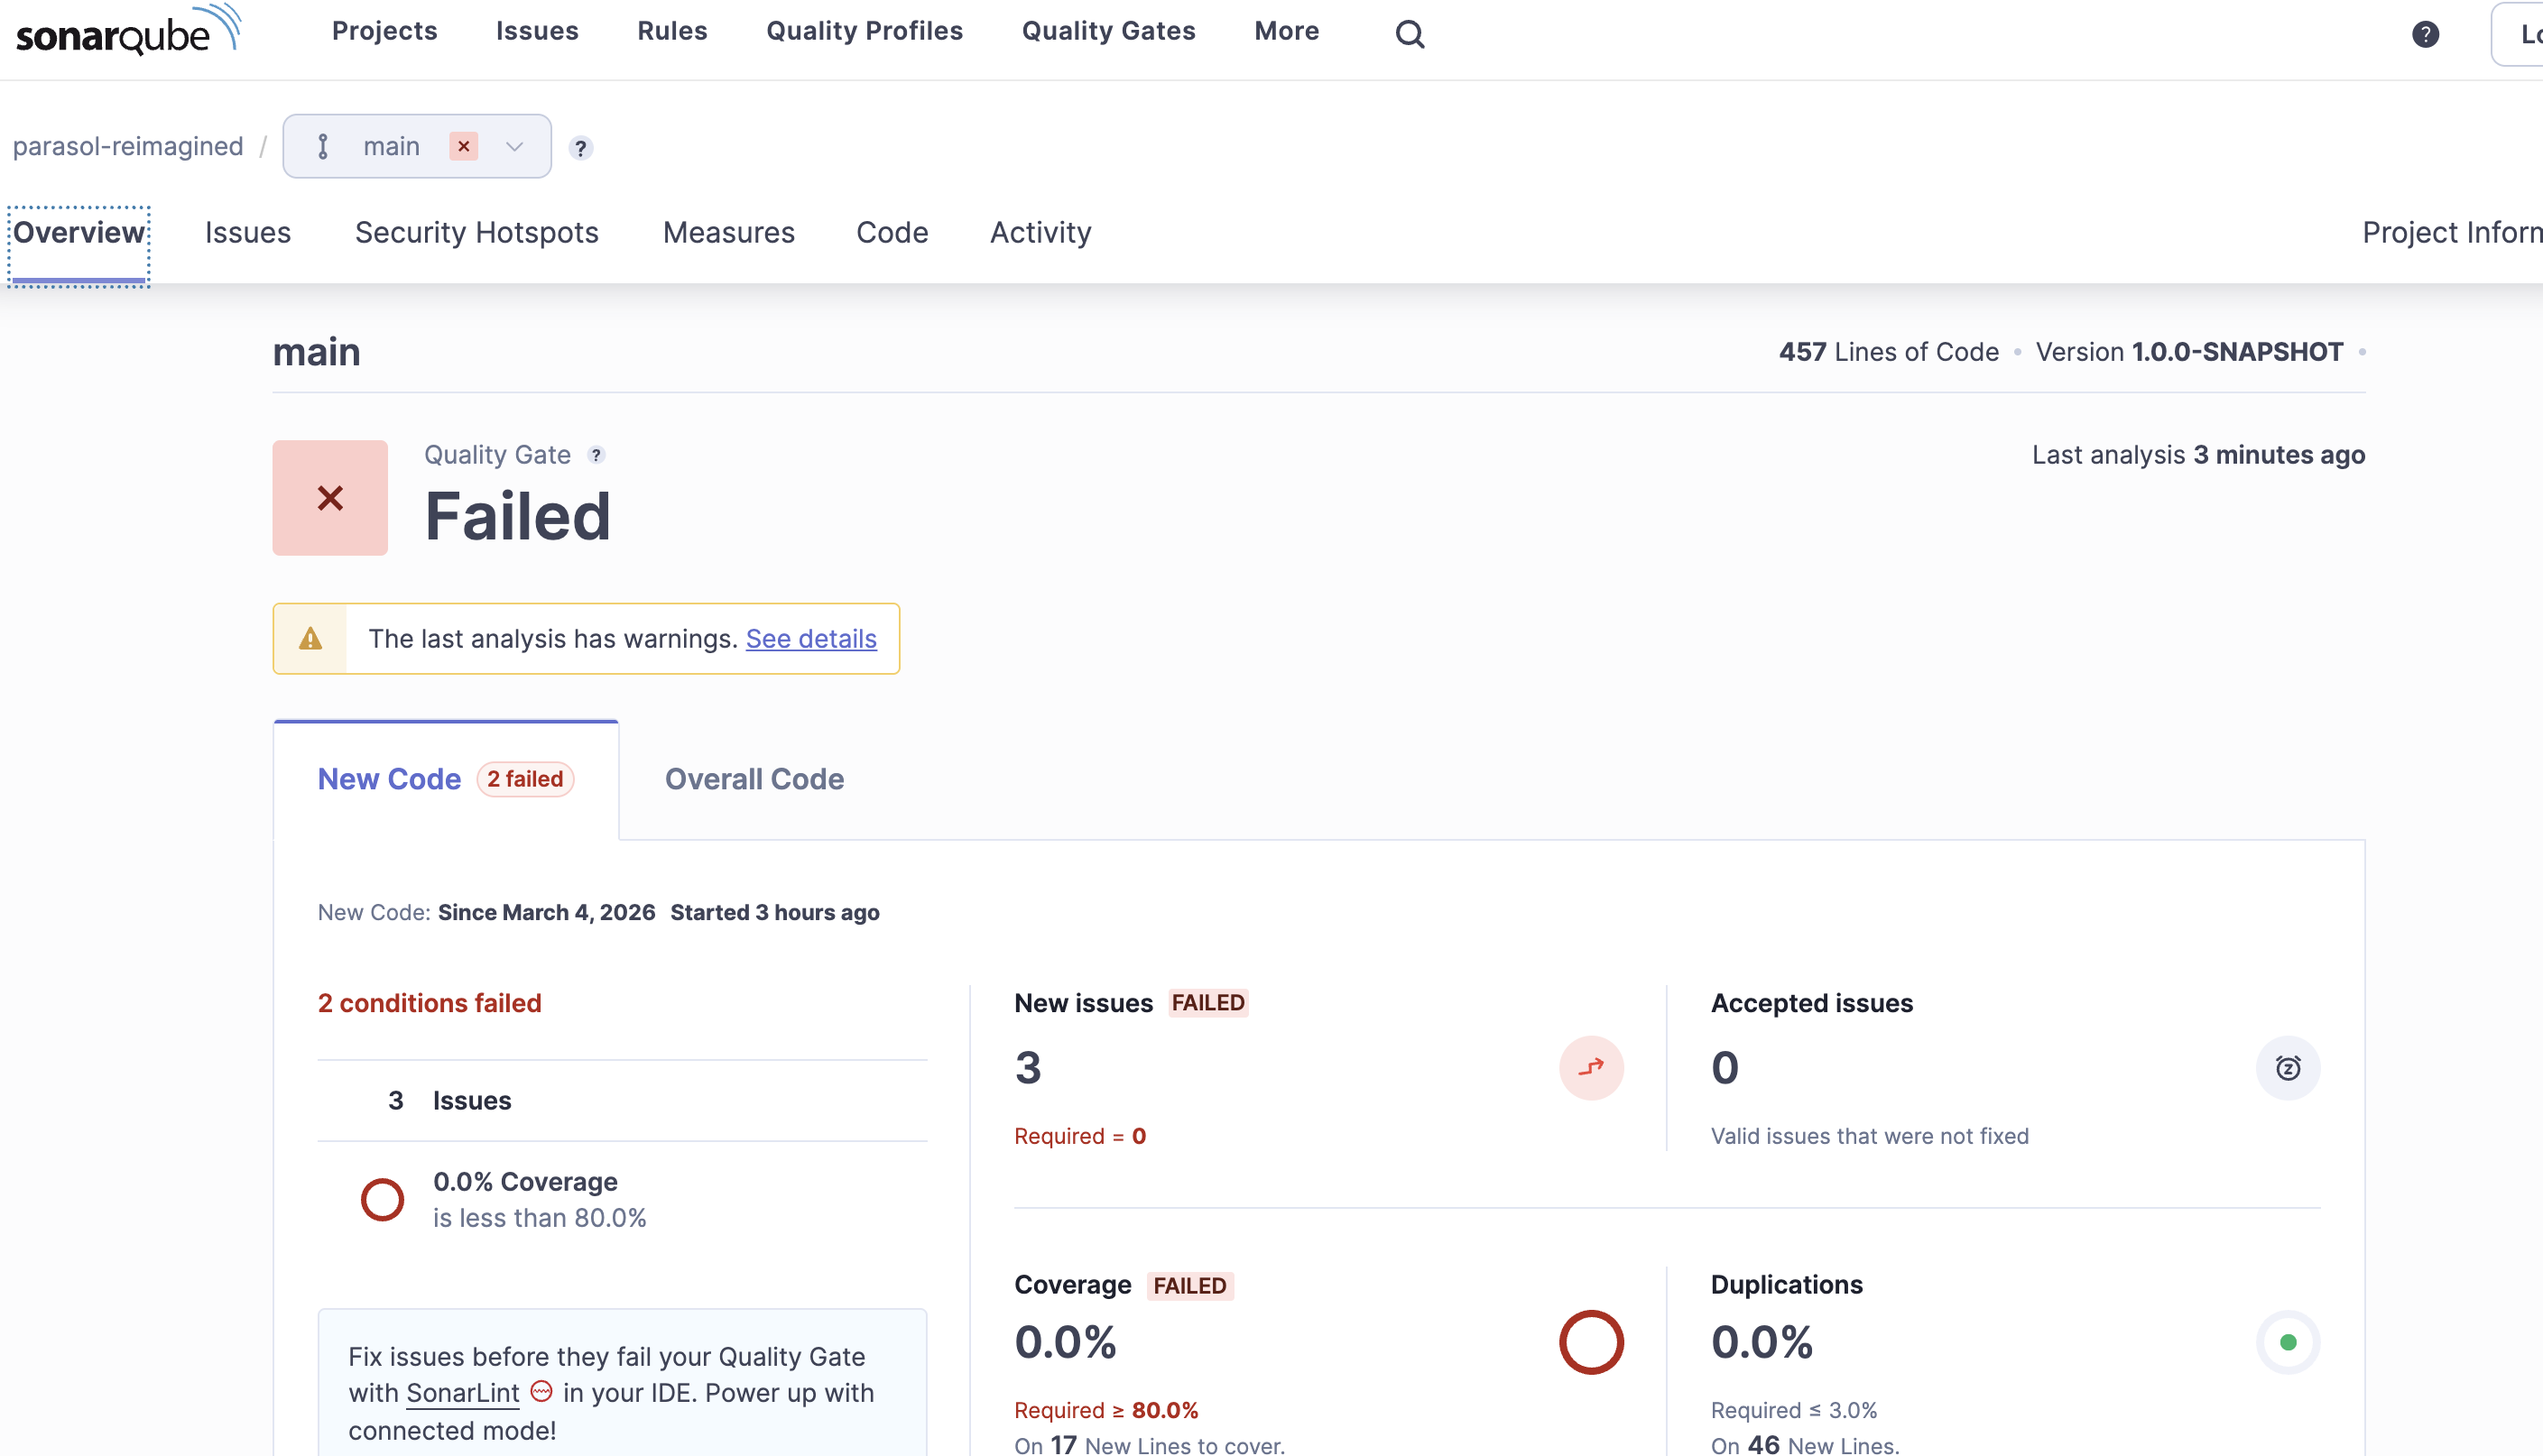 Figure 4. Sonarqube report showing code smell violations
-
-
-
Pause for the business value connection:
-
"These might seem like minor issues, but they compound. At Parasol today, when a production incident occurs, the operations team spends hours searching through logs because developers used
System.out.printlninstead of a proper logger with structured output. And those empty catch blocks? They silently hide failures that surface weeks later as data inconsistencies. The platform just prevented both of those problems."
-
-
Switch back to DevSpaces where the developer’s workspace is still open

-
Open the Continue AI assistant panel on the left sidebar:
-
"This is where the platform’s AI developer capabilities come in. The Continue extension has been pre-configured in the devfile by the platform engineer to use the IT-approved model — in this case, a model hosted on the Red Hat demo platform through OpenShift AI. The developer does not need to configure API keys, choose a model, or worry about data governance. The platform engineer set it up as part of the golden path."
-
-
In the Continue chat, enter a prompt:
The existing src/main/java/com/parasol/ClaimsStatsResource.java has
code smells according to sonarqube - can you fix them? the
system.out.println, field injection, and empty catch block. don't
throw any new exceptions, just log it.
Occasionally the "reasoning" content from the model leaks into the editor (this is a known issue), causing all sorts of chaos. if this happens, reject any changes, and open a new chat (with the
+button) and try an alternative prompt:The existing src/main/java/com/parasol/ClaimsStatsResource.java has code smells according to sonarqube - can you fix them? the system.out.println, field injection, and empty catch block. don't throw any new exceptions, just log it. Please generate a fixed version (do not try to edit it in place).The assistant should give you the code in the response, that you can copy/paste on top of the existing code.
-
Watch as the LLM analyzes the code and generates fixes
-
The AI identifies both issues:
System.out.printlnshould use proper logging, and the empty catch block should be removed -
Review the diff that Continue presents — it shows exactly what changed
-
Accept the changes in the chat by clicking the green checkmark to Accept All (or delete the old code and insert the new code from the assistant).
-
"The AI understood the Sonarqube findings and fixed the code smells. The developer can inspect the diff to verify the changes before accepting them. This is AI-assisted development governed by the platform."
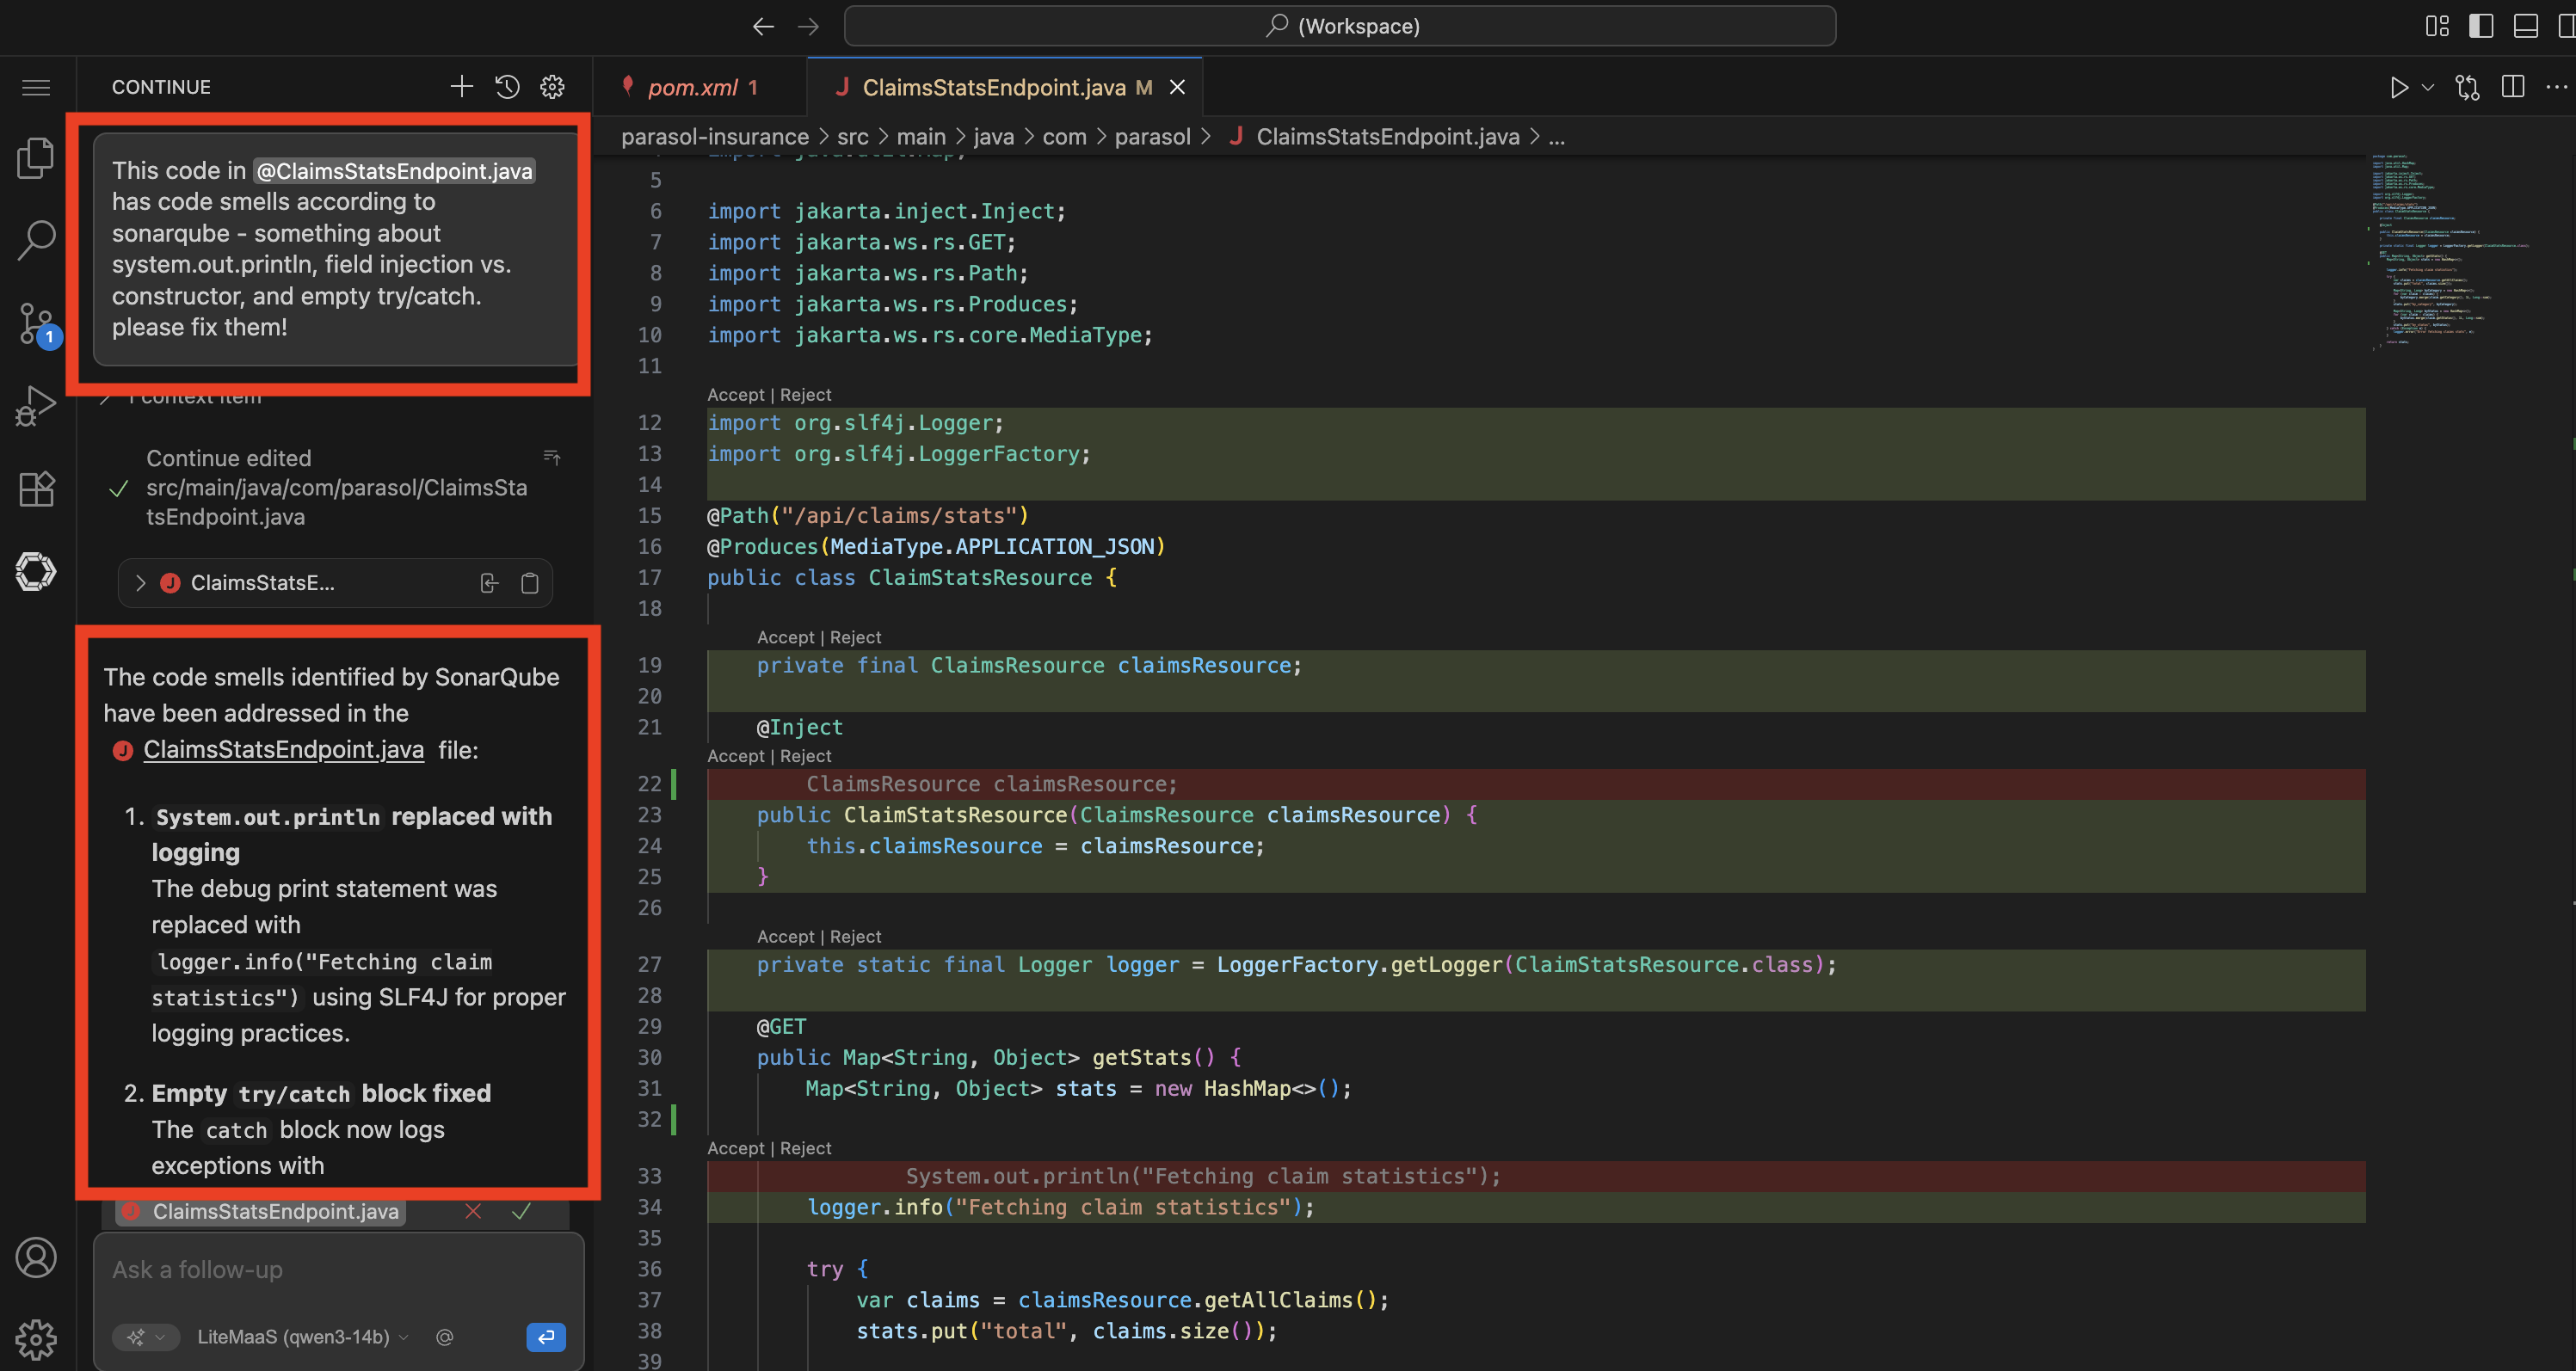 Figure 6. AI-generated code fixes with diff view
-
-
Verify the corrected code looks like this (for reference, or in case the LLM responds differently):
package com.parasol;

import java.util.HashMap;
import java.util.Map;

import io.quarkus.logging.Log;
import jakarta.ws.rs.GET;
import jakarta.ws.rs.Path;
import jakarta.ws.rs.Produces;
import jakarta.ws.rs.core.MediaType;

@Path("/api/claims/stats")
@Produces(MediaType.APPLICATION_JSON)
public class ClaimsStatsResource {

	private final ClaimsResource claimsResource;

	public ClaimsStatsResource(ClaimsResource claimsResource) {
			this.claimsResource = claimsResource;
	}

	@GET
	public Map<String, Object> getStats() {
			Map<String, Object> stats = new HashMap<>();

			Log.info("Fetching claim statistics");

			var claims = claimsResource.getAllClaims();
			stats.put("total", claims.size());

			Map<String, Long> byCategory = new HashMap<>();
			for (var claim : claims) {
					byCategory.merge(claim.getCategory(), 1L, Long::sum);
			}
			stats.put("by_category", byCategory);

			Map<String, Long> byStatus = new HashMap<>();
			for (var claim : claims) {
					byStatus.merge(claim.getStatus(), 1L, Long::sum);
			}
			stats.put("by_status", byStatus);

			return stats;
	}
}
Presenter tip: Depending on the audience, you fan walk through the diff briefly. Point out that
System.out.printlnwas replaced withLog.infofrom the Quarkus logging API — this gives structured logging with timestamps, log levels, and integration with the platform’s observability stack. And the empty try-catch was removed entirely — if something goes wrong, the exception propagates and the platform’s error handling surfaces it properly instead of hiding it. Emphasize that the AI understood the context and made the right fixes without the developer needing to look up the Quarkus logging API. The field-level injection was also moved to constructor injection, which is a best practice for testability and clearer dependencies. The platform’s guardrails (Sonarqube) and AI assistance (Continue) worked together to enforce and achieve code quality. -
Commit and push the fix using the Source Control view as before.
-
The modified
ClaimsStatsResource.javaappears under "Changes" -
Stage the file (click the + next to it), enter a commit message:
Fix code smells: use proper logging and remove empty catch block -
Click the dropdown arrow next to Commit and select Commit & Push
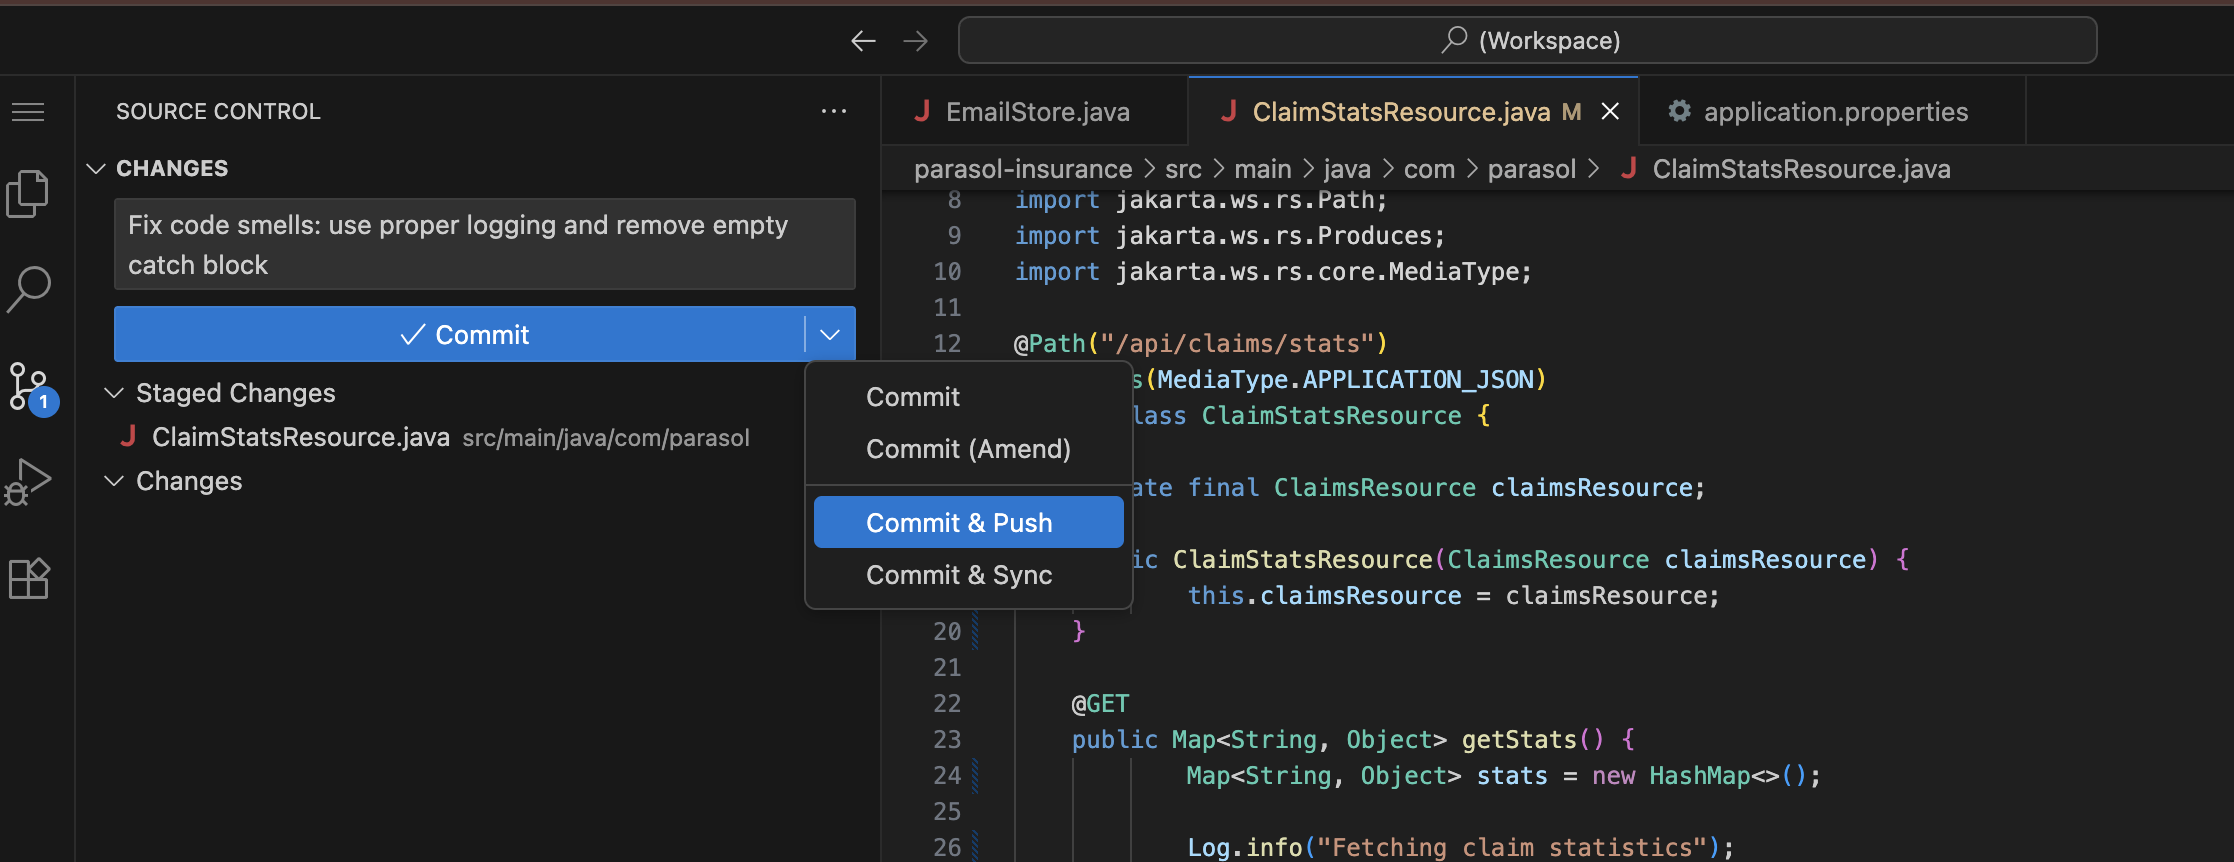 Figure 7. Commit and Push from the Source Control view
-
-
Switch back to the OpenShift web console Pipelines view and show the new pipeline run:
-
A new pipeline run starts automatically (in the
parasol-insurance-buildnamespace) -
Watch the stages progress: Clone, Sonarqube SAST, Build and Push, Re-rollout app
-
The Sonarqube SAST stage passes this time (green status)
-
All remaining stages complete successfully
-
"The developer used AI to fix the code smells, pushed the update, and the pipeline passes. The quality gate is satisfied."
-

What they should notice:
-
The platform caught the code smells automatically. No human reviewer needed to flag them.
-
The Sonarqube report URL was available directly in the pipeline log
-
The failures were specific and actionable: Sonarqube told the developer exactly what to fix and why
-
The developer used AI (Continue extension) to fix the issues instead of manually editing code
-
The AI was pre-configured by the platform engineer in the devfile — the developer did not set it up
-
The fix followed the same workflow: AI-assisted code change, commit and push from the IDE, automatic pipeline run
-
The second pipeline run passed all stages, including the previously failed quality gate
Business value callout:
"This is the platform’s guardrail and AI assistance working together. At Parasol, code smells like these accumulate across hundreds of developers and thousands of commits. Each one seems minor, but together they create a codebase that is difficult to debug, difficult to maintain, and prone to silent failures. The platform caught the problems automatically, and the AI fixed them in seconds. The developer did not need to look up the Quarkus logging API or research exception handling best practices. The platform enforced the standard, the AI resolved it, and the code is now production-ready."
If asked:
- Q: "What if the developer disagrees with the quality gate?"
-
A: "Quality gates are defined by the platform team based on organizational standards. They are not optional for individual developers. However, the platform team can adjust thresholds and rules as the organization matures. The goal is to establish a baseline that everyone follows."
- Q: "What other code smells does Sonarqube catch?"
-
A: "Sonarqube enforces hundreds of coding rules across multiple dimensions: code smells (complexity, duplication, naming conventions), bugs (null pointer risks, resource leaks, logic errors), vulnerabilities (SQL injection, XSS, hardcoded credentials), and security hotspots. The platform team configures which rules are active and which are quality gate blockers. The platform team can integrate with other scanning tools as well if they want to cover additional languages or specific security checks."
- Q: "Why not catch these in the IDE before pushing?"
-
A: "IDE plugins like SonarLint can surface some issues during development, and organizations can enable that as well. But the pipeline quality gate is the authoritative enforcement point — it ensures standards are met regardless of what tools the developer has configured locally. Defense in depth: catch what you can early, enforce what you must in the pipeline."
- Q: "What about more complex issues like security vulnerabilities?"
-
A: "Sonarqube handles SAST (Static Application Security Testing) in addition to code smell detection. In Section 2 of this demo, we add additional security layers: Trusted Artifact Signer for code signing and provenance, ACS for container image scanning, Tekton Chains for image signing, and admission control for deployment verification. The pipeline is extensible."
Part 3 — GitOps-driven delivery with Argo CD
Know
With the pipeline passing, the CI process hands off to CD. Argo CD manages deployments using GitOps principles: the desired application state is declared in Git, and Argo CD continuously reconciles the cluster to match. This ensures consistent, auditable, and repeatable deployments across all environments.
Business challenge:
-
Manual deployments are error-prone and difficult to audit
-
Configuration drift between environments causes "works in staging, fails in production" issues
-
No single source of truth for what is deployed where
-
Rollbacks require manual intervention and deep operational knowledge
Current state at Parasol:
-
Deployments require 3 separate manual approval steps and ticket queues
-
Configuration drift between staging and production causes regular incidents
-
No centralized view of what version is deployed in each environment
-
Rollbacks take hours and require senior engineer involvement
Value proposition:
GitOps with Argo CD makes Git the single source of truth for deployments. Every change is versioned, auditable, and repeatable. Argo CD continuously monitors the cluster and automatically corrects any drift. Rollbacks are as simple as reverting a Git commit. The application is deployed with all its dependencies (Kafka, database, etc.) managed declaratively.
Show
What I say:
"The pipeline passed. The image is built, tested, scanned, and pushed to the registry. Now what? At Parasol today, this is where the developer files a deployment ticket and waits 3-5 days. With GitOps, the deployment happens automatically. Let me show you."
What I do:
-
Open the Argo CD console (rhdh-gitops instance) at https://rhdh-gitops-server-rhdh-gitops.{openshift_cluster_ingress_domain}:
-
Log in as
admin. Retrieve the password using one of these methods:-
Option A (CLI): Run this command in a terminal:
oc get secret rhdh-gitops-cluster -n rhdh-gitops -o jsonpath='{.data.admin\.password}' | base64 -d -
Option B (Console): In the OpenShift web console, navigate to Workloads → Secrets in the
rhdh-gitopsnamespace, find therhdh-gitops-clustersecret, and copy theadmin.passwordvalue
-
-
-
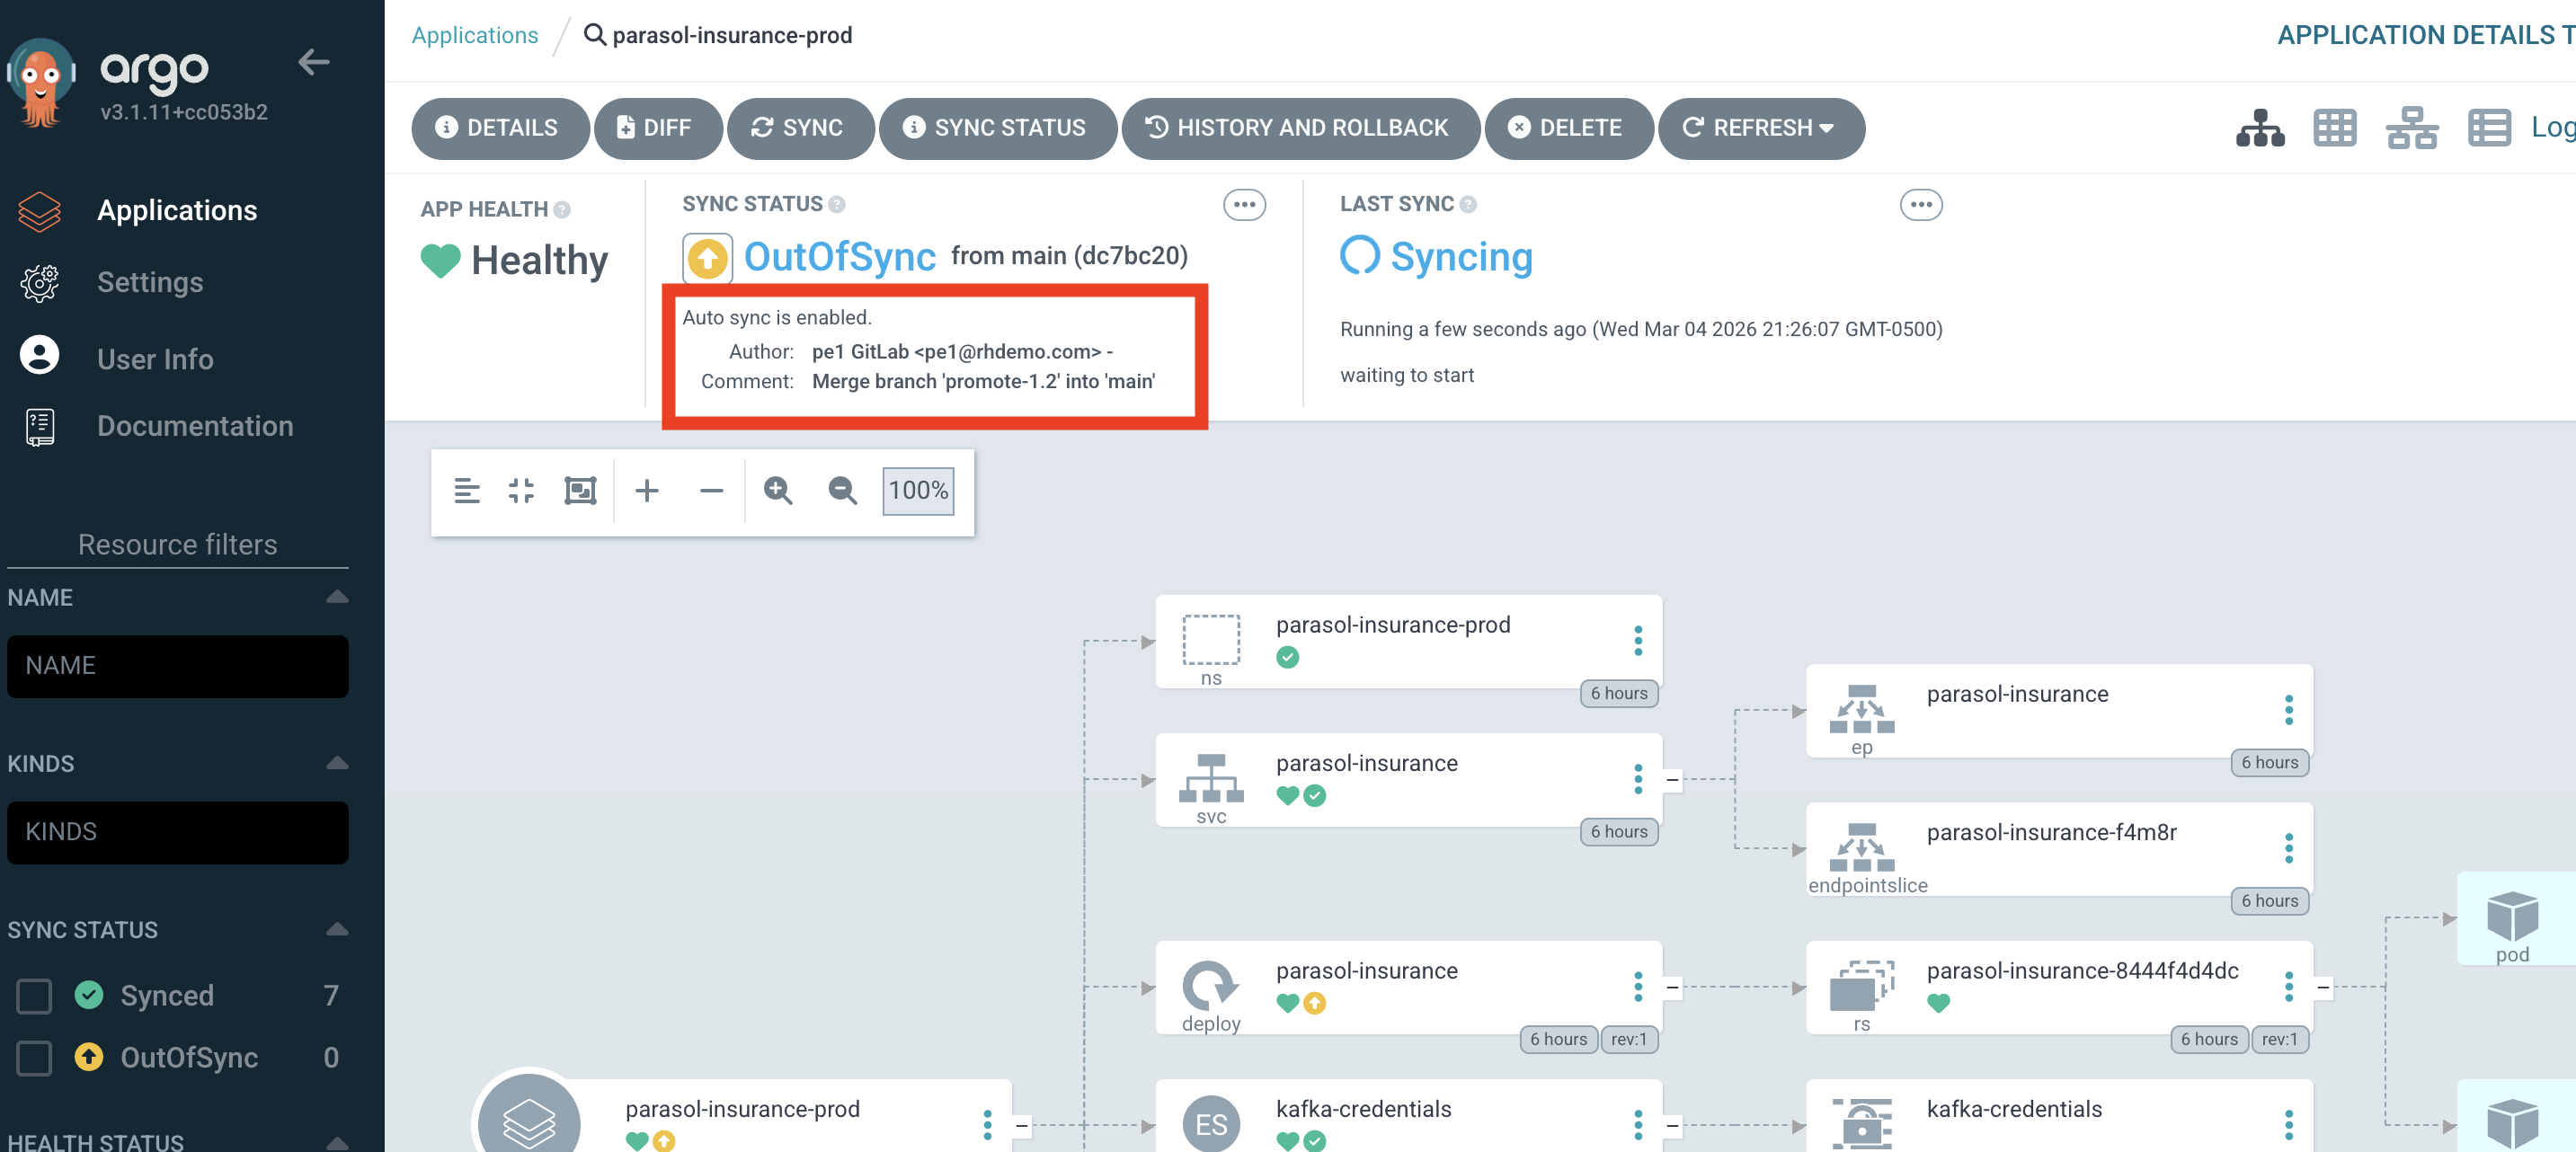
Show the Parasol application in the Argo CD dashboard:
-
You will see several parasol applications representing different environments (dev, prod, and a couple used in section 2). You want to look at the parasol-insurance-dev application, which represents the dev environment where the pipeline deploys to.
-
Since this is a developer’s local environment, the
latesttag is used, ensuring that the latest successful build from the pipeline is deployed automatically. You can note this in the timestamps of the pod shown in Argo. -
"Argo CD continuously compares what is declared in Git with what is running in the cluster. It has detected that the pipeline produced a new image, and the desired state has changed."
-
-
Walk through the Argo CD sync process:
-
OutOfSync — Argo CD detects that the desired state in Git differs from the running state in the cluster
-
Syncing — Argo CD applies the new configuration to the cluster
-
Synced/Healthy — The application is running with the new version
-
"When the states differ, Argo CD reconciles automatically. No manual deployment step required."
-
-
Show the Argo CD application view with all managed resources:
-
Expand the resource tree to show the Parasol application and its dependencies
-
Point out the deployment, service, route, and any dependent resources (database, Kafka, etc.)
-
"All of these are managed declaratively through GitOps. The developer does not deploy individual components. Argo CD manages the entire application stack."
-
-
Open the running Parasol application to verify the new feature is live:
-
Navigate to the claims statistics endpoint at
/api/claims/statsusing the route URL provided in the OpenShift console in theparasol-insurance-devnamespace -
Show the claims statistics data that the developer’s new endpoint returns
-
Verify the endpoint is working in the deployed application
-
"The claims statistics API that our developer added is now live in the dev environment. It has been built, scanned for quality, and deployed, all automatically. The developer pushed code and the platform handled everything else."
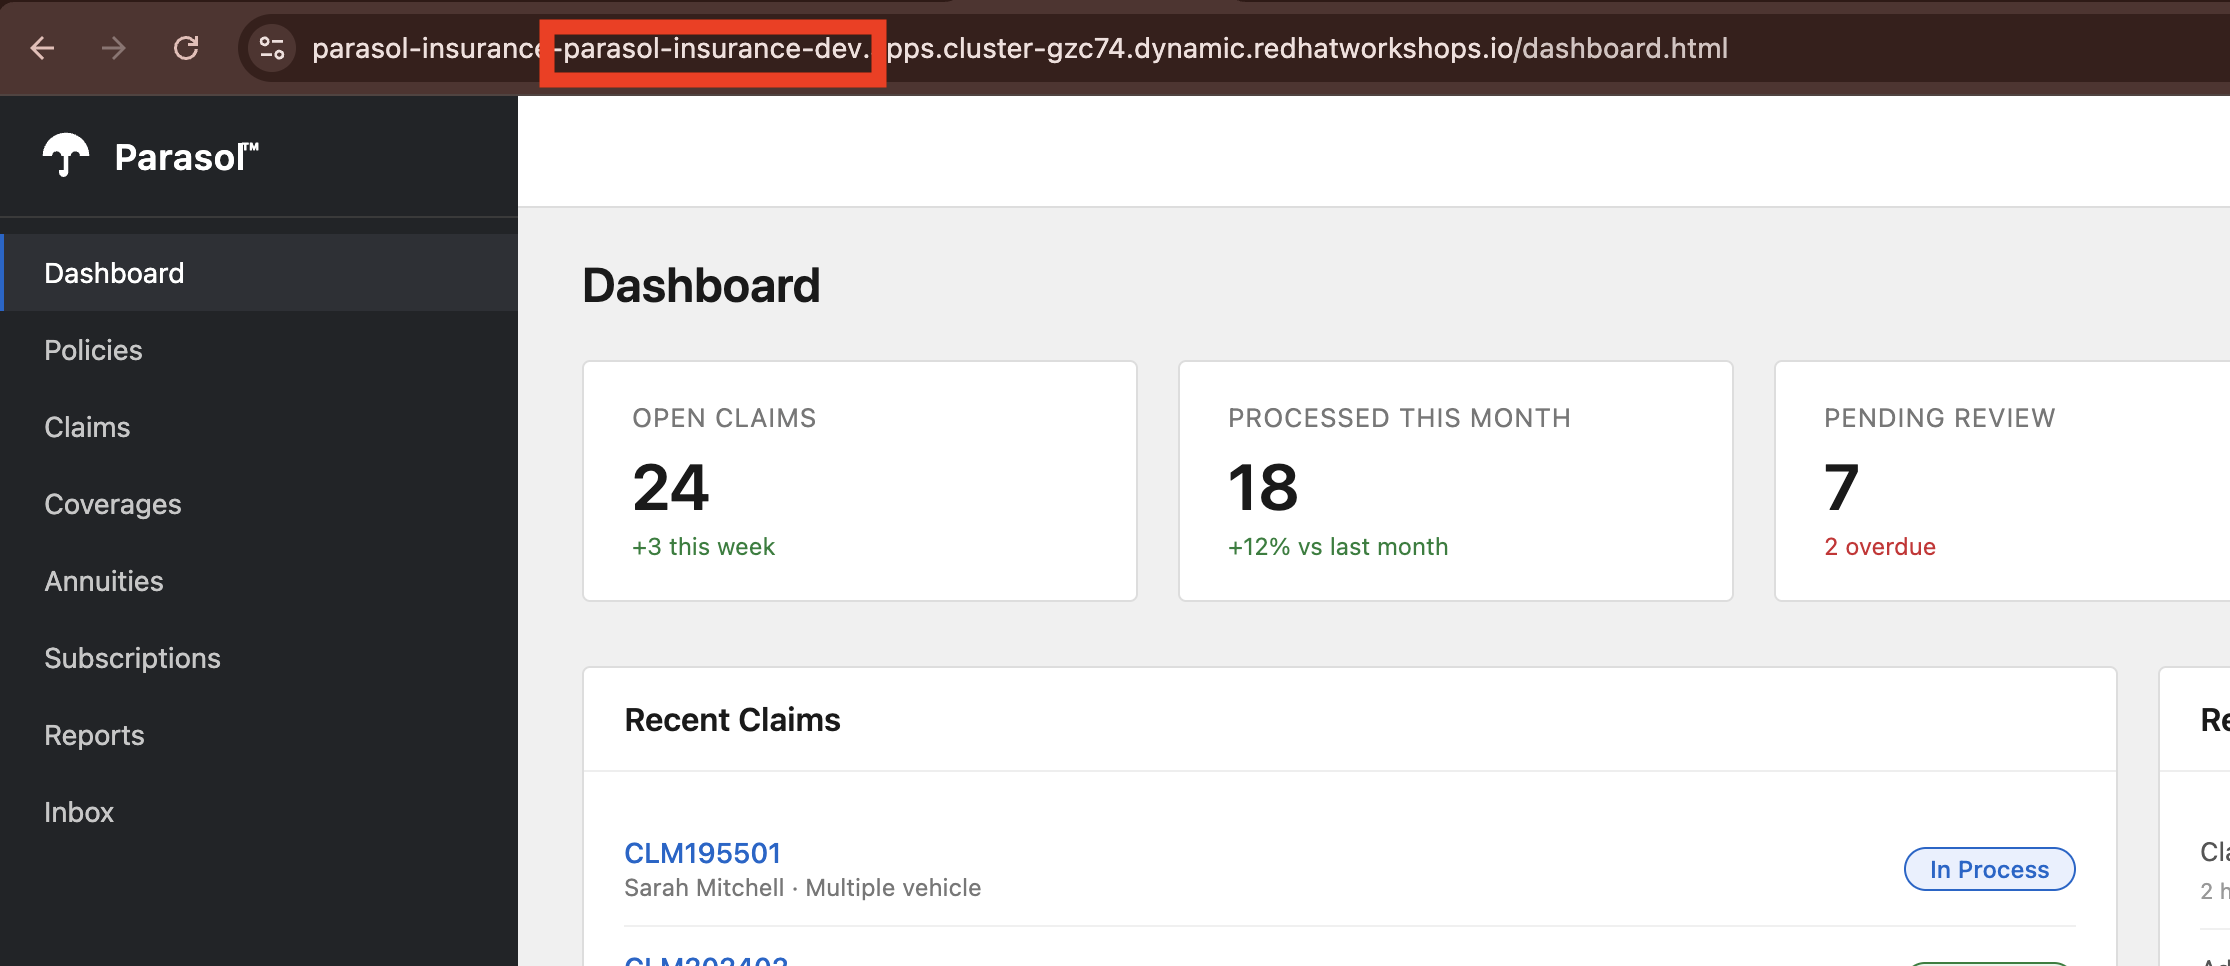 Figure 9. Claims app deployed and live in the Parasol dev environment
-
-
Promote to Production (optional, if time allows):
-
As a platform engineer, you can trigger a promotion to production by creating a new tag in the source repository, and then approving the merge request (MR) to update the production GitOps repository to use the new tag. This separates responsibilities between developers and platform operators, while still keeping the process automated and auditable.
-
Log into GitLab as the
pe1user, navigate to theparasol-insurancerepository, noting the latest commit from the developer. -
Click on Tags on the right, and select New Tag to create a new tag, with a name (e.g.
1.1, orprod-20240601) and linking it to the latest commit on themainbranch. You can leave the rest of the fields blank, scroll to the bottom and click Create tag. -
With the new tag created, a new pipeline begins to build the production image (at the specified tag), and issue a new MR to the GitOps repo to update the production image.
-
Once the pipeline completes, navigate to the GitOps repository in GitLab, and you will see a new MR to update the production image tag. Review the MR and approve/merge it to merge the change.
-
With the change merged, Argo CD detects the new desired state and deploys the new version to production automatically.
-
What they should notice:
-
The deployment happened automatically after the pipeline passed. No tickets, no manual steps.
-
Argo CD provides a visual resource tree showing the entire application stack and its health
-
The developer can see the deployment status without needing specialized knowledge
-
The claims statistics endpoint that was added in Module 1, caught by the pipeline for code smells in Part 2, and fixed by the developer is now live in the production environment, demonstrating the full inner loop to outer loop journey.
-
The entire journey from code change to production deployment happened in a single demo session
Business value callout:
"Let me recap the journey. In Module 1, a developer added a claims statistics endpoint in minutes using DevSpaces and Quarkus dev mode. They pushed the code, and the platform’s CI/CD pipeline caught code smells — improper logging and an empty catch block. The developer fixed both issues in minutes, pushed again, and the pipeline passed. Argo CD deployed the change automatically through GitOps. What used to take Parasol 3-5 days of manual handoffs, tickets, and approvals just happened in minutes, with zero human bottlenecks and full quality enforcement."
If asked:
- Q: "What happens if the deployment fails?"
-
A: "Argo CD supports automatic rollback. If the new version fails health checks, Argo CD can revert to the previous healthy state. The rollback is also captured in Git, so there is a full audit trail of what was deployed and when."
- Q: "Can we deploy to multiple environments?"
-
A: "Yes. Argo CD can manage multiple environments (dev, staging, production) with promotion gates between them. Each environment has its own Git configuration, and promotion is as simple as merging a change from one branch to another."
- Q: "What about configuration differences between environments?"
-
A: "Argo CD supports Kustomize overlays and Helm values files for environment-specific configuration. The base application definition is the same, but each environment can override specific values like replica counts, resource limits, or feature flags."
- Q: "What if someone makes a manual change in the cluster?"
-
A: "Argo CD detects configuration drift and can automatically correct it. If someone manually changes a deployment in the cluster, Argo CD reverts the change to match what is declared in Git. Git is always the source of truth."
Module 2 summary
What we demonstrated
In this module, you saw how the platform’s CI/CD pipeline enforces quality and automates delivery:
-
Automated pipeline triggering — A commit and push from DevSpaces triggered a full Tekton pipeline with Clone, Sonarqube SAST, Build and Push, and Re-rollout stages, visible in the OpenShift web console
-
Quality enforcement — The Sonarqube quality gate caught code smells (improper logging and empty exception handling), with a direct link to the Sonarqube report in the pipeline log
-
AI-assisted remediation — The developer used the Continue AI assistant (pre-configured by the platform engineer) to fix the code smells, reviewing the diff before accepting the changes
-
GitOps delivery — Argo CD managed the deployment declaratively, with the sync process visible in the Argo CD console
Setting up Module 3
The application is now deployed in production with the new feature, having passed all quality gates. In Module 3, we will see how the platform handles the operational concerns: traffic management, security, and observability across the deployed services.
Presenter transition
|
Presenter tip: The transition to Module 3 should emphasize the shift from development to operations: "Now that the application is deployed and verified, let’s look at how the platform handles the operational side, the cross-cutting concerns that every application needs but no individual developer should have to build." |