Module 3: Platform operations (operating at scale)
Presenter note: This module shows how the platform handles cross-cutting operational concerns after the application is deployed in production. It covers Service Mesh for traffic management and security, OpenShift Observability, autoscaling with HPA, and external secrets management with Vault. Target duration: 20 minutes across 4 parts.
Part 1 — Traffic management and security with Service Mesh
Know
With the Parasol application deployed and running, the platform handles cross-cutting concerns that would otherwise require significant development effort in each service. OpenShift Service Mesh provides traffic management, mutual TLS encryption (supported, but not part of demo), and least-privilege access controls without any application code changes.
Business challenge:
-
Service-to-service communication is unencrypted and ungoverned
-
Traffic routing changes require application code modifications and redeployments
-
No consistent security policies across services
-
Compliance requirements demand encryption in transit and access controls
Value proposition:
Service Mesh provides traffic management, mTLS encryption, and fine-grained access policies as platform capabilities. Developers do not need to implement these in their application code. The platform team configures policies once, and they apply consistently across all services. This separation of concerns reduces developer cognitive load while meeting enterprise security and compliance requirements.
Show
What I say:
"The application is deployed, the pipeline is automated, and GitOps handles delivery. But there is a whole class of operational concerns that every application needs: encryption between services, traffic management, access control. Traditionally, developers have to build these into their application code. With Service Mesh, the platform handles them automatically."
What I do:
-
Open the OpenShift web console at {openshift_cluster_console_url}[{openshift_cluster_console_url}^] and log in as
pe1/{common_password}(platform engineer persona) -
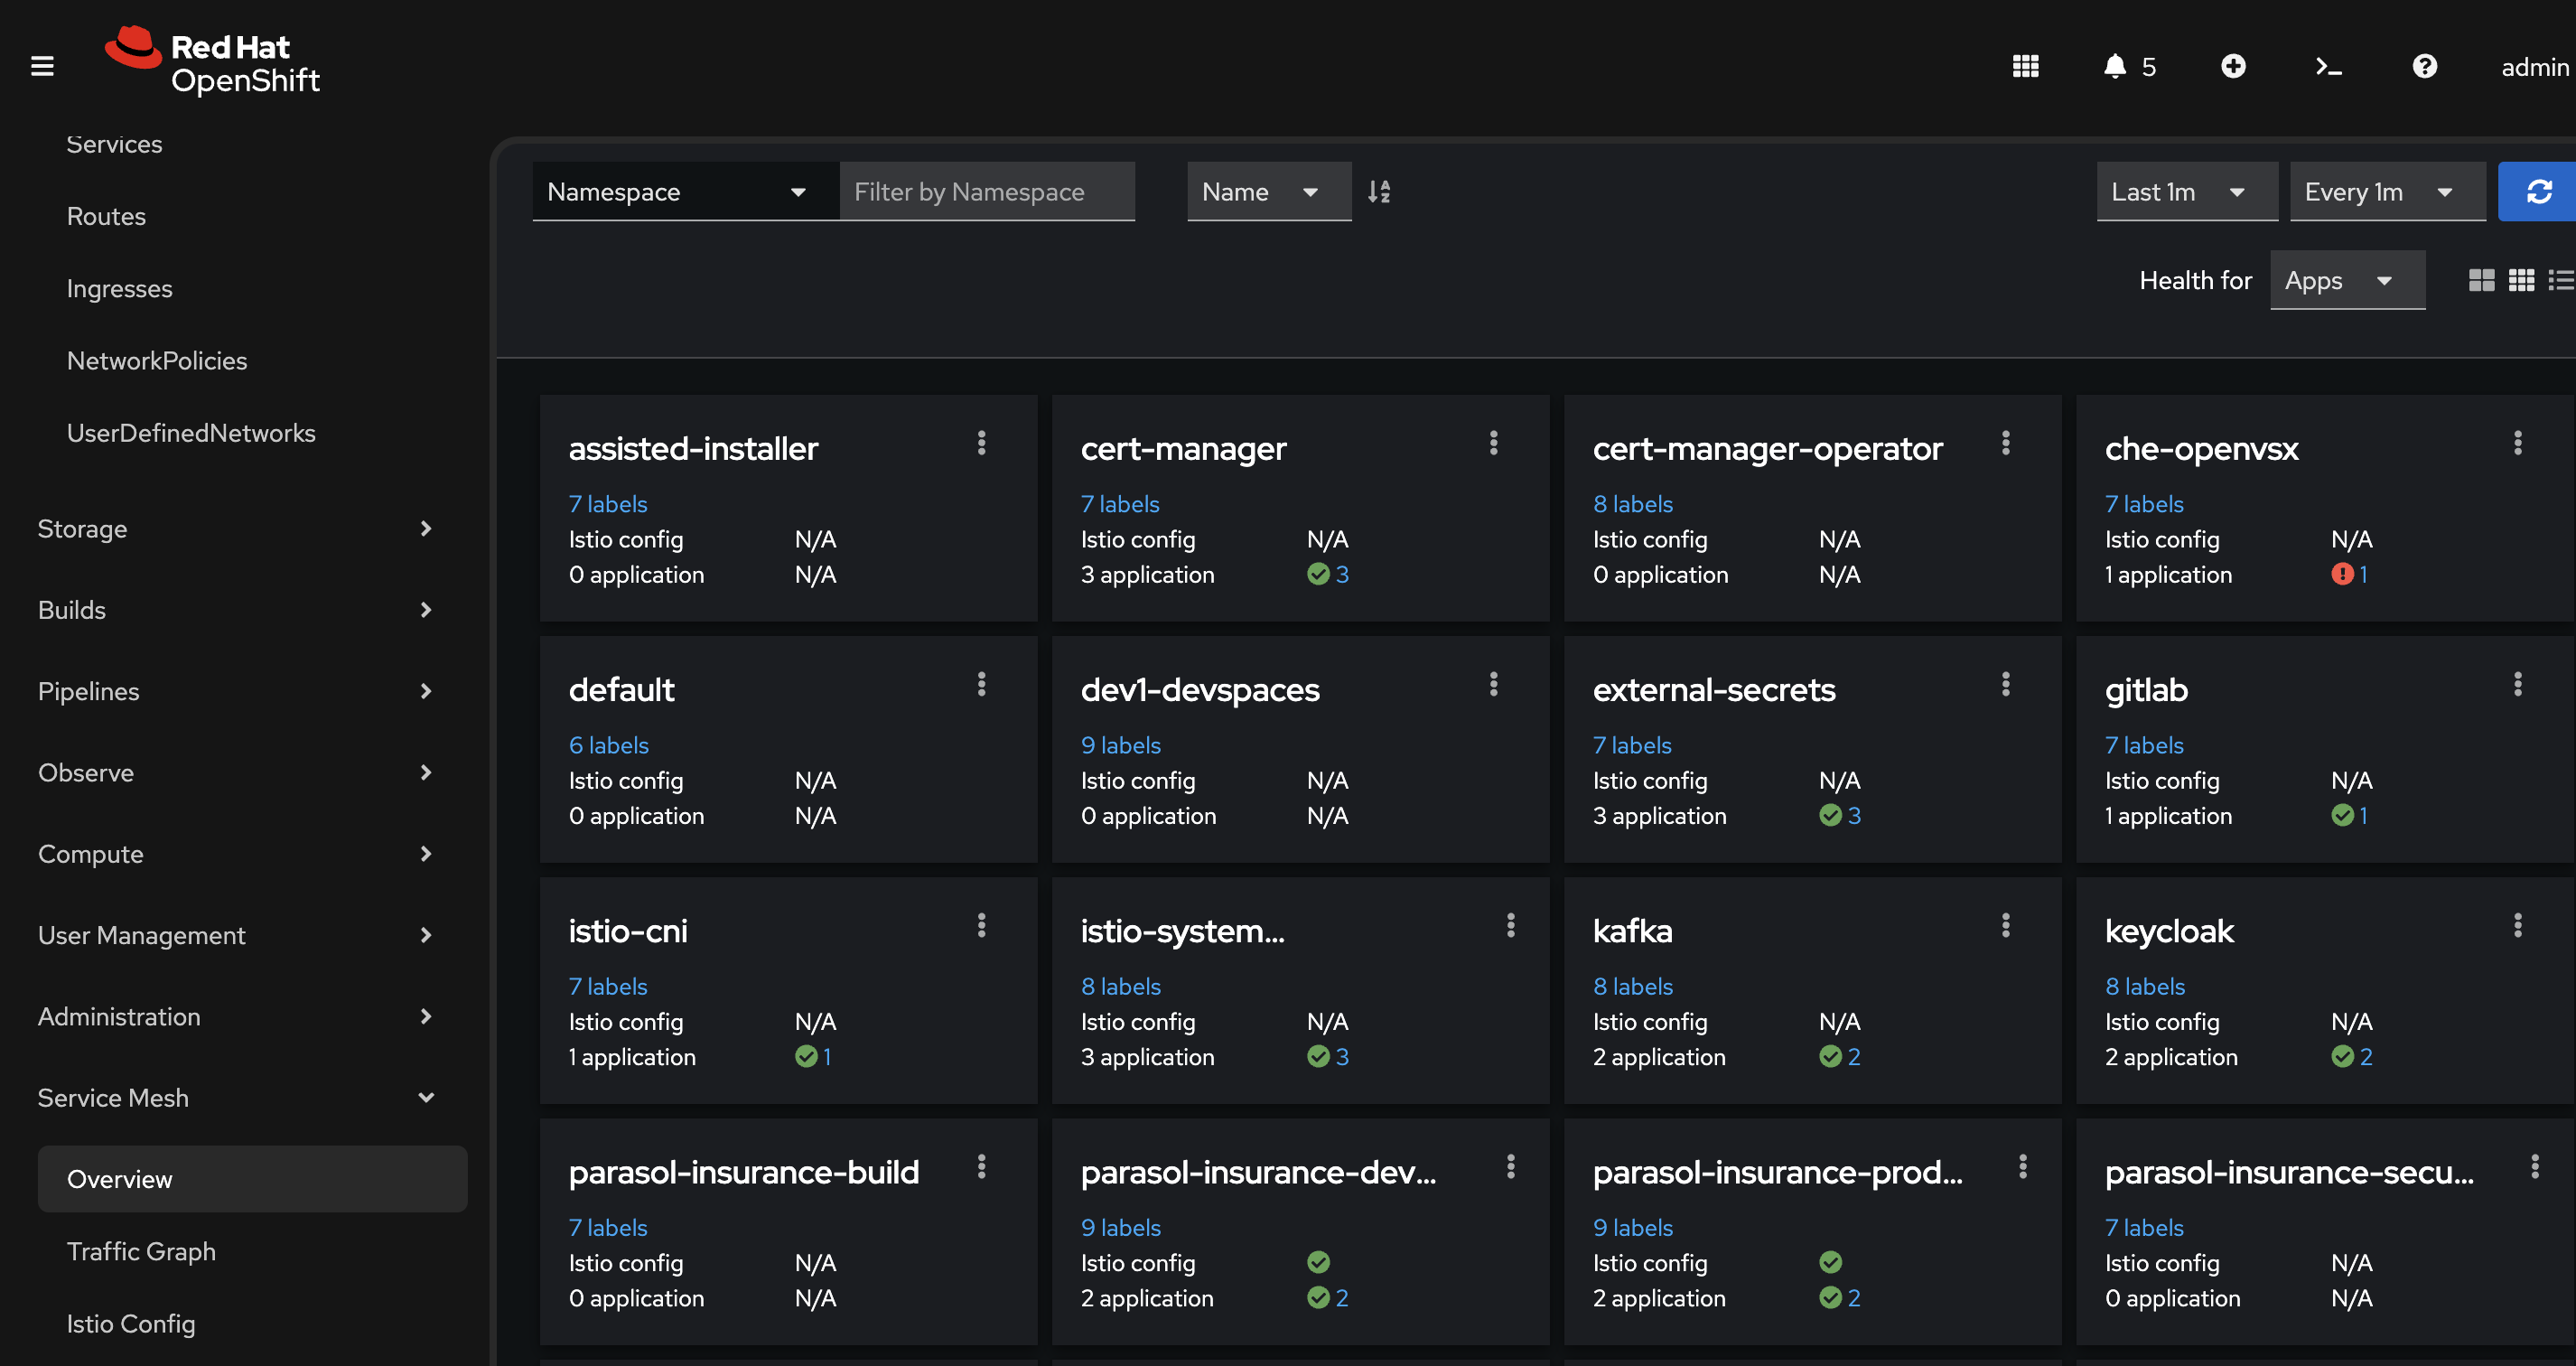
Navigate to the Service Mesh top-level menu and select Overview (the Service Mesh console, powered by Kiali):
-
This is integrated directly into the OpenShift console. No separate tool to access.
-
"The Service Mesh console is built into OpenShift. The platform engineer does not need a separate dashboard. Everything is accessible from the same console."
-
-
On the Overview page, show the namespaces enrolled in the mesh:
-
Point out the health indicators (green for healthy). Some namespaces are enrolled in the mesh, some are not (indicated by the presence of "istio config" field).
-
"All services enrolled in the mesh get mutual TLS encryption automatically. The developers did not write a single line of TLS code. The mesh handles certificate generation, rotation, and validation automatically. This satisfies the compliance requirement for encryption in transit."
-
-
Search for parasol-insurance-prod in the overview:
-
Point out the production namespace with its services
-
"Here is the Parasol application’s production namespace. The platform manages communication between all services automatically."
-
-
Click the three-dot menu (kebab menu) next to
parasol-insurance-prodand select Update Traffic Policies:-
Show the traffic policy creation form.
-
"This is where the platform engineer can define traffic routing policies — canary deployments, traffic splits, rate limiting, circuit breakers — all without touching application code. The mesh applies these policies at the infrastructure level."
-
"For example, if Parasol wants to roll out a new version to 10% of traffic first, the platform engineer configures it here. No code changes, no redeployments, just a policy change."
Presenter tip: Do not actually create/edit the policy. The goal is to show the capability and explain the business value. Cancel out of the form after showing it.
-
-
Briefly discuss access policies (talk track):
-
"Service Mesh also supports authorization policies that control which services can communicate with each other. This is the principle of least privilege applied to service-to-service communication. Only authorized services can make requests. This is configured by the platform team, not the developers."
-
What they should notice:
-
Service Mesh is integrated into the OpenShift console. No separate tool required.
-
mTLS encryption is automatic. The developers did not write any TLS code.
-
Traffic visibility is built in. The platform engineer can see how services communicate in real time.
-
Access policies enforce least privilege at the service level without application code changes.
-
All of these capabilities are configured by the platform team and apply consistently.
Business value callout:
"At Parasol today, service-to-service communication is unencrypted, and compliance audits flag it every quarter. Implementing mTLS in application code would require changes to every service, months of development work, and ongoing maintenance. The mesh handles it as a platform capability. The platform team enabled it once, and it applies to every service automatically. The compliance gap is closed without any developer effort."
If asked:
- Q: "Does this add latency to requests?"
-
A: "The sidecar proxy adds minimal latency, typically less than 1 millisecond per hop. For the vast majority of applications, this is negligible compared to the security and observability benefits. Ambient mode reduces this even more by eliminating the sidecar for certain workloads."
- Q: "What about services that are not in the mesh?"
-
A: "Services can be enrolled in the mesh incrementally. The platform team can start with critical services and expand over time. Services outside the mesh can still communicate, but they do not get mTLS or traffic management benefits."
- Q: "Can we do canary deployments with this?"
-
A: "Yes. Service Mesh supports traffic splitting, where you can route a percentage of traffic to a new version while the rest goes to the stable version. This is configured through the mesh, not in application code."
Part 2 — Observability with the Service Mesh console
Know
Platform engineers and developers need visibility into how services interact, where traffic flows, and what the health of the system looks like. The OpenShift Service Mesh console (powered by Kiali) provides a real-time service graph, traffic flow visualization, health monitoring, and detailed metrics for all services in the mesh.
Business challenge:
-
No visibility into service-to-service communication patterns
-
Troubleshooting distributed applications requires manual log correlation
-
Performance bottlenecks are difficult to identify without traffic visualization
-
Mean time to resolution (MTTR) is high due to lack of observability
Value proposition:
The Service Mesh console provides an intuitive, real-time view of the entire service mesh. Platform engineers can see traffic flow as an animated graph, identify unhealthy services instantly through color coding, drill into detailed metrics (requests per second, error rates, latency distributions), and trace individual requests across services. This reduces MTTR and gives both developers and operations teams a shared understanding of application behavior.
Show
What I say:
"Now let me show you the observability side. We have encryption and traffic management, but the platform engineer also needs to see what is happening. How is traffic flowing? Are there errors? Where are the bottlenecks? The Service Mesh console gives you all of that in real time."
What I do:
-
Generate traffic for the graph. The traffic graph needs active traffic flowing between services to show useful data. Use the Web Terminal (click the
>_icon at the top of the OpenShift Console) to run a load generator pod inside the cluster. Internal traffic flows through the waypoint proxy, which provides the HTTP-level metrics that Kiali displays. External traffic can be configured to also flow through the waypoint proxy if that is of interest.oc run load-generator --image=quay.io/curl/curl:latest \ -n parasol-insurance-prod --restart=Never -- /bin/sh -c \ "while true; do curl -s -o /dev/null http://parasol-insurance.parasol-insurance-prod.svc:8080/api/claims; done" -
From the Overview page, click the three-dot menu (kebab menu) next to
parasol-insurance-prodand select Graph:-
On the Display menu, enable Traffic Animation, and set the refresh rate to 10 seconds at the upper right.
-
Show the service graph with animated traffic flow between the Parasol services
-
"This is a live traffic graph. The lines represent actual requests flowing between services right now. The animation shows the direction and volume of traffic."
-
Point out the service nodes and the connections between them
 Figure 2. Service Mesh Traffic Graph with animated traffic flow between services
-
-
Show the health indicators on the graph:
-
Green nodes indicate healthy services
-
Point out request success rate indicators on the connections
-
"At a glance, the platform engineer can see that both services are healthy and traffic is flowing normally. If a service starts failing, the node turns yellow or red immediately. No need to dig through logs to discover a problem."
-
-
Click on a service node to show detailed metrics:
-
Show the side panel with service details
-
Point out key metrics (not all are shown all the time)
-
Requests per second — current throughput
-
Error rate — percentage of failed requests (4xx and 5xx responses)
-
Response time — p50, p95, and p99 latency percentiles
-
-
"The platform engineer can see exactly how each service is performing. If latency spikes or error rates increase, they know immediately which service is affected and can drill in further."
-
-
Show the Workload or Service detail view:
-
Navigate to the detail view for one of the Parasol services
-
Show the inbound and outbound traffic metrics
-
Show the traffic breakdown by response code (200, 400, 500, etc.) (note: these aren’t shown in ambient mode)
-
"This is the level of detail you get without adding a single line of instrumentation to the application. The mesh collects all of this automatically."
-
-
Demonstrate the traffic animation and graph layout options:
-
Toggle different graph layouts (app graph, versioned app graph, workload graph)
-
Show how the graph adapts to show different perspectives
-
"Platform engineers can view traffic by application, by workload, or by version. During a canary deployment, for example, you can see traffic split between the old and new versions in real time."
-
-
Demonstrate fault injection to show how the mesh helps test application resilience:
-
In the traffic graph, click on the parasol-insurance service node (the triangle icon)
-
Click the three-dot menu on the right side panel and select Fault Injection
-
Select Add HTTP Abort and set the Abort Percentage to
5 -
Click Preview to see the new DestinationRule that will be applied, then click Create to inject the fault, and confirm the creation by clicking Create again.
-
"The platform engineer just injected a 5% failure rate into the Parasol service — without touching any application code. This is useful for testing how applications behave when facing network failures. You can also inject latency, timeouts, and other fault conditions to simulate real-world degradation."
-
Watch the traffic graph animation — error percentages start rising and the service node turns yellow, signaling to the platform engineer that something needs investigation
-
"Notice the service turned yellow and the error rate is climbing. In a real scenario, this is exactly what the platform engineer would see if a downstream service started failing. The mesh gives immediate, visual feedback — no need to dig through logs."
-
After demonstrating, remove the fault injection by clicking the three-dot menu again, selecting Delete Traffic Routing, and confirming
-
-
Show workload observability using the OpenShift built-in monitoring:
-
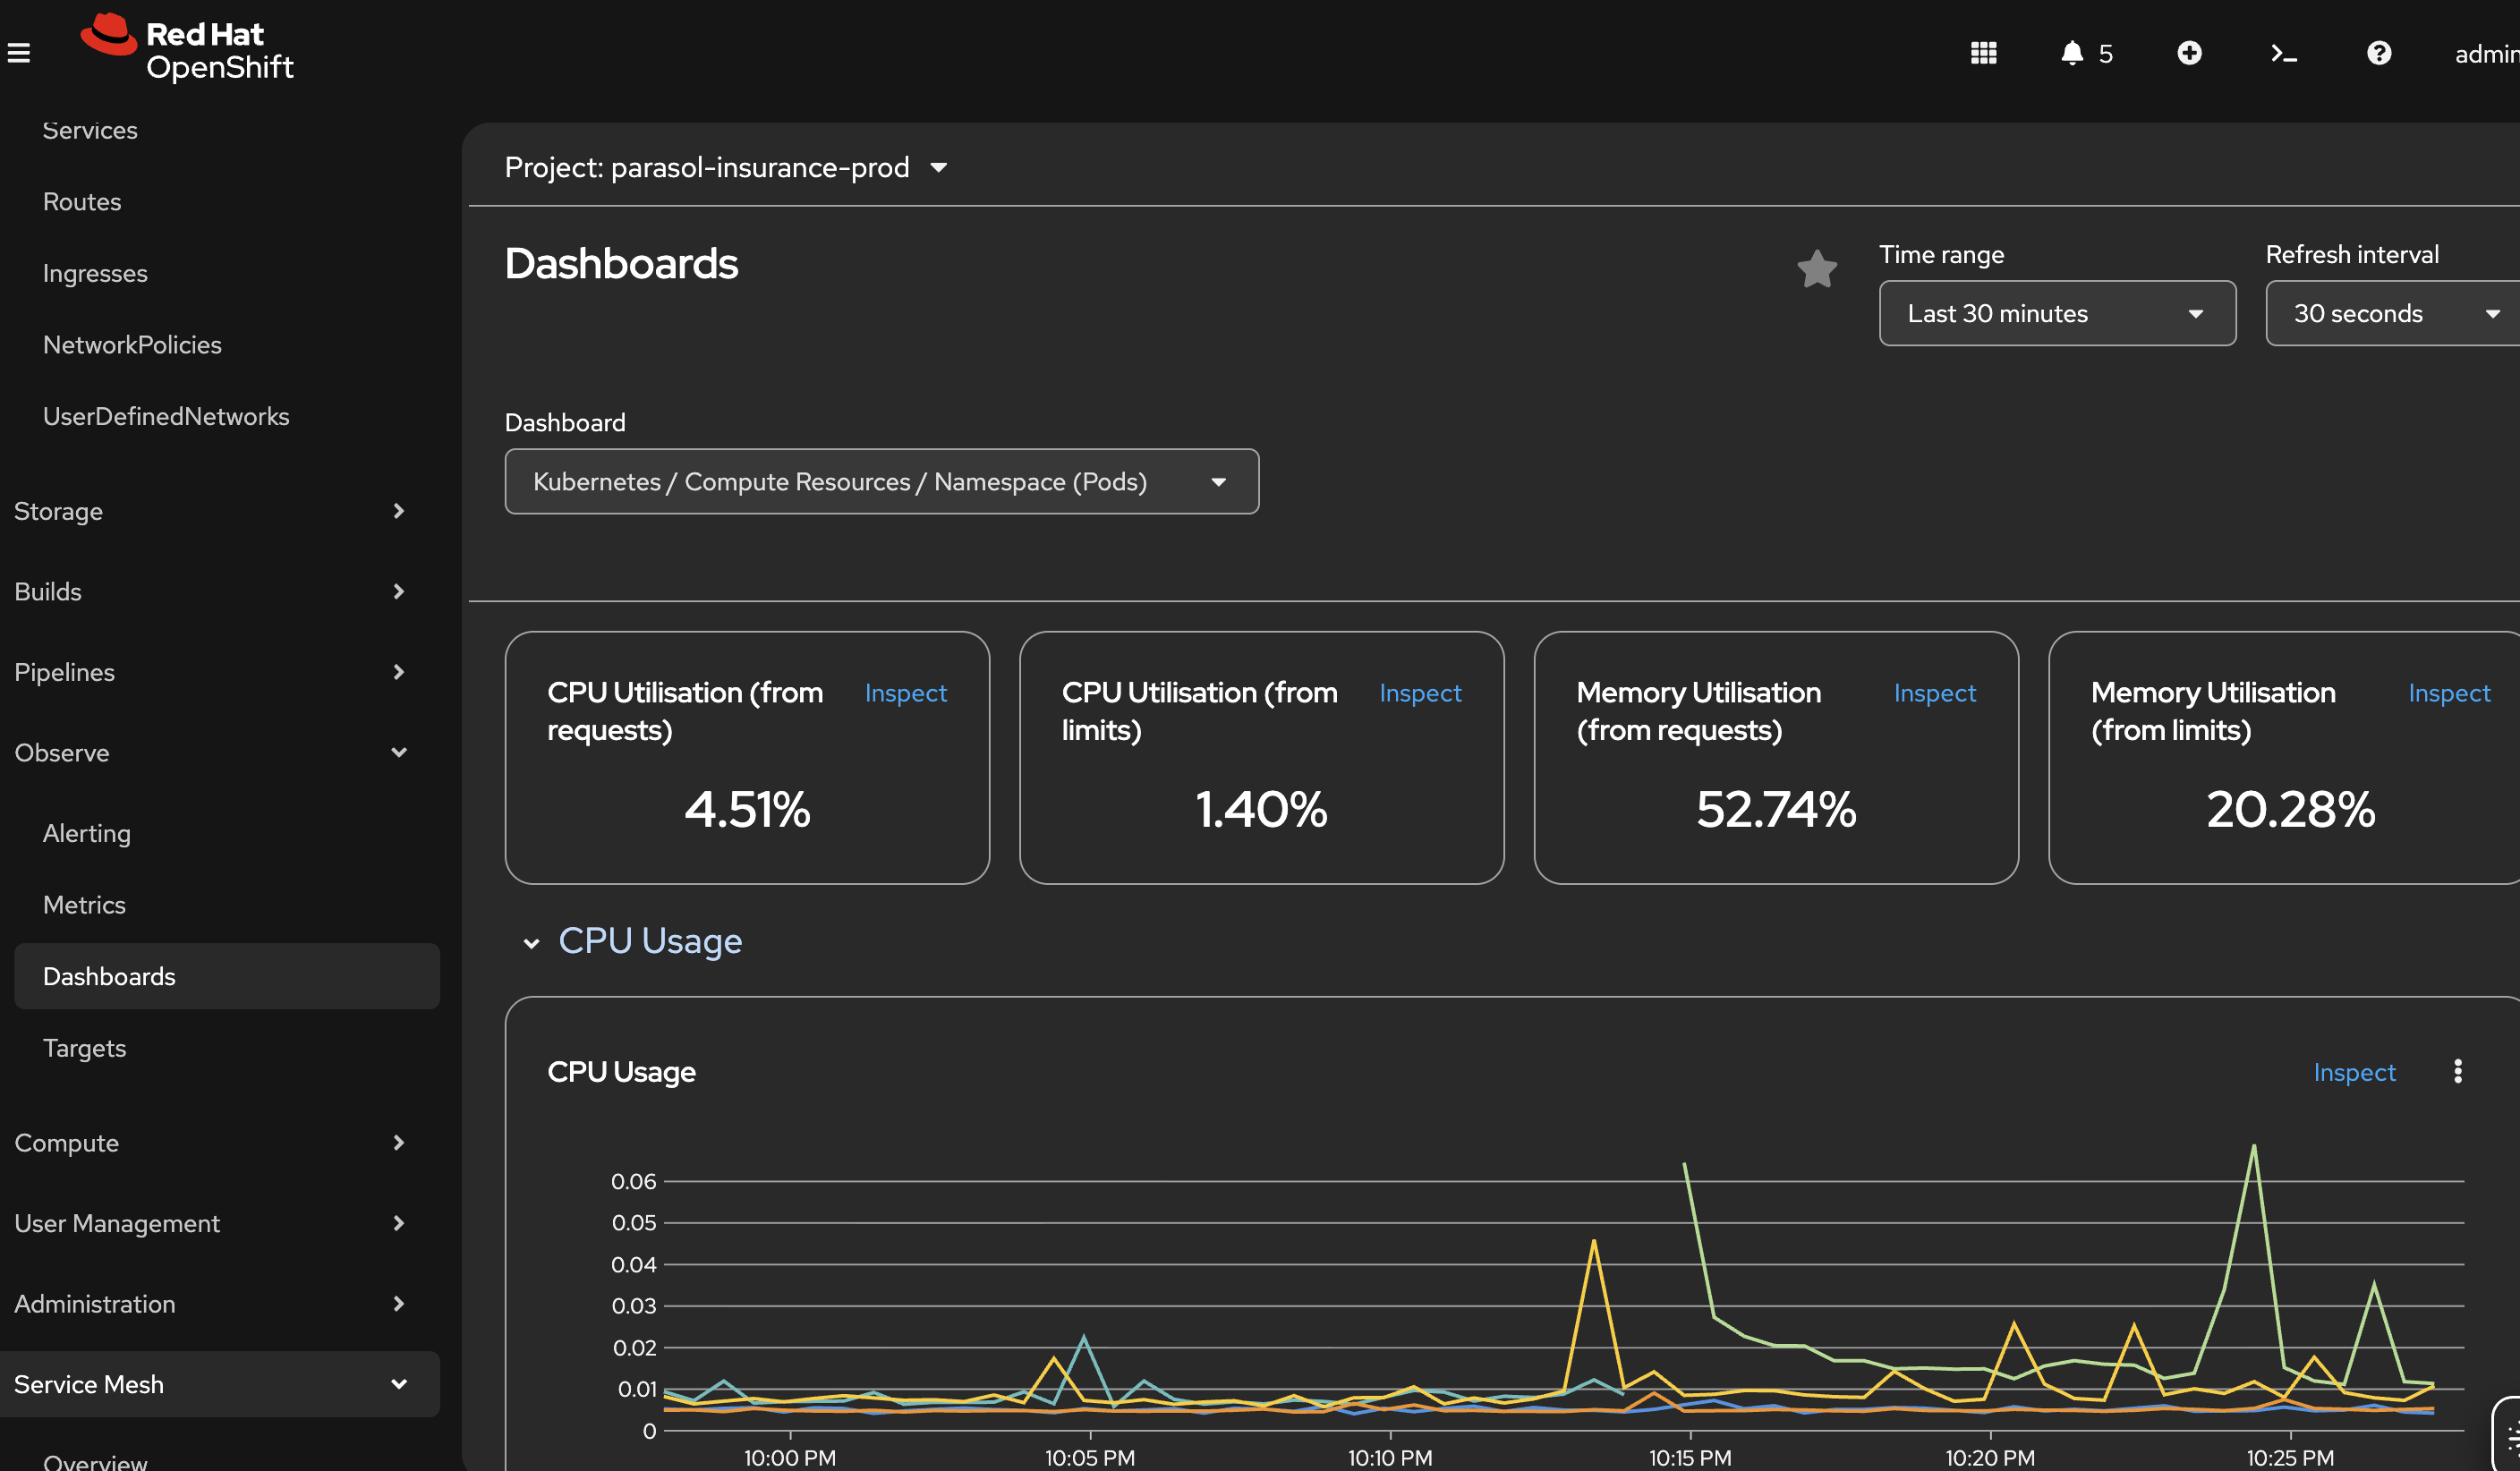
Navigate to Observe → Metrics in the OpenShift web console
-
Show CPU and memory utilization metrics for the Parasol workloads
-
"Beyond service mesh observability, the platform provides workload-level monitoring out of the box. CPU usage, memory consumption, network throughput — all available without any additional tooling."
-
-
Navigate to Observe → Dashboards:
-
Show the aggregate dashboard with CPU, memory, and network metrics
-
"These dashboards can be customized for specific teams or applications. Platform engineers can build views that aggregate metrics across all Parasol services, or drill down into individual workloads."
-
-
Briefly mention custom alerts under Observe:
-
"The platform also supports custom alerts. Platform engineers can define thresholds — for example, alert if CPU exceeds 80% for 5 minutes, or if memory usage trends upward consistently. These alerts catch misbehaving applications before they impact customers."
-
Stop and remove the generator when done:
oc delete pod load-generator -n parasol-insurance-prodWhat they should notice:
-
The service graph provides immediate visual understanding of the application architecture and traffic patterns
-
Health is indicated through color coding. No need to check dashboards or parse logs to know if something is wrong.
-
Detailed metrics (throughput, errors, latency) are available for every service without any application code instrumentation
-
The mesh collects all observability data automatically
-
Different graph views provide different perspectives on the same traffic data
-
Workload observability (CPU, memory, network) is built into the platform through the Observe menu
-
Dashboards are customizable and alerts can be configured to catch issues proactively
Business value callout:
"At Parasol, when a cross-service issue occurs, the operations team spends hours correlating logs across services to find the root cause. With the Service Mesh console, they can see the problem in seconds: which service is failing, what the error rate is, and how it affects downstream services. Add in the platform’s built-in workload monitoring with customizable dashboards and proactive alerts, and you have a complete observability picture — from individual service metrics to aggregate resource consumption. This reduces mean time to resolution from hours to minutes. And none of this required any changes to the application code. The platform provides it automatically."
If asked:
- Q: "Does this replace our monitoring stack?"
-
A: "No. Service Mesh observability complements your existing monitoring. It focuses specifically on service-to-service communication: traffic flow, error rates, and latency between services. Your existing Prometheus, Grafana, and AlertManager stack continues to handle infrastructure and application-level metrics."
- Q: "Can developers access this?"
-
A: "Yes. The Service Mesh console is accessible through the OpenShift web console with appropriate RBAC permissions. Both platform engineers and developers can view the service graph and metrics for their namespaces."
- Q: "What about distributed tracing?"
-
A: "Service Mesh supports distributed tracing through integration with OpenTelemetry and Jaeger. This allows you to trace individual requests as they flow through multiple services, identifying exactly where latency or errors occur in the chain."
- Q: "How does this scale to larger environments?"
-
A: "The graph automatically adapts to the number of services. In larger environments, you can filter by namespace, application, or label to focus on specific areas. The underlying data collection scales with the mesh."
Part 3 — Autoscaling
Know
Production workloads need to handle variable demand. The Parasol application sees traffic spikes during business hours and seasonal peaks. OpenShift provides multiple layers of autoscaling: horizontal pod autoscaling (adding more replicas), vertical pod autoscaling (adjusting CPU and memory), cluster autoscaling (adding more nodes), and event-driven autoscaling with KEDA for scaling based on external metrics like Kafka queue depth.
Business challenge:
-
Applications are either over-provisioned (wasting resources) or under-provisioned (degrading performance during traffic spikes)
-
Manual scaling requires operations team intervention, often after users are already impacted
-
No automated response to changing demand patterns
-
Different workloads need different scaling strategies (CPU-bound vs. event-driven)
Value proposition:
OpenShift provides multiple autoscaling strategies out of the box:
-
HorizontalPodAutoscaler (HPA) — Automatically adds or removes pod replicas based on CPU, memory, or custom metrics. The platform engineer sets thresholds and min/max bounds, and the platform handles scaling automatically.
-
VerticalPodAutoscaler (VPA) — Adjusts CPU and memory requests/limits for individual pods based on observed usage patterns. Right-sizes workloads without manual tuning.
-
ClusterAutoscaler and MachineAutoscaler — Scales the cluster itself by adding or removing worker nodes when pods cannot be scheduled due to insufficient capacity. The platform grows and shrinks the infrastructure automatically.
-
KEDA (Event-Driven Autoscaler) — Scales workloads based on external event sources like Kafka topic lag, HTTP request queues, or custom metrics. Ideal for event-driven architectures where scaling should respond to queue depth, not just CPU.
Show
What I say:
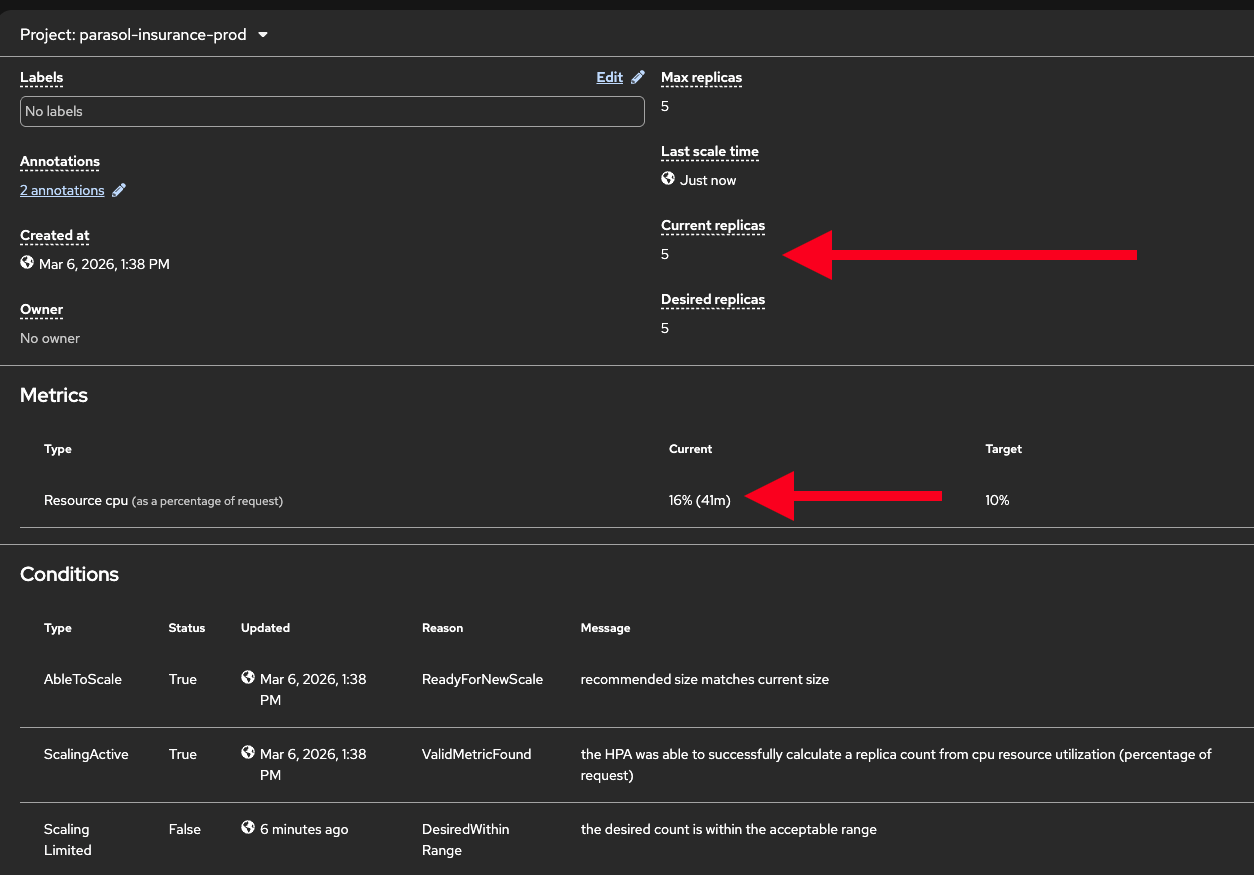
"The last thing I want to show you is how the platform handles scaling automatically. In production, traffic is not constant. The platform engineer has already configured a HorizontalPodAutoscaler for the Parasol production deployment through the GitOps manifests. It scales between 2 and 5 replicas based on CPU utilization. Let me show you what happens when load increases."
What I do:
-
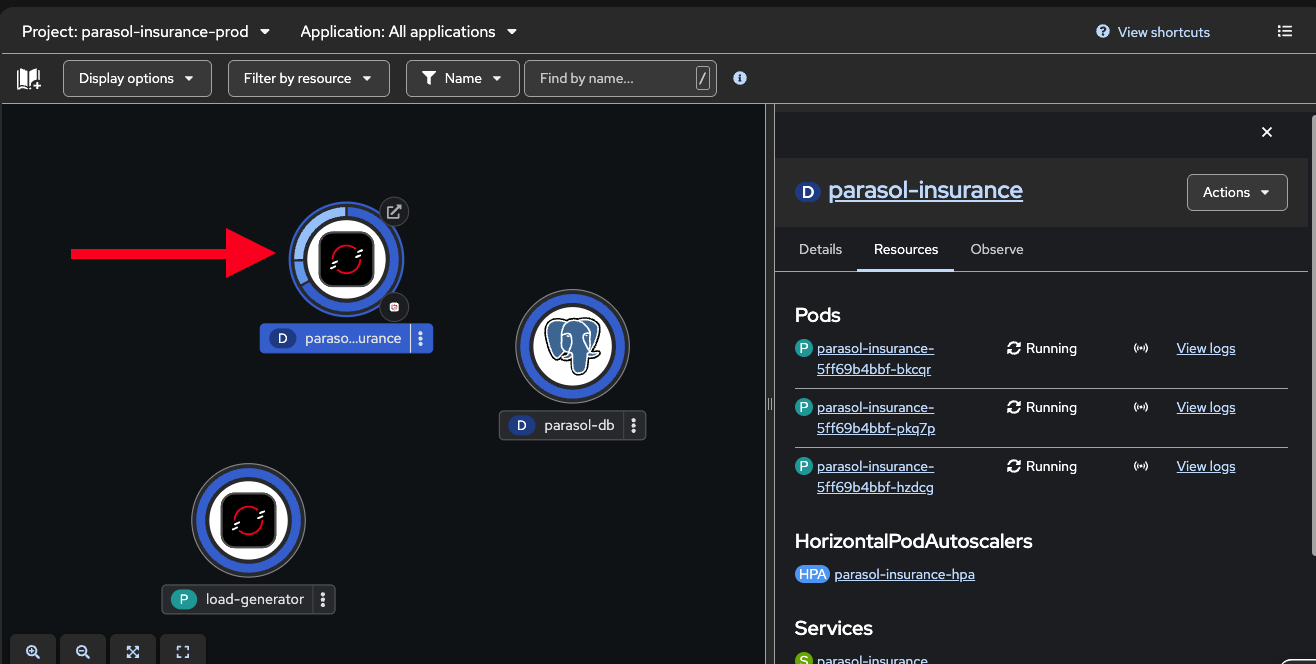
In the OpenShift web console, navigate to the Topology view in the
parasol-insurance-prodnamespace -
Show the existing HPA configuration:
-
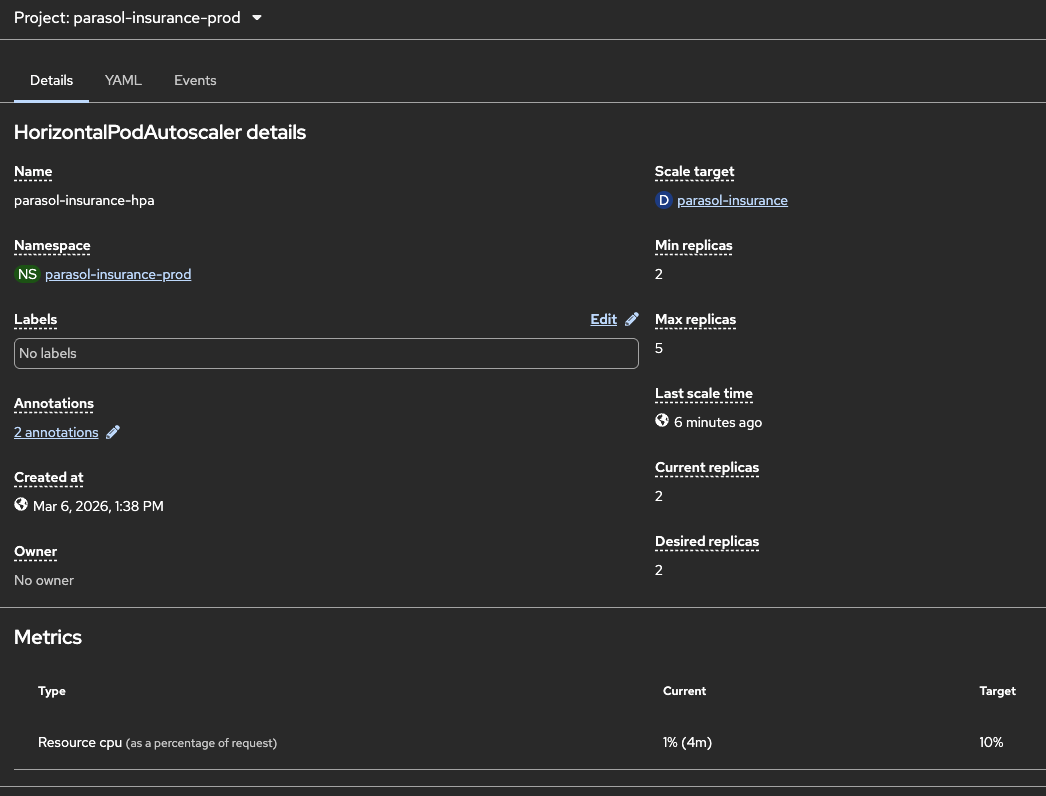
Navigate to Workloads → HorizontalPodAutoscalers in the
parasol-insurance-prodnamespace -
Click on
parasol-insurance-hpato show the configuration: min 2, max 5, CPU target 10% -
"The platform engineer configured this HPA in the GitOps manifests. It is managed as code alongside the deployment, reviewed through merge requests, and managed by OpenShift GitOps. The platform automatically adjusts the number of replicas based on CPU utilization."
-
-
Generate load to trigger autoscaling by running a load generator pod:
-
Open the Web Terminal using the
>_icon at the top of the OpenShift Console (if this is the first time you’ve run it, just accept defaults and click Start Terminal) -
Run the following command in the terminal to create a load generator pod that continuously sends requests to the Parasol application, driving up CPU utilization:
oc run load-generator --image=quay.io/curl/curl:latest \ -n parasol-insurance-prod --restart=Never -- /bin/sh -c \ "while true; do curl -s -o /dev/null http://parasol-insurance.parasol-insurance-prod.svc:8080/api/claims; done" -
"This generates continuous traffic to the Parasol application, driving up CPU utilization."
-
-
Watch the Topology view as pods scale up. It might take a minute for the load generator to start and for the scaling to occur:
-
The blue donut shows scaling activity as new replicas are added
-
Show the HPA status: Workloads → HorizontalPodAutoscalers to see current vs. target CPU and replica count
-
"The platform detected the increased CPU utilization and automatically added replicas. No human intervention required. The application continues to serve traffic while scaling."
-
-
Stop the load generator:
oc delete pod load-generator -n parasol-insurance-prod-
"After removing the load, the HPA will gradually scale back down to the minimum. The platform optimizes resource usage automatically."
-
-
Talk track about additional scaling capabilities:
-
"What we just showed is horizontal pod autoscaling — adding more replicas. But OpenShift provides several other autoscaling strategies:"
-
"Vertical Pod Autoscaler adjusts CPU and memory for individual pods based on observed usage. Instead of adding more replicas, it right-sizes each pod. This is suited for stateful workloads, or workloads that need more resources per instance rather than more instances."
-
"Cluster Autoscaler and Machine Autoscaler scale the cluster itself. If pods cannot be scheduled because the cluster is full, the platform automatically provisions new worker nodes. When demand drops, it removes them. The infrastructure grows and shrinks with demand."
-
"KEDA, the event-driven autoscaler, scales based on external event sources. For example, Parasol’s email processing could scale based on the Kafka topic queue depth. If thousands of emails arrive at once, KEDA spins up more consumers to process them faster, then scales back to zero when the queue is empty."
-
What they should notice:
-
The platform automatically scaled the deployment in response to CPU load
-
Scaling down happens automatically when load decreases — no manual intervention
-
Multiple autoscaling strategies exist for different use cases (horizontal, vertical, cluster, event-driven)
Business value callout:
"At Parasol, the operations team manually scales deployments when performance degrades — a reactive process that adds 10-15 minutes of response time and impacts customer experience. With the HPA, the platform responds to demand changes in seconds, automatically. During peak hours, the application scales up. During off-peak hours, it scales back down, saving infrastructure costs. And with KEDA, event-driven workloads like email processing can scale based on queue depth, not just CPU. The platform handles it all automatically."
If asked:
- Q: "How fast does the HPA react?"
-
A: "The HPA checks metrics every 15 seconds by default. Scale-up typically happens within 30-60 seconds of the threshold being exceeded. Scale-down is more conservative — the HPA waits 5 minutes by default to avoid flapping."
- Q: "Can we scale based on custom metrics?"
-
A: "Yes. The HPA supports custom metrics through the Prometheus adapter. You can scale based on any metric that Prometheus collects — request rate, queue depth, response latency, or business-specific metrics."
- Q: "What about scaling the cluster itself?"
-
A: "The Cluster Autoscaler monitors pending pods that cannot be scheduled due to insufficient resources. When it detects unschedulable pods, it provisions new worker nodes through Machine Autoscaler. When nodes are underutilized, it drains and removes them. This is fully automated."
- Q: "How does KEDA differ from the HPA?"
-
A: "The HPA scales based on pod-level metrics like CPU and memory. KEDA scales based on external event sources: Kafka topic lag, HTTP queue length, database query count, or any custom scaler. KEDA can also scale to zero, which the HPA cannot. This makes KEDA ideal for event-driven and batch workloads."
Part 4 — External secrets with Vault
Know
Applications need secrets — API keys, database credentials, certificates — but storing them in Git or environment variables is a security risk. Parasol uses HashiCorp Vault with the External Secrets Operator to inject secrets into applications at runtime, keeping sensitive data out of source control and configuration manifests.
Business challenge:
-
Secrets stored in Git repositories or environment variables are a security liability
-
No centralized secrets management across applications and environments
-
Secret rotation requires manual updates to application configurations
-
Compliance requirements mandate secrets management with audit trails
Current state at Parasol:
-
Some teams store secrets in Git (encrypted but still in source control)
-
Others use Kubernetes secrets directly, with no centralized management
-
Secret rotation is manual and error-prone, sometimes causing outages
-
No audit trail for who accessed which secrets and when
Value proposition:
The External Secrets Operator integrates with HashiCorp Vault to provide centralized, audited secrets management. Secrets are stored in Vault and automatically synced to Kubernetes secrets that applications can use at runtime. Developers reference secrets by name in their manifests without ever seeing the actual values. Secret rotation happens in Vault and propagates automatically when the ExternalSecrets operator performs its sync interval.
Show
What I say:
"Before we wrap up Section 1, let me address a critical concern: secrets management. Our application needs database credentials, API keys, and other sensitive configuration. Where do those secrets come from, and how do we keep them secure?"
What I do:
-
Visit the Vault UI served by a Vault instance running in your cluster. Log in with the Vault token.
Retrieve the Vault token from the {openshift_cluster_console_url}/k8s/ns/vault/corev1Secret[
vault-tokenSecret^] or using this command:oc get secret vault-token -n vault -o jsonpath='\{.data.token}' | base64 -d-
In the Vault UI, select Secrets at the top and then navigate to the kv (key/value) folder then to the
secrets/path -
Show the secrets organized by application and purpose (e.g.
parasol-insurance/,gitlab/,kafka/,quay/) -
"All secrets are stored centrally in Vault, organized by application and purpose. The developer never sees these values in their code or manifests."
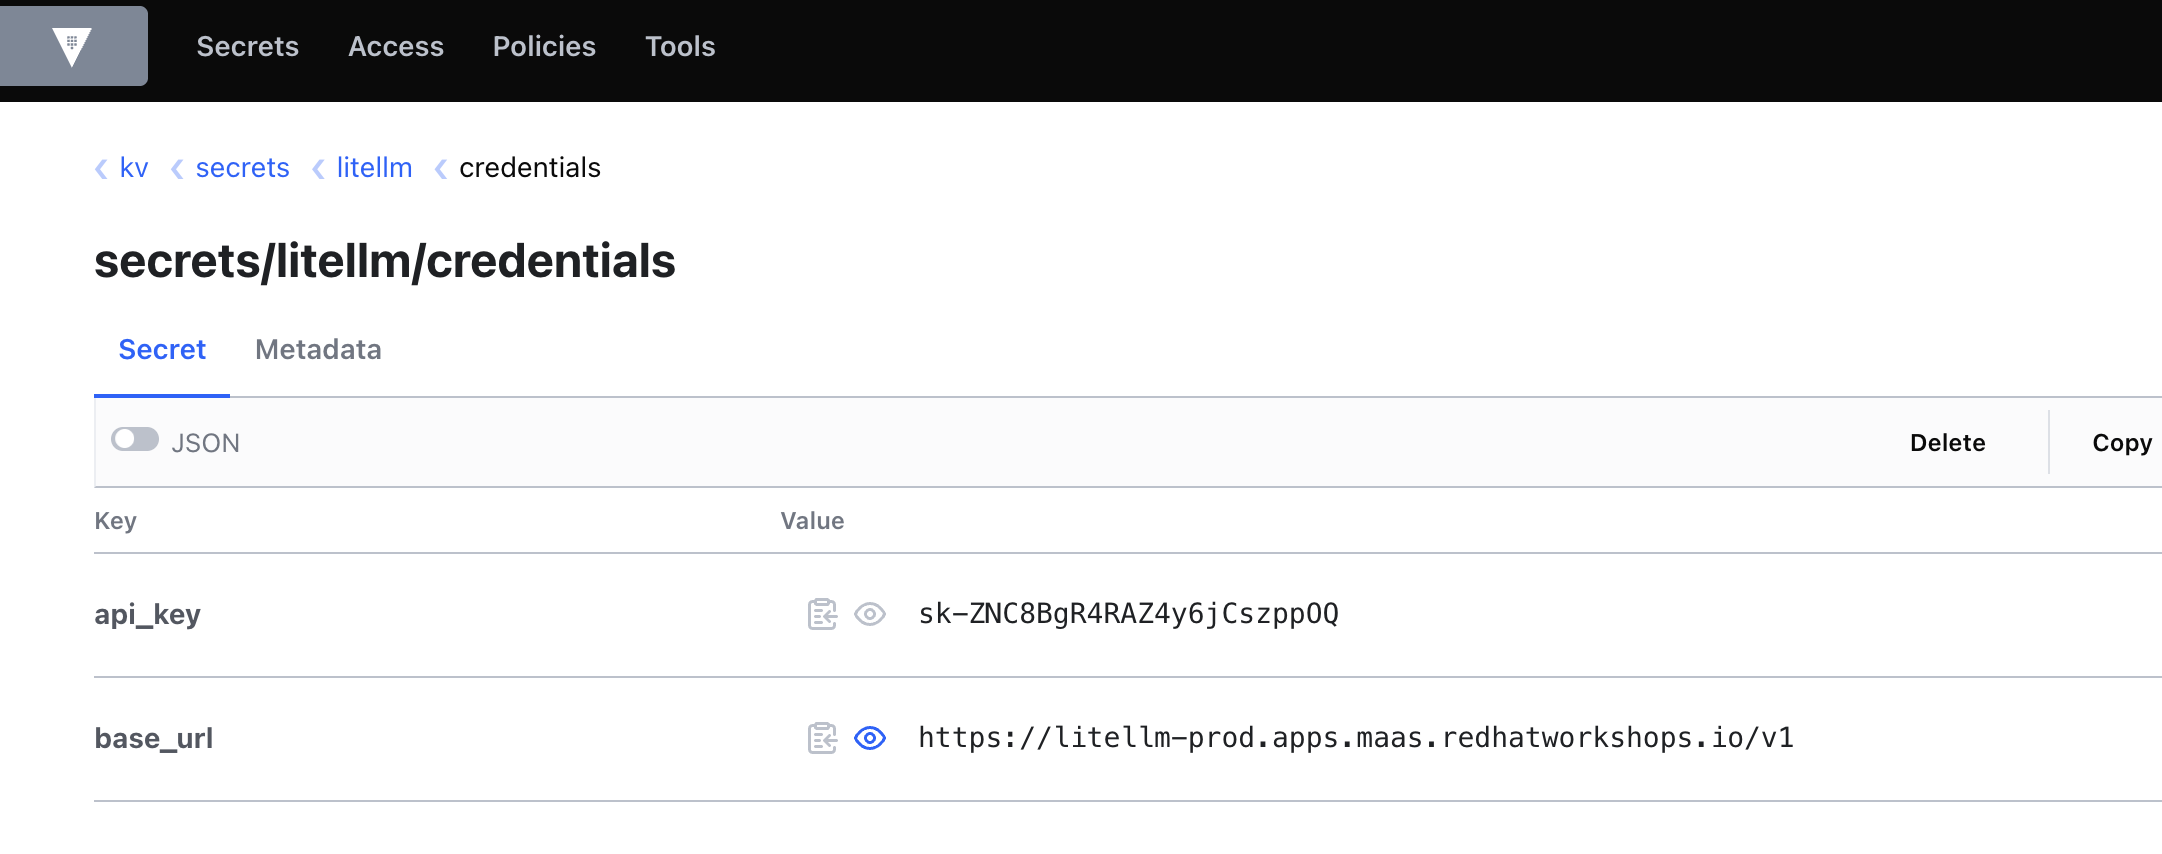 Figure 7. Secrets managed centrally in Vault
-
-
Show the ExternalSecret resource in the application manifests:
-
In the OpenShift Console, navigate to Workloads > Secrets, select the
parasol-insurance-prodapplication namespace, and click on a secret such askafka-credentials, then Reveal Values -
This Secret was created by the External Secrets Operator based on the
ExternalSecretcreated as part of the Argo CD deployment. -
Click on the "Owner" link to show the ExternalSecret.
apiVersion: external-secrets.io/v1beta1 kind: ExternalSecret metadata: name: kafka-credentials spec: refreshInterval: 1h secretStoreRef: name: vault-secret-store kind: ClusterSecretStore target: name: kafka-credentials creationPolicy: Owner data: - secretKey: password remoteRef: key: secrets/kafka/user property: password -
"The External Secret references a path in Vault, not the actual secret value. The External Secrets Operator syncs the value at runtime."
-
Point out that the secret exists in the cluster but was never committed to Git
-
"The operator automatically created this Kubernetes secret from the Vault data. The application consumes it like any normal secret. But the actual values never appear in source control."
-
-
Talk track about rotation and audit:
-
"When the platform team rotates a secret in Vault, the External Secrets Operator syncs the new value automatically based on the refresh interval. No application restart required, no manual update. And every access to every secret is audited in Vault’s audit log."
-
What they should notice:
-
Secrets are never stored in Git or hardcoded in application code
-
The ExternalSecret resource references a Vault path, not an actual value
-
The operator handles syncing automatically, keeping the cluster in sync with Vault
-
Secret rotation is transparent to the application
-
Full audit trail for compliance
Business value callout:
"At Parasol, some teams store secrets in Git, others use Kubernetes secrets directly. Neither approach provides centralized management, rotation, or audit trails. With Vault and the External Secrets Operator, every secret is centrally managed, automatically rotated, and fully audited. The developer never sees the actual values, and compliance requirements are satisfied automatically."
If asked:
- Q: "What happens if Vault is unavailable?"
-
A: "The Kubernetes secrets that were already synced continue to work. The External Secrets Operator retries on the next refresh interval. Applications are not affected by temporary Vault outages."
- Q: "Can different teams have different access to secrets?"
-
A: "Yes. Vault supports fine-grained access control policies. Each team can only access secrets for their applications and environments."
- Q: "Do we have to use Vault specifically?"
-
A: "The External Secrets Operator supports multiple backends: HashiCorp Vault, AWS Secrets Manager, Azure Key Vault, Google Secret Manager, and others."
Section 1 summary
What we demonstrated across Modules 1-3
-
Module 1: Developer experience — Application modernization with MTA, one-click DevSpaces access from the topology view, fast iteration with Quarkus dev mode, and platform engineer governance of DevSpaces through the operator and devfile registry
-
Module 2: CI/CD pipeline — Automated pipeline triggering, Sonarqube quality gate enforcement catching code smells, AI-assisted remediation with Continue, and GitOps-driven delivery with Argo CD
-
Module 3: Platform operations — mTLS encryption and traffic policy management with Service Mesh, real-time observability through traffic graphs and workload monitoring, auto scaling (HPA), and centralized secrets management with Vault
The continuous story
A new developer joined Parasol, clicked one button to open the app in DevSpaces, explored the running application, added a claims statistics endpoint in seconds with Quarkus dev mode, committed and pushed from the IDE, triggering an automated pipeline that caught code smells. The developer used the platform’s AI assistant to fix the issues, pushed again, and the pipeline passed. Argo CD deployed the change through GitOps, all on a platform that handles encryption, traffic management, workload monitoring, observability, and centralized secrets management automatically. This is what an application platform delivers.
Key takeaways
-
OpenShift is more than containers: it is an application platform
-
The platform reduces developer cognitive load at every stage of the lifecycle
-
Automated guardrails enforce quality and security without slowing developers down
-
GitOps and Service Mesh provide enterprise-grade delivery and operations
-
The same platform foundations support AI adoption and multi-cloud strategies
Presenter wrap-up
|
Presenter tip: End with a clear call to action relevant to your audience. For prospects, suggest a workshop or proof of concept. For existing customers, recommend specific capabilities to adopt next based on what resonated during the demo. If continuing to Section 2, transition with: "Everything we showed is the foundational platform. In Section 2, we layer on advanced developer services: a developer portal, secure supply chain, and compliance automation." |