Module 6: Trusted software supply chain
Presenter note: This is the final module of Section 2 (Advanced Application Platform). It covers SBOM management through TPA for compliance visibility, and the application topology view showing the complete Parasol system in production. Target duration: 10 minutes across 2 parts.
Part 1 — SBOM management with TPA
Know
Every build in the secure pipeline generates a software bill of materials (SBOM). The Trusted Profile Analyzer (TPA) provides a centralized platform for managing SBOMs, tracking associated vulnerabilities, and monitoring license compliance across all applications in the organization.
Business challenge:
-
No centralized view of what software components are included in deployed applications
-
Vulnerability tracking across the application portfolio requires manual effort
-
License compliance is difficult to verify without comprehensive dependency data
-
When a new CVE is disclosed, identifying which applications are affected takes days or weeks
Value proposition:
TPA provides a single pane of glass for all SBOM data across the organization. When a new CVE is disclosed, TPA immediately identifies which applications, components, and versions are affected. License data from SBOMs enables automated compliance checking. The combination of SBOM generation in the pipeline and TPA management creates a continuous compliance posture that scales with the organization.
Show
What I say:
"Every image that comes out of our pipeline has an SBOM — a complete inventory of every software component inside it. But an SBOM sitting in a registry is not useful unless you can query it. That is what the Trusted Profile Analyzer does."
What I do:
-
Open TPA at https://server-trusted-profile-analyzer.{openshift_cluster_ingress_domain}
-
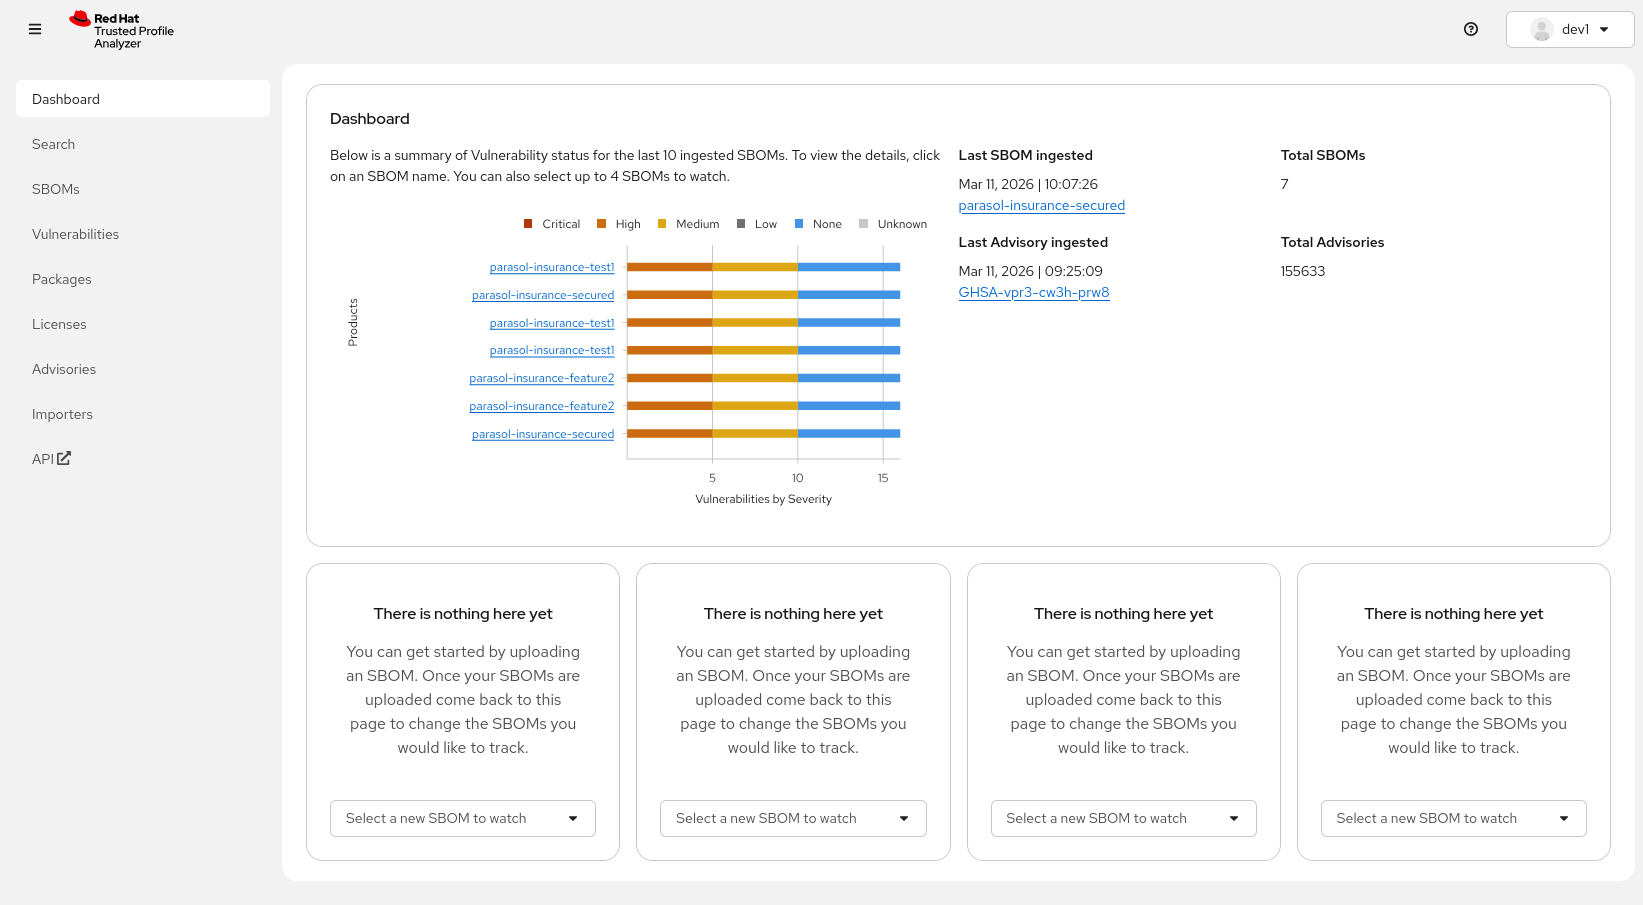
Show the Dashboard:
-
"For a quick overview of what’s currently happening across the software portfolio we have a dashboard showing the latest ingested SBOMs and advisories. You can jump to any of the SBOMs here directly - or check the latest ingested Advisory and check if any of your SBOMs are affected by it"
-
-
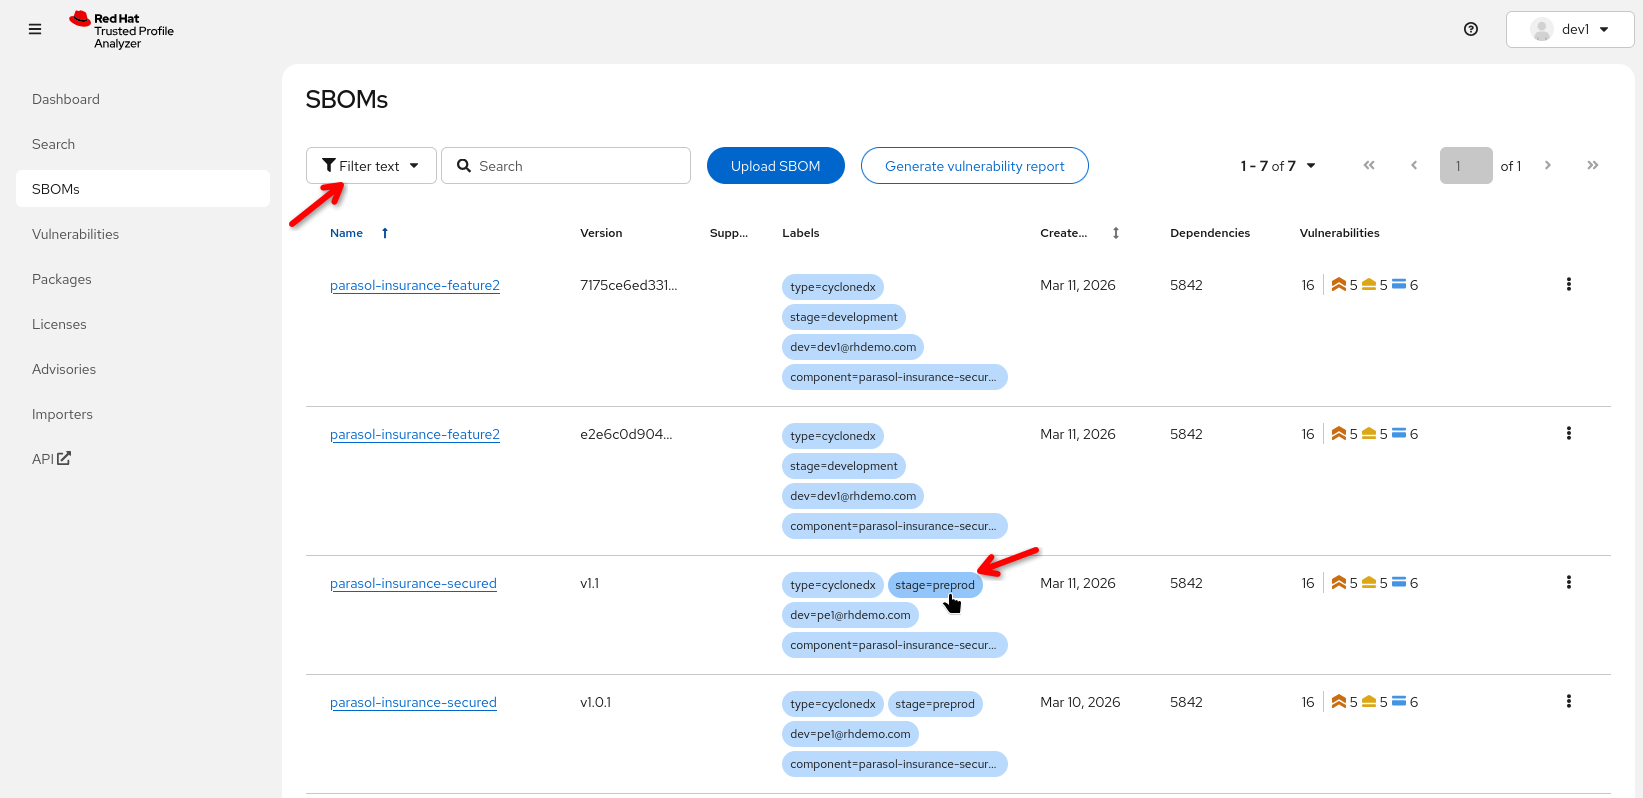
Show the SBOM inventory:
-
Navigate to the list of SBOMs
-
Point out an SBOM for the Parasol component that was just built
-
"Every image built by the pipeline has an SBOM registered here automatically. No manual step required."
-
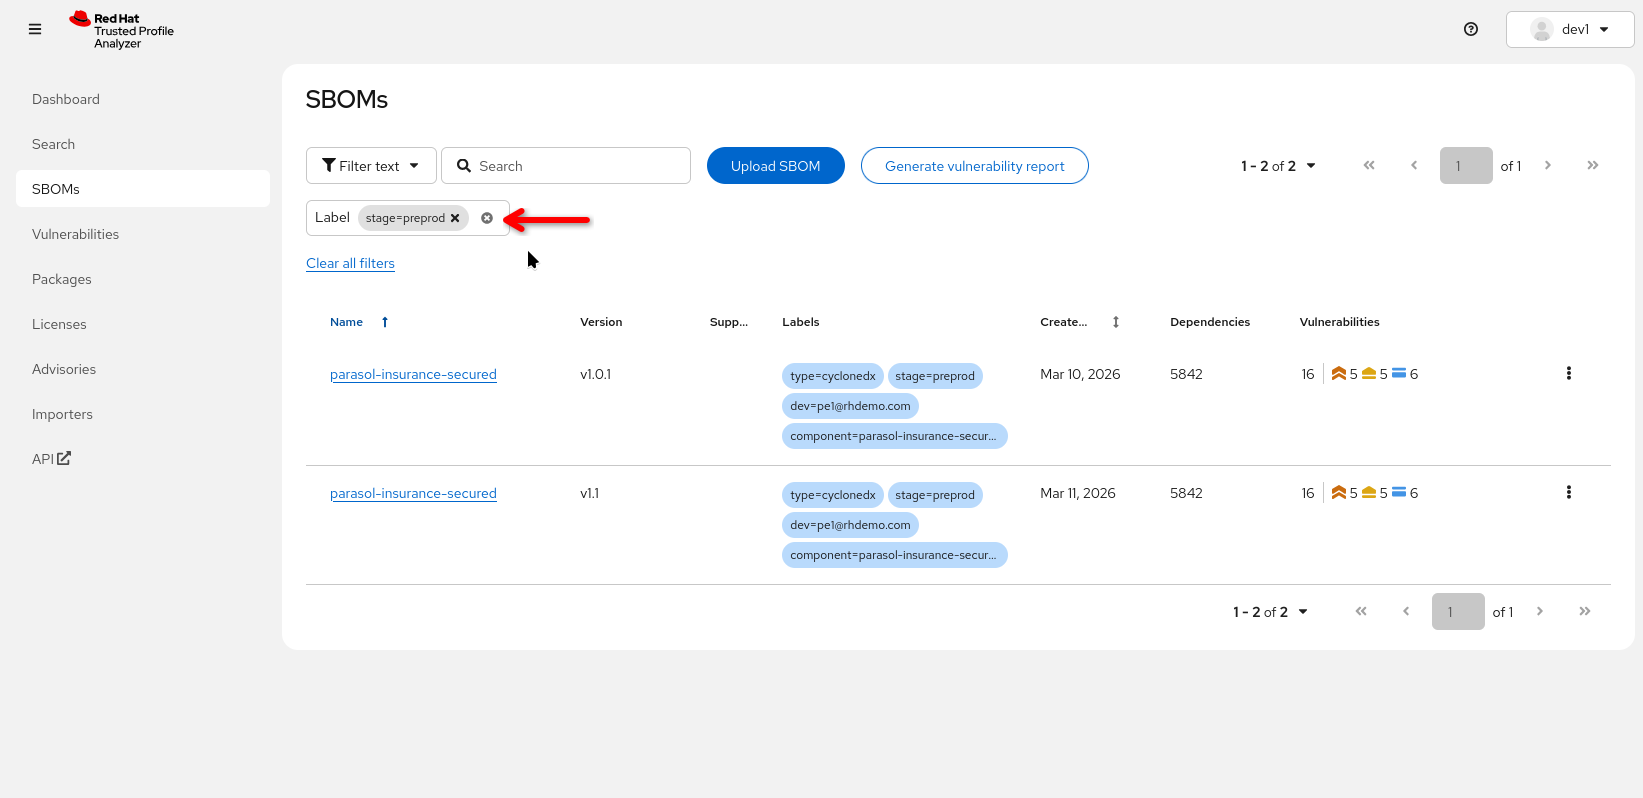
"We can organize the SBOMs by labels - these labels were created by the pipeline automatically, so let’s look at 'preprod' SBOMs"
-
Click on the the "stage=preprod" label
-
-
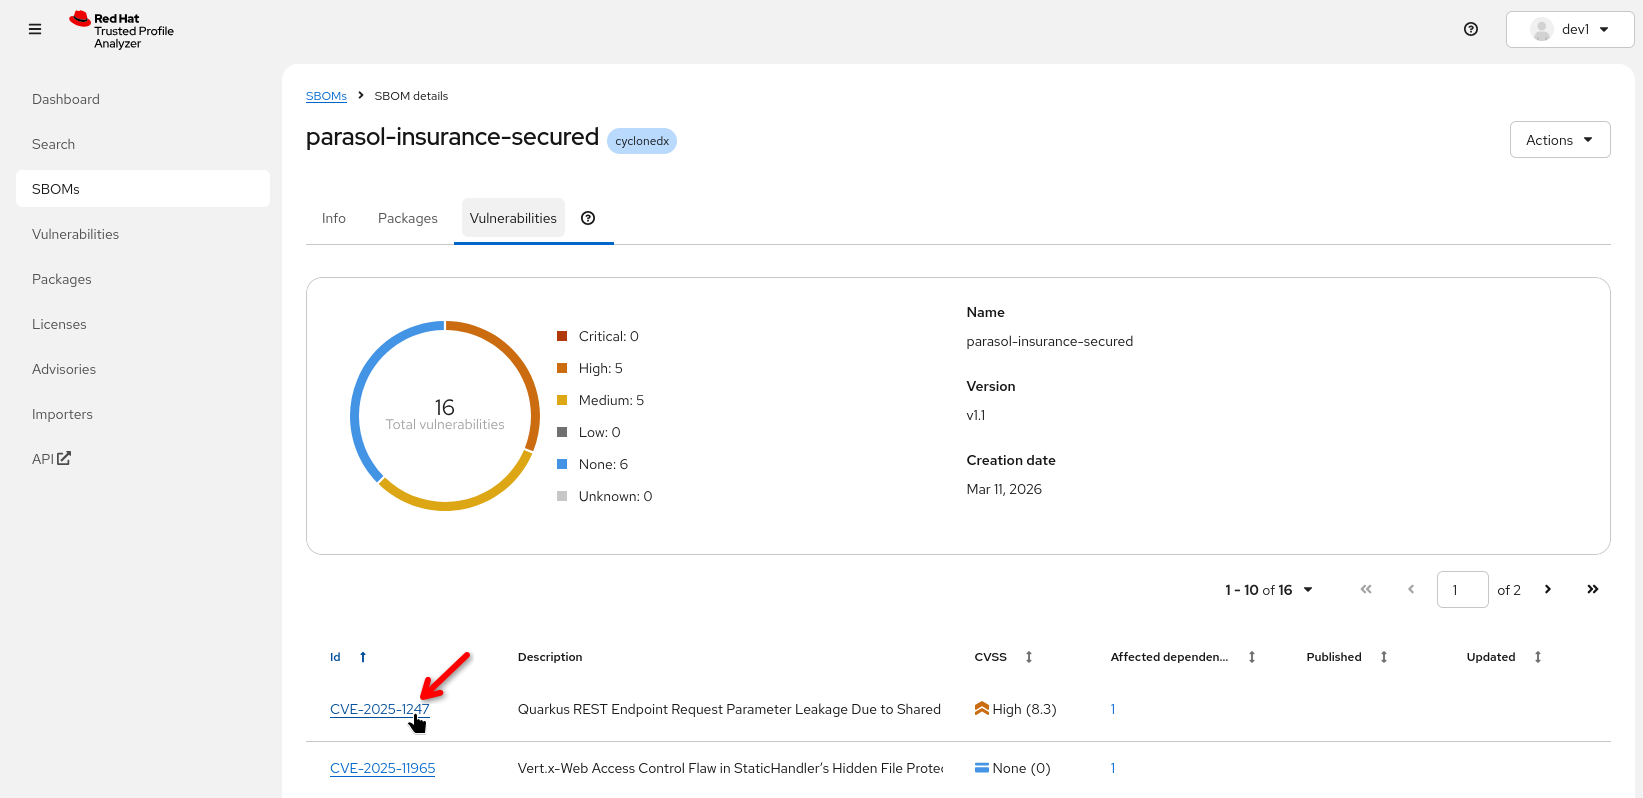
Click on the Parasol component SBOM to show the contents:
-
Walk through the SBOM data:
-
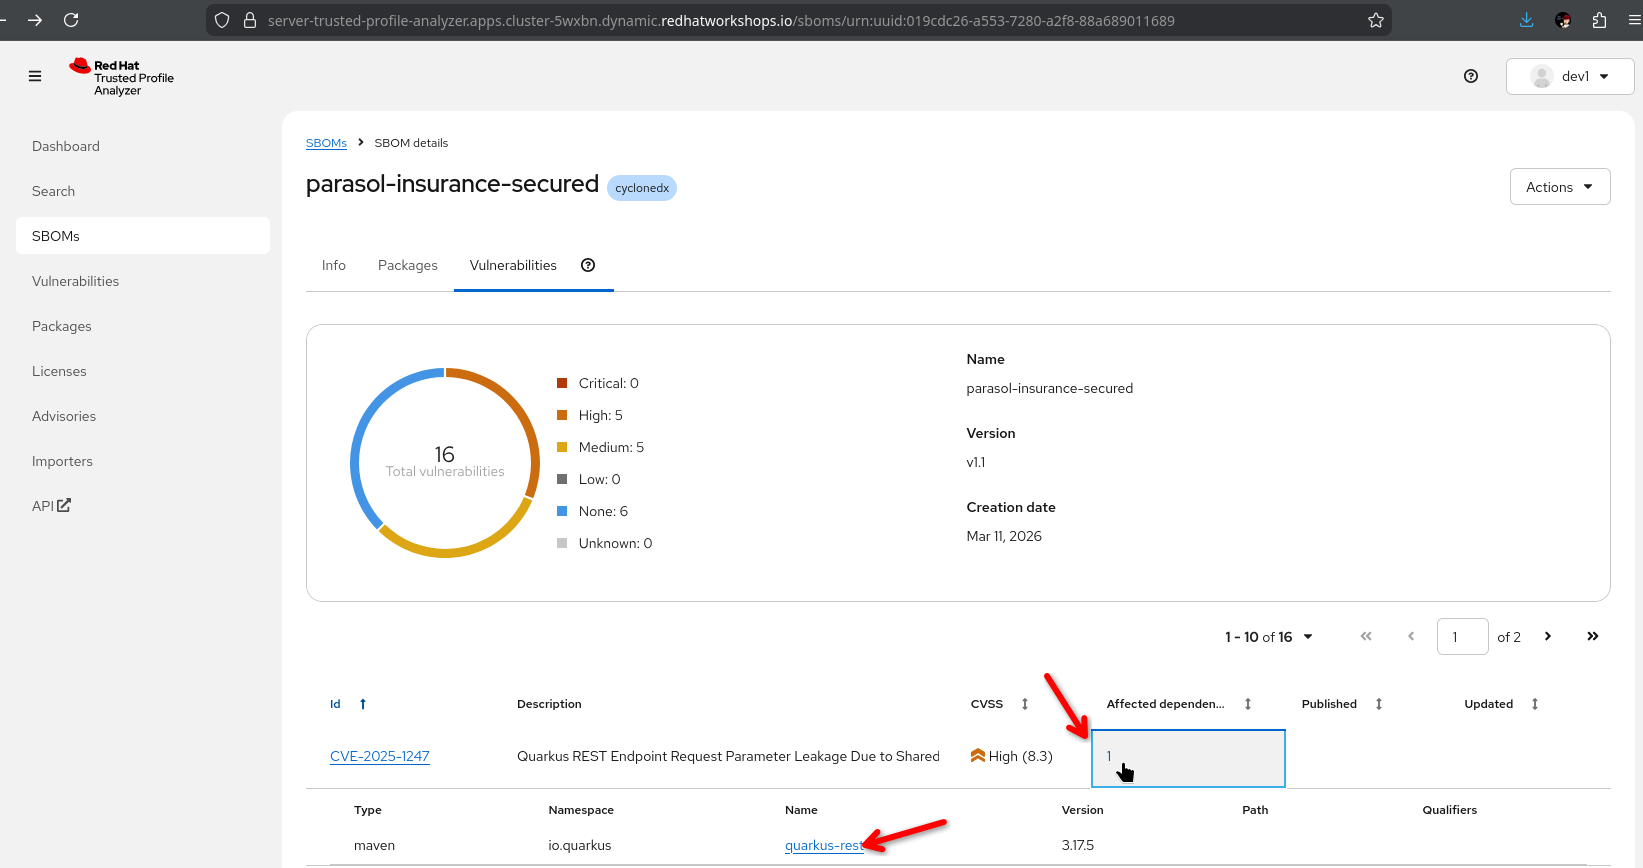
Packages: List of all components with versions and license (if license data is available)
-
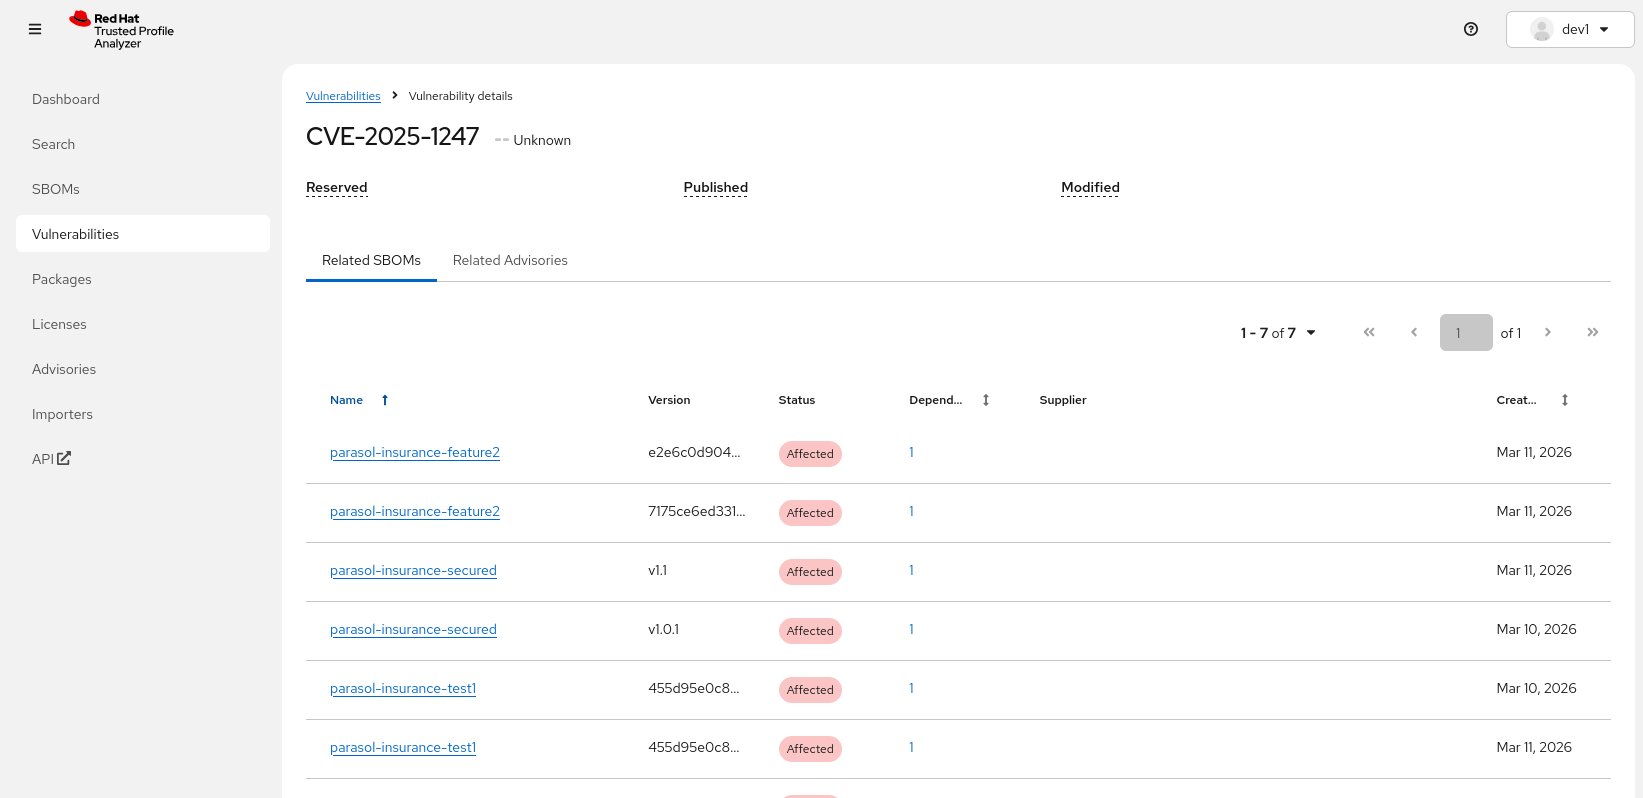
Vulnerabilities: Known CVEs associated with the included components
-
Clicking on a specific CVE gives us all SBOMs ("Related SBOMs") affected by this CVE
-
-
-
Clicking on the "affected dependency" shows us which dependency was mentioned in this CVE and which version is affected
-
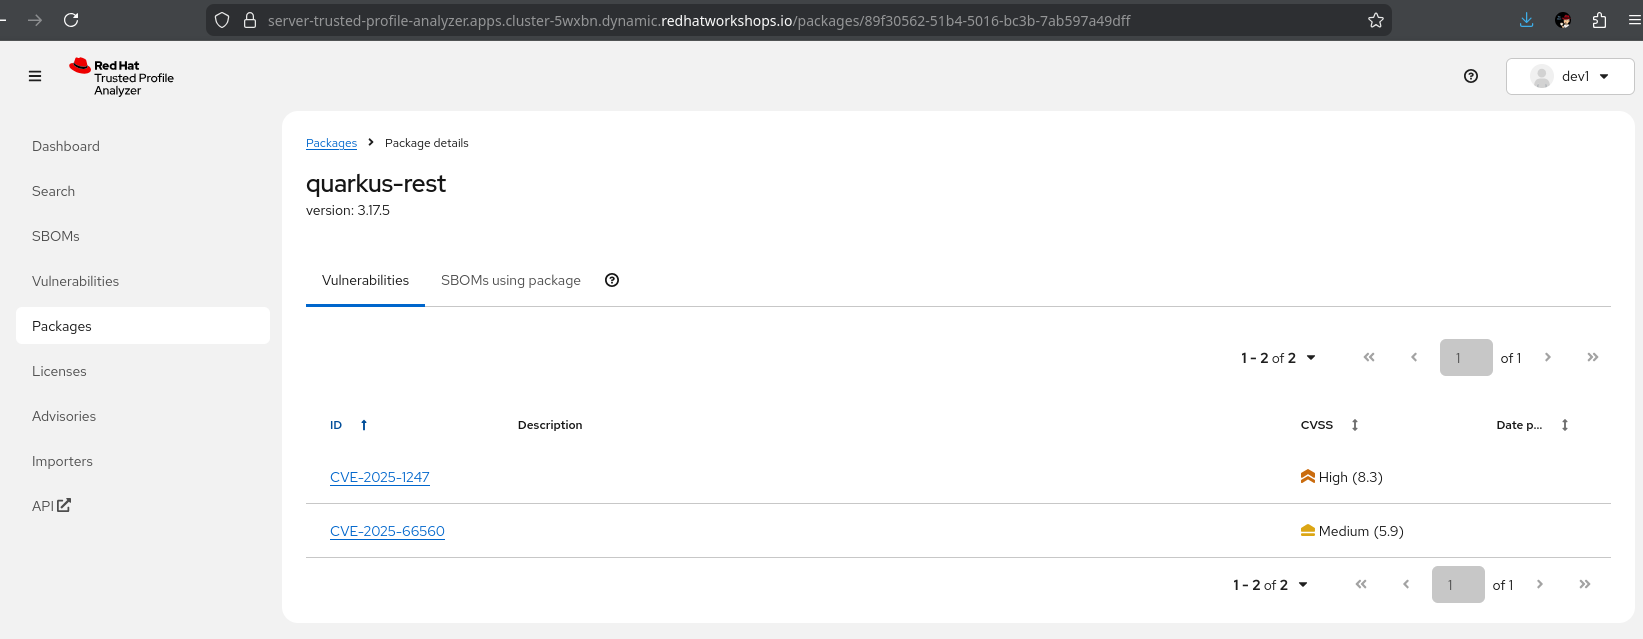
Clicking on that affected dependency then shows us all CVEs where this vulnerable package was mentioned
-
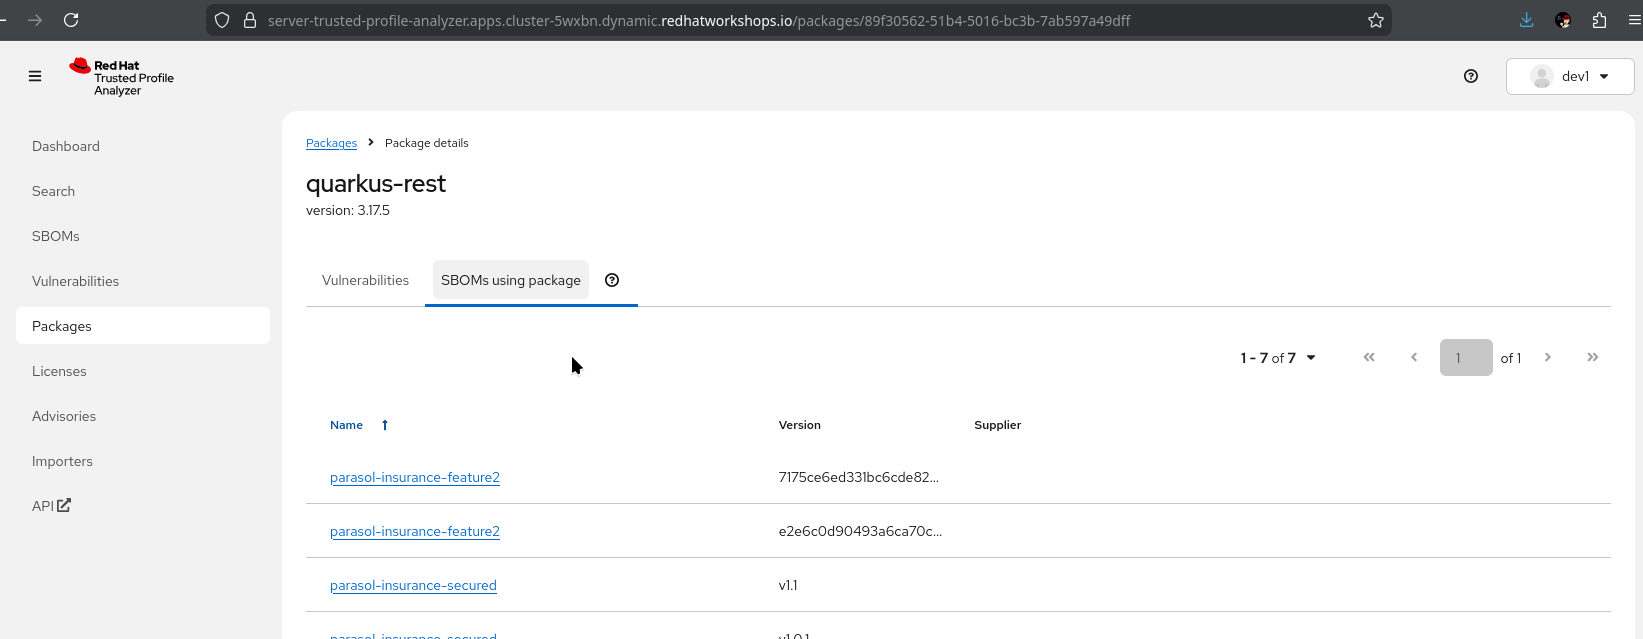
Clicking on "SBOMs using package" shows us all SBOMs that are using this affected dependency
-
"This is a complete inventory of everything inside the container image. Every library, every version, every license. This is what compliance teams need for audit."
-
"Security teams and architects can verify what problems are affecting a component and how widespread that problem is in the software portfolio"
-
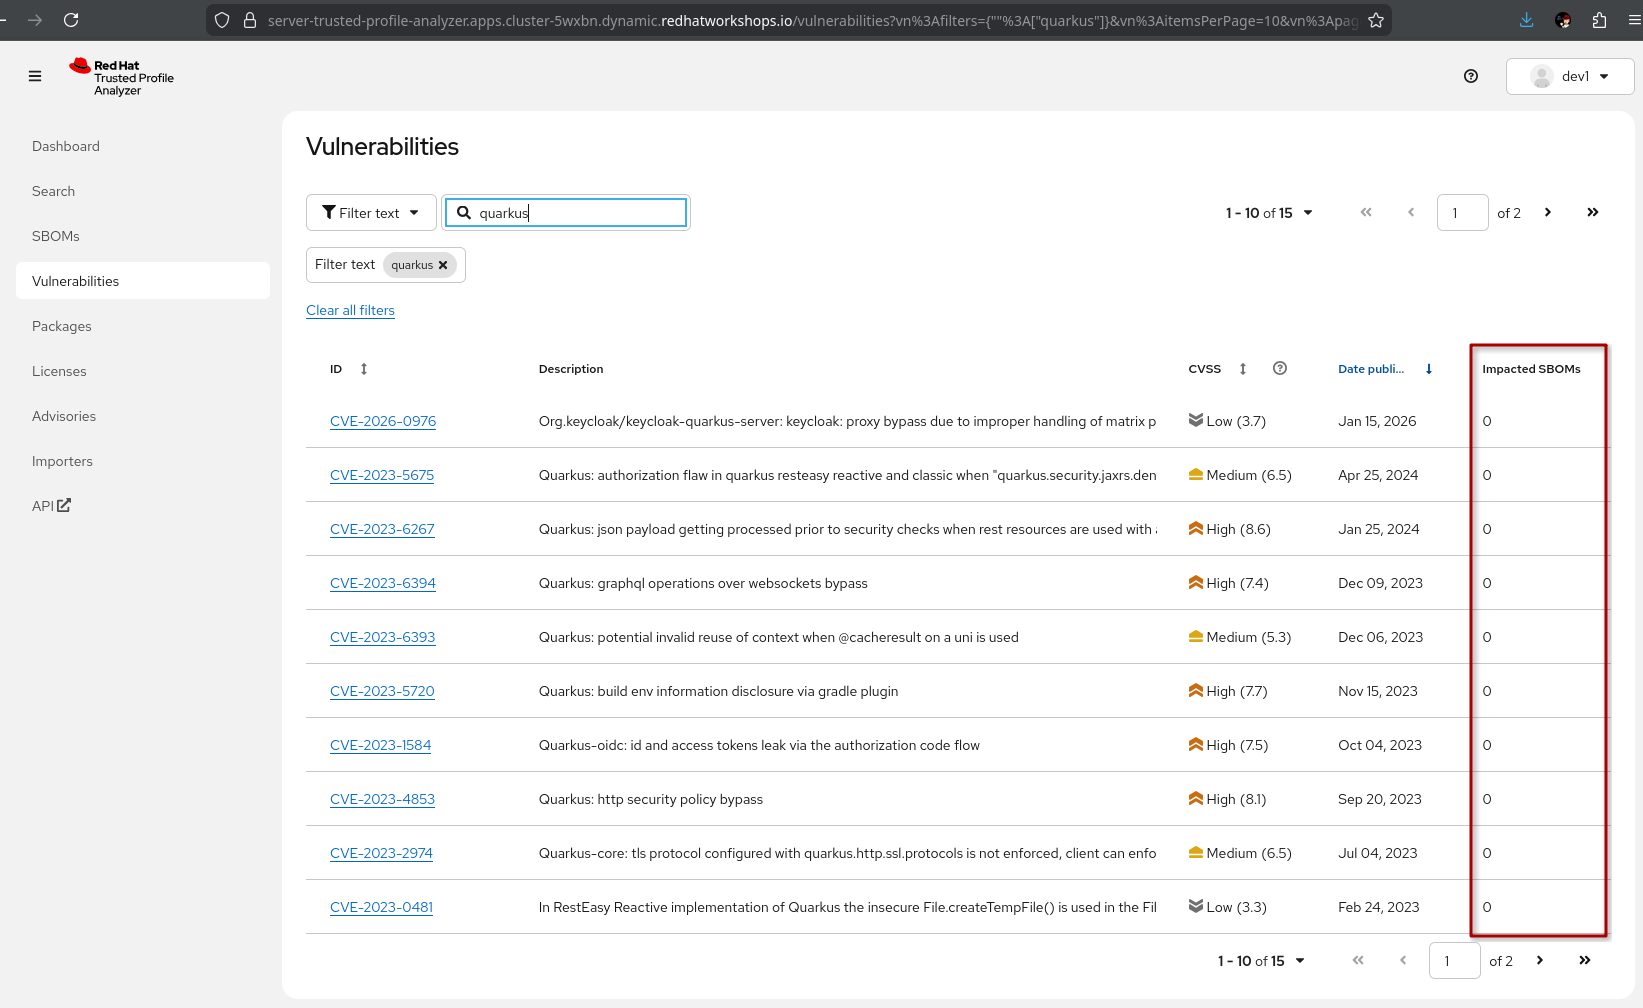
Demonstrate vulnerability search:
-
-
Search for a specific CVE (or text)
-
Show which components are affected by the CVE, which version introduced it, and whether a fix is available
-
"When a new CVE is announced, the security team does not need to check every application manually. They search TPA and immediately see which images are affected."
-
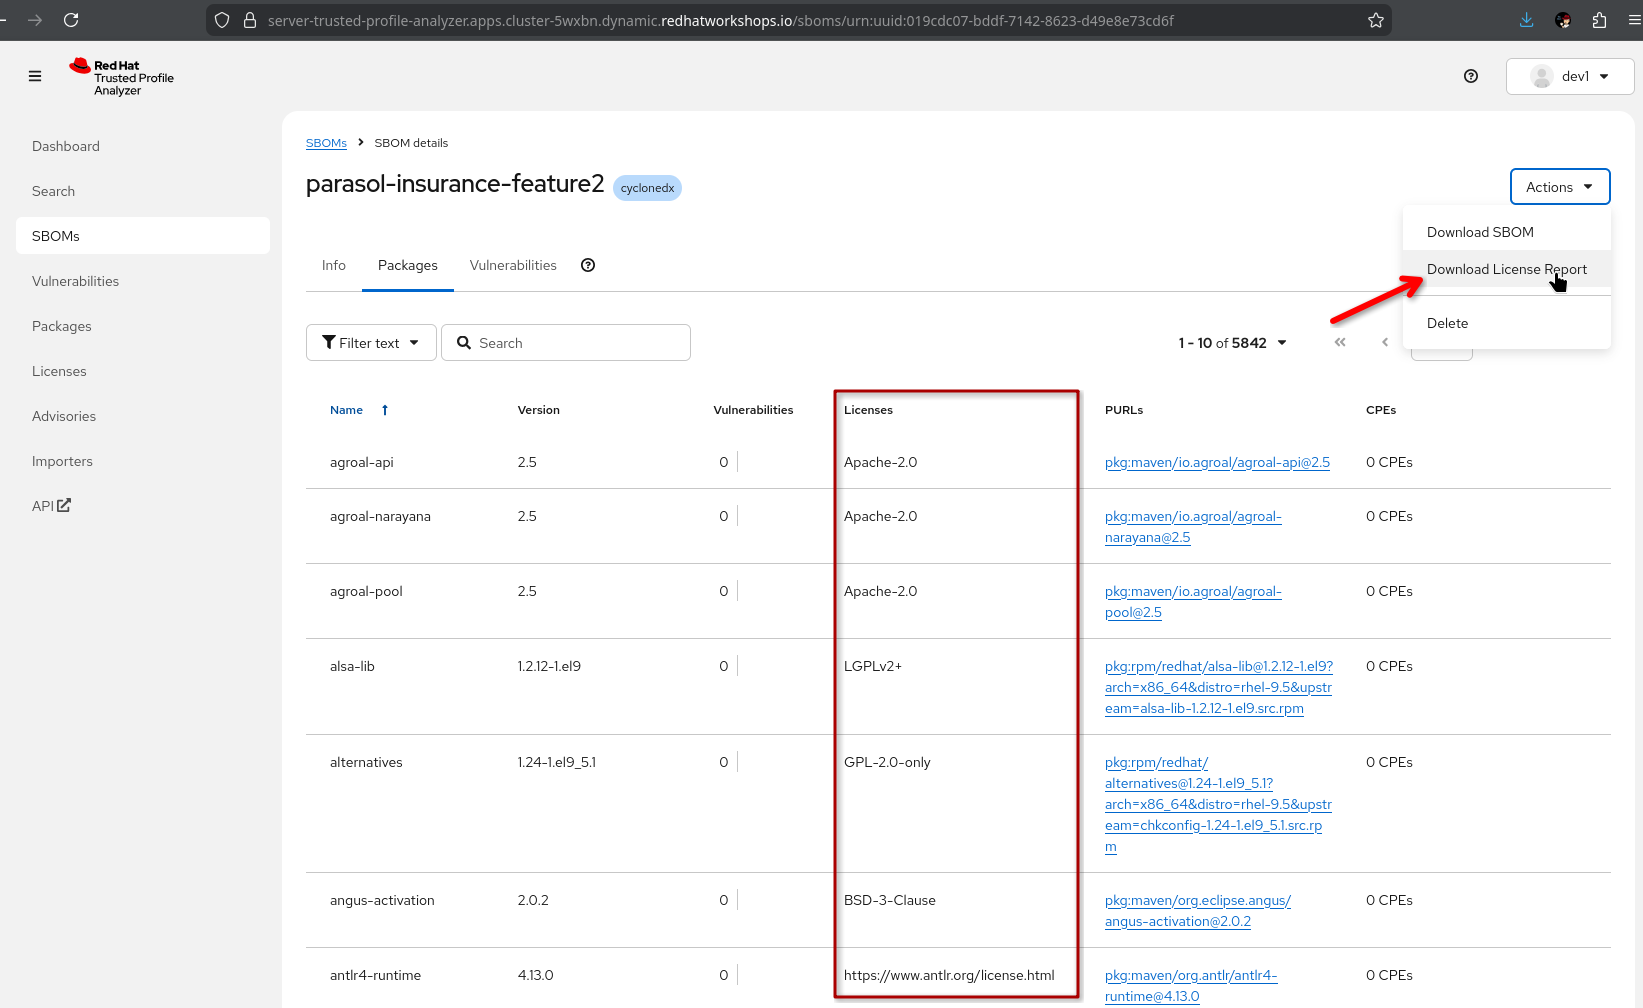
Show license compliance data:
-
-
Select an SBOM
-
Highlight the license data available in packages
-
"You have a view of which licenses are present in an SBOM and you can download an SBOM-scoped license report for further analysis"
-
-
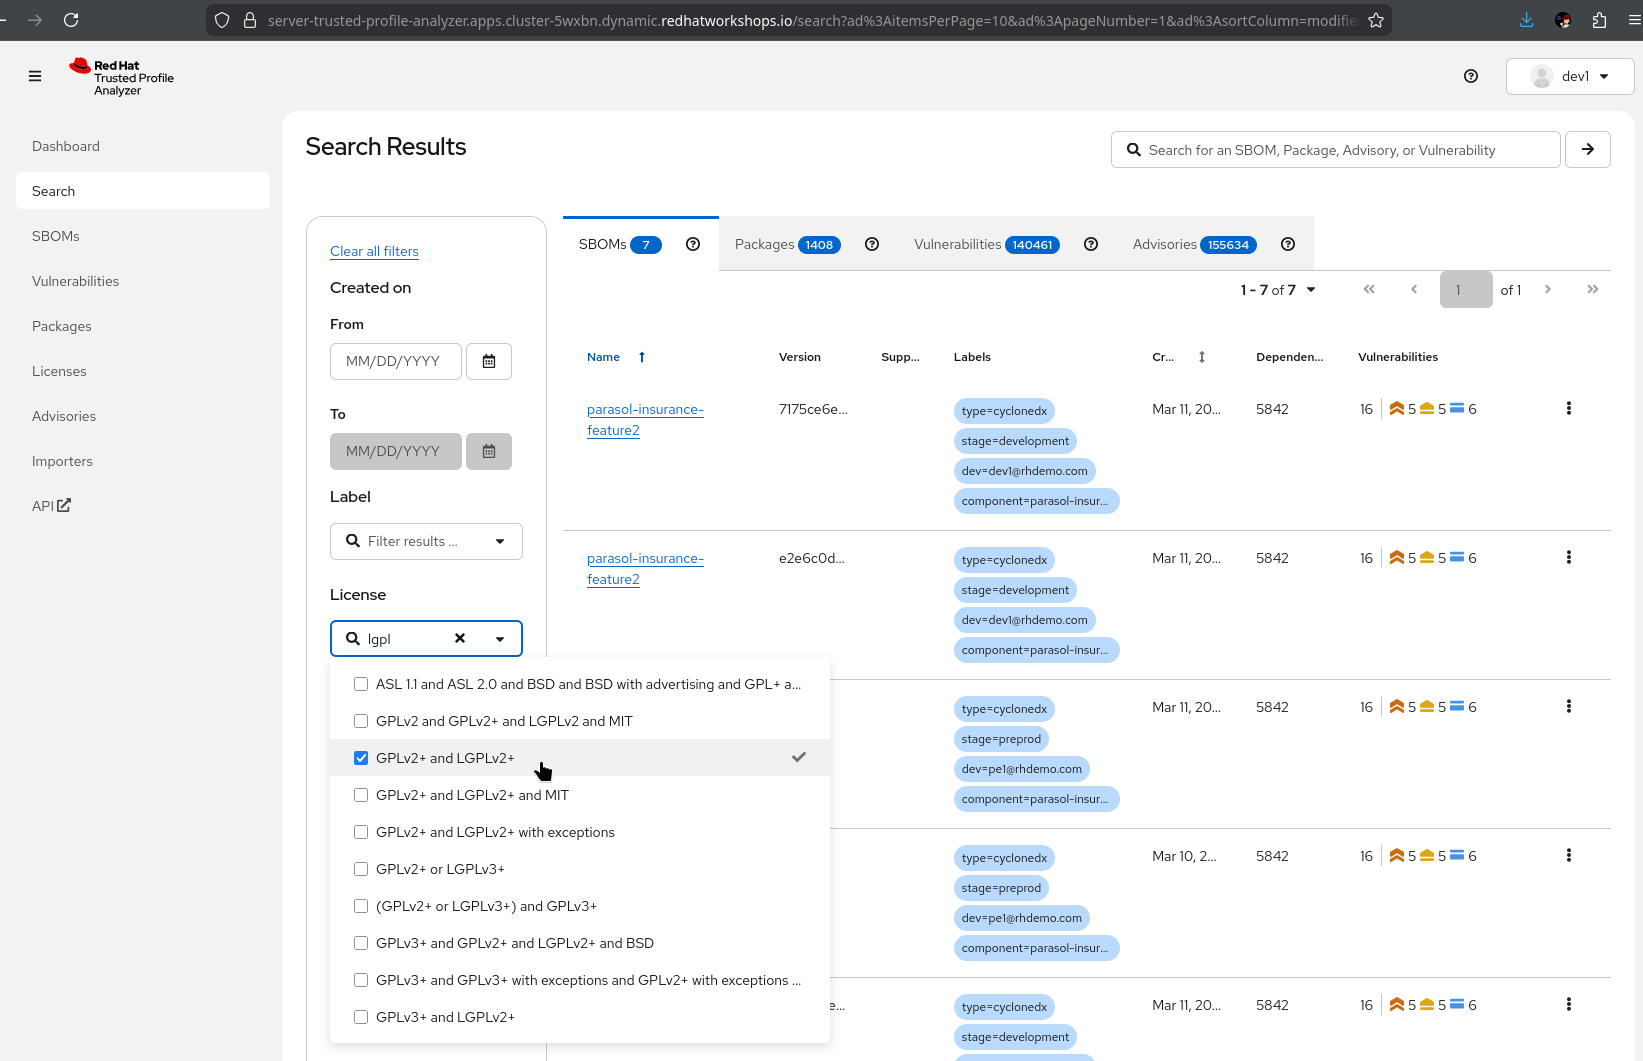
Show the Search View:
-
Select the license drop-down and enter e.g. "lgpl", select one or more licenses
-
SBOMs are filtered by licenses contained
-
What they should notice:
-
SBOMs are generated automatically by the pipeline and registered in TPA without manual steps
-
TPA provides a searchable inventory of every software component across all applications
-
Vulnerability search identifies affected applications immediately when a new CVE is disclosed
-
License compliance data is available for every component
-
This is continuous compliance, not point-in-time audit evidence
Business value callout:
"When the next Log4Shell happens, Parasol’s security team will not spend weeks figuring out which applications are affected. They will search TPA and know in seconds. Every application, every version, every dependency. And because SBOMs are generated for every build, this data is always current."
If asked:
- Q: "How often are SBOMs updated?"
-
A: "A new SBOM is generated for every pipeline run. Every time an image is built, the SBOM reflects the current state of dependencies."
- Q: "How often are CVEs updated?"
-
A: "Vulnerability data isn’t static - new problems are identified daily. RHTPA ingests the CVE and Advisory data by default every 4 hours, but that can be configured. New data is applied to all existing SBOMs in the database - it’s not just a point-in-time scan"
- Q: "Can we export SBOM data for auditors?"
-
A: "Yes. TPA supports standard SBOM formats (SPDX, CycloneDX). SBOMs can be exported for external auditors, regulatory submissions, or integration with other compliance tools."
Part 2 — Application topology and section wrap-up
Know
With all components deployed through the trusted pipeline, the application topology in the OpenShift console provides a visual overview of the complete Parasol system in production — all components, their relationships, and deployment status.
Business challenge:
-
No single view of the complete application architecture and its deployment status
-
Understanding the full system requires navigating multiple tools and dashboards
-
Architecture diagrams are manually maintained and quickly become outdated
Value proposition:
The OpenShift topology view automatically shows the running application components, their relationships, and health status. Combined with the Developer Hub catalog, this gives both developers and platform engineers a shared understanding of the application landscape in production.
Show
What I say:
"Let me bring this all together. We have explored the catalog, provisioned a development environment, scanned dependencies, built a trusted artifact, managed secrets securely, and tracked everything in TPA. Now let me show you what the complete system looks like in production."
What I do:
-
Open the OpenShift web console at {openshift_cluster_console_url}[{openshift_cluster_console_url}^]
-
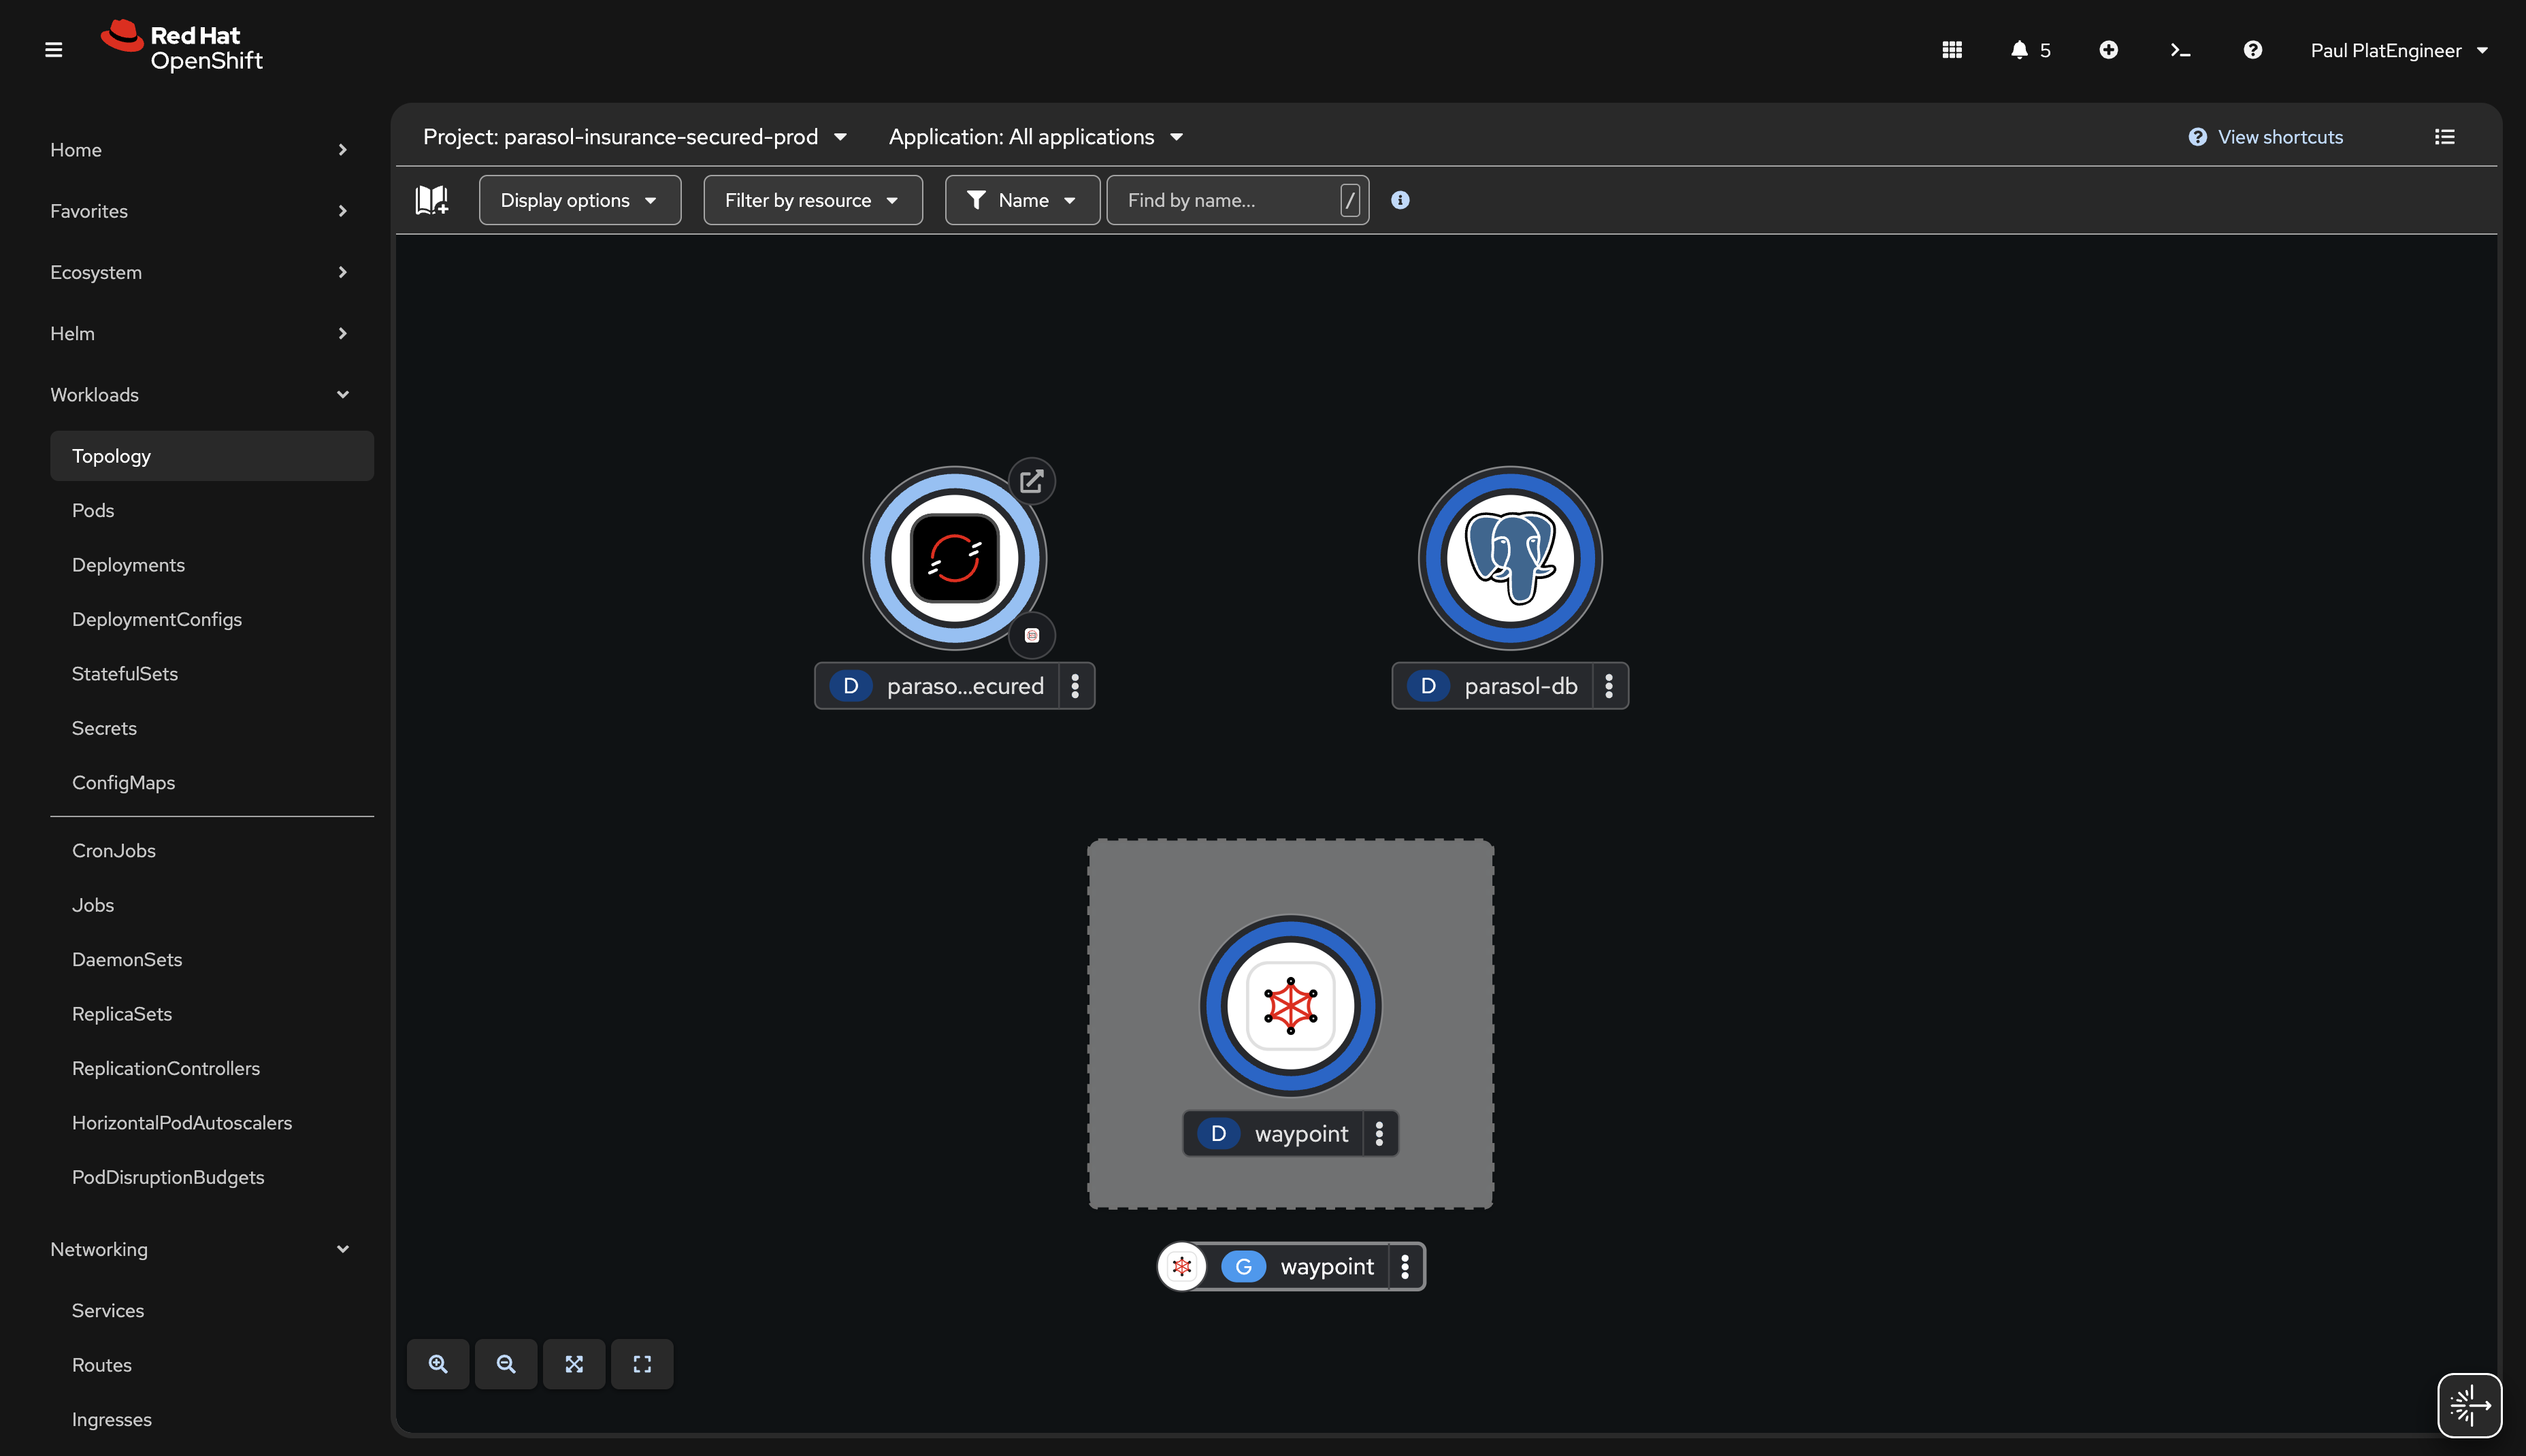
Navigate to the Topology view in the
parasol-insurance-secured-prodnamespace:-
Show all running components visually: the Parasol application, Kafka, database, and supporting services
-
Point out the deployment status indicators (blue donuts for healthy pods)
-
"This is the production environment with the latest version of the code — the release that the platform engineer tagged. Every component was deployed through the trusted pipeline with full attestation."
-
-
Point out the component relationships visible in the topology:
-
"The topology shows how everything fits together. The application connects to the database, consumes messages from Kafka, and exposes its endpoints through routes. This is a live view — it updates as components scale, restart, or change."
-
-
Talk track about scaling to more applications:
-
"As Parasol adds more applications and teams to the platform, each application gets the same treatment: catalog registration, golden path templates, secure pipelines, and production deployment with full trust chain. This scales from one application to hundreds."
-
What they should notice:
-
The production namespace shows the latest version deployed through the trusted pipeline
-
All components are visible with their relationships and health status
-
This is a live view that updates automatically
-
The complete trust chain is intact: from catalog to code to signed image to production
Business value callout:
"At Parasol, understanding the production landscape requires asking people and navigating multiple tools. With the OpenShift topology, the answer is one click away. And every component running here went through the same trusted pipeline with scanning, signing, and attestation."
Section 2 summary
What we demonstrated across Modules 4-6
-
Module 4: Developer Hub and catalog — Developer Lightspeed for AI-assisted platform knowledge, centralized discovery through the RHDH catalog, and self-service environment provisioning through golden path templates
-
Module 5: Secure development workflow — Dependency scanning in the IDE, a secure build pipeline with ACS scanning and Tekton Chains attestation viewed from Developer Hub, and merge request workflow with release tagging
-
Module 6: Trusted software supply chain — SBOM management with TPA for continuous compliance, and application topology showing the complete system in production
The trust chain
Section 2 tells the story of a complete trusted software supply chain: the developer discovers components in the catalog, provisions a feature branch environment from a template, identifies a dependency issue in real time, pushes code that triggers a secure pipeline with ACS scanning, signing, and SLSA attestation, creates a merge request for review, and the platform engineer approves and tags a release for production. TPA provides ongoing SBOM management for compliance. Every step is automated, auditable, and policy-driven.
Key takeaways
-
Red Hat Developer Hub transforms developer discoverability and self-service with AI-powered Lightspeed
-
Golden path templates replace days of ticket-driven infrastructure provisioning
-
Dependency Analytics shifts security left to the developer’s IDE
-
The secure build pipeline integrates security scanning, signing, and attestation into a single flow
-
SBOM management with TPA provides continuous compliance visibility
-
The entire supply chain is automated, with intentional manual gates: merge request approval and release tagging
Presenter transition
|
Presenter tip: If continuing to Section 3, the transition should set up the AI use case: "We have built a trusted, secure application platform with full supply chain visibility. Now Parasol’s CIO wants to take the next step: using AI to enhance the application’s email routing. Let’s see how the same platform makes that possible." |