Module 5: Secure development workflow
Presenter note: This module continues the Section 2 story. The developer works on their feature branch in DevSpaces, uses the Dependency Analytics plugin to identify an unnecessary dependency (quarkus-rest), pushes code that triggers the secure build pipeline against their feature branch, then creates a merge request in GitLab for PE approval. The PE approves and creates a release tag. Target duration: 15 minutes across 2 parts.
|
One big difference here is that you should not have to visit the OpenShift Console at all - reinforcing the message that Developer Hub is the single pane of glass for developers. The deployment topology, pipeline and Argo CD sync are both viewed from Developer Hub. The only time you leave Developer Hub is to log in to GitLab as the platform engineer to approve the merge request and create a release tag. |
Part 1 — Development with DevSpaces and Dependency Analytics
Know
The developer opens their feature branch in DevSpaces and begins development. In Section 2, DevSpaces includes the Dependency Analytics plugin, which provides real-time scanning of project dependencies directly in the IDE. This gives developers immediate feedback on dependency issues before they even commit code.
Business challenge:
-
Unnecessary or incompatible dependencies bloat applications and introduce risk
-
Developers have no visibility into the health of their dependency tree during development
-
Known CVEs in transitive dependencies go undetected until production scanning
-
Manual dependency review processes do not scale across hundreds of developers
Current state at Parasol:
-
Dependency issues are only detected during CI pipeline scans
-
Developers discover problems days after committing code, requiring context switching
-
Unnecessary dependencies accumulate over time, increasing attack surface and build times
-
No proactive guidance on dependency hygiene during the development process
Value proposition:
The Dependency Analytics plugin in DevSpaces scans project dependencies in real-time as the developer works. It identifies known CVEs, license issues, incompatible dependencies, and unnecessary packages directly in the IDE. This shifts security and dependency hygiene left to the earliest possible point — the developer’s inner loop.
Show
What I say:
"Our developer has their feature branch open in DevSpaces from Module 4. Before they start writing business logic, let’s look at what the Dependency Analytics plugin is already telling them about the project’s dependencies."
What I do:
-
In the DevSpaces workspace (continuing from Module 4), open the project’s dependency file:
-
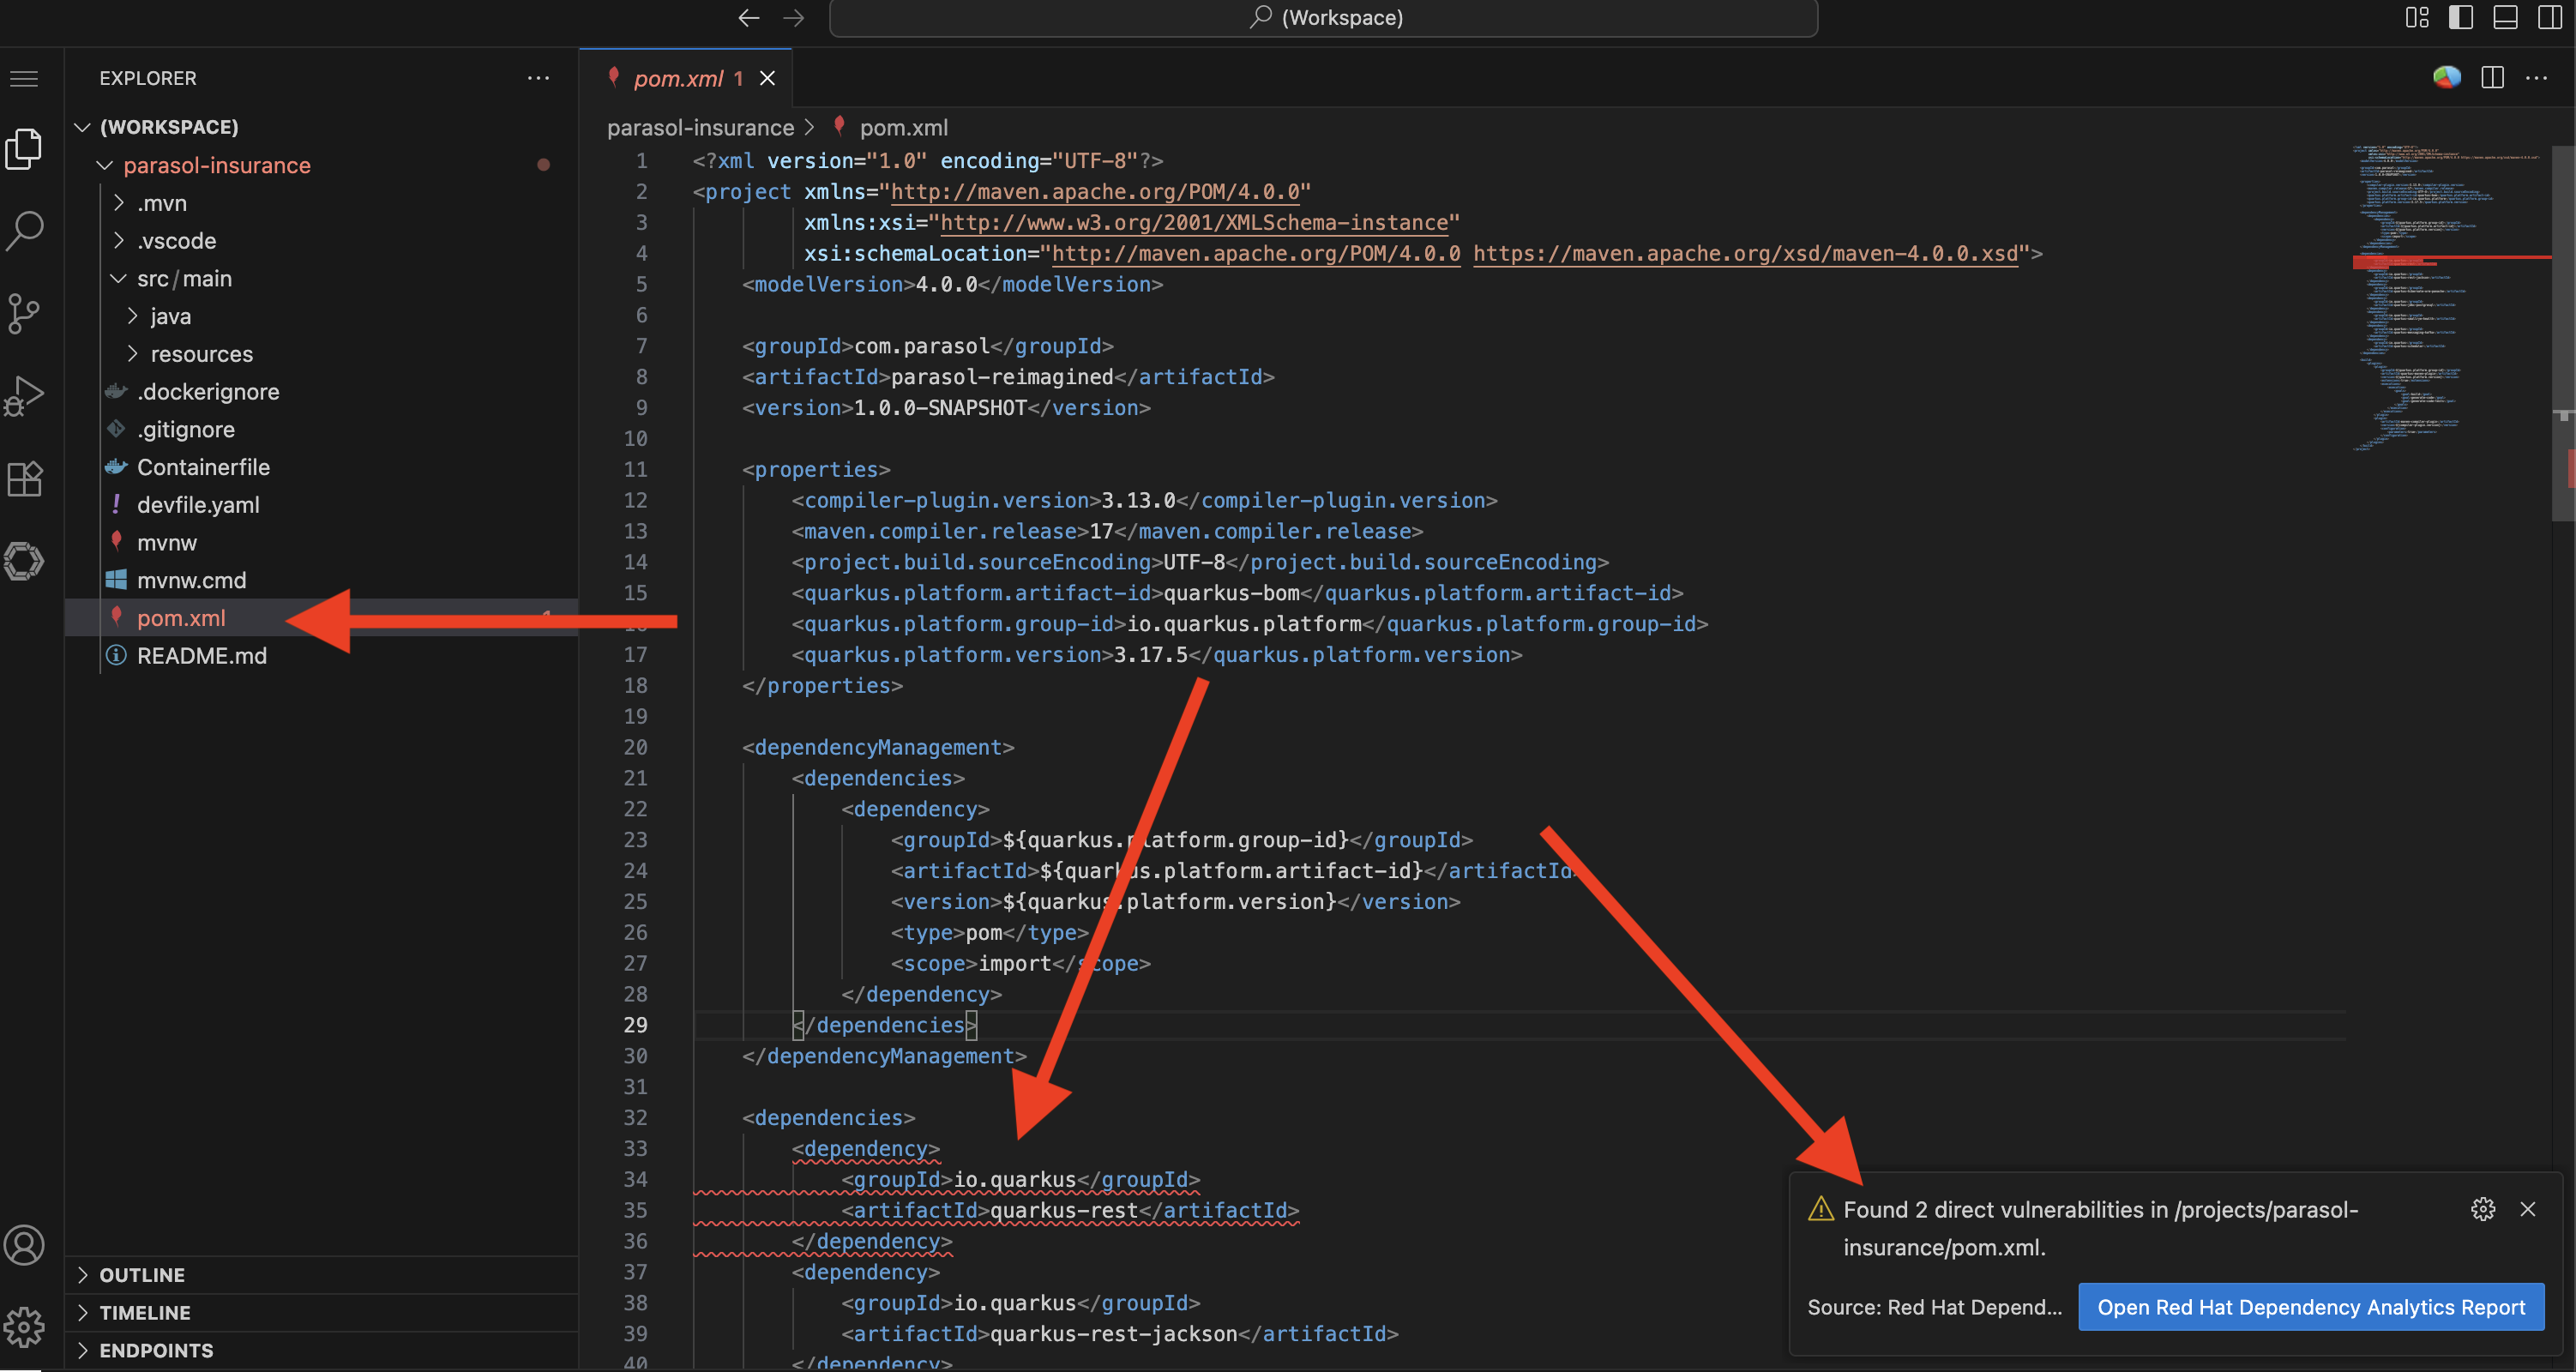
Open
pom.xml -
"The Dependency Analytics plugin scans this file automatically. It checks every dependency against known vulnerability databases and compatibility rules in real time."
If the Dependency Analytics scan doesn’t run automatically, click the pie chart in the top-right corner of the pom.xmlto initialise it.
-
-
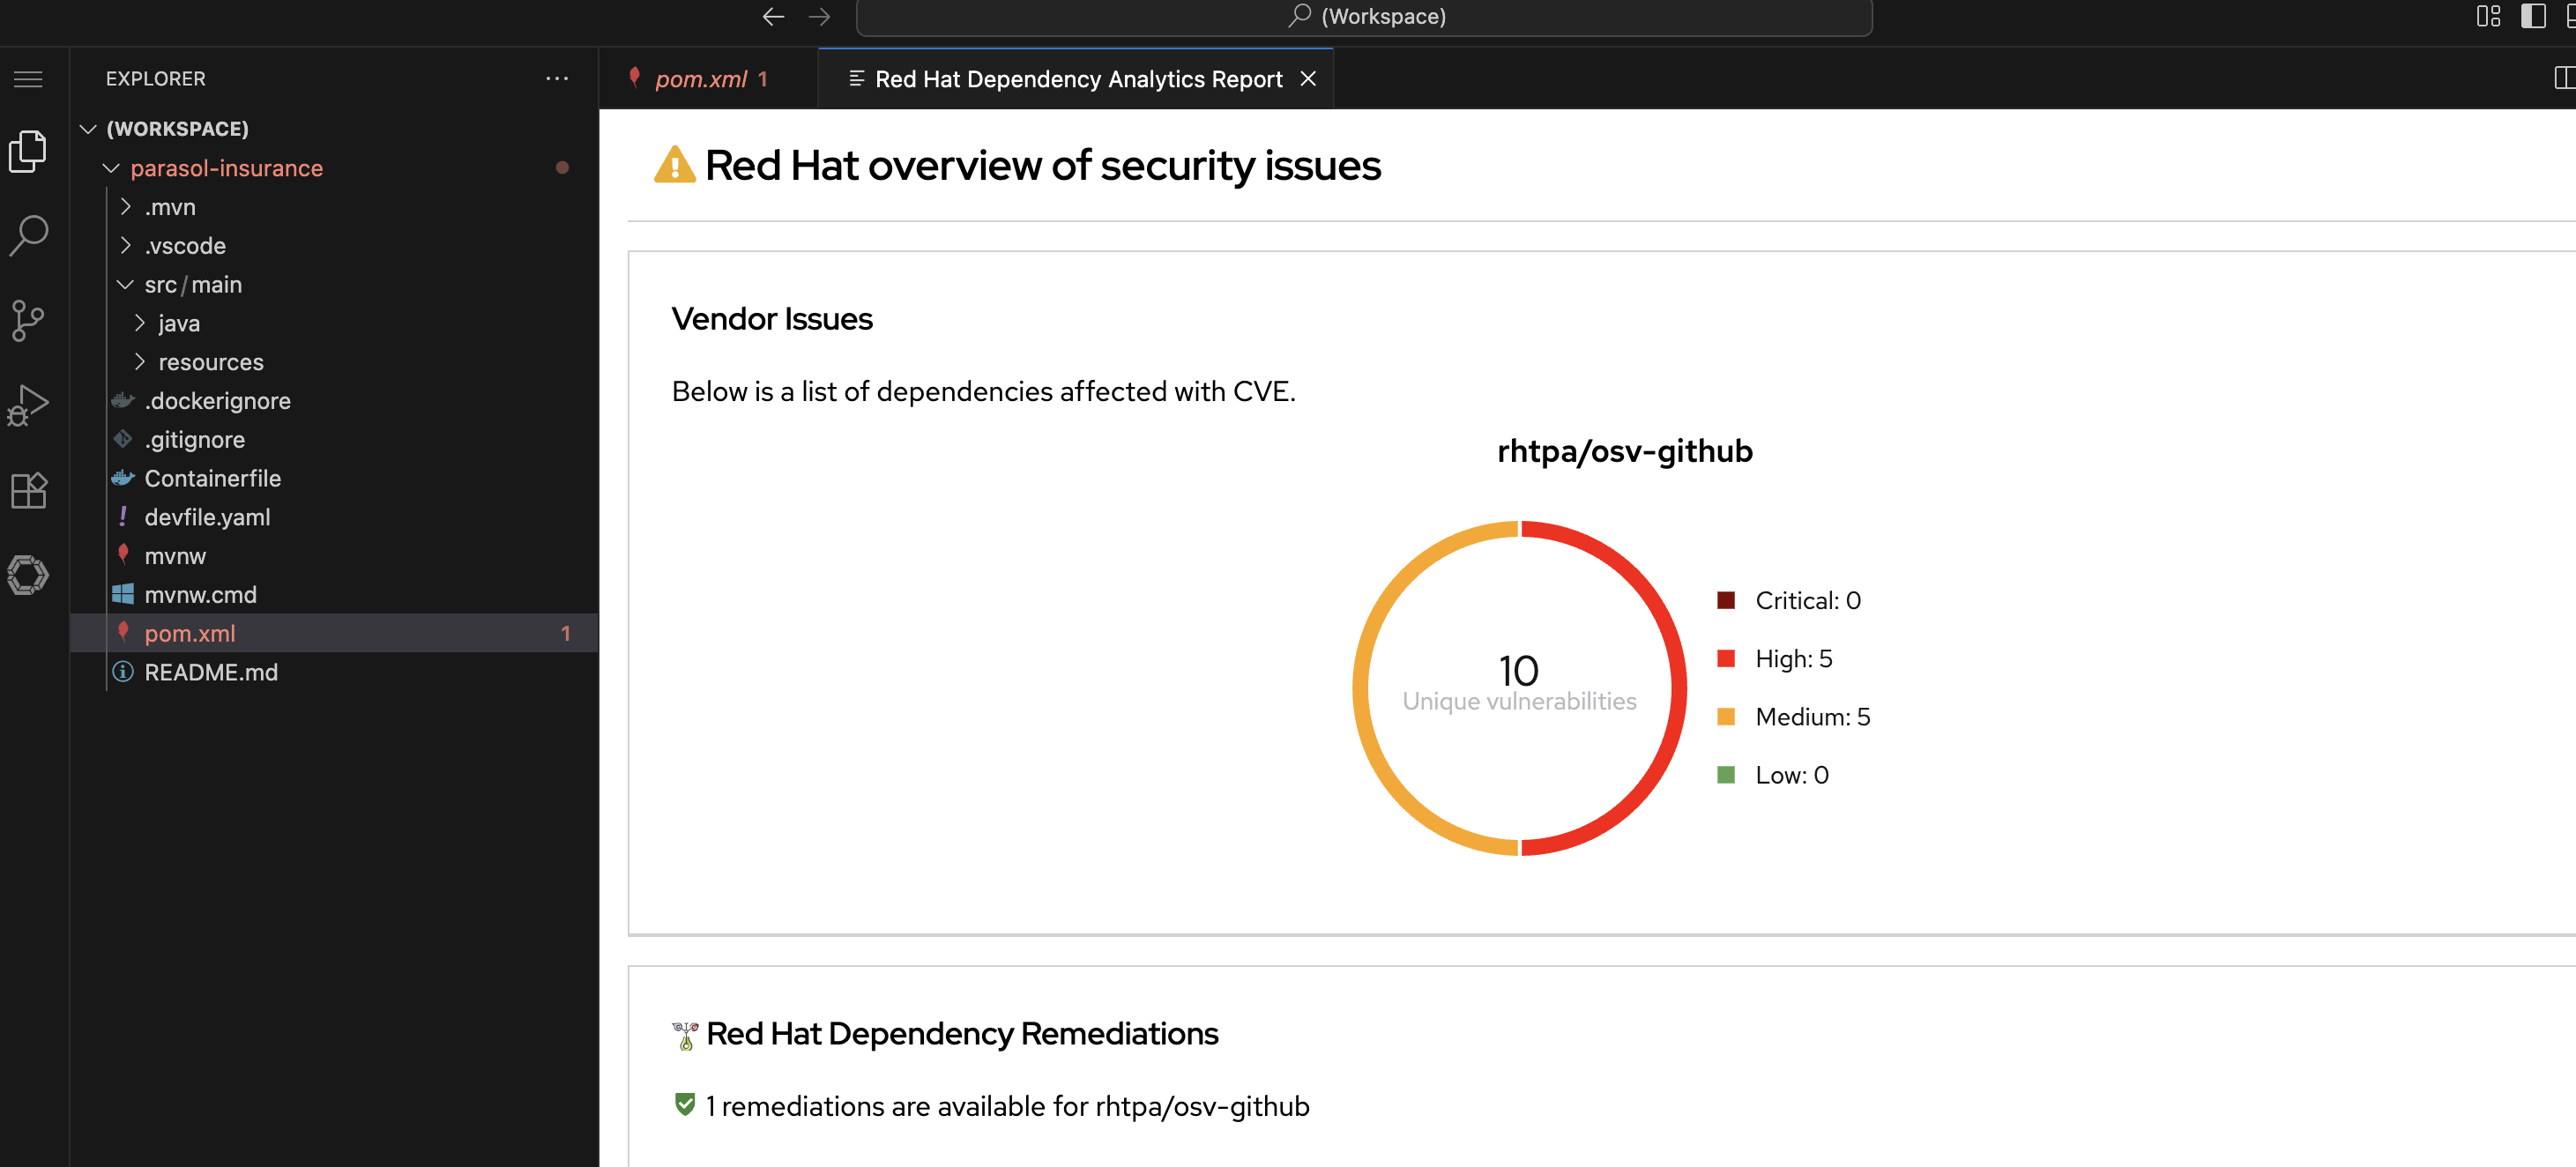
Show the Dependency Analytics report:
-
Either click the Open Report in the pop-up, or right-click on the vulnerability and choose "Red Hat Dependency Analytics Report"
-
Point out the report identifying an issue with the
quarkus-restdependency (this is the only direct issue we can fix in our code, the others are indirect and could be addressed with more invasive changes) -
"The report has identified a vulnerability in the
quarkus-restdependency. Thequarkus-restextension is no longer used by the project so we can simply remove it."
-
-
Remove the unnecessary dependency by deleting the
quarkus-restentry frompom.xml:-
Show the dependency being removed
-
"The
<dependency>block is removed. The dependency tree is cleaner, the attack surface is smaller, and the potential for runtime incompatibilities is eliminated. In the old workflow, this would have surfaced as a confusing build failure or runtime error much later."
-
-
Show that the remaining dependencies are clean:
-
Point out dependencies with no issues flagged
-
"The rest of the dependencies are clean. The developer has confidence that their project’s dependency tree is healthy before they even commit."
-
What they should notice:
-
Dependency scanning happens in real time, directly in the IDE. No separate tool, no pipeline wait.
-
The report identified an incompatible dependency that could cause runtime issues
-
The fix is a single-line removal in the dependency file
-
The developer fixed the issue before committing, avoiding pipeline failure and context switching
-
This is "shift left" in action: dependency hygiene at the earliest possible point
Business value callout:
"At Parasol, dependency issues are only caught during pipeline scans, days after the developer wrote the code. By then, the developer has moved on to other work and has to context-switch back to fix it. Dependency Analytics catches the issue in real time, while the developer is actively working on the file. The fix takes seconds instead of hours."
If asked:
- Q: "What vulnerability databases does it use?"
-
A: "Dependency Analytics uses Red Hat’s vulnerability data, which includes CVE databases (GitHub Advisory Database, CVE Project Database from cve.org), Red Hat security advisories, and known exploit information. It covers both direct and transitive dependencies."
- Q: "Can it be used in air-gapped / restricted environments?"
-
A: "Dependency Analytics uses a hosted, free public good instance of Red Hat Trusted Profile Analyzer (RHTPA) provided by Red Hat at no cost. Customers can configure their own RHTPA instance as backend for their developers, removing the need for Internet access"
- Q: "Does this work for languages other than Java?"
-
A: "Yes. Dependency Analytics supports Java (Maven, Gradle), JavaScript (npm), Python (pip), and Go. The plugin scans the appropriate dependency file for each language."
Part 2 — Secure build pipeline and merge request
Know
When the developer pushes code on their feature branch, it triggers the secure build pipeline to run against that branch and deploy to their development namespace. The pipeline includes ACS vulnerability scanning, image signing, SBOM generation, and SLSA attestation via Tekton Chains. The developer can watch the pipeline and Argo CD sync directly from Developer Hub. After verifying everything works, the developer creates a merge request in GitLab, and the platform engineer approves it and creates a production release.
Business challenge:
-
Software supply chain attacks are increasing in frequency and sophistication
-
No automated verification that build artifacts are genuine and untampered
-
SBOMs are not generated consistently, making vulnerability tracking impossible at scale
-
Compliance frameworks increasingly require provenance attestation for all deployed software
Current state at Parasol:
-
Build artifacts are not signed or verified before deployment
-
No software bill of materials (SBOM) is generated for any application
-
Supply chain provenance is undocumented
-
Compliance audits require manual evidence gathering
Value proposition:
A secure build pipeline integrates multiple trust and compliance controls into a single automated flow. When code is pushed: Red Hat Advanced Cluster Security (ACS) scans for vulnerabilities and enforces policies; Tekton Chains signs the container image, generates an SBOM, and creates SLSA attestation. Every artifact has a verifiable chain of custody from source to deployment. The developer can observe the entire process from within Developer Hub.
Security teams have access to a complete audit trail, including what went in to generate an artifact, where and how it was built - in a tamper-proof, append-only transparency database.
Show
What I say:
"The developer has cleaned up the dependency issue and is ready to push their code. Watch what happens when they push to their feature branch. The secure pipeline runs automatically, and the developer can watch everything from Developer Hub."
What I do:
-
In DevSpaces, commit and push the changes using the Source Control view:
-
Stage the modified
pom.xml -
Enter a commit message:
Remove unnecessary quarkus-rest dependency -
Click the dropdown arrow next to Commit and select Commit & Push
-
"The developer pushes to their feature branch. The secure pipeline starts automatically."
-
-
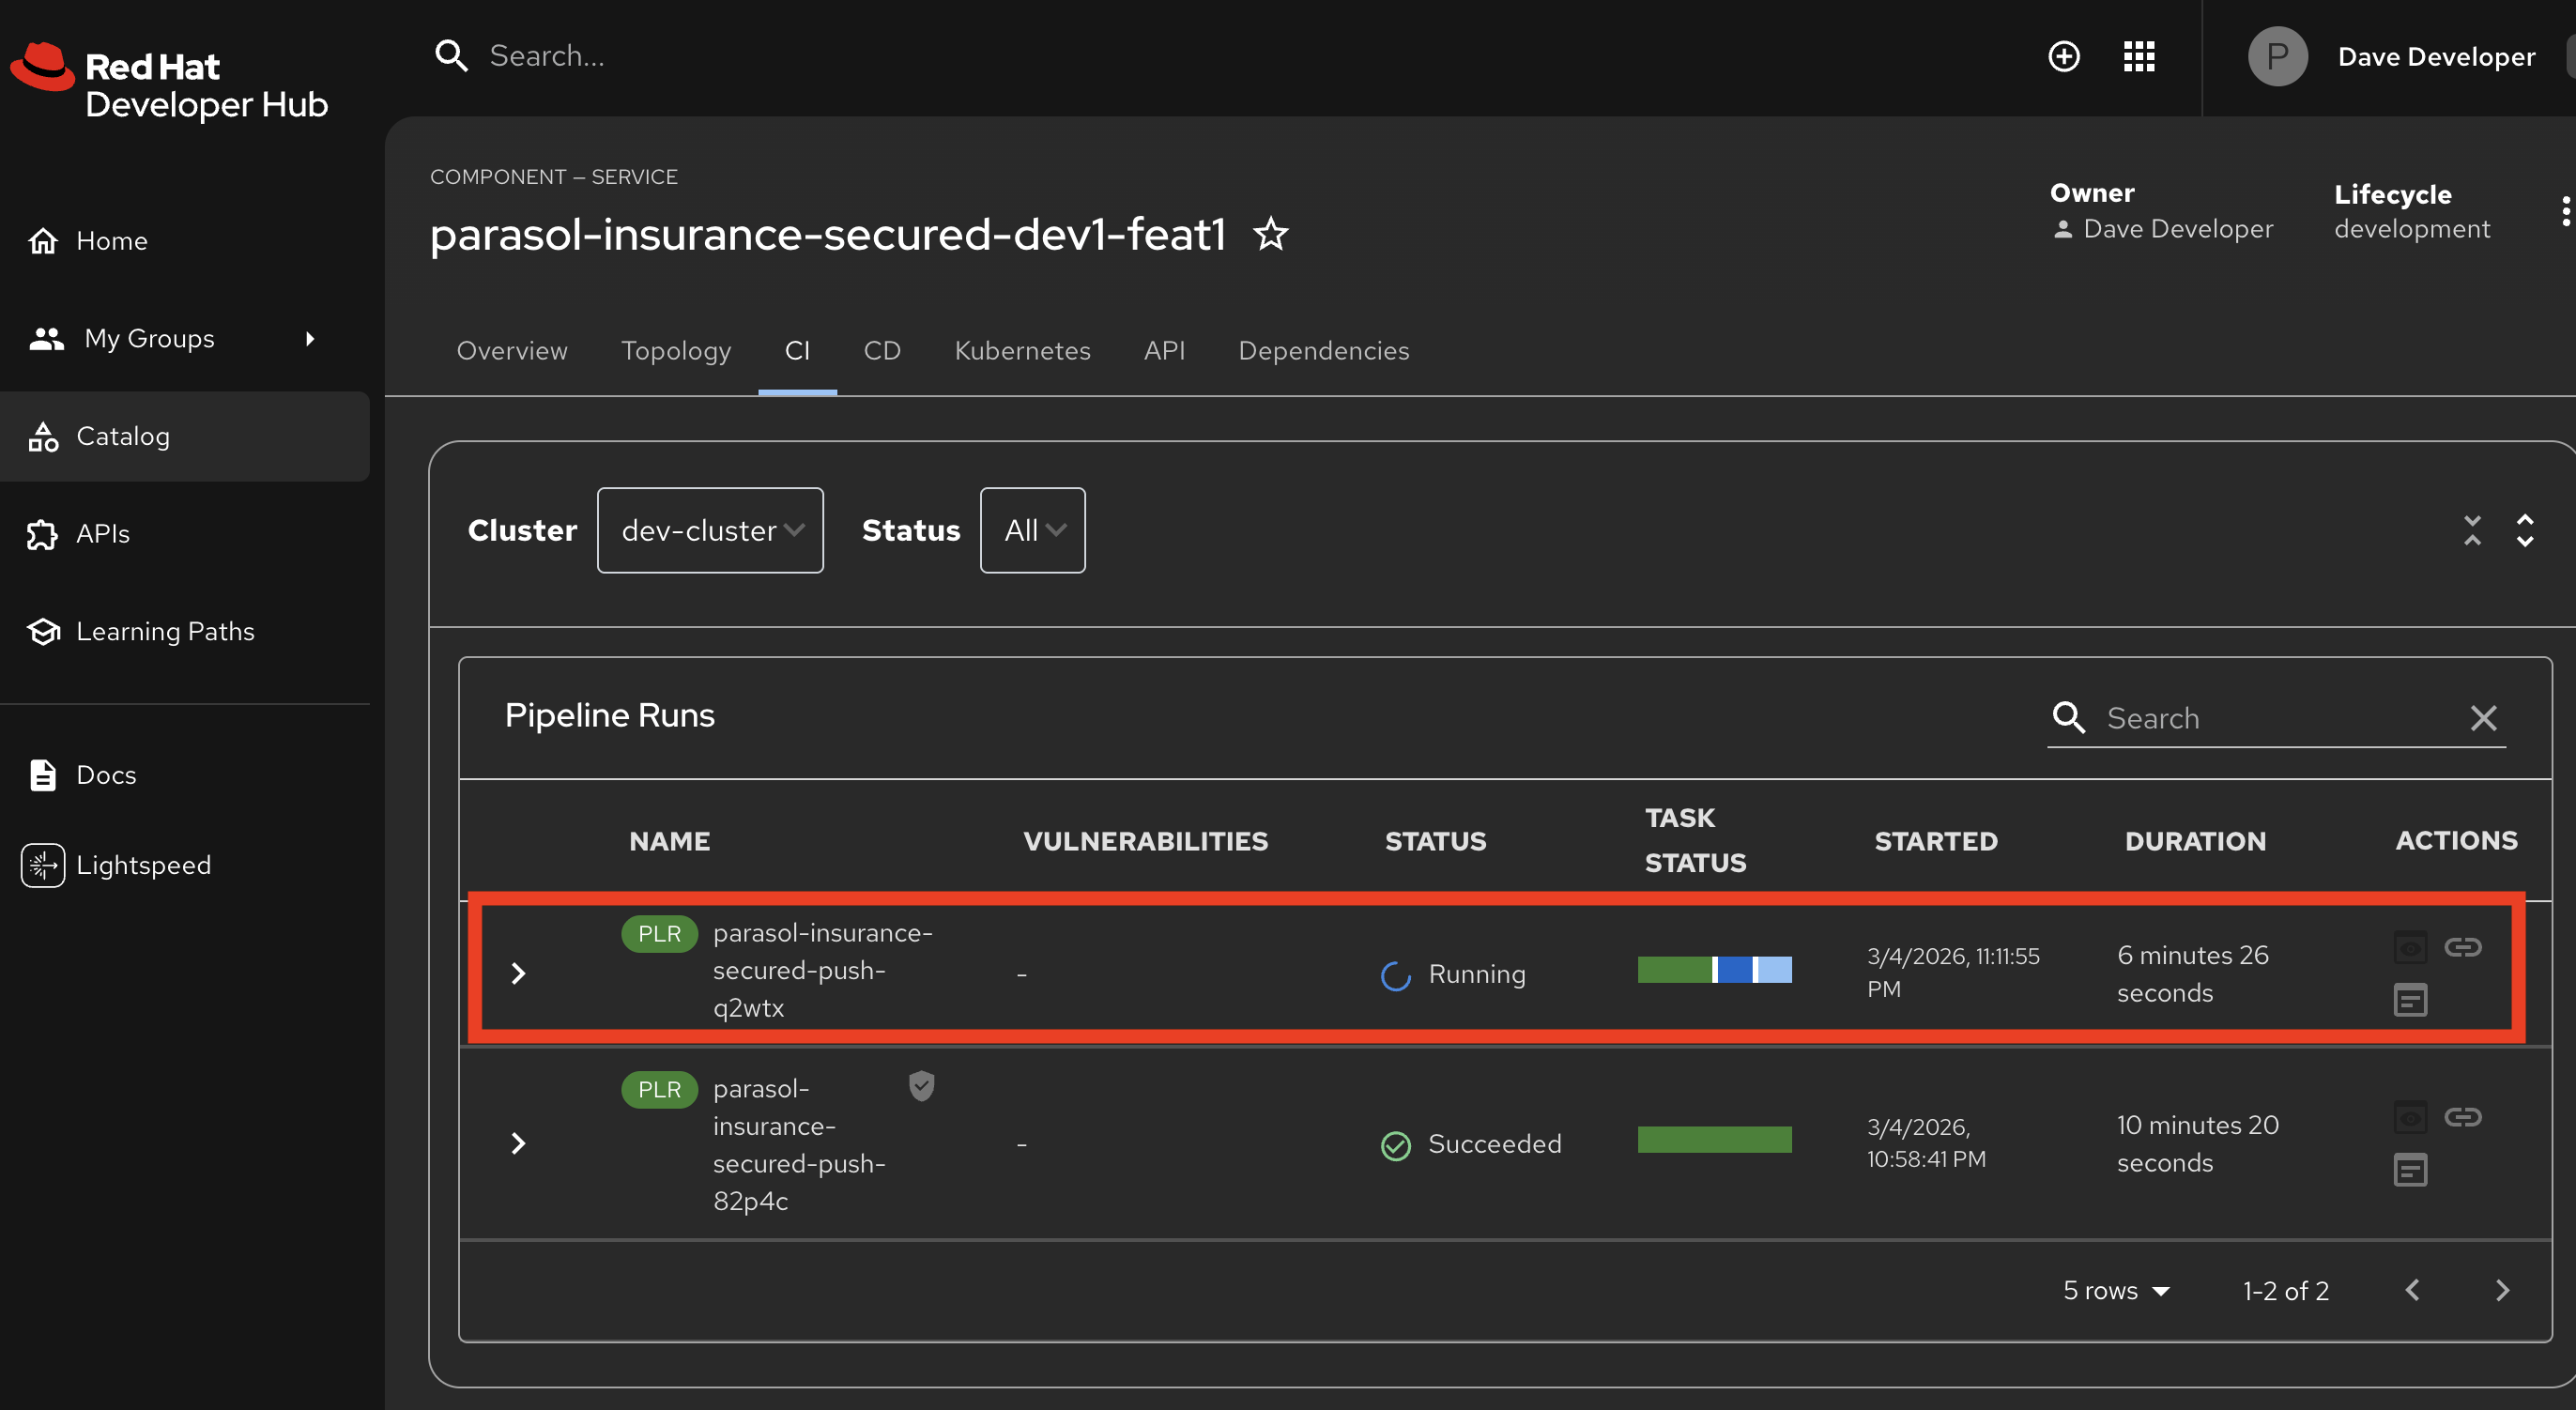
Switch to Developer Hub at https://backstage-developer-hub-rhdh.{openshift_cluster_ingress_domain} and navigate to the component’s CI tab:
-
Show the pipeline run triggered by the push to the feature branch
-
"The developer sees the pipeline status right here in Developer Hub. No need to switch to the OpenShift console. Developer Hub is the single pane of glass."
-
-
Expand the pipeline and Walk through each stage as it appears in the Developer Hub pipeline view:
-
Clone — Source code pulled from the feature branch
-
Build and Push — Quarkus application compiled, container image built and pushed to the registry
-
ACS vulnerability scan and policy check — Red Hat Advanced Cluster Security scans the built image
-
Point out: "ACS checks the image against known vulnerability databases and organizational policies."
-
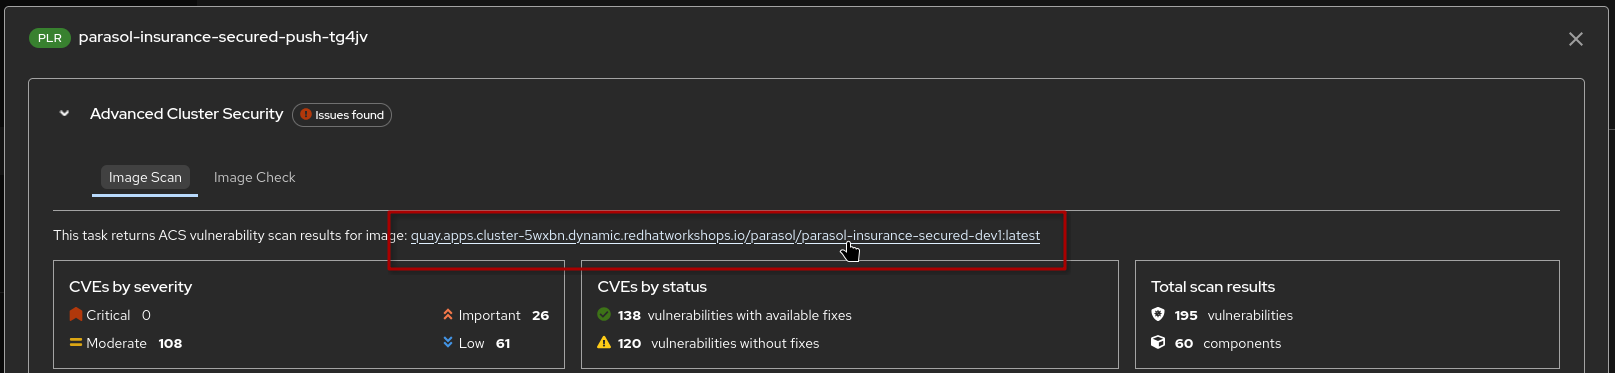
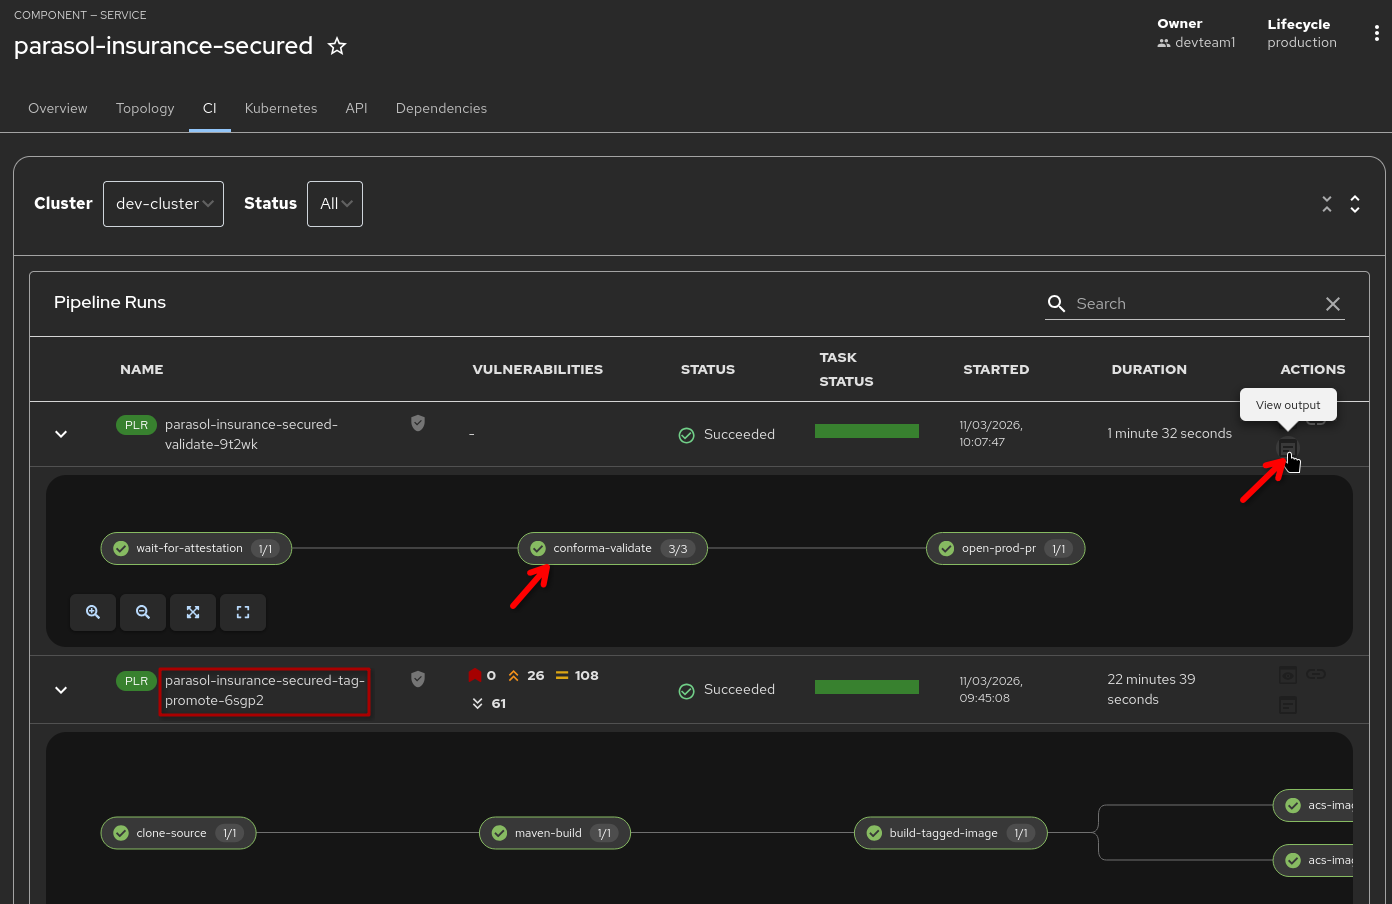
Point out: "Once the pipeline has run, vulnerability scan statistics are shown in the pipeline overview"
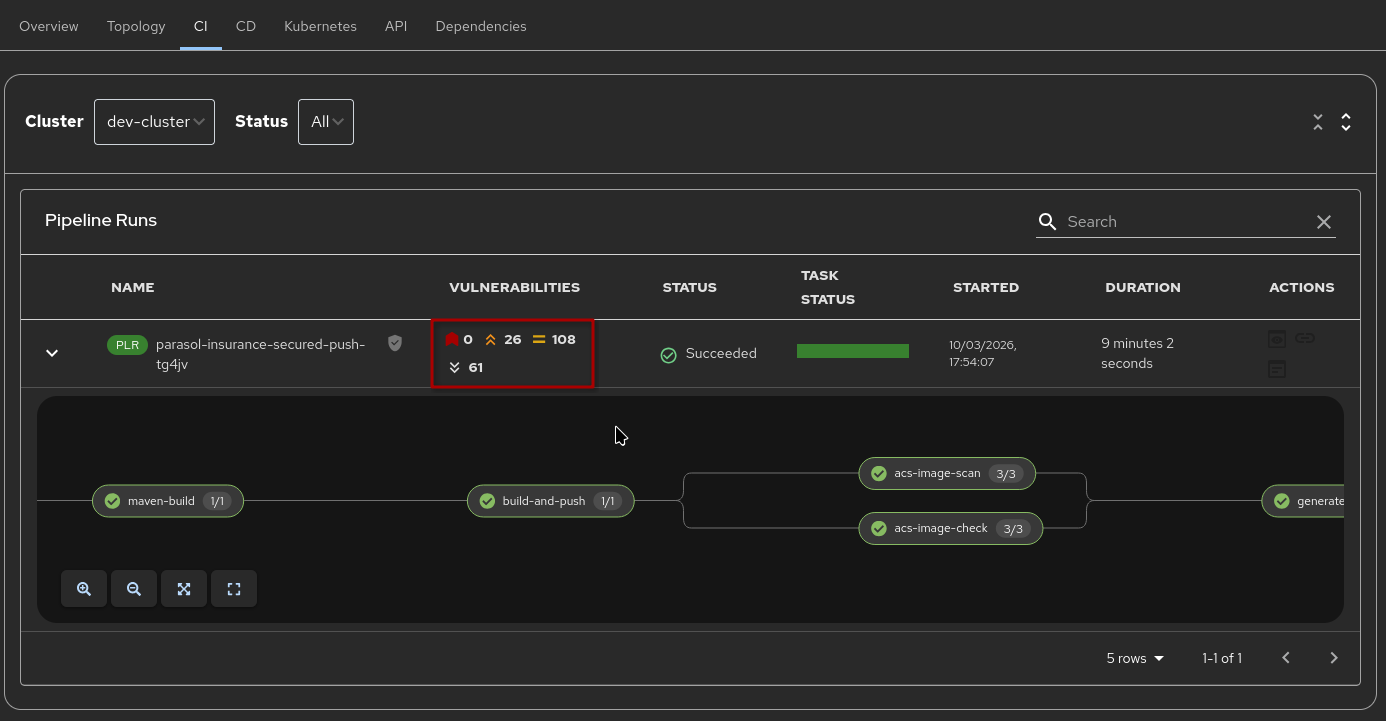 Figure 4. Vulnerability statistics in Developer Hub
 -
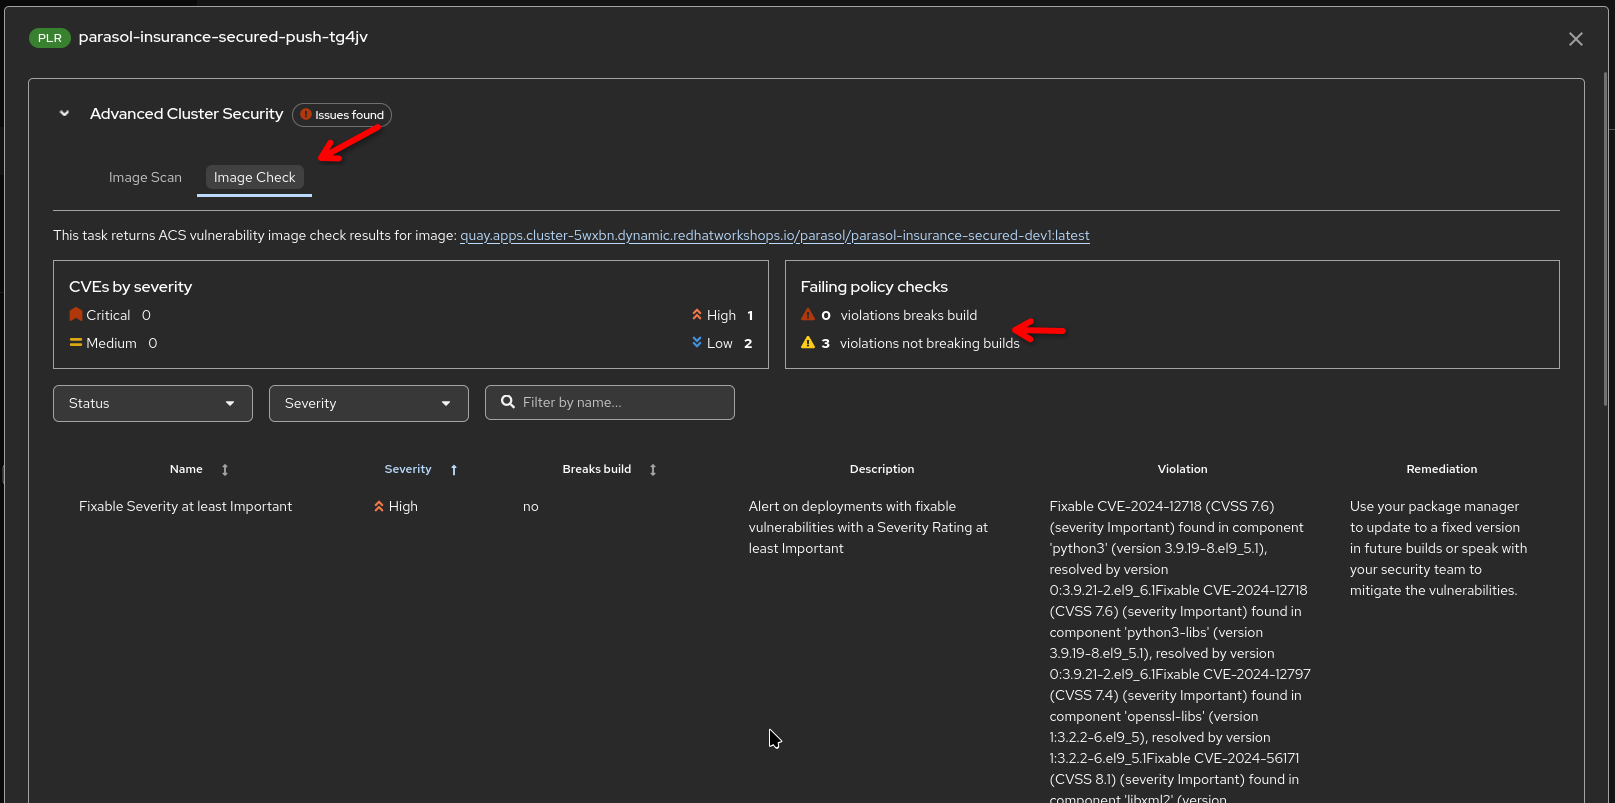
Point out: "Clicking on the Output icon above the pipeline run gives you access to detailed scan reports as well as ACS policy violations"
-
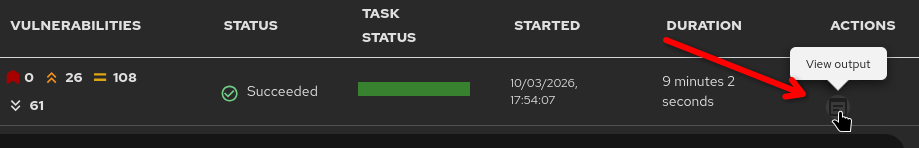
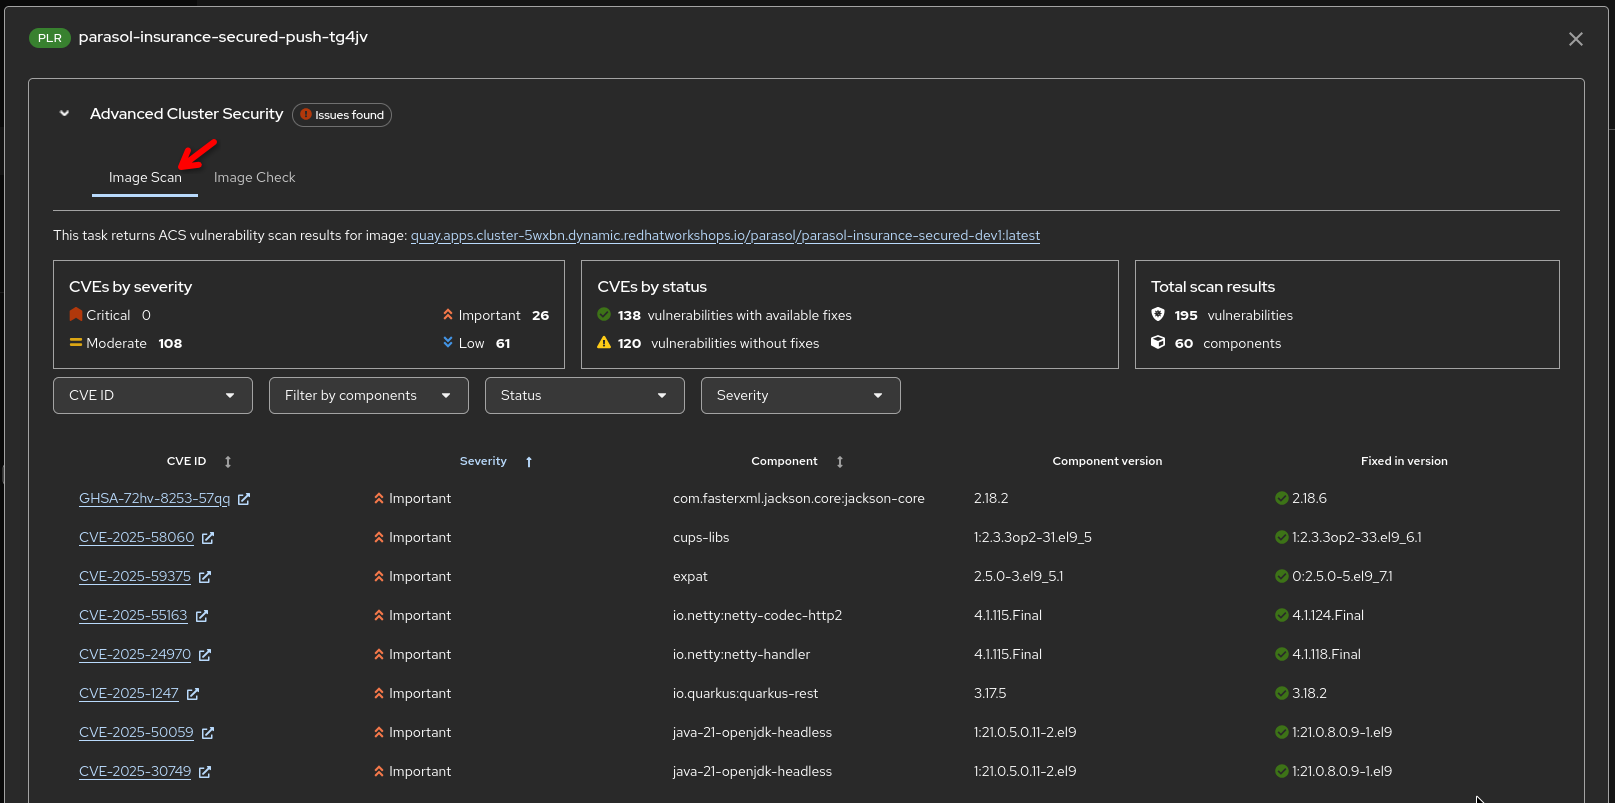
|
The vulnerability data here encompasses vulnerabilities detected in the application code as well as detections in the base image components - effectively showing the overall vulnerability status of the generated image |
-
Generate SBOM
-
Uses
syftto generate an SBOM of the image and the quarkus application inside it
-
-
Upload SBOM to TPA
-
Uploads the generated SBOM to Red Hat Trusted Profile Analyzer
-
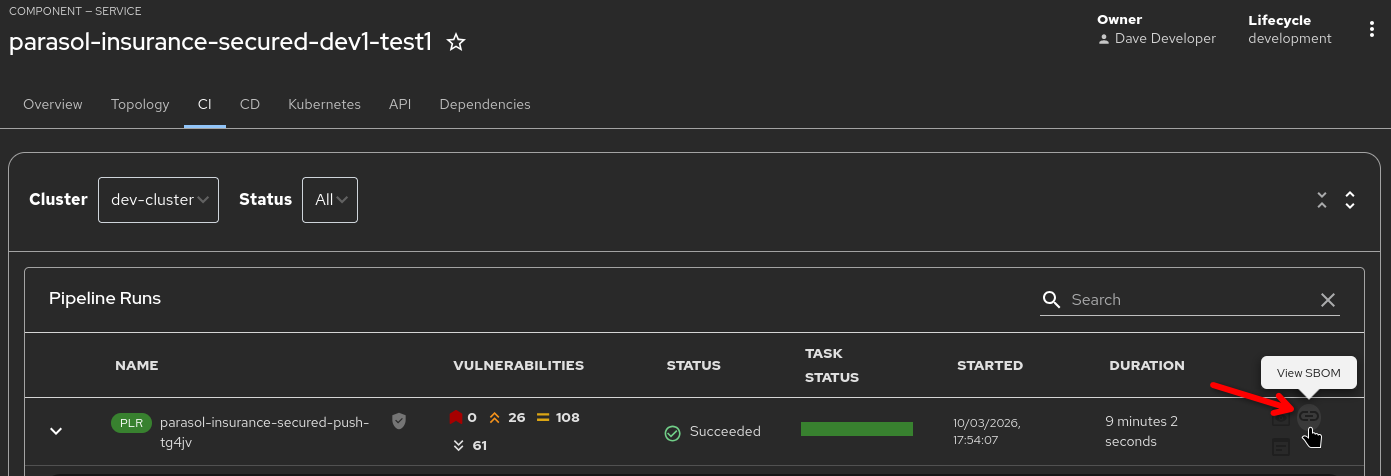
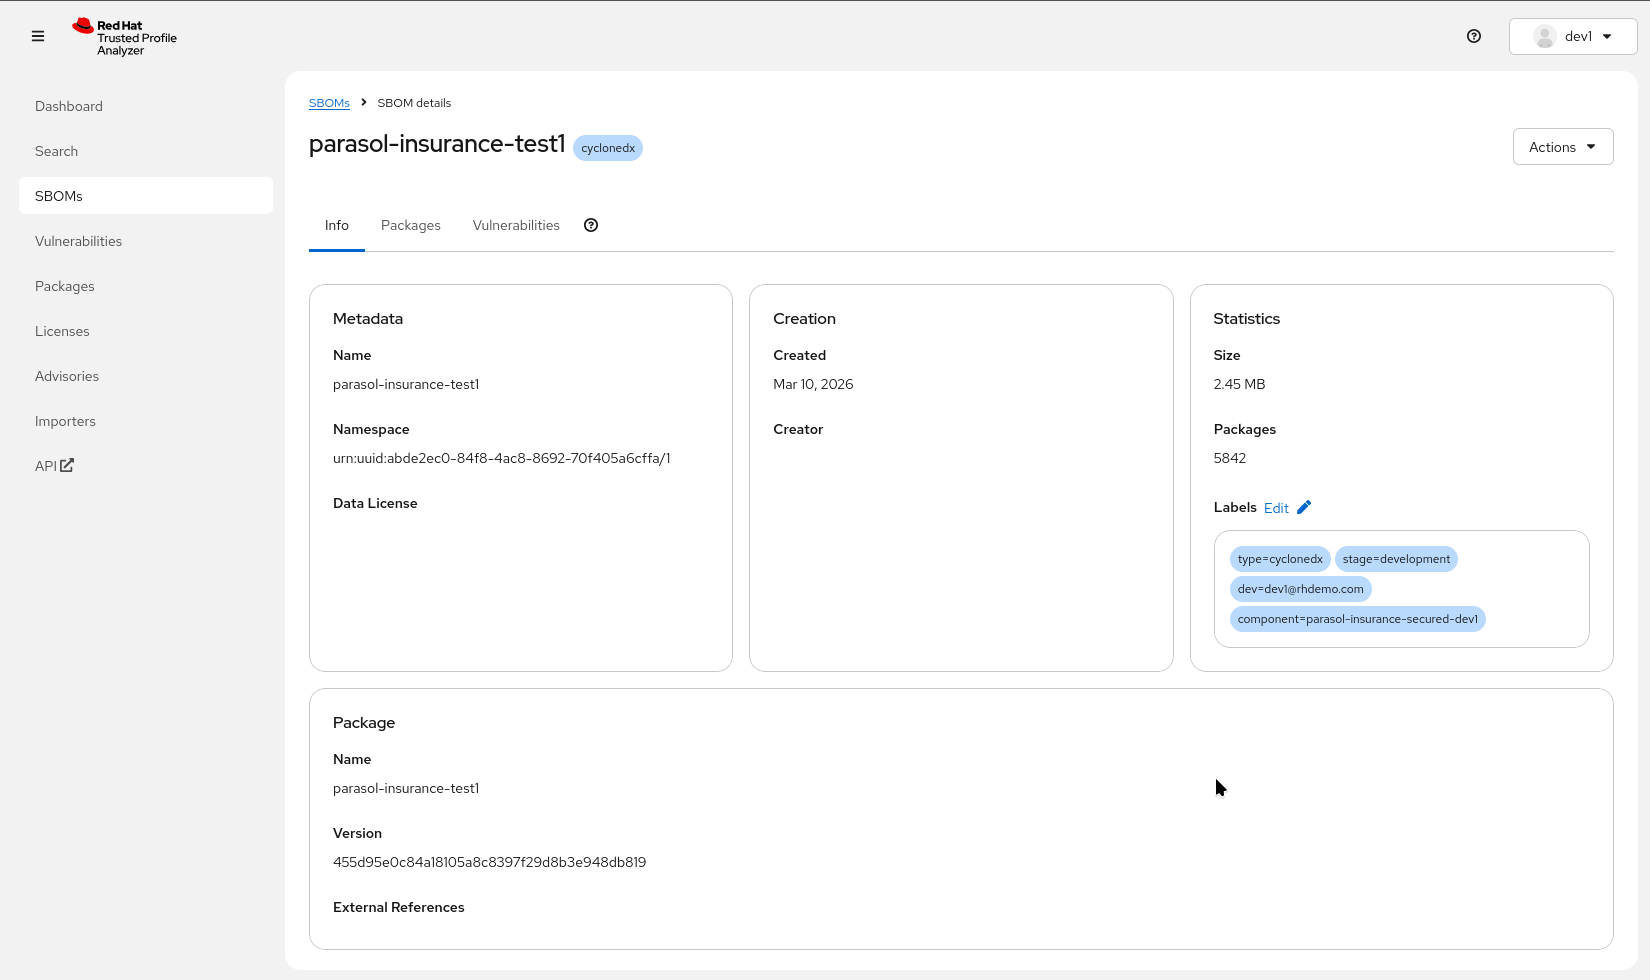
Point out: "Clicking on the 'View SBOM' action opens the SBOM that was just uploaded in TPA for detailed analysis capabilities, access to packages and versions used, deep search and license information"
-
-
Tekton Chains — Automated post-build trust steps:
-
Image signing (cryptographic signature applied)
-
SLSA attestation (provenance record created)
-
"Tekton Chains runs automatically in the background as a Kubernetes Controller, watching the pipeline tasks and pipeline run. It signs the image, records pipeline and task states, inputs and outputs, creates and signs a SLSA attestation. None of this requires developer action."
-
-
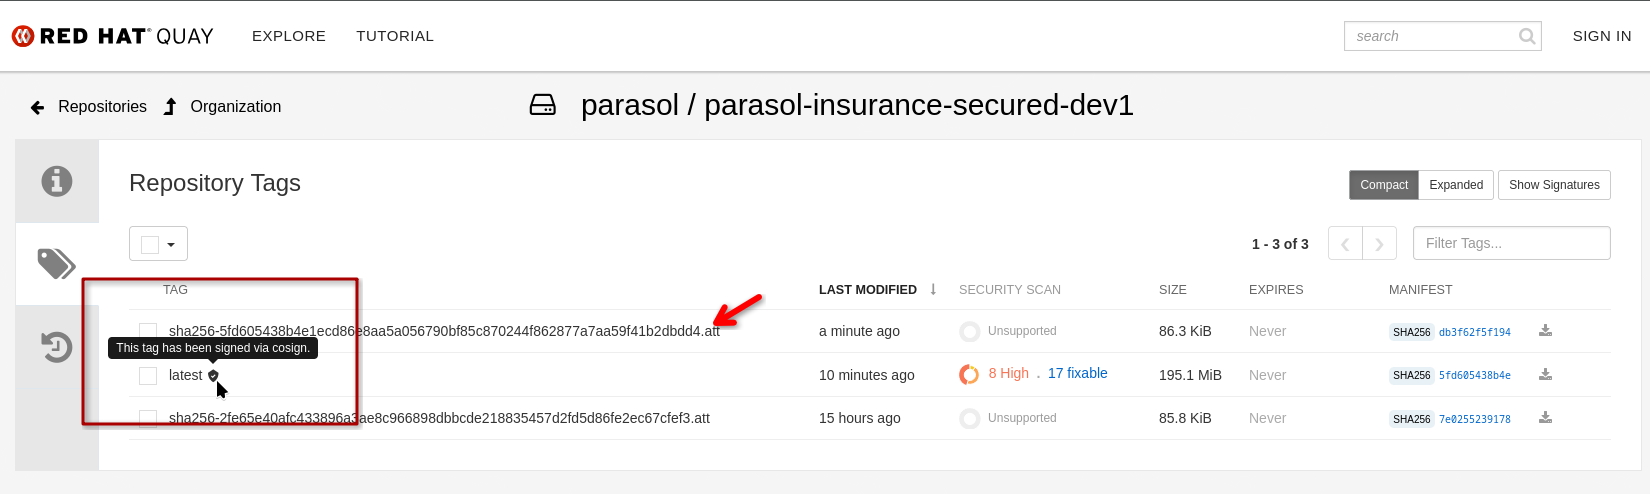
Point out: "As an example, Red Hat Quay recognizes the signature and shows the signed and attached attestation. Clicking on the inspected image link in the RHTAS report opens the registry, where I can see the image has automatically been signed and attested"
Optional: Show Attestation Highlights - Click to expand
To show what data is actually being recorded by Tekton Chains (and verified by Conforma in the tag-promotion pipeline, see below), we have provided a short script in the OpenShift Web Terminal:
1.) Open the {openshift_cluster_console_url}/terminal[Openshift Web Terminal^] and make sure you’re logged in as admin / {openshift_cluster_admin_password} (use the "htpasswd" login option)
2.) Start the Web Terminal (accept the defaults, if asked for a namespace)
3.) run verify-image and select an image that has an attestation, e.g. parasol-insurance-secured
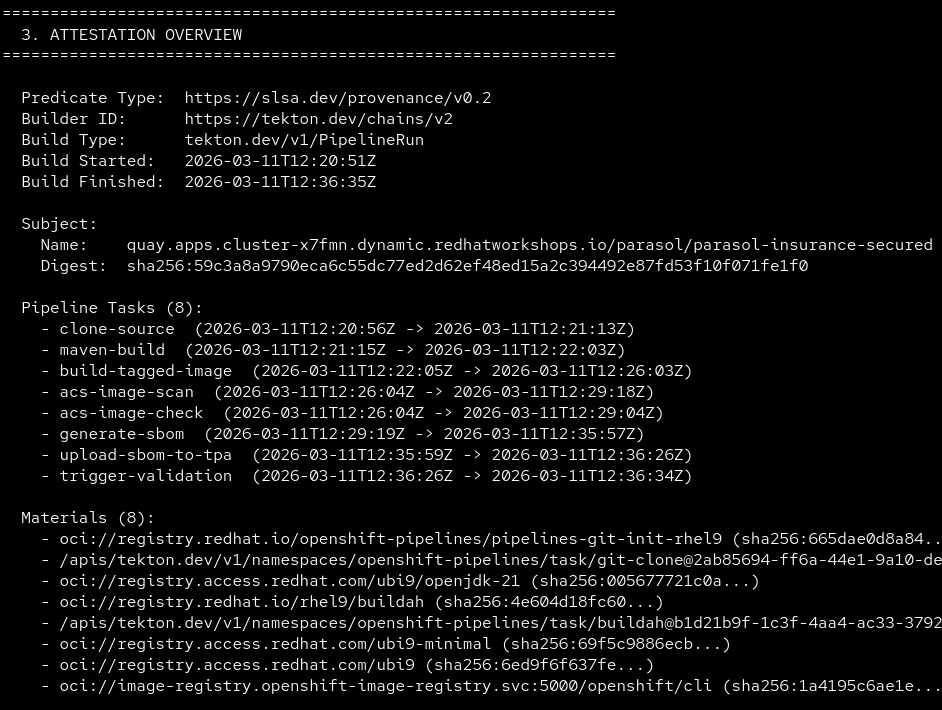
4.) It will list some highlights of what was being recorded (such as tasks and their parameters)
5.) If you run verify-image --verbose you’ll get the full recorded attestations in JSON format
End of optional section
-
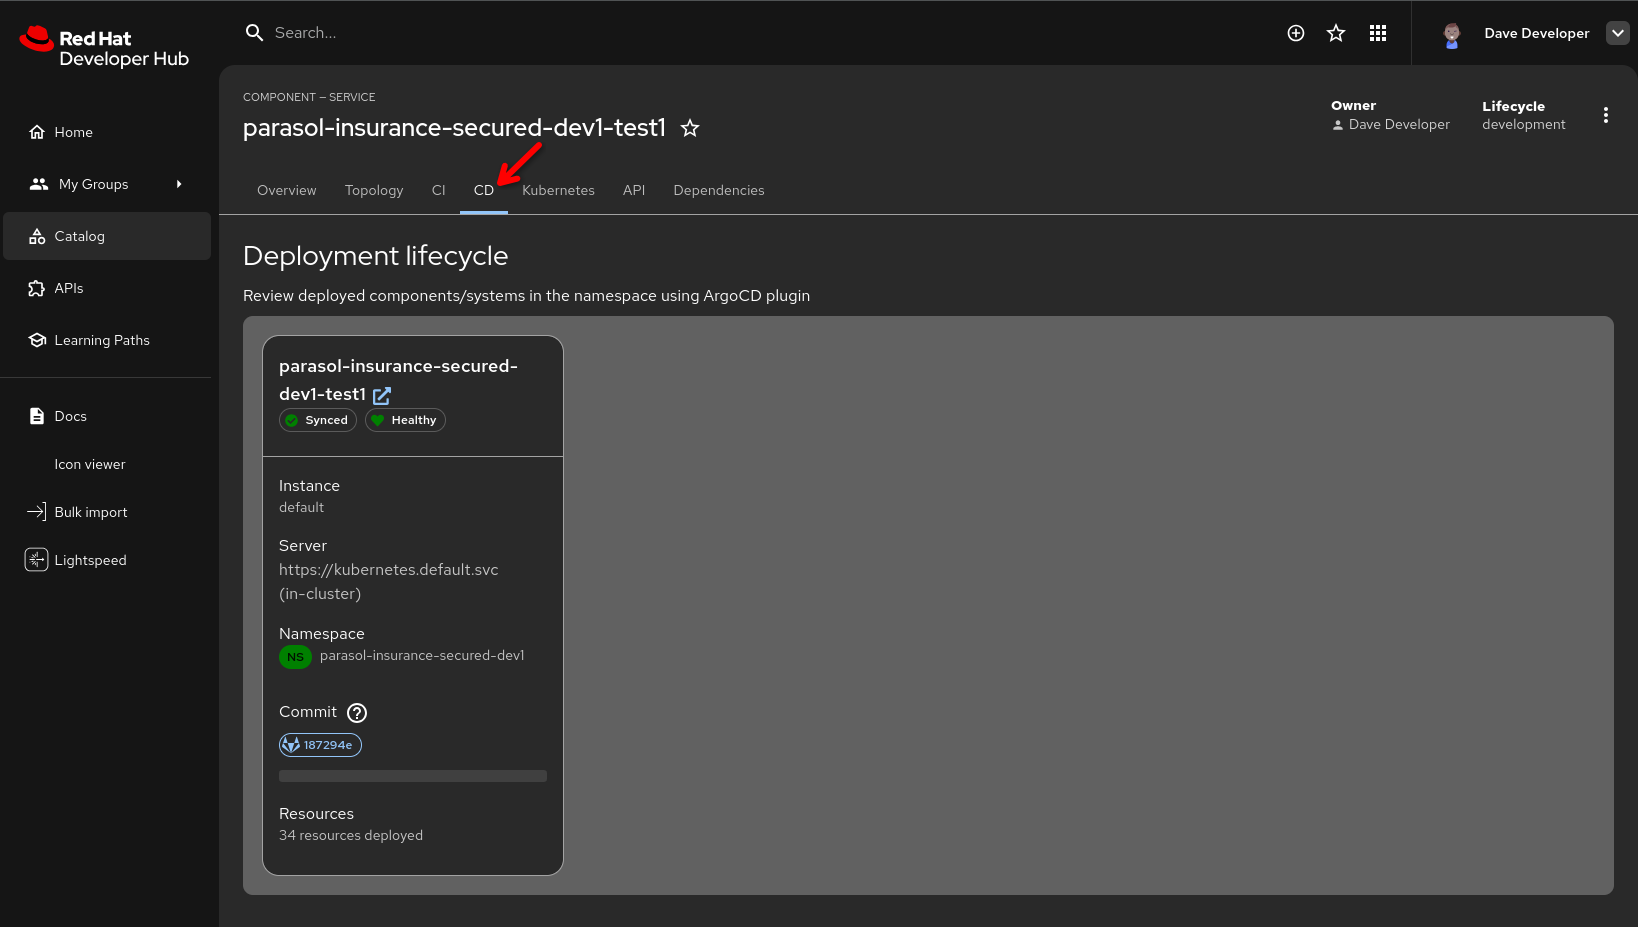
Show the CD tab in Developer Hub (powered by ArgoCD / OpenShift GitOps):
-
Show the development namespace syncing with the new image
-
"The developer can also watch the Argo CD sync right here in Developer Hub. The secure pipeline built and deployed the image to their development namespace, and Argo CD is reconciling the deployment."
-
-
"This is the secure software supply chain in action. Every artifact is scanned, signed, and attested, and the developer witnesses the entire process from a single pane of glass."
| Optional, but if you have time, promote to production using the same process from section 1 as follows: |
-
After verifying the deployment is healthy, open the GitLab parasol/parasol-insurance repository and log in as
dev1/{common_password}:-
Click Merge requests in the side menu, then click New merge request
-
Fill in the merge request details, selecting your new feature branch as the source, and
mainas the target -
"The developer has verified their code works in the development environment. Now they create a merge request for the platform engineer to review."
-
-
Switch to the platform engineer persona (log in as
pe1/{common_password}in GitLab):-
Review and approve the merge request
-
Merge the MR
-
Select Code → Tags in the repository’s side menu and click New tag
-
Create a tag named
1.1-
"The platform engineer reviews the code, approves the merge request, and creates a release tag. This triggers the production pipeline to build and deploy the tagged release, and issue a new MR to the GitOps repo to update production. The platform engineer controls when code is promoted to production by merging and tagging."
-
-
In Developer Hub,
-
navigate to the Catalog
-
then open the "parasol-insurance-secured" component
-
go the the "CI" tab (direct link)
-
-
"The code tag triggered the secure tag promotion pipeline, which builds a new image from the previously merged, now tagged source. This includes all the security guardrails we have seen before (vulnerability scanning & evaluation of security policies, creation of an SBOM, Tekton Chains image signing and attesting the pipeline run).
-
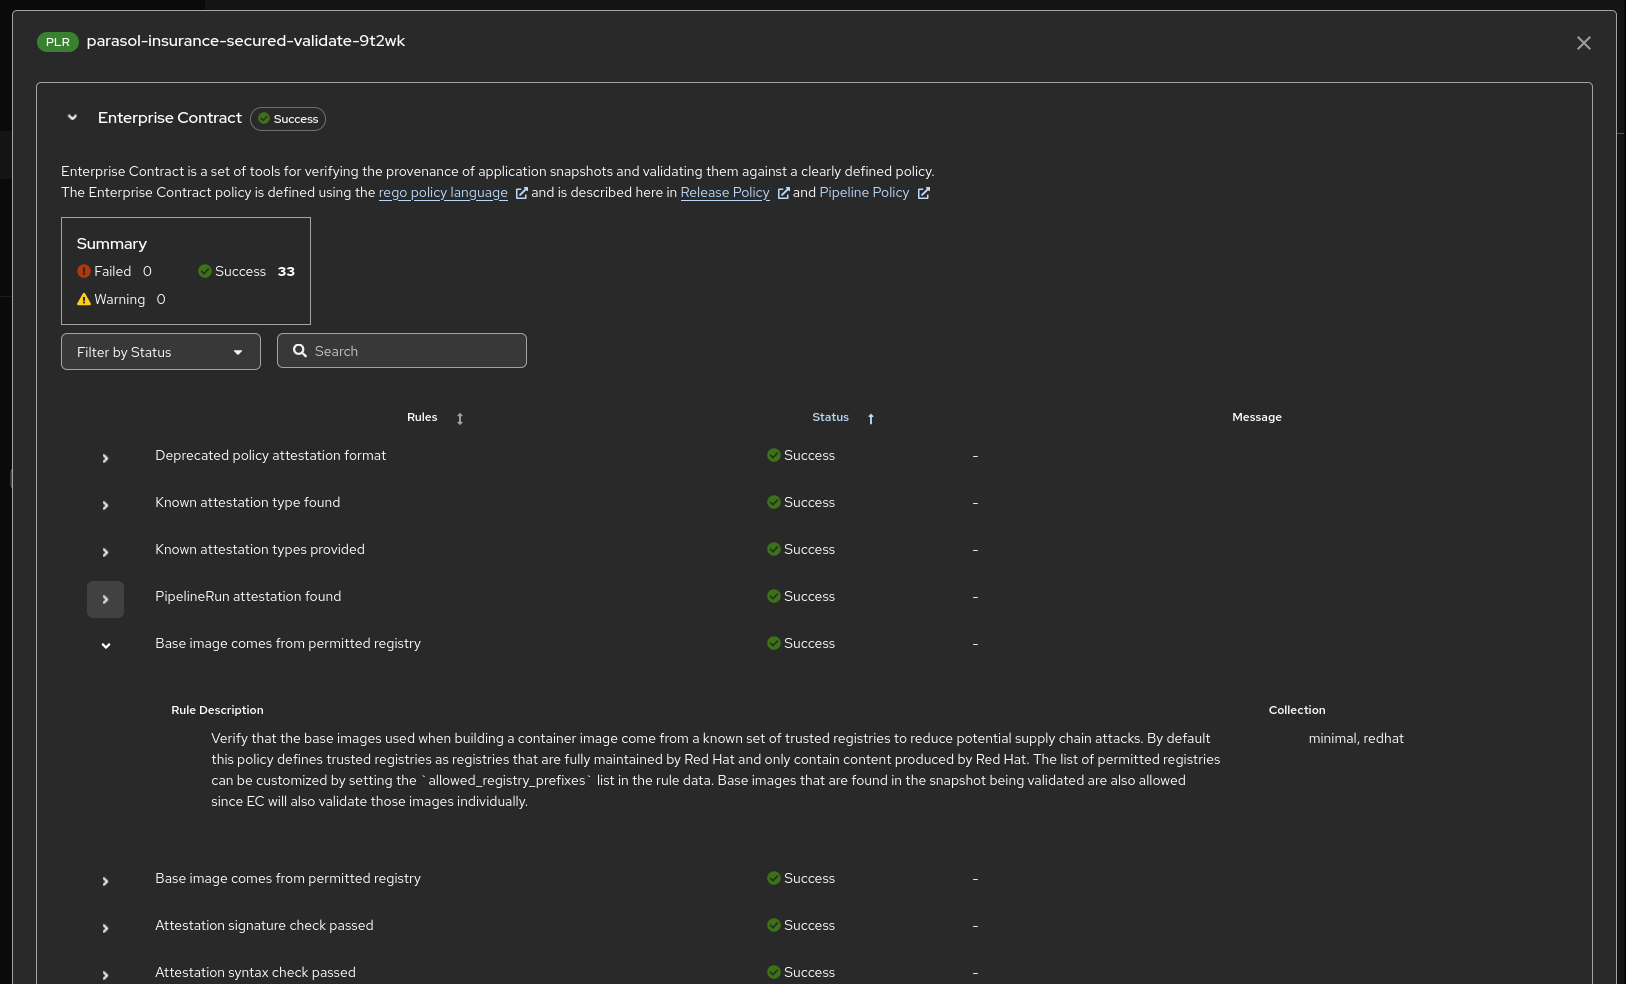
The promotion pipeline triggers a validation pipeline that verifies image signatures and completeness of SLSA attestations - we only want to promote images that have been signed and where we can validate release policies using Conforma "
-
-
"Clicking on the 'View Output' action shows the full Conforma (formerly known as "Enterprise Contract ") report and which rules have been evaluated against the image and its attestations"
-
The final step in the validation pipeline opens a merge request (MR) against the
parasol-insurance-secured-manifestsGitOps repository in GitLab, updating the production image tag to the newly validated and signed image:-
As the platform engineer (
pe1), navigate to the parasol-insurance-secured-manifests merge requests in GitLab -
Review the MR — it updates the production image tag to the new release
-
Approve and merge the MR
-
"By merging this MR, Argo CD detects the change in the GitOps repository and automatically deploys the validated, signed container image to production. The platform engineer controls when production changes happen, while the entire supply chain — from build to signing to policy validation — is fully automated."
-
-
Navigate to the Argo CD console and observe the
parasol-insurance-securedproject syncing the new production deployment:-
"Argo CD picks up the merged change and rolls out the new image to production. The entire journey — from code push to signed, attested, policy-validated production deployment — happened through automated pipelines with human approval only at the merge step."
-
What they should notice:
-
The pipeline ran against the feature branch automatically on push
-
The developer watched both the pipeline and Argo CD sync from Developer Hub — single pane of glass
-
The pipeline includes security scanning (ACS), image signing, SBOM generation, and SLSA attestation
-
The developer created a merge request only after verifying the deployment works
-
The platform engineer reviewed, approved, and created a release tag for production
-
The release tag pipeline also validated image signatures and SLSA compliance
Business value callout:
"Every artifact that comes out of this pipeline has a cryptographic signature proving it is genuine, an SBOM listing every component inside it, and a SLSA attestation proving how it was built. And the developer saw the entire process from Developer Hub without switching between tools. That is what a trusted software supply chain looks like."
If asked:
- Q: "What is SLSA attestation?"
-
A: "SLSA (Supply-chain Levels for Software Artifacts) is a framework for ensuring software supply chain integrity. The attestation proves how the artifact was built: which source code, which build system, which steps, which sources, which parameters."
- Q: "Which SLSA policies are enforced?"
-
A: "Red Hat provides a large set of policies and rules to validate image attributes and attestation content. These can be used as-is or can be tailored based on requirements. Custom rules and policies can easily be defined, for example to verify if a specific task with specific inputs and outputs has been run during the artifact production. (e.g. was the release tag created by an allowed person, does the release pipeline include a scan task and what results did it generate, etc.)"
- Q: "Can we customize which policies ACS enforces?"
-
A: "Yes. ACS policies are fully configurable by the platform team. They can set thresholds for vulnerability severity, block specific CVEs, enforce base image requirements, and more."
- Q: "Why create the merge request separately instead of the pipeline doing it?"
-
A: "The developer verifies their work in the development environment before requesting a merge. This is an intentional workflow: the developer confirms the feature works, then requests review. The platform engineer controls when code is promoted to production by merging and creating a release tag."
Module 5 summary
What we demonstrated
In this module, you saw how the secure development workflow protects the software supply chain:
-
Dependency Analytics — Real-time dependency scanning directly in the developer’s IDE, identifying an unnecessary and incompatible dependency before committing
-
Secure build pipeline — ACS scanning, image signing, SBOM generation, and SLSA attestation integrated into a single automated pipeline, triggered by a push to the feature branch, with the developer watching from Developer Hub
-
Merge request and release — The developer creates a merge request after verifying the deployment, the platform engineer reviews, approves, and creates a release tag for production
Setting up Module 6
The secure build pipeline has produced a signed image with full attestation, ready to be promoted to production. In Module 6, we will see how SBOMs are managed through the Trusted Profile Analyzer and how the application topology provides visibility into the complete system.
Presenter transition
|
Presenter tip: The transition to Module 6 should emphasize the trust chain: "We have built a signed, attested artifact with a complete SBOM. The platform engineer approved the merge request and created a release. Now let’s see how the organization manages the SBOM data for compliance and how the complete system looks in production." |