Agentic System Observability
|
In this module
Learn a practical, high-level flow to combine agent evaluation with observability so you can measure, understand, and improve behavior over time. |
In the context of production Generative AI systems, observability is your ability to understand what’s happening inside your AI applications by examining the data it produces.
Without the necessary observability tooling, you only know something is wrong when it breaks or someone complains. With proper observability, you can spot problems before they impact your users and you’re able to fix issues quickly.
Easy, right?
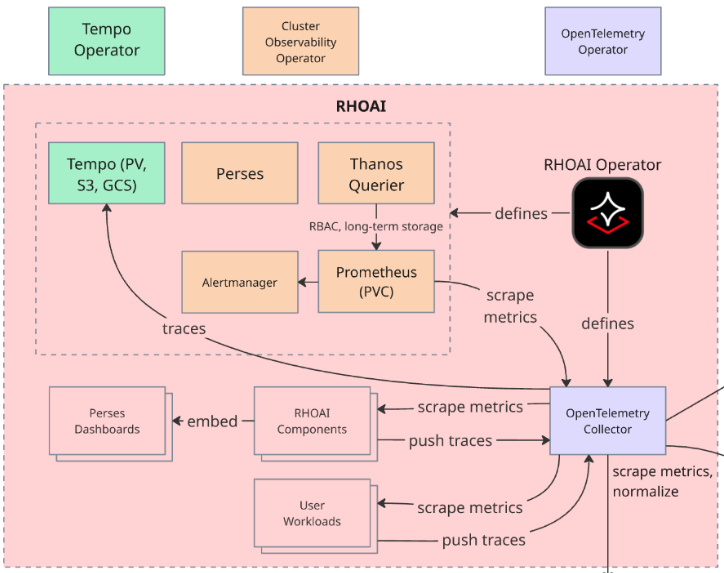
Red Hat AI Observability Stack
Red Hat AI provides centralized platform observability: an integrated, out-of-the-box solution for monitoring the health and performance of your Red Hat AI instance and user workloads.
This centralized solution includes a dedicated, pre-configured observability stack, featuring the OpenTelemetry Collector (OTC) for standardized data ingestion, Prometheus for metrics, and the Red Hat build of Tempo for distributed tracing. This architecture enables a common set of health metrics and alerts for OpenShift AI components and offers mechanisms to integrate with your existing external observability tools.
OpenTelemetry: The Open-Source Standard for Observability
Red Hat OpenShift AI uses OpenTelemetry (OTel), the open-source standard for distributed tracing and metrics collection. OpenTelemetry provides:
-
Automatic instrumentation for common frameworks (Flask, FastAPI, Express, etc.)
-
Manual instrumentation for custom operations specific to your application
-
Vendor-neutral format that works with any tracing backend
-
Integration with metrics and logs for complete observability
OpenTelemetry and Llama Stack
Llama Stack has built-in OpenTelemetry support through its meta-reference telemetry provider, which automatically instruments inference operations to generate observability data including traces and metrics.
How Llama Stack Telemetry Works:
When telemetry is enabled, Llama Stack automatically creates spans for each inference request and emits token usage metrics. Each request generates:
-
Traces: Distributed traces showing the inference request flow with timing data
-
Metrics: Token counters (llama_stack_prompt_tokens_total, llama_stack_completion_tokens_total, llama_stack_tokens_total) labeled by model_id and provider_id
The telemetry configuration in Llama Stack includes the following variables:
- name: TELEMETRY_SINKS
  value: 'console, sqlite, otel_trace, otel_metric'
- name: OTEL_EXPORTER_OTLP_ENDPOINT
  value: 'http://otel-collector-collector.observability-hub.svc.cluster.local:4318'
- name: OTEL_SERVICE_NAME
  alue: user2-llamastack
These environment variables configure Llama Stack to:
-
Export telemetry data to the RHOAI OpenTelemetry Collector via OTLP (port 4318)
-
Enable both trace and metric sinks for comprehensive observability
-
Tag all telemetry with the service name for filtering in Tempo and Prometheus
Add observability to the Llama Stack ConfigMap
-
Edit the Llama Stack ConfigMap to add telemetry stanza with the service name, sinks and the OTEL Tracing endpoint which is set as an environment variable on the Deployment:
apis:
...
- telemetry

providers:
...
  telemetry:
  - provider_id: meta-reference
    provider_type: inline::meta-reference
    config:
      service_name: "${env.OTEL_SERVICE_NAME:=}"
      sinks: ${env.TELEMETRY_SINKS:=console}
      otel_exporter_otlp_endpoint: ${env.OTEL_EXPORTER_OTLP_ENDPOINT:=}
      sqlite_db_path: /opt/app-root/src/.llama/distributions/rh/trace_store.db
We will focus on distributed tracing for our Llama Stack telemetry configuration. We are not hosting the model ourselves, so we will not visualize those metrics, however that could be a natural extension of our workshop if you run through these steps with your own model deployment.
-
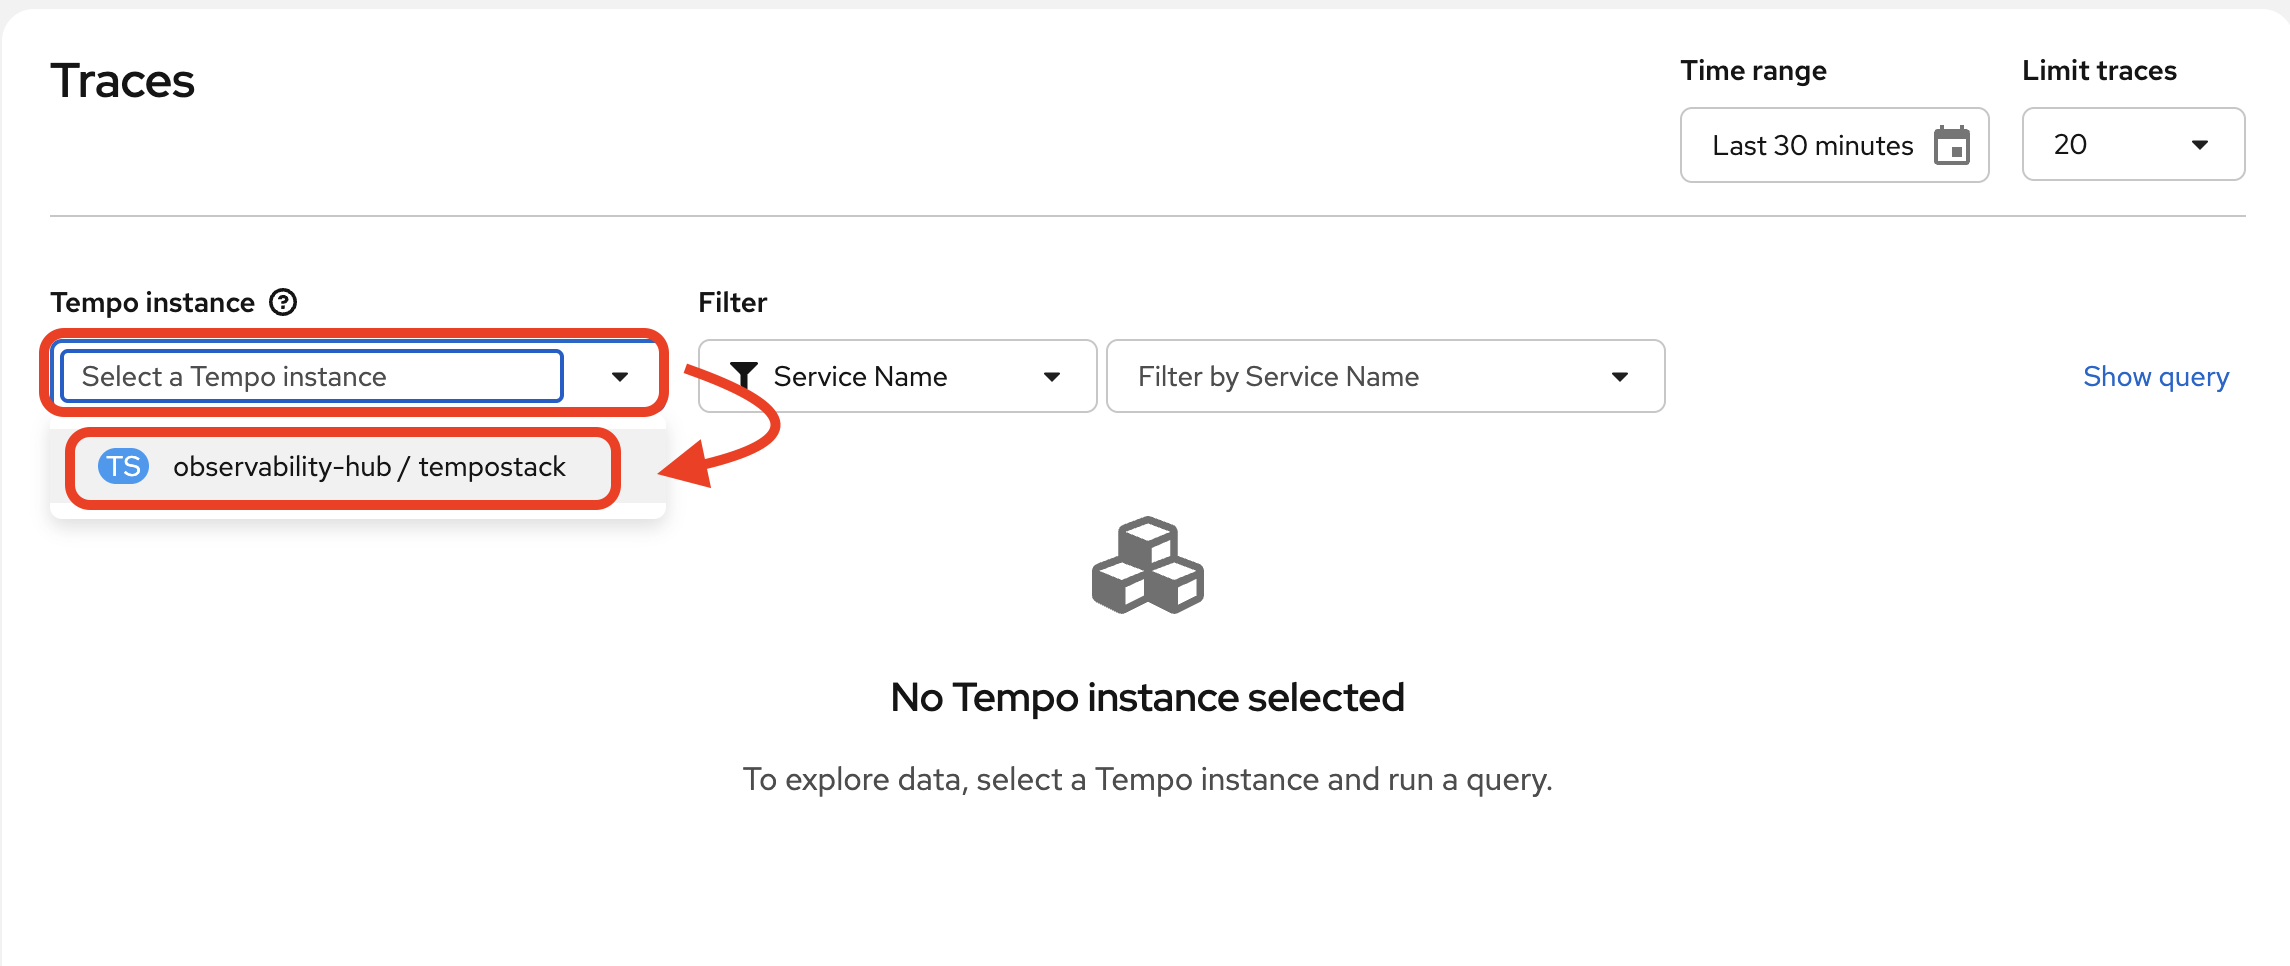
Navigate to
Observe→Tracesin the OpenShift web console navigation bar: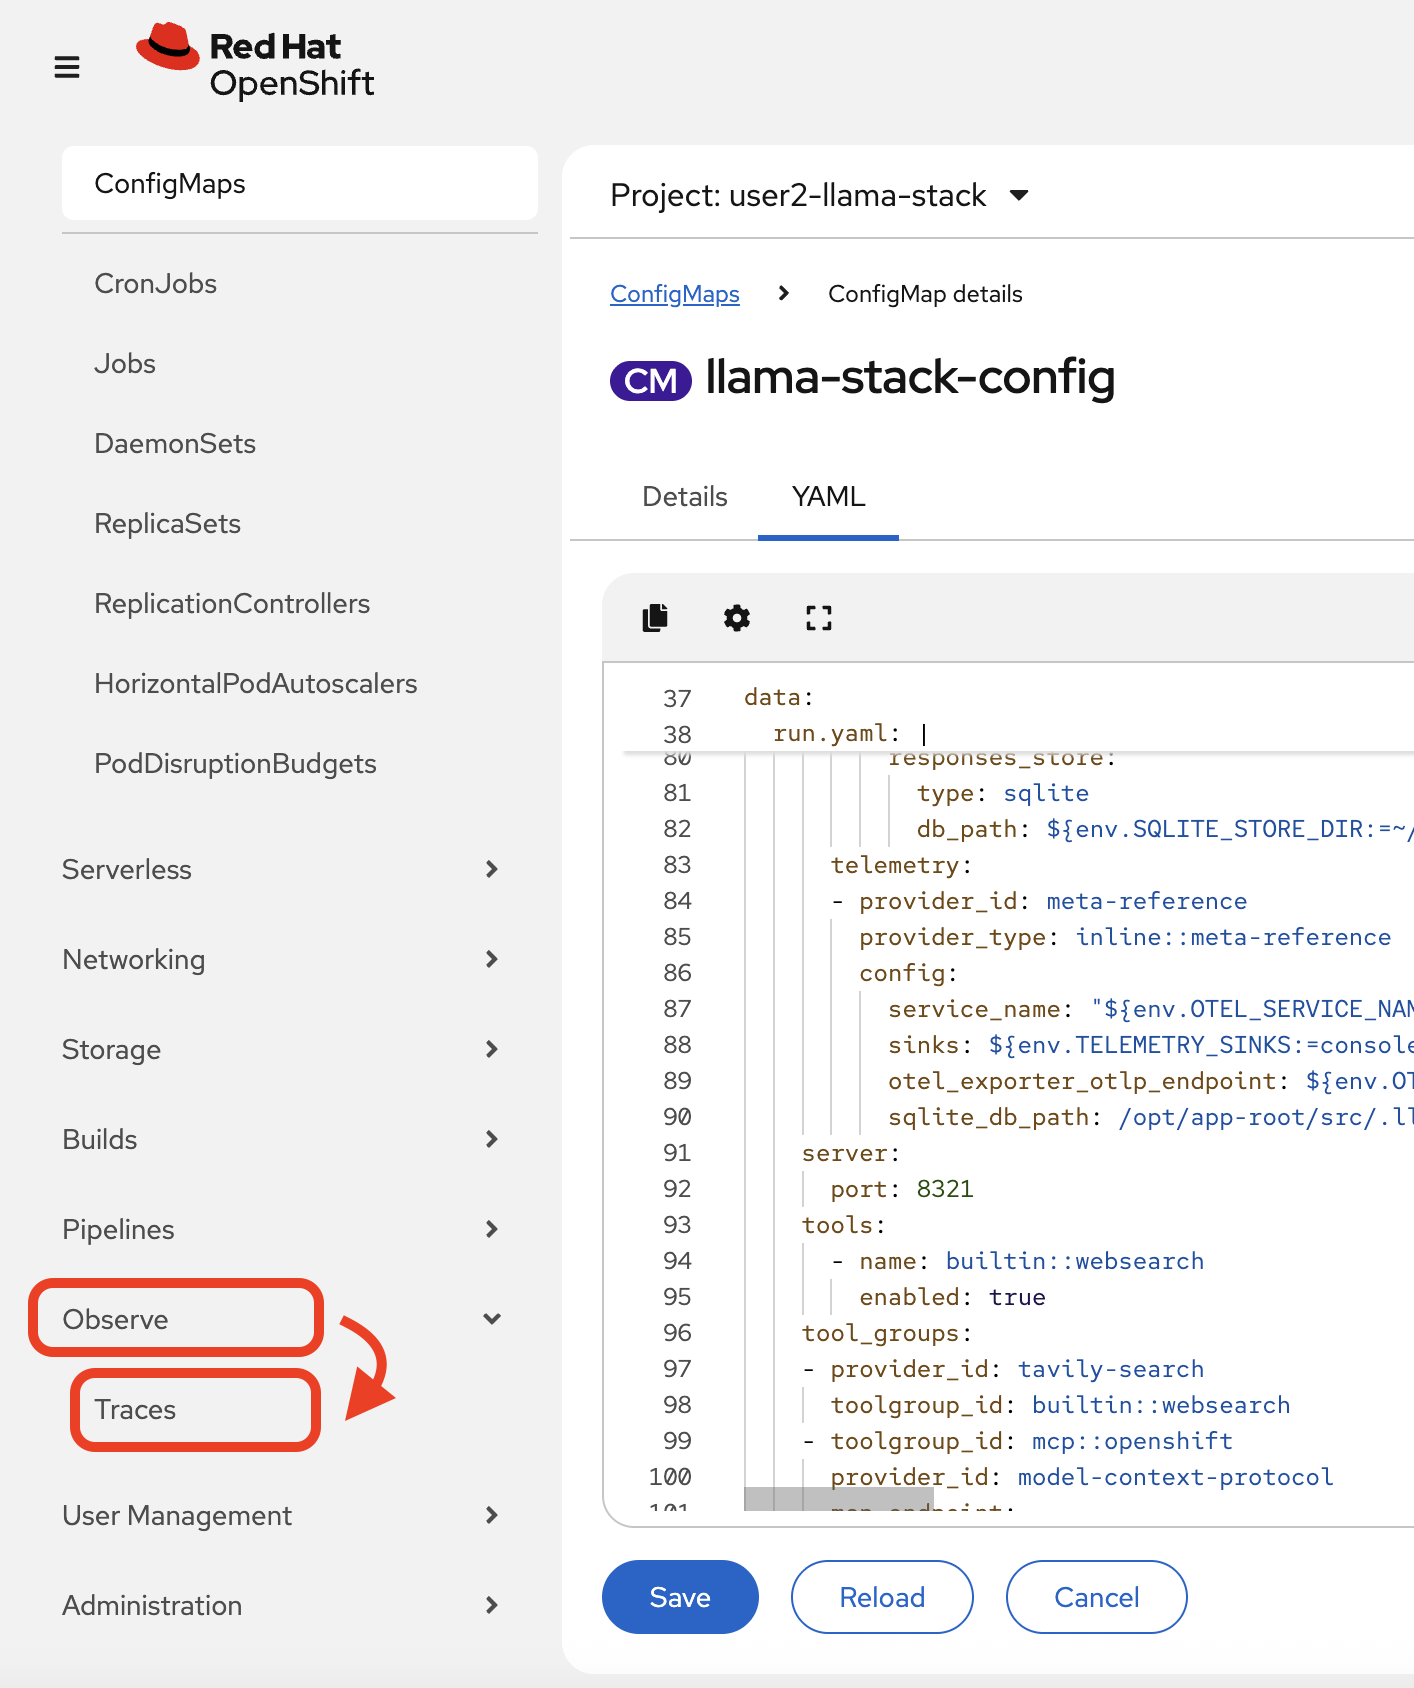
-
In the Tempo UI plugin, select the tempo instance from the drop-down:
Understanding Distributed Tracing
How do you know where time is spent? Which service is the bottleneck? Where errors actually originate? Distributed tracing answers these questions by connecting the dots across your entire system, showing you the complete journey of each request.
Imagine following a student through their day on campus - from the library to the lab to office hours. You’d see where they spend the most time, where they get stuck, and what path they take. Distributed tracing does this for requests traveling across our Llama Stack framework between the different endpoints.
Each service instruments its code to emit spans - records of work done. These spans include:
-
Operation name: What work was performed (e.g., “RAG query”, “LLM inference”)
-
Duration: How long it took (critical for finding bottlenecks)
-
Parent span: What triggered this operation (builds the request tree)
-
Attributes: Metadata like user ID, query text, documents retrieved, tokens generated
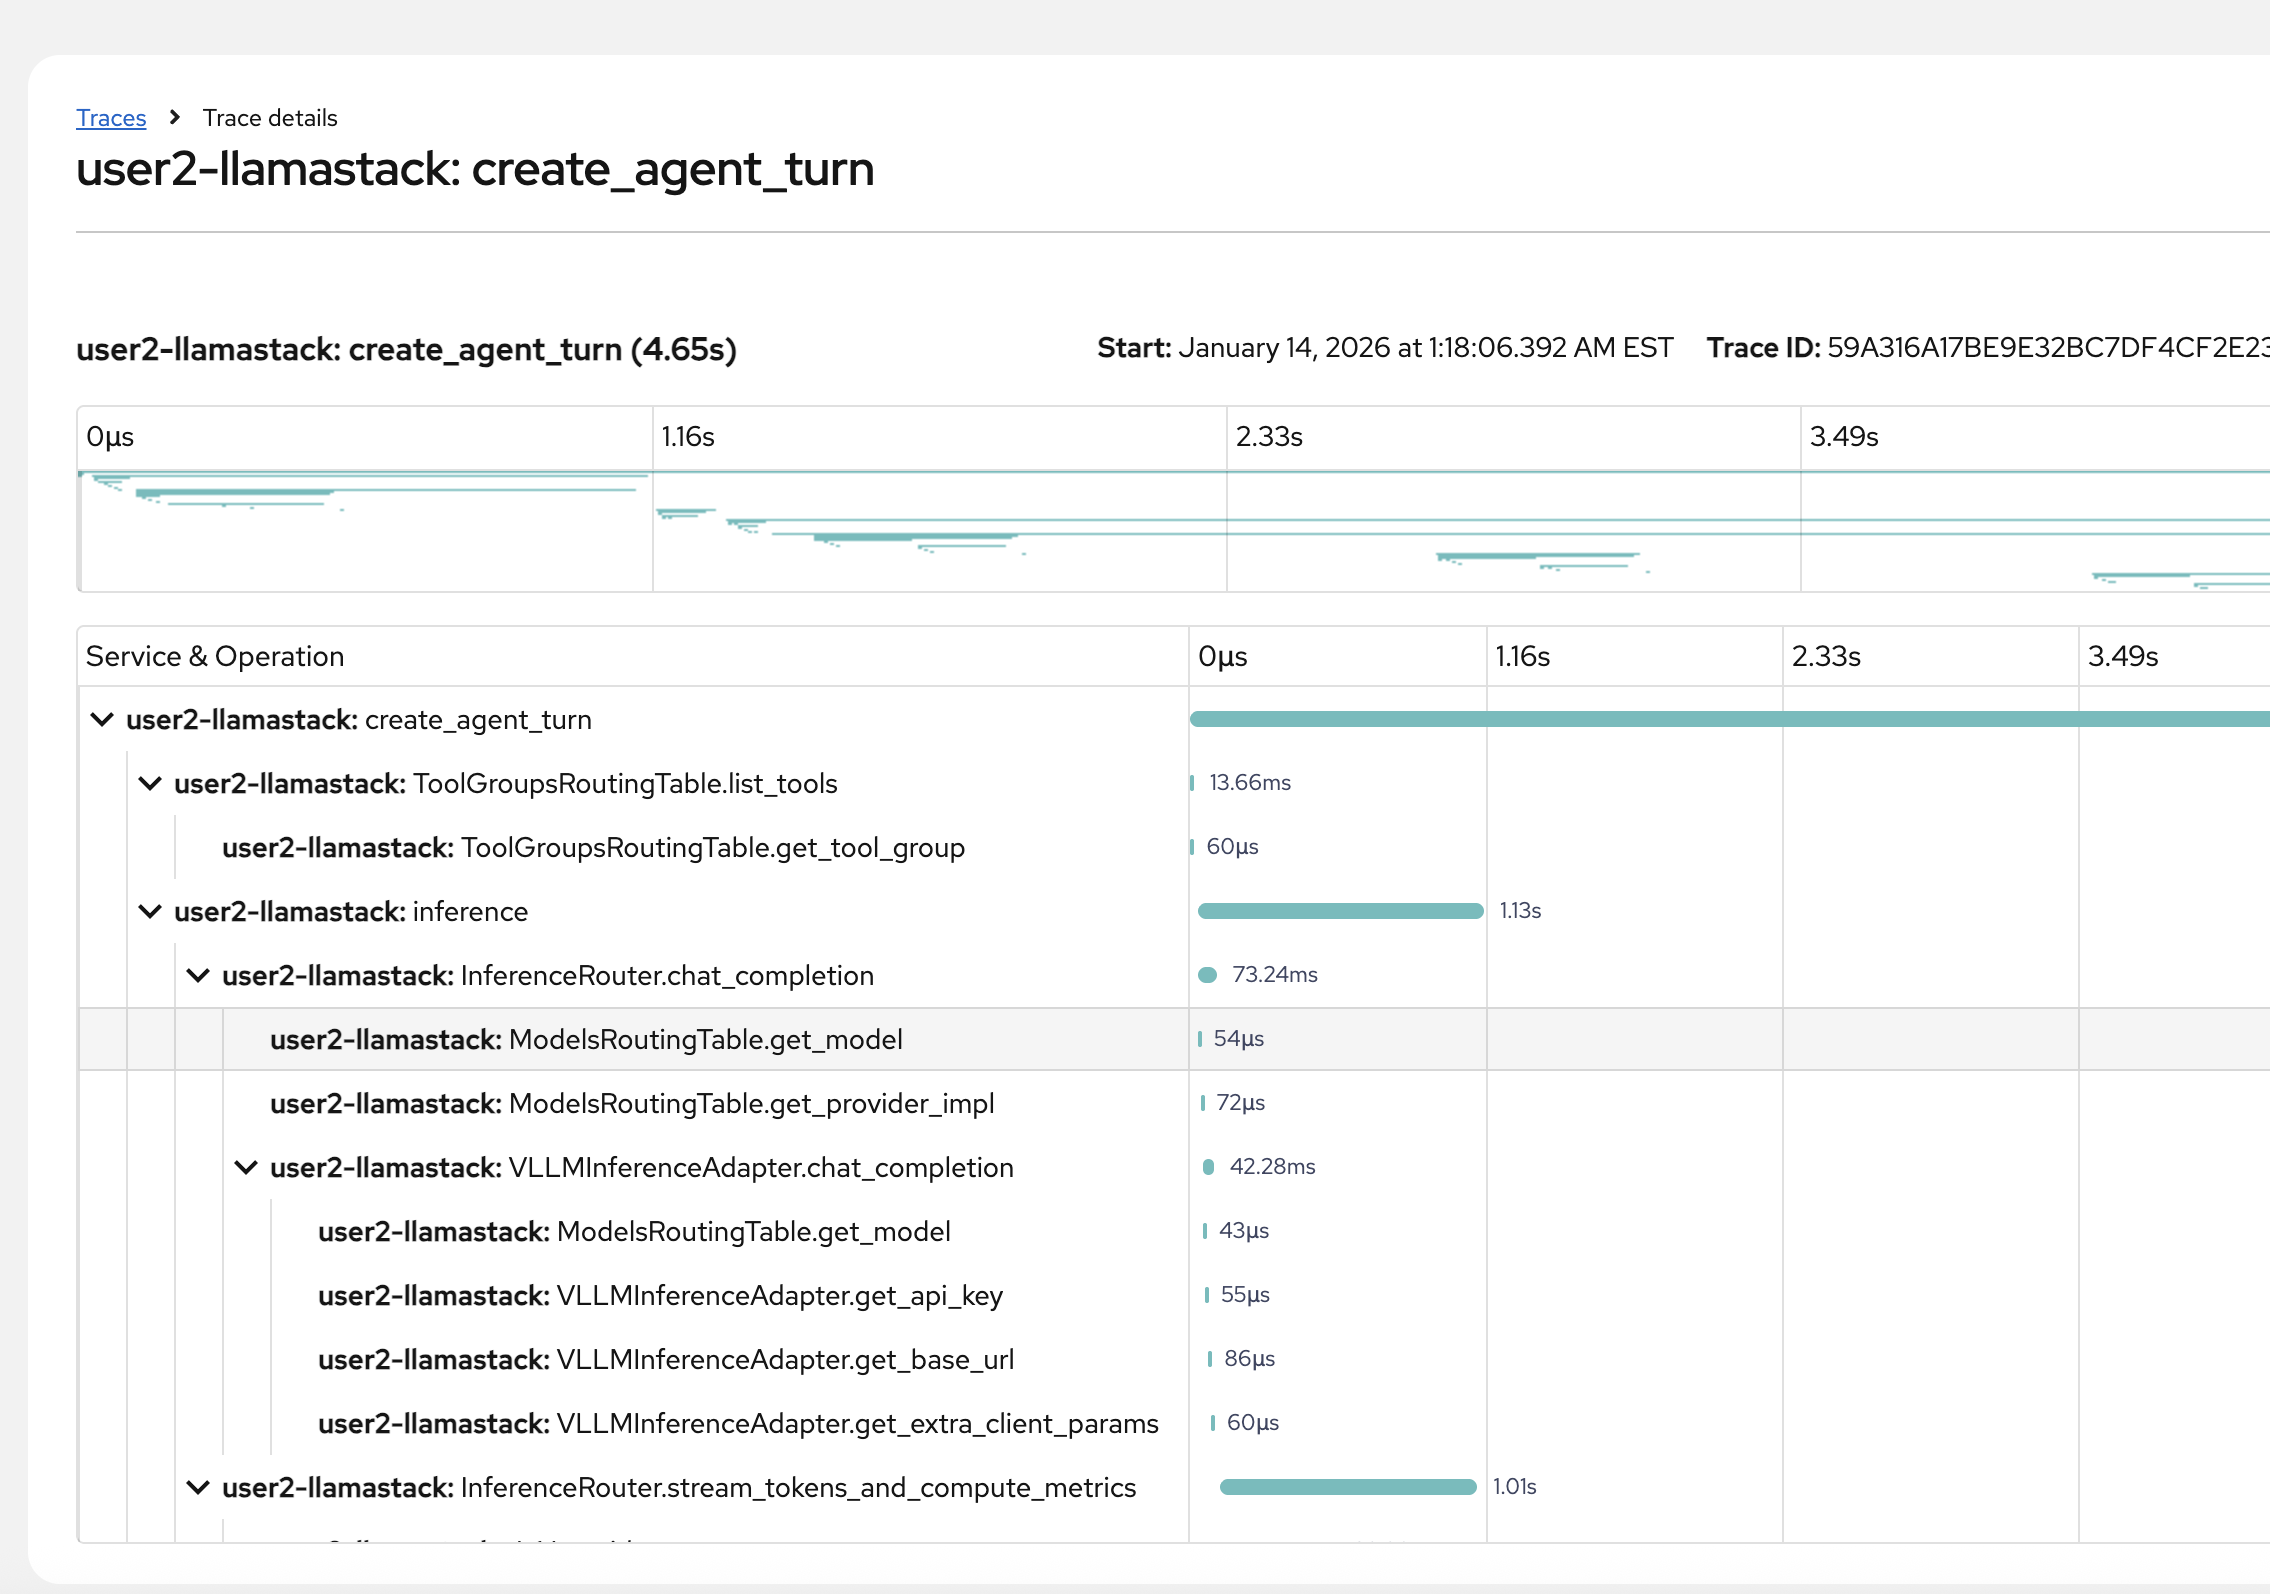
When spans are connected by parent-child relationships, they form a trace - the complete story of our agent’s actions, or simply our engagement with the Llama Stack playground.
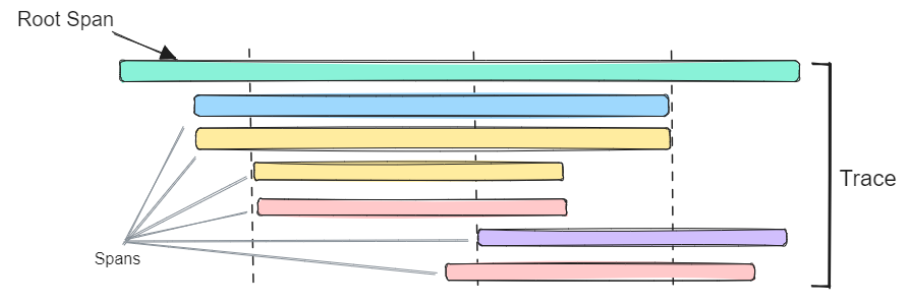
In this trace visualization, you can see the waterfall view showing:
-
Total request time and each service’s contribution
-
Which operations run sequentially vs. in parallel
-
Where the most time is spent (the longest bars)
-
Parent-child relationships (the tree structure)
Generate new trace data
-
Refresh the playground in the browser. Select Agent-based, and one or multiple available tools.
-
Complete a couple of agentic chat interactions of your choice, something that triggers tool calls.
-
You may complete a few regular direct chat interactions as well.
You may also choose to rerun the demo pipeline that triggers your agent. Since we had not yet enabled telemetry, the trace from our previous pipelinerun won’t be available. -
It takes a few minutes for the traces to populate the Tempo UI plugin, so take your time in the playground or take a quick break.
Filter and view trace data
-
Navigate back to the traces dashboard.
-
We have constant traces generated from Llama Stack that are very basic health / readiness probes. You will see these span names as
/v1/providersand/v1/version. This is fine to keep our app consistently up and running properly, but during debugging it can be considered a wee bit of "trace spam".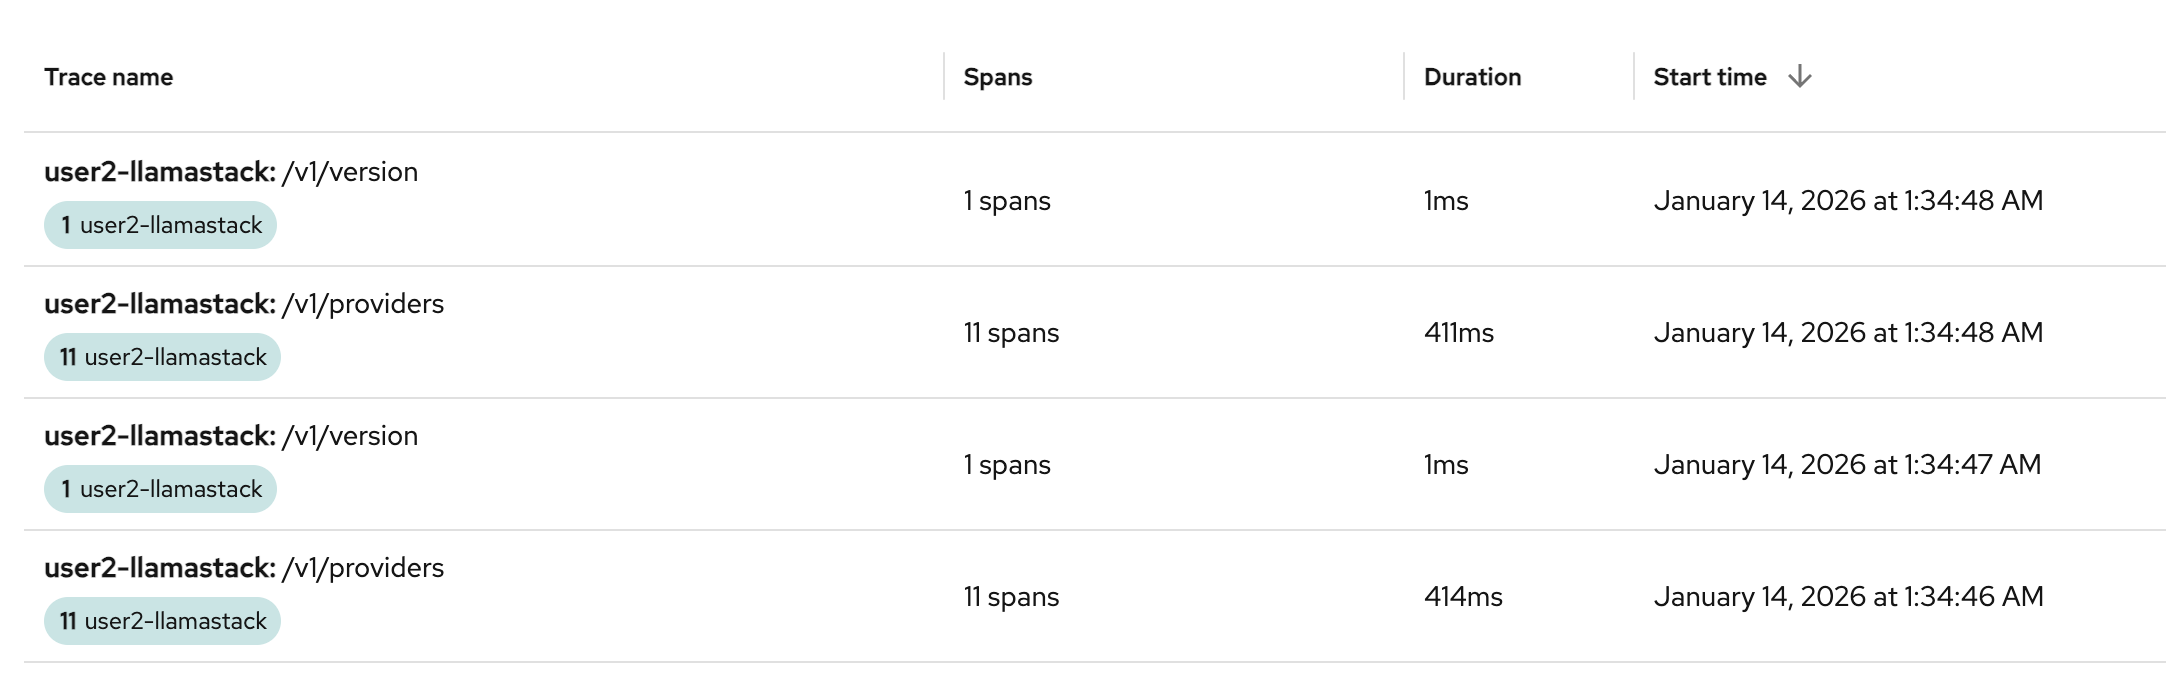
-
Let’s filter these out with a TraceQL query. Click on
Show Query: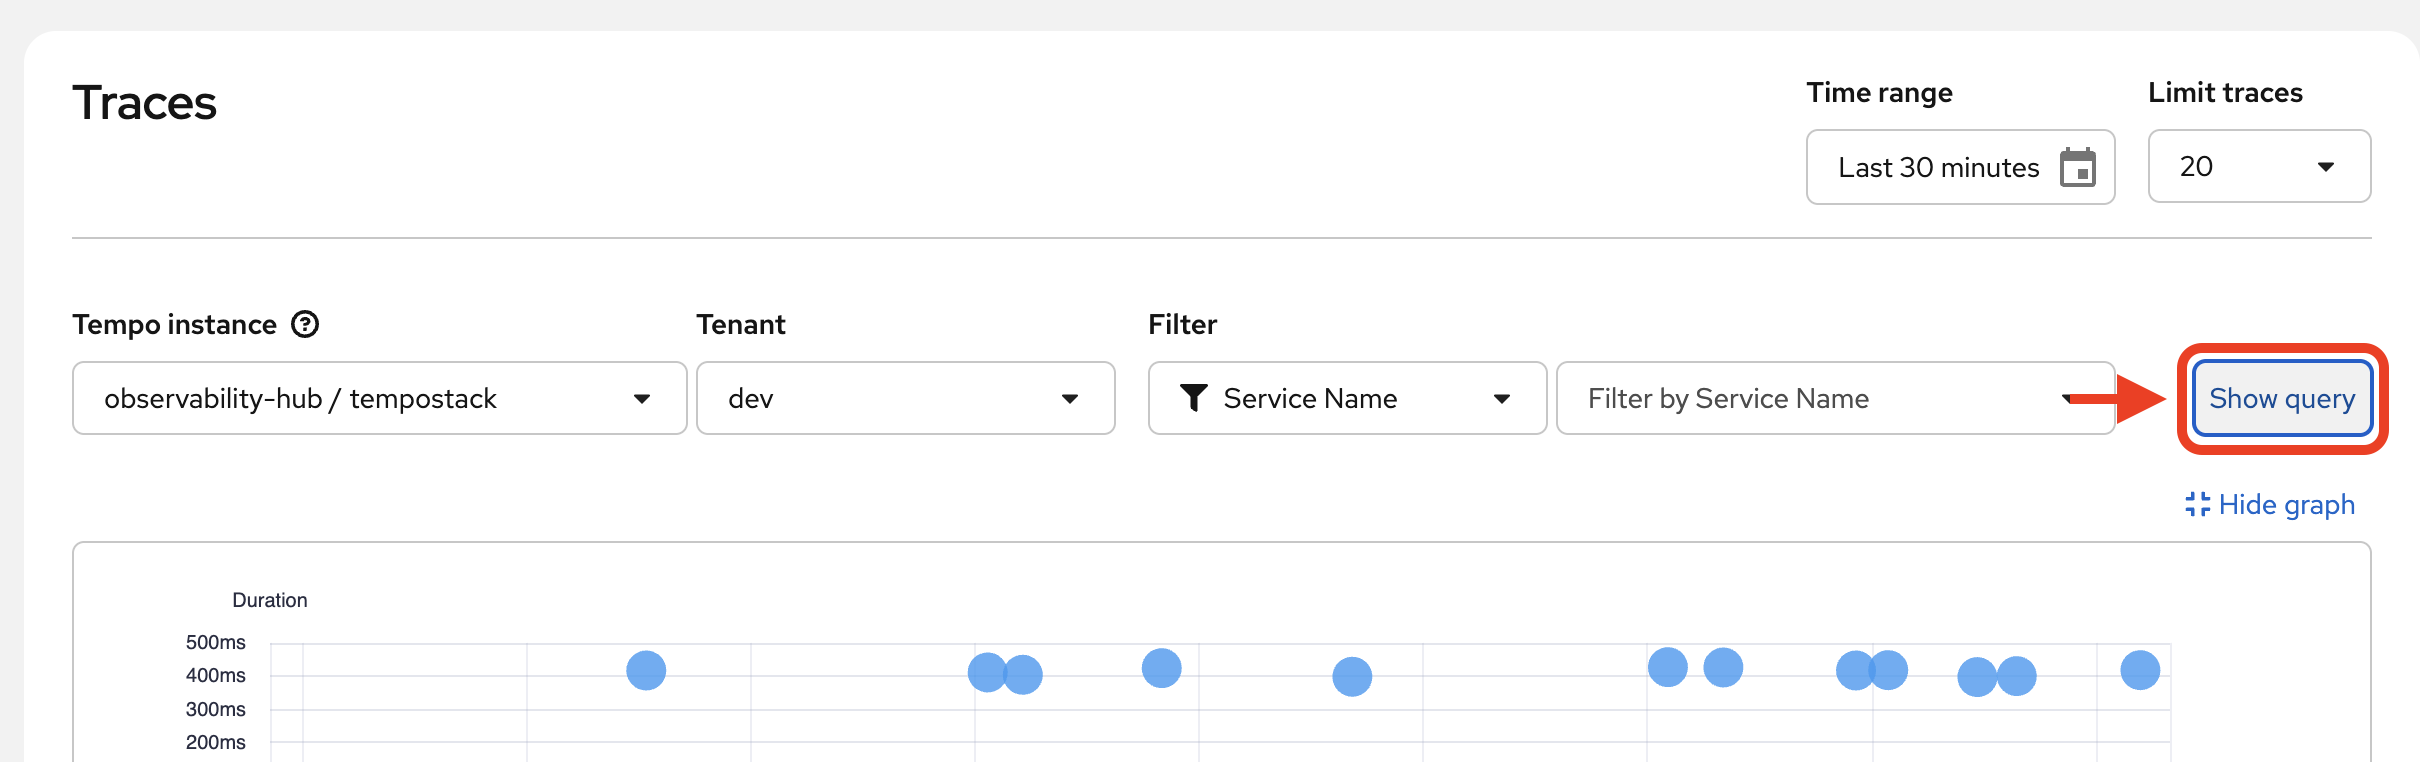
-
Paste the following query into the
Querytext box:{ span.raw_path!="/v1/providers" && span.raw_path!="/v1/version"} -
Click
Run Query: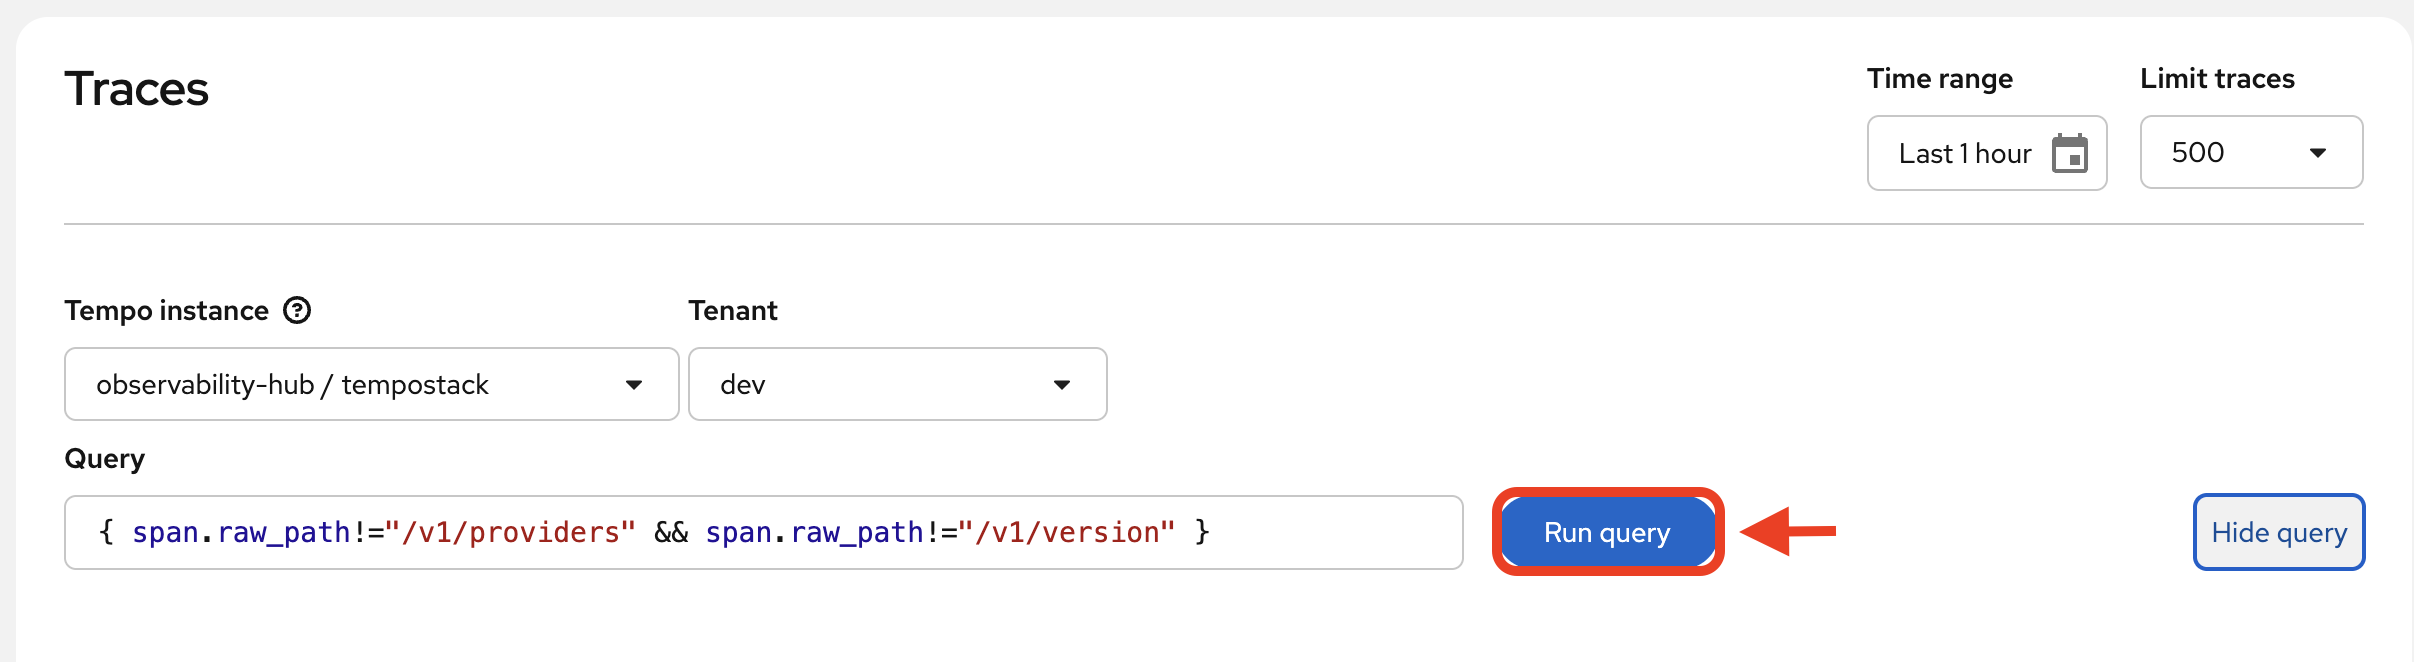
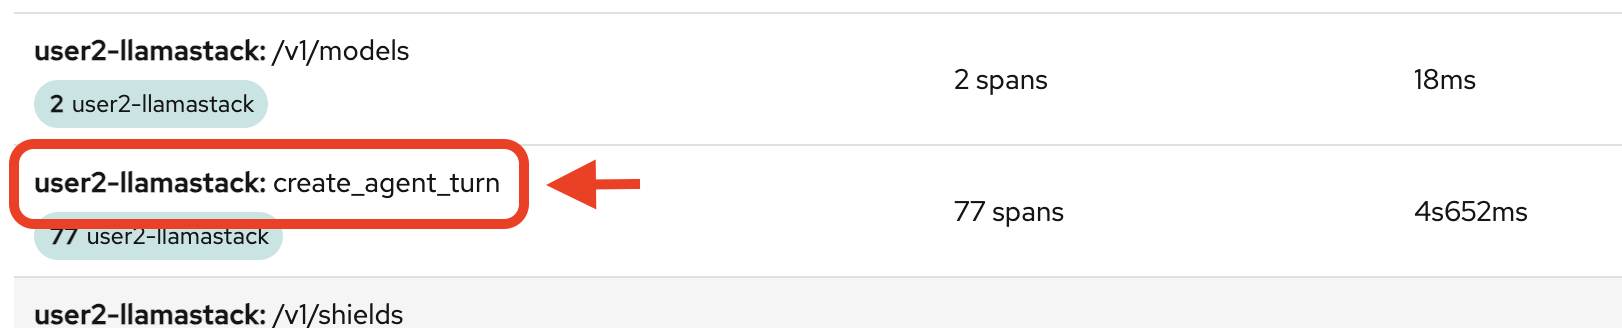
-
You’ll see a shorter list now, and more related to the tasks you’ve actively done in the above steps. You’ll want to click on one of the following trace names to see the bulk of the action (you can tell also by the number of spans involved):
-
create_agent_turn
-
/v1/inference/chat-completions
-
-
Look through as many as you’d like. Then, click on one of the create_agent_turn traces to dig in a little deeper.
-
View the complete trace
-
View the span metadata by clicking on any span:
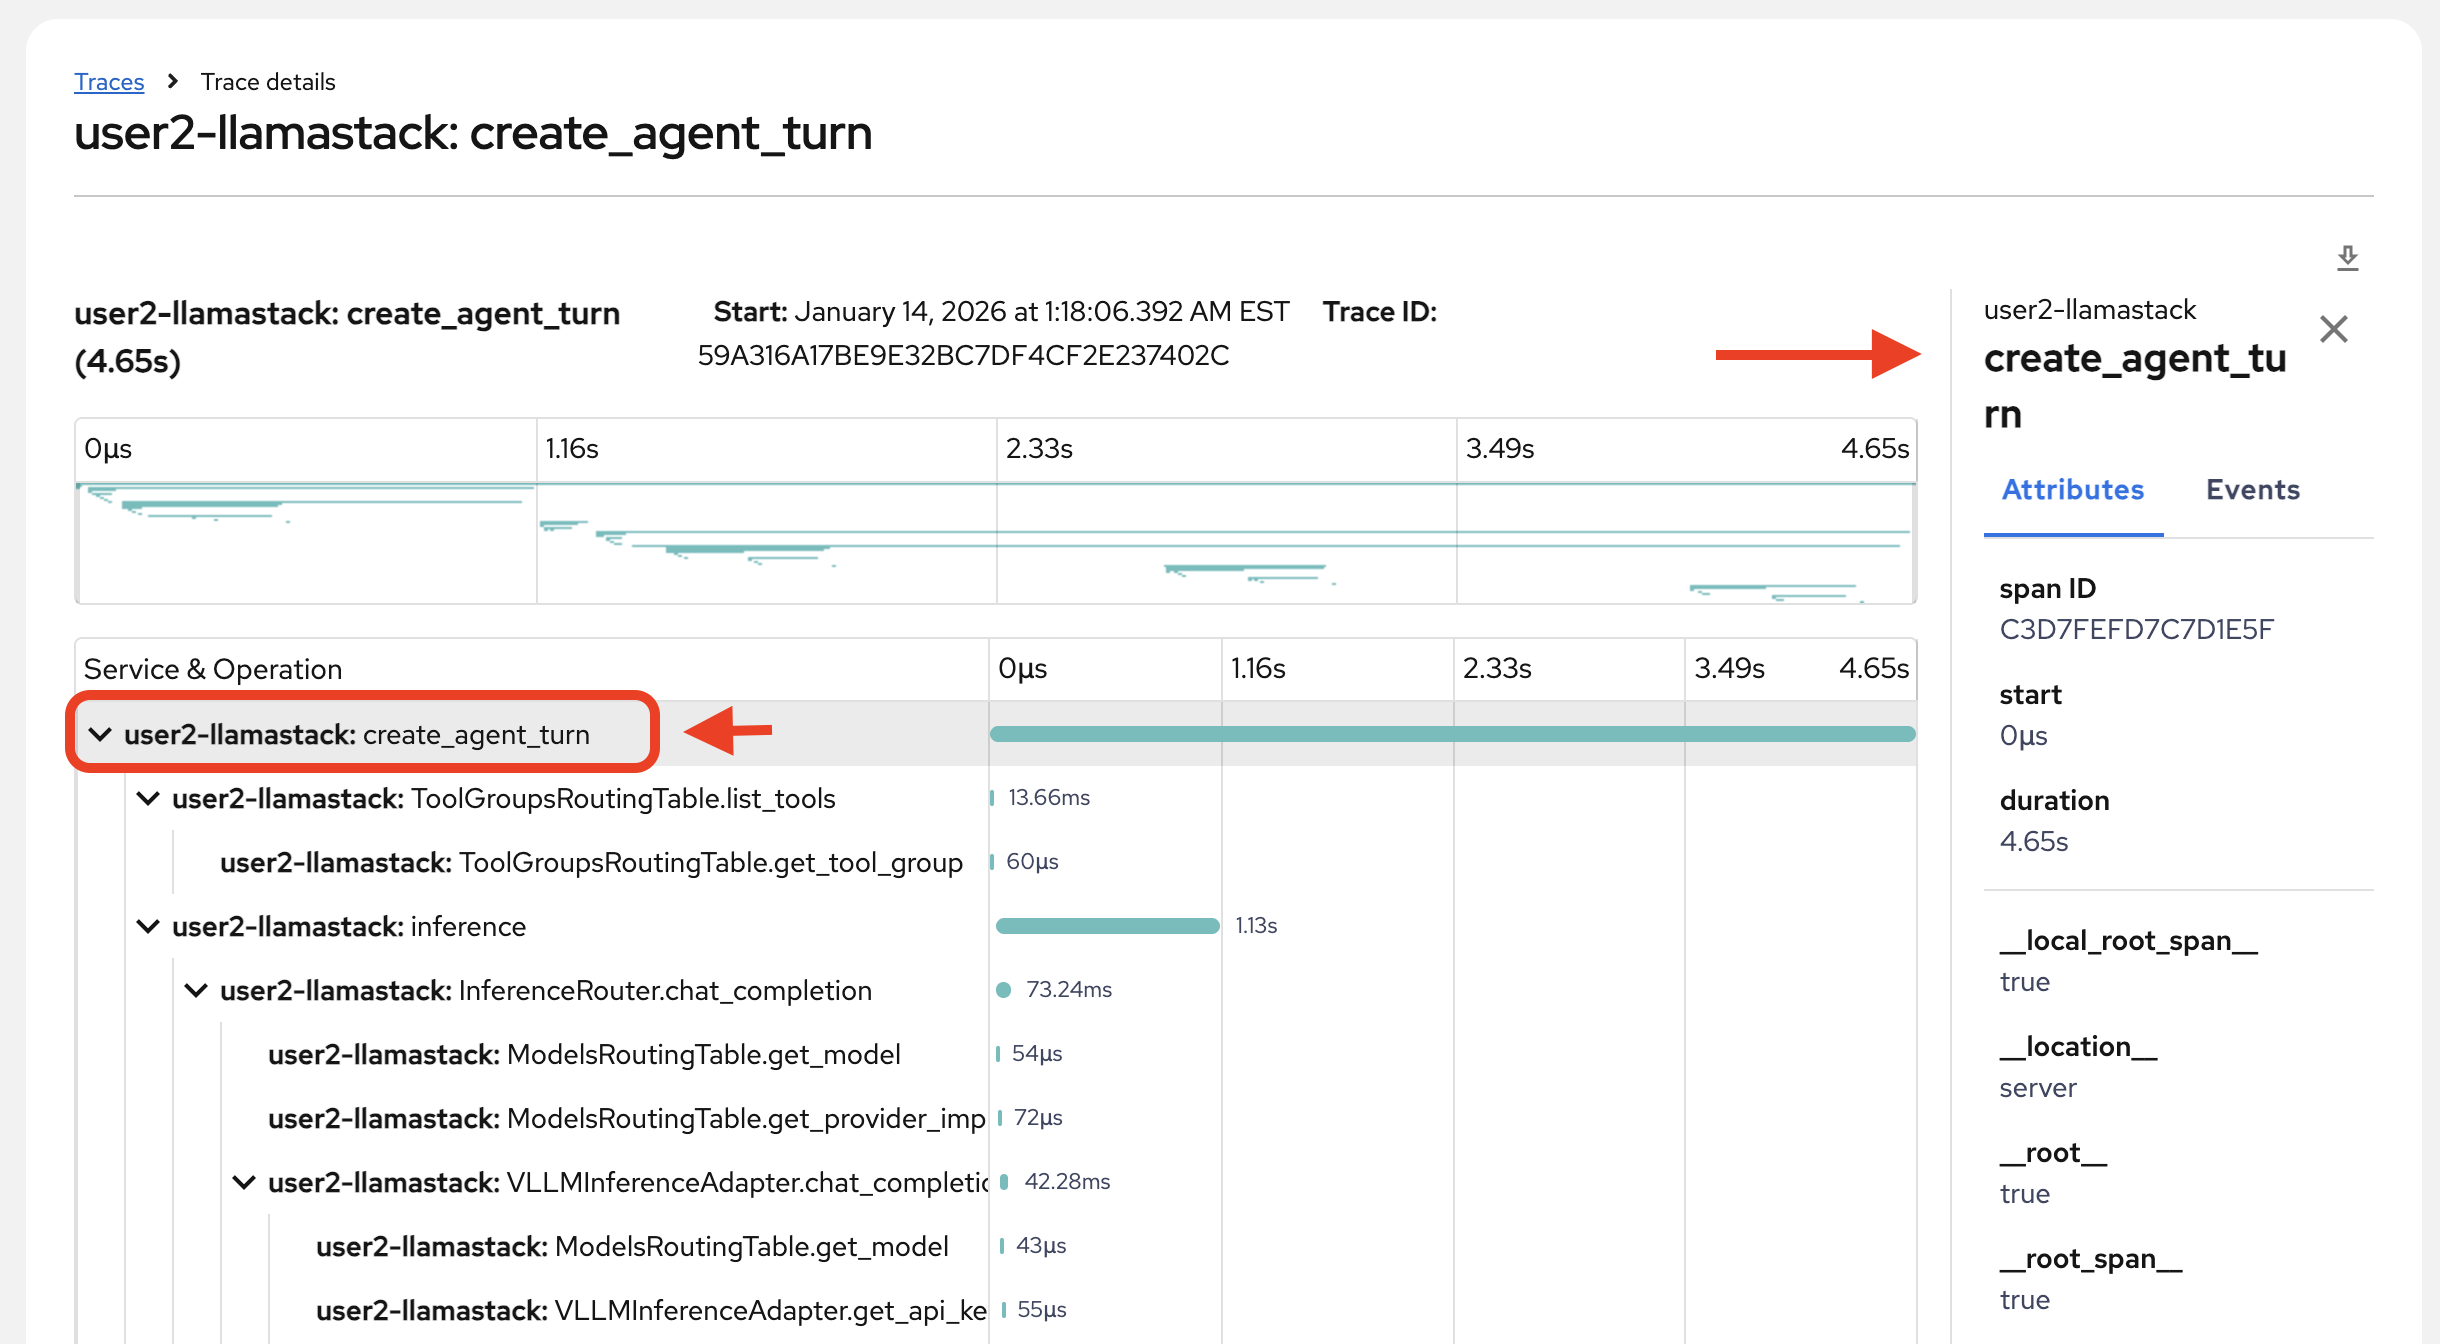
-
Review the primary data within this trace details page:
-
The individual spans and their names
-
Individual span time
-
Overall trace time
-
Metadata for each span
-
Relationships between spans (what is triggered by something, what ran concurrently)
-
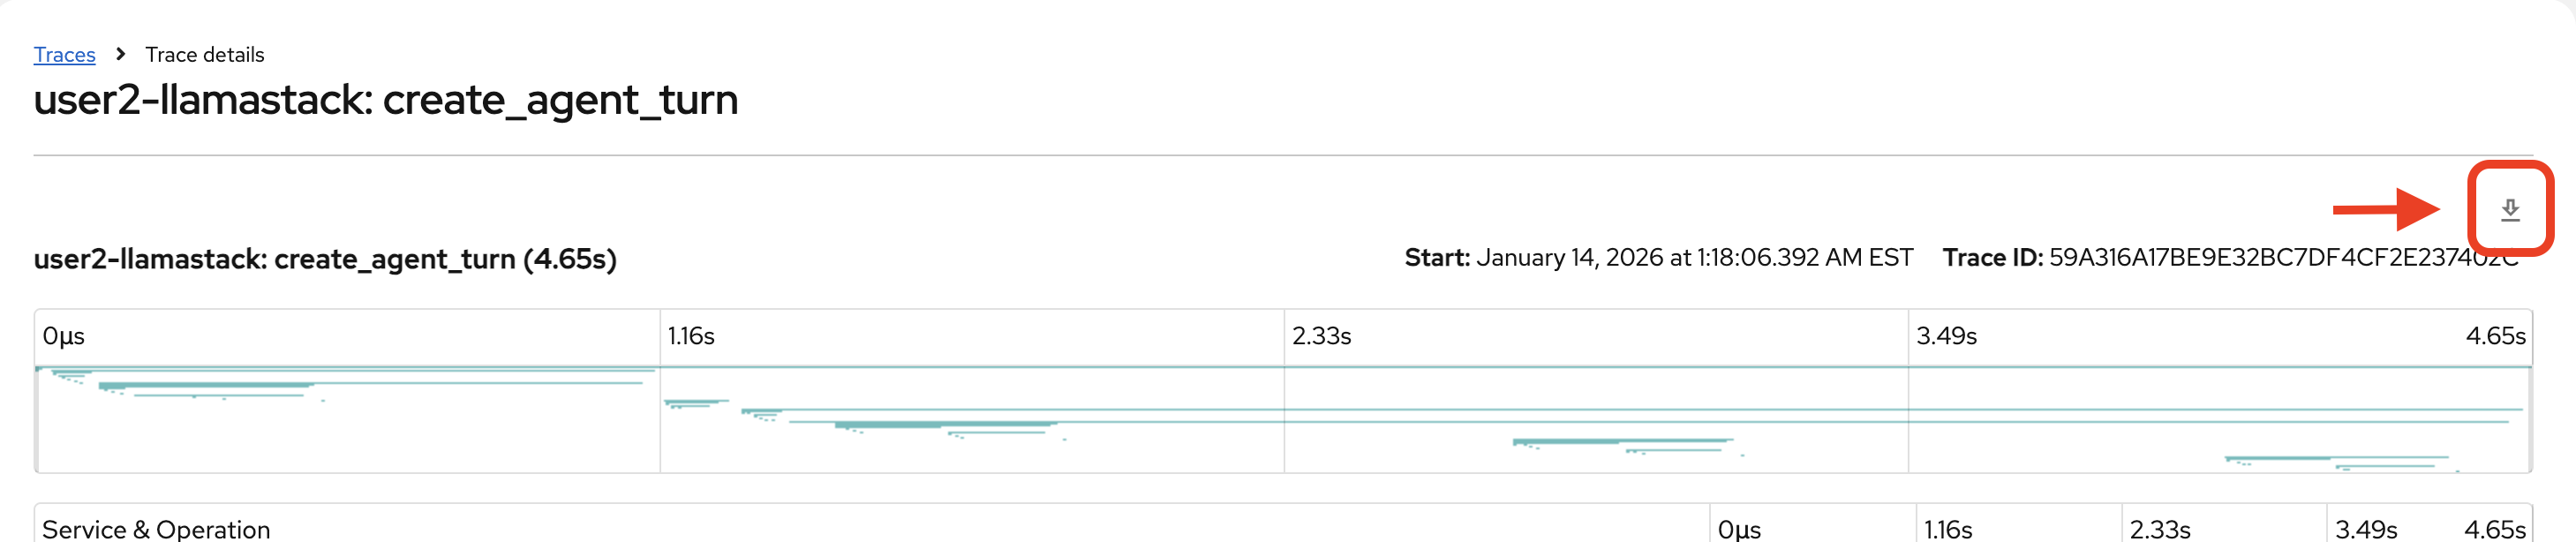
Download the trace details in a .json file to more easily search through the data.
|
Investigate trace
Armed with trace data, ask the following questions:
-
What was your intent in this agent turn, and did the agent interpret it correctly?
-
Look at your user message in the agent turn request. Did the agent choose the correct toolgroup and tool for your intent?
-
-
Which step took the longest: tool selection inference, tool execution, or final response inference?
-
Compare the durations of the inference spans vs the tool_execution span.
-
-
What dominates overall time: tools, inference, or overhead?
-
Can anything be streamlined?
-
-
Is the slowest step variable across traces or consistently the same component?
-
Is latency primarily due to remote inference over network, or due to the model itself?
-
Look for any evidence: short tool execution but long inference; any signs of retries/timeouts.
-
-
Are we exporting sensitive/high-volume payloads into traces?
-
In our example, you can see pretty extensive pod and networking data dumped into the trace:
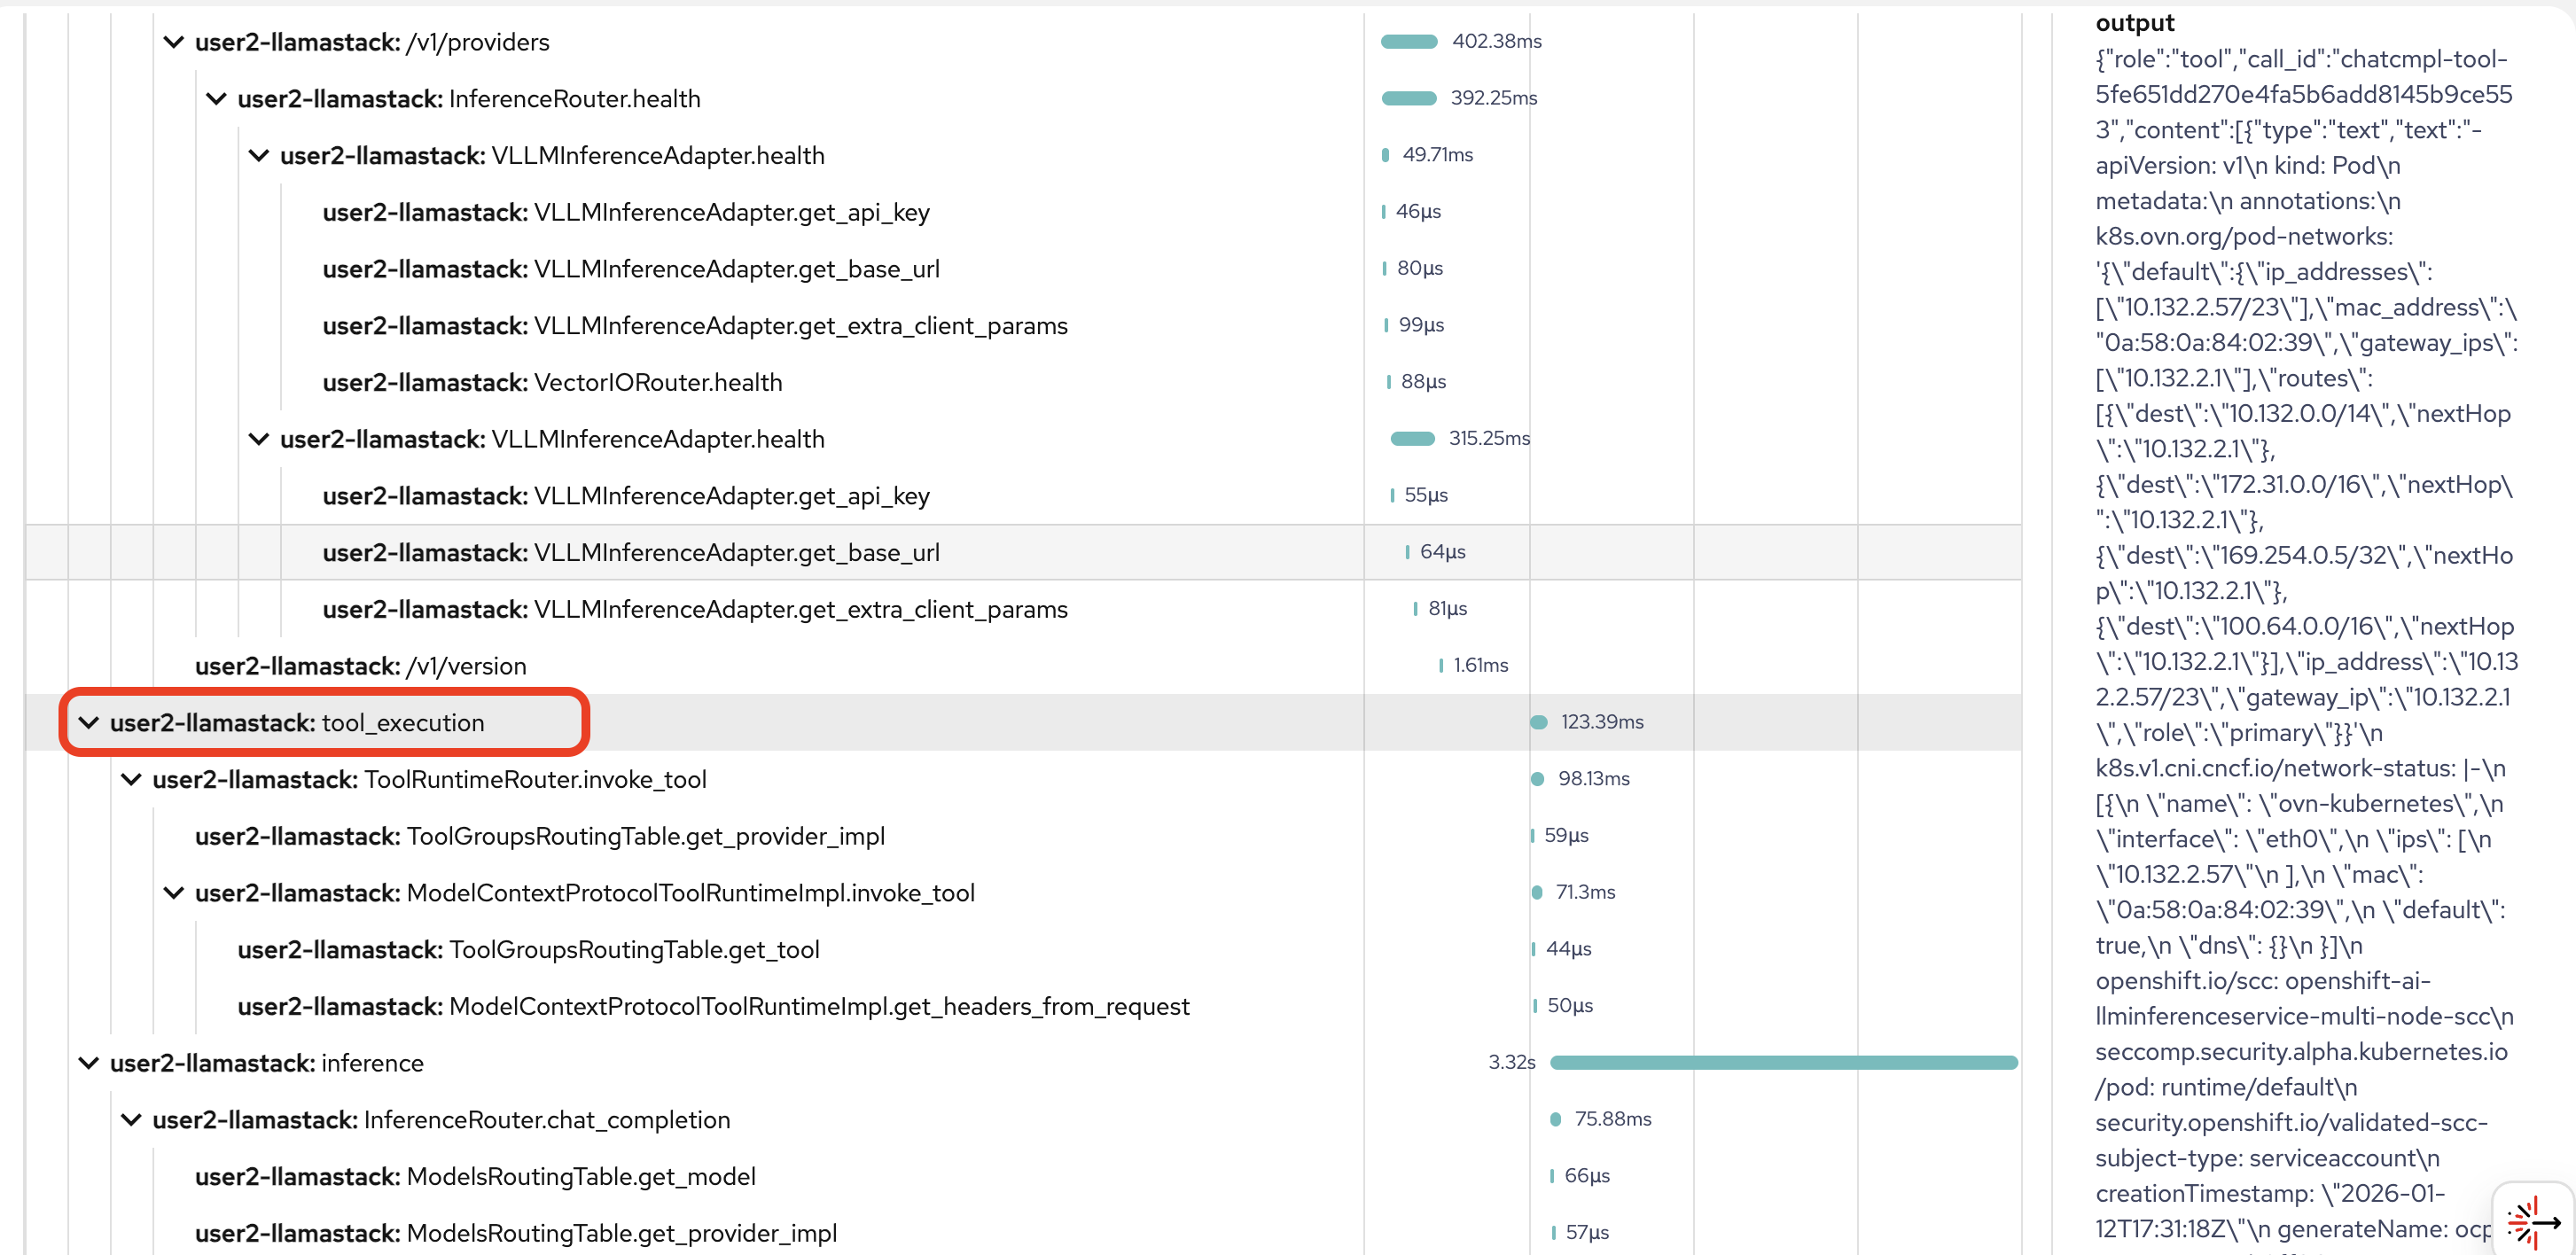
-
Think of some ways this potential security risk could be mitigated in future implementations.
-
-
Is tool output being reinjected verbatim?
-
Clue: In inference.input, in our example from above, the pod data was injected in its entirety. This is a classic driver of prompt token inflation. See where this might be happening in your example.
-
-
Are tools being invoked in the optimal order, or is the agent serializing work that could be parallelized to reduce end-to-end latency?
-
Which tool calls are independent vs dependent?
-
-
Is this trace safe to store?
-
Across the agent turn, how many tokens were consumed in each inference step (tool-selection vs final response), and what changes would you make (if any) to reduce the count?
-
sum the total_tokens per inference span and compare prompt vs completion tokens.
-
What this is NOT including: These trace token metrics reflect what Llama Stack observed for its own inference calls, but may exclude provider-side additions (proxy/gateway prompt rewriting, hidden system/safety wrappers), any unreported usage fields, and all non-LLM costs (tool payload size, network, retries).
-
For the full picture, you also need to track model metrics. Provider/model usage is the closest thing to billing truth. Trace tokens give step-by-step attribution (which part of the agent turn caused the spend, and therefore what can I optimize). In production, use provider metrics for cost + traces for diagnosis/optimization.
-