Section 5 — Automated incident response (Splunk → EDA → Vault)
|
Assume breach → contain blast radius
Detection will always be imperfect; Zero Trust asks what happens next. Here, a high-volume SSH failure pattern triggers automated revocation of the application’s database credentials—not merely an email. That limits what an attacker who gained foothold on the app host can reach next (lateral movement to sensitive data). The app may go intentionally unhealthy; that is trading availability for confidentiality in the critical window after suspected compromise. |
|
Visible telemetry
Splunk indexes evidence from hosts (via forwarders). ZTA monitoring is not optional decoration—it feeds continuous security analytics that can drive orchestrated response through EDA without waiting for humans to notice a dashboard. |
Exercise 5.1 — Explore Splunk
Navigate to the Splunk tab, this will open Splunk on another window and you can login with 'admin/ansible123!'
| Splunk can seem like it has disconnected, you just need to refresh. |
Navigate to 'Apps' → 'Search and Reporting'. From here we can verify that Splunk is recieving data from our infrastructure. Run the following search:
index=zta_* | stats count by index, sourcetype | sort -countThis will should return with a number of indexes for the infrastructure.
Splunk has been configured using the Event-Driven Ansible plugin, which we will update shortly. This allows us to trigger actions via Event-Driven Ansible from Splunk. Now, go back to AAP and navigate to Automation Decisions → Event Streams.
Event Streams provide a way for us to create an authenticated endpoint for Webhooks which are then internally routed to the appropriate rulebook for processing. Click on 'Create event stream' to create one:
Name |
Splunk EDA |
Organization |
Default |
Event Stream Type |
Token Event Stream |
Credential |
ZTA EDA Event Stream |
Once created, there is a URL that is generated. This URL is the single endpoint for your webhooks. You can have multiple webhooks deliver to this endpoint and all payloads will be routed internally. Copy this generated URL as we wil need it to update Splunk.
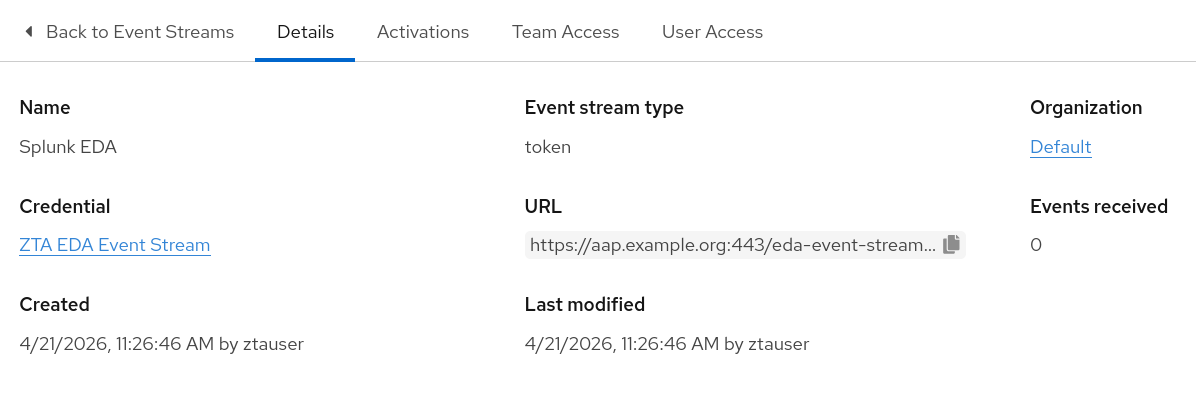
Go back to your Splunk instance, and navigate to 'Apps' → Event-Driven Ansible Add-on for Splunk. Click 'Add' and create the following integration:
Name |
EDA |
Integration Type |
Webhook |
Environment |
ZTA |
Webhook Endpoint |
|
Webhook Auth Type |
API Key in header |
Authentication Token |
zta-eda-webhook-a1b2c3d4-e5f6-7890 |
| Your URL from Event-Streams will use the aap.example.org domain, please change this to the IP 192.168.1.10 |
Once configured we are ready to simulate an attack.
|
Revoke vs "block IP"
This lab revokes secrets in Vault (and stops reliance on DB access) instead of only blocking a source IP—useful when attackers pivot internally or use many IPs. It illustrates credential-centric containment: shrink privilege first; network blocks can layer on top. |
Exercise 5.2 — Splunk saved search / alert
In AAP we can configure our Event Stream to not forward the event, this is great if you want to view the payload. Navigate back to the event stream, click on Splunk EDA and disable the toggle on the right that forwards events.
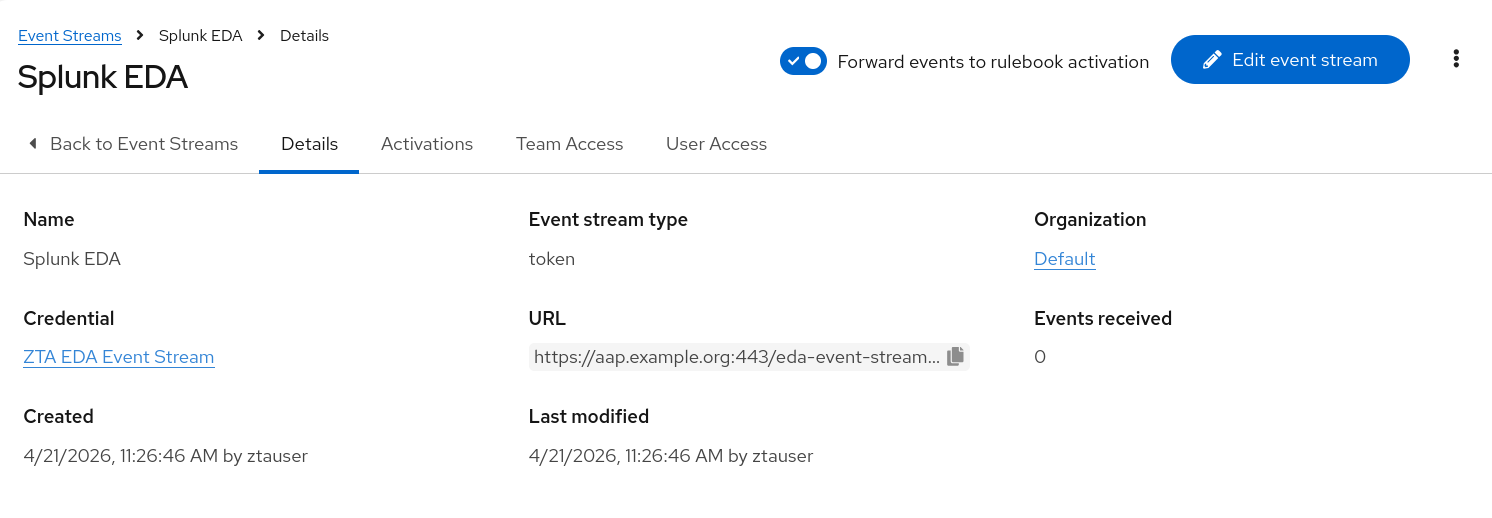
Now we can trigger a simulated brute foce if you run the template 'Simulate Brute Force'. Launch this template and then navigate to Splunk.
In Splunk , 'Apps' →, 'Search and Reporting', confirm failed SSH events are arriving:
index=zta_app sourcetype=syslog "Authentication failure"The brute-force detection search extracts the attacker IP with rex and aggregates by host:
(index=zta_app OR index=zta_syslog) sourcetype=syslog "Authentication failure"
| rex field=_raw "from (?P<src_ip>\d+\.\d+\.\d+\.\d+)"
| stats count by src_ip, host
| where count >= 5
| sort -count
Navigate to the 'Settings' → 'Searches, reports and alerts' section. Change the fields to:
Type |
All |
App |
All |
You will see the pre-configured ZTA: SSH Brute Force Detected saved search. If you click 'View Recent' it will take you to the most recent events and alerts.
Now, lets go back to AAP. Click on Event Streams, and you will notice you have had a number of events come in, so we know the integration is working between Splunk and EDA. Click on the event stream and scroll down to see the event payload that has been recieved:
app: ansible_addon_for_splunk
owner: admin
results:
  __mv_count: ''
  __mv_host: ''
  __mv_src_ip: ''
  count: '10'
  host: app
  rid: '0'
  src_ip: 192.168.1.10
results_rest_link: https://splunk.zta.lab:8089/services/search/v2/jobs/scheduler__admin_YW5zaWJsZV9hZGRvbl9mb3Jfc3BsdW5r__RMD5c814727b2a21efcc_at_1776688380_73/results
results_web_link: http://splunk.zta.lab:8000/app/ansible_addon_for_splunk/@go?sid=scheduler__admin_YW5zaWJsZV9hZGRvbl9mb3Jfc3BsdW5r__RMD5c814727b2a21efcc_at_1776688380_73
search_name: 'ZTA: SSH Brute Force Detected'
sid: scheduler__admin_YW5zaWJsZV9hZGRvbl9mb3Jfc3BsdW5r__RMD5c814727b2a21efcc_at_1776688380_73|
SIEM as sensor, EDA as actuator
Splunk answers "do we see attack-like behaviour?" The Ansible add-on is a standardised signal into Event-Driven Ansible, which turns that boolean into approved automation (run job template). This is the ZTA pattern of policy-driven orchestration: response playbooks are still subject to automation controller policies and RBAC, not anonymous shell scripts. |
Exercise 5.3 — EDA rulebook activation
The EDA project and Decision Environment were created in the prerequisite step and we have now configured the event stream but we need to allocate rulebooks to the event stream. Firstly, re-enable the forwarding of events on the event stream. Next,navigate to 'Rulebook Activations' and click 'Create rulebook activation'.
Create the rulebook:
Name |
Splunk Events |
Organization |
Default |
Project |
ZTA Workshop EDA |
Rulebook |
splunk-credential-revoke.yml |
Event streams |
Splunk EDA (Click on the cog) |
Credential |
ZTA AAP Credential |
Decision Environment |
Default Decision Environment |
Click 'Create rulebook activation', this will create an activation and you will see it is in a 'Starting' status before moving to 'Running'. Running means the rulebook is actively listening to the events routed to it.
|
Closed loop
EDA closes the loop between observation (logs/alerts) and enforcement (AAP). For Zero Trust maturity, measure time-to-contain and ensure playbooks are idempotent and safe—false positives will happen, which is why Section 5.8 tuning matters. |
Exercise 5.5 — Simulate attack
Time to simulate an attack login as the appdev user and see how EDA can assist without manual intevention. First, navigate to 'Templates' and edit the 'Deploy Application Pipeline' workflow, in Extra variables add the following: 'vault_db_default_ttl: 30m'. This will override the timeout for this example so we have enough time to observe. Launch the 'Deploy Application Pipeline' template now, and once complete click on the 'Global Telemetry Platform' tab to make sure the application is currently working.
Now launch Simulate Brute Force template on AAP and navigate to the 'Rulebook Activations' to see if this attack triggers a response from Event-Driven Ansible. (You can observe on Splunk with the saved search)
|
Safe simulation
The playbook generates failed auth events without granting access—useful training data for Splunk thresholds and for proving the detection → response chain without handing students real exploit tools. |
We can see from the playbook the incident report:
msg: |
  Incident response — credentials revoked
  ========================================

  Trigger: brute-force detected (Splunk)
  Source:  splunk-eda
  Target:  app.zta.lab

  Actions taken:
    Vault DB lease revoked
    App role leases revoked (prefix)
    App env file removed
    ztaapp stopped
    Incident log written to /var/log/zta-incident-*.log

  Application has no DB access.
  Restore with restore-app-credentials.yml after investigation.
Observe chain
-
Splunk: alert fired, events visible.
-
EDA: event received, rule matched,
run_job_templateto revoke. -
Automation controller: Emergency: Revoke App Credentials ran without manual launch.
-
App/CURL and PostgreSQL: creds gone / app isolated.
You can ssh into the vault server and view this incident:
ls /var/log/zta-incident-*.log|
Human-in-the-loop recovery
Automation contained the incident; humans still decide when to restore—matching many real SOCs (investigate, then re-issue least privilege). The restore template models controlled re-onboarding of credentials rather than silently rolling back security. |