Module 1: The agentic app and why observability matters
Agentic AI apps don’t fail silently; they fail distributedly. In this module, you’ll explore the pre-deployed mortgage-ai multi-agent application and understand why traditional monitoring approaches fall short for these complex systems.
But first, what exactly is an AI agent? An AI agent is a system that uses a Large Language Model (LLM) to reason about a task, decide which tools to call, and take autonomous actions, going beyond simple request/response patterns like traditional APIs or basic chatbots. When multiple agents collaborate, each with its own tools and responsibilities, you get a multi-agent system, which is capable but significantly harder to observe and debug.
Fed Aura Capital needs end-to-end visibility into their multi-agent workflows, and you’ve been tasked with evaluating how observability can help. Before implementing solutions, you need to understand what you’re working with.
Learning objectives
By the end of this module, you’ll be able to:
-
Describe the architecture of the multi-agent mortgage lending system
-
Identify the 5 distinct agent personas and their responsibilities
-
Explain why distributed AI systems require specialized observability approaches
-
Recognize the key failure modes (ways the system can fail or degrade) in multi-agent architectures
Exercise 1: Access the application UI
| Throughout this workshop, all key services are accessible as tabs — no need to open separate browser windows. |
-
First, log in to the OpenShift cluster from the Terminal tab:
oc login --insecure-skip-tls-verify $(oc whoami --show-server) -u user1 -p openshift -
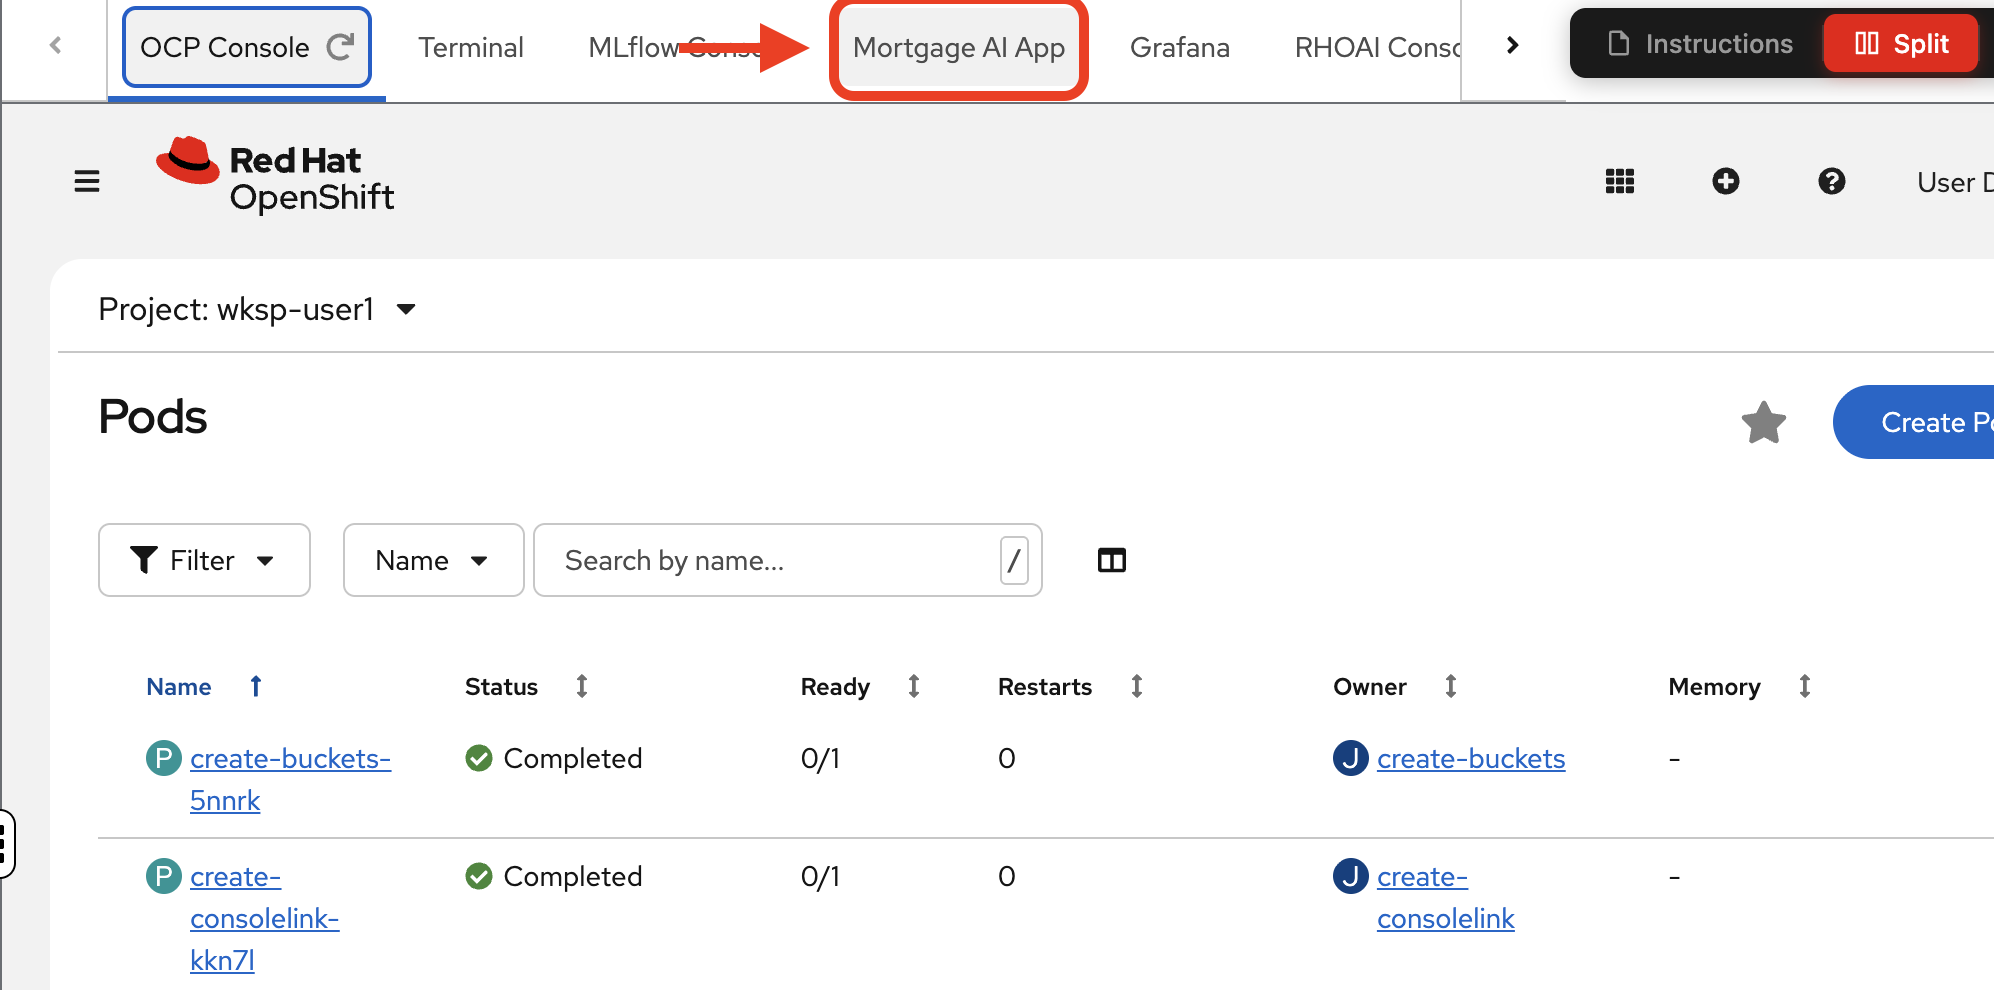
Navigate to the OCP Console tab. Log in with the same credentials you just used: username
user1, passwordopenshift: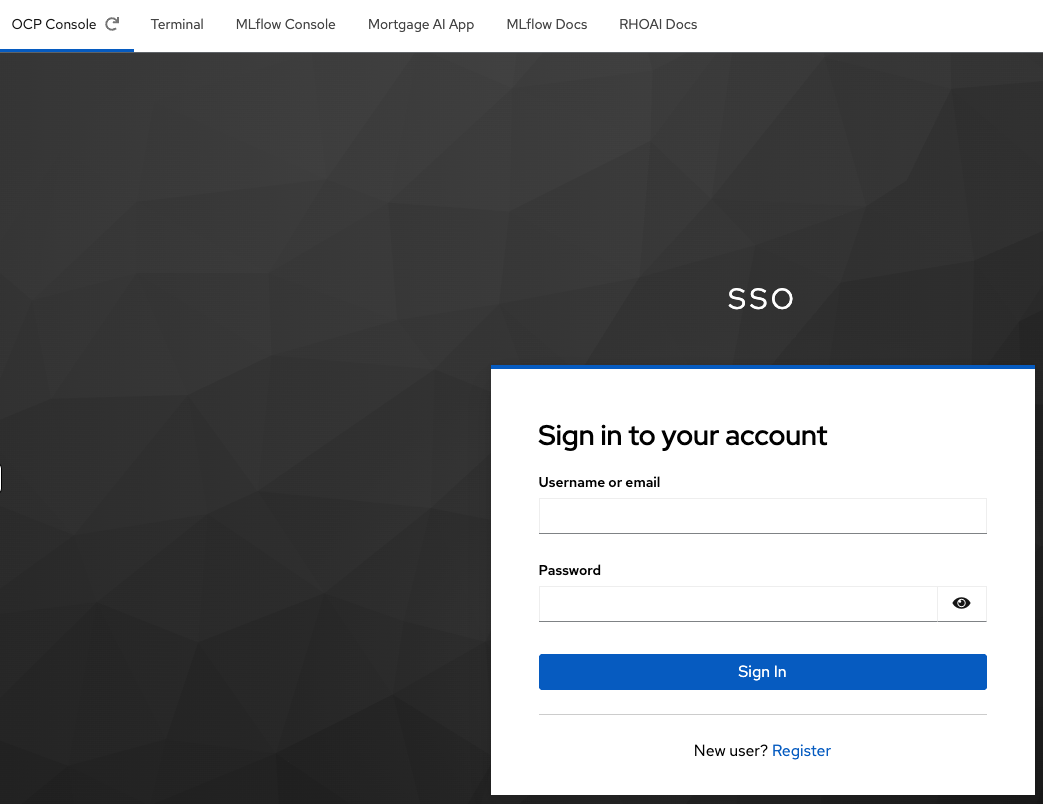
-
Once logged in, you will see the
Projectspage and a single project:wksp-user1. Navigate to Workloads > Pods to see the mortgage-ai components running in your namespace: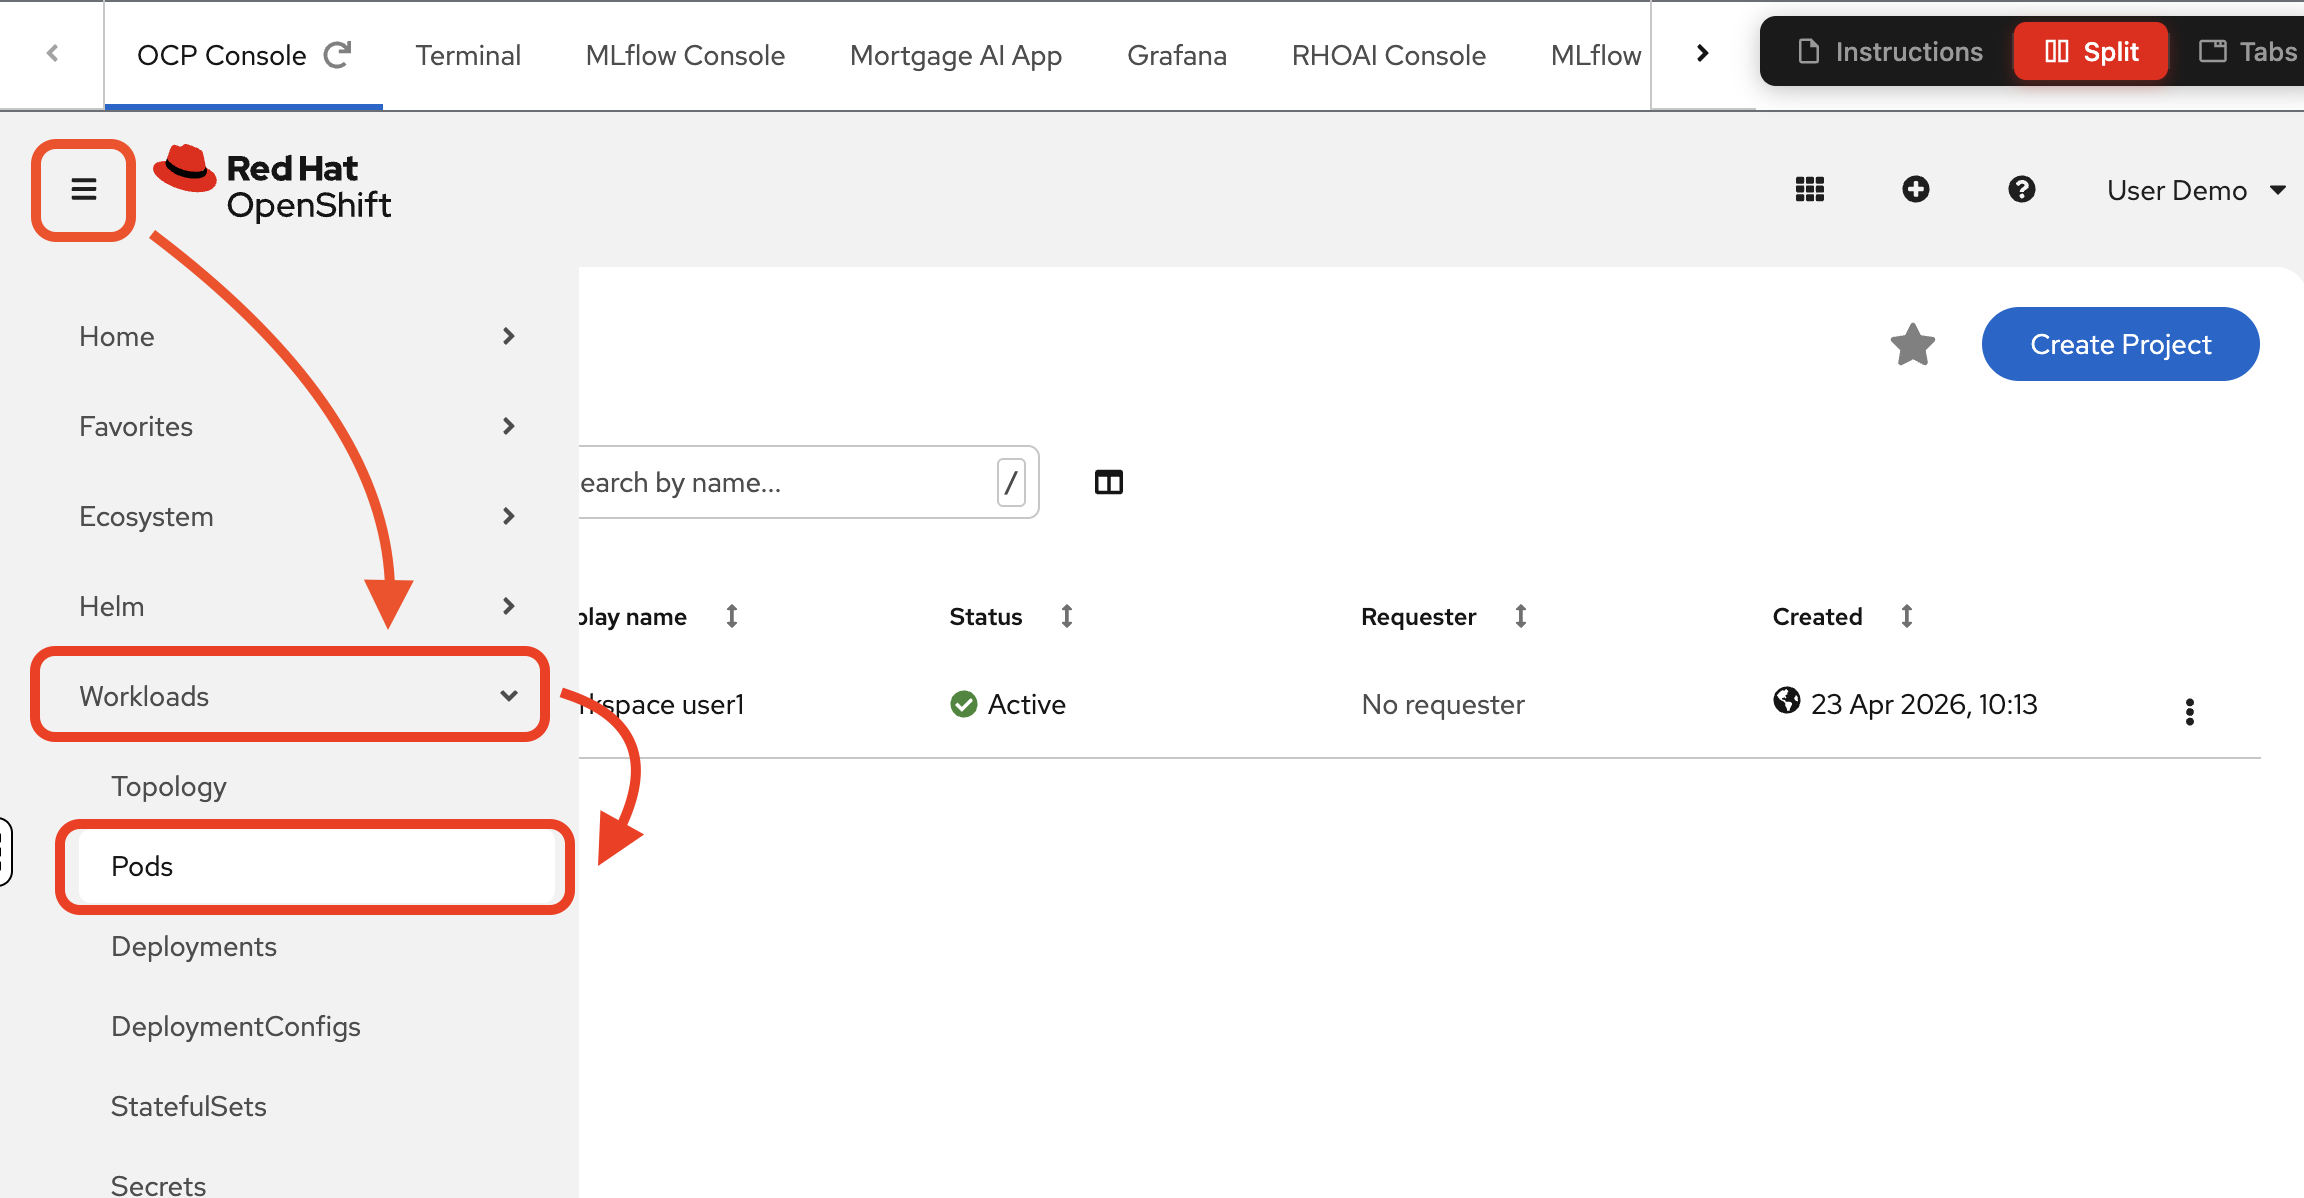
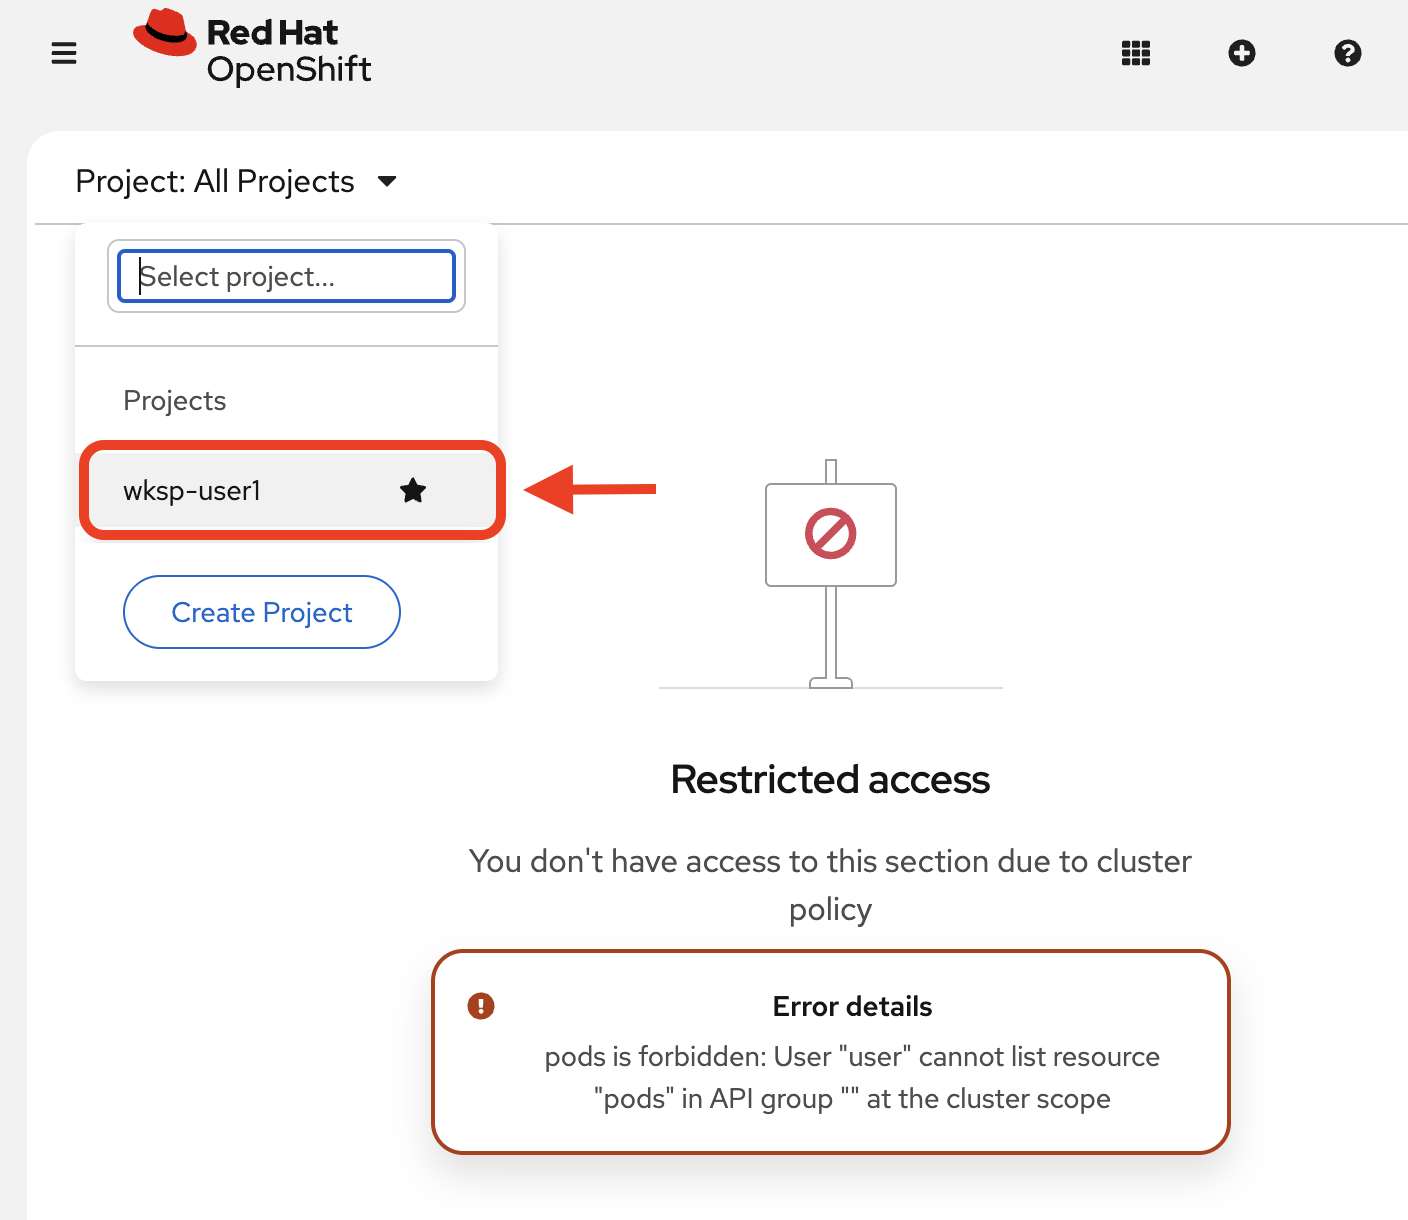
If you do not see pods, make sure you select your project:
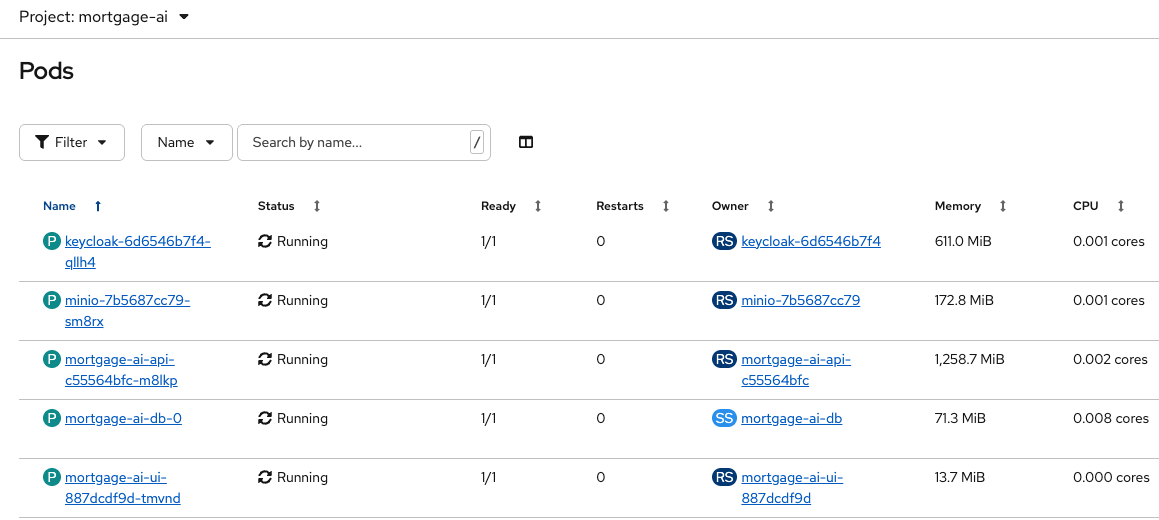
You will explore these components in Exercise 2.
-
Navigate to the Mortgage AI App tab:
-
Scroll down a bit. Try a sample conversation clicking the Explore Products button:
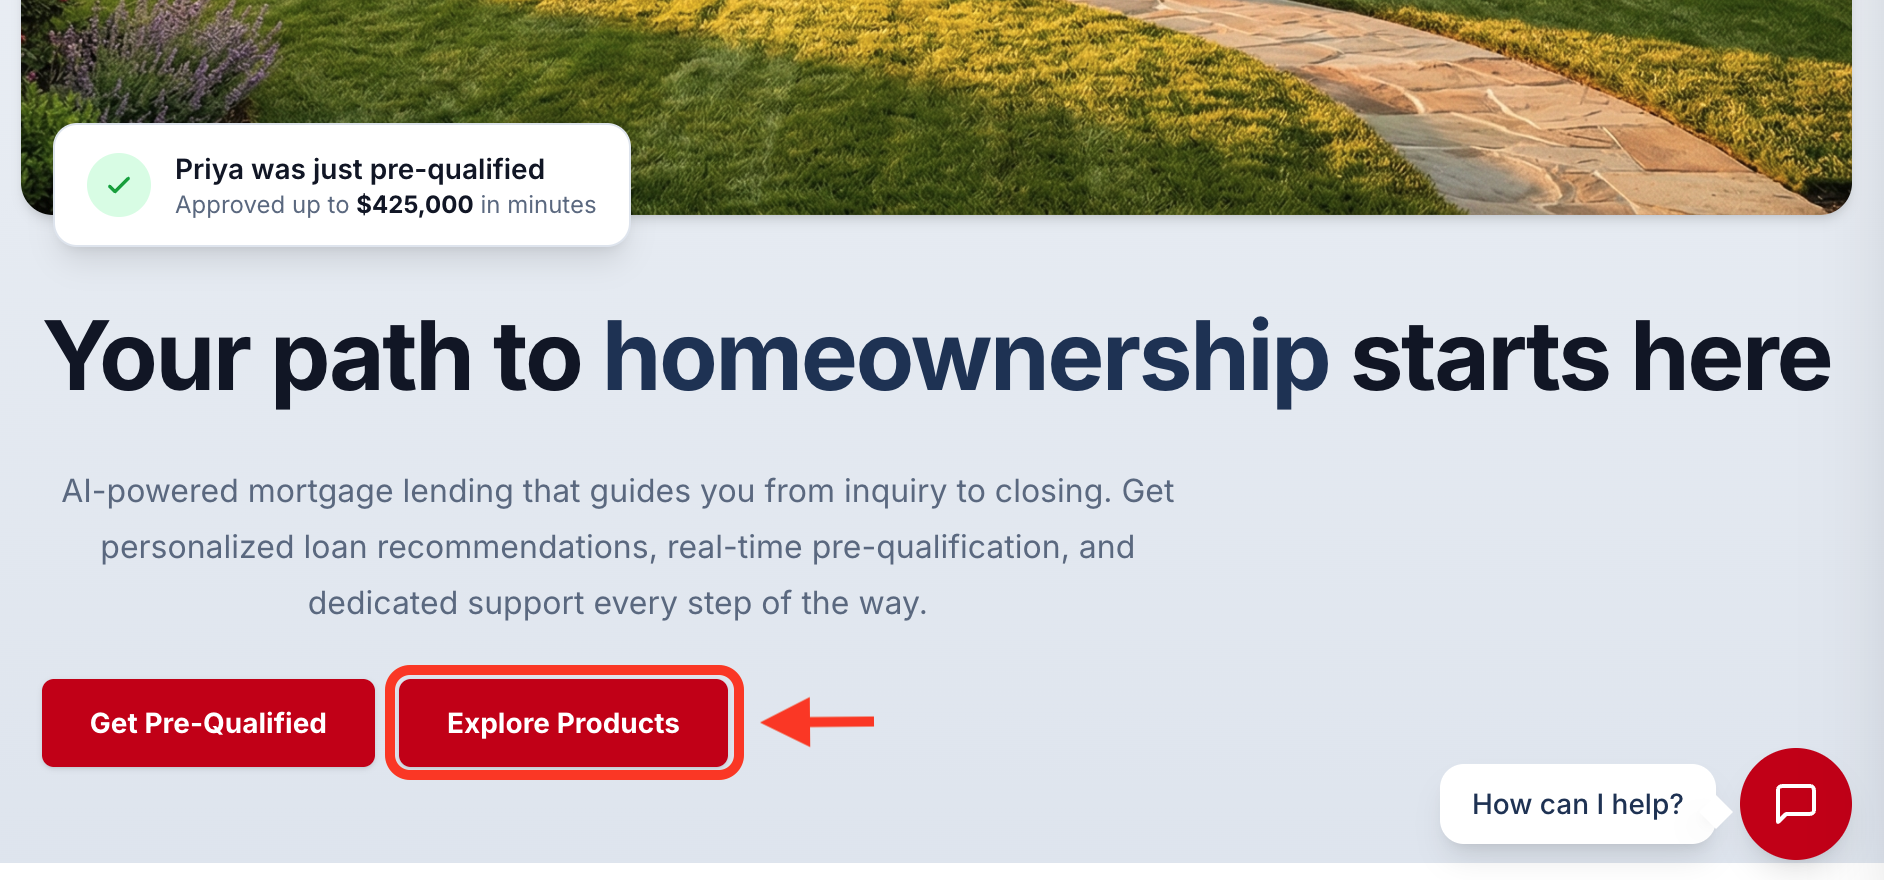
The Prospect Agent should respond with mortgage product options:
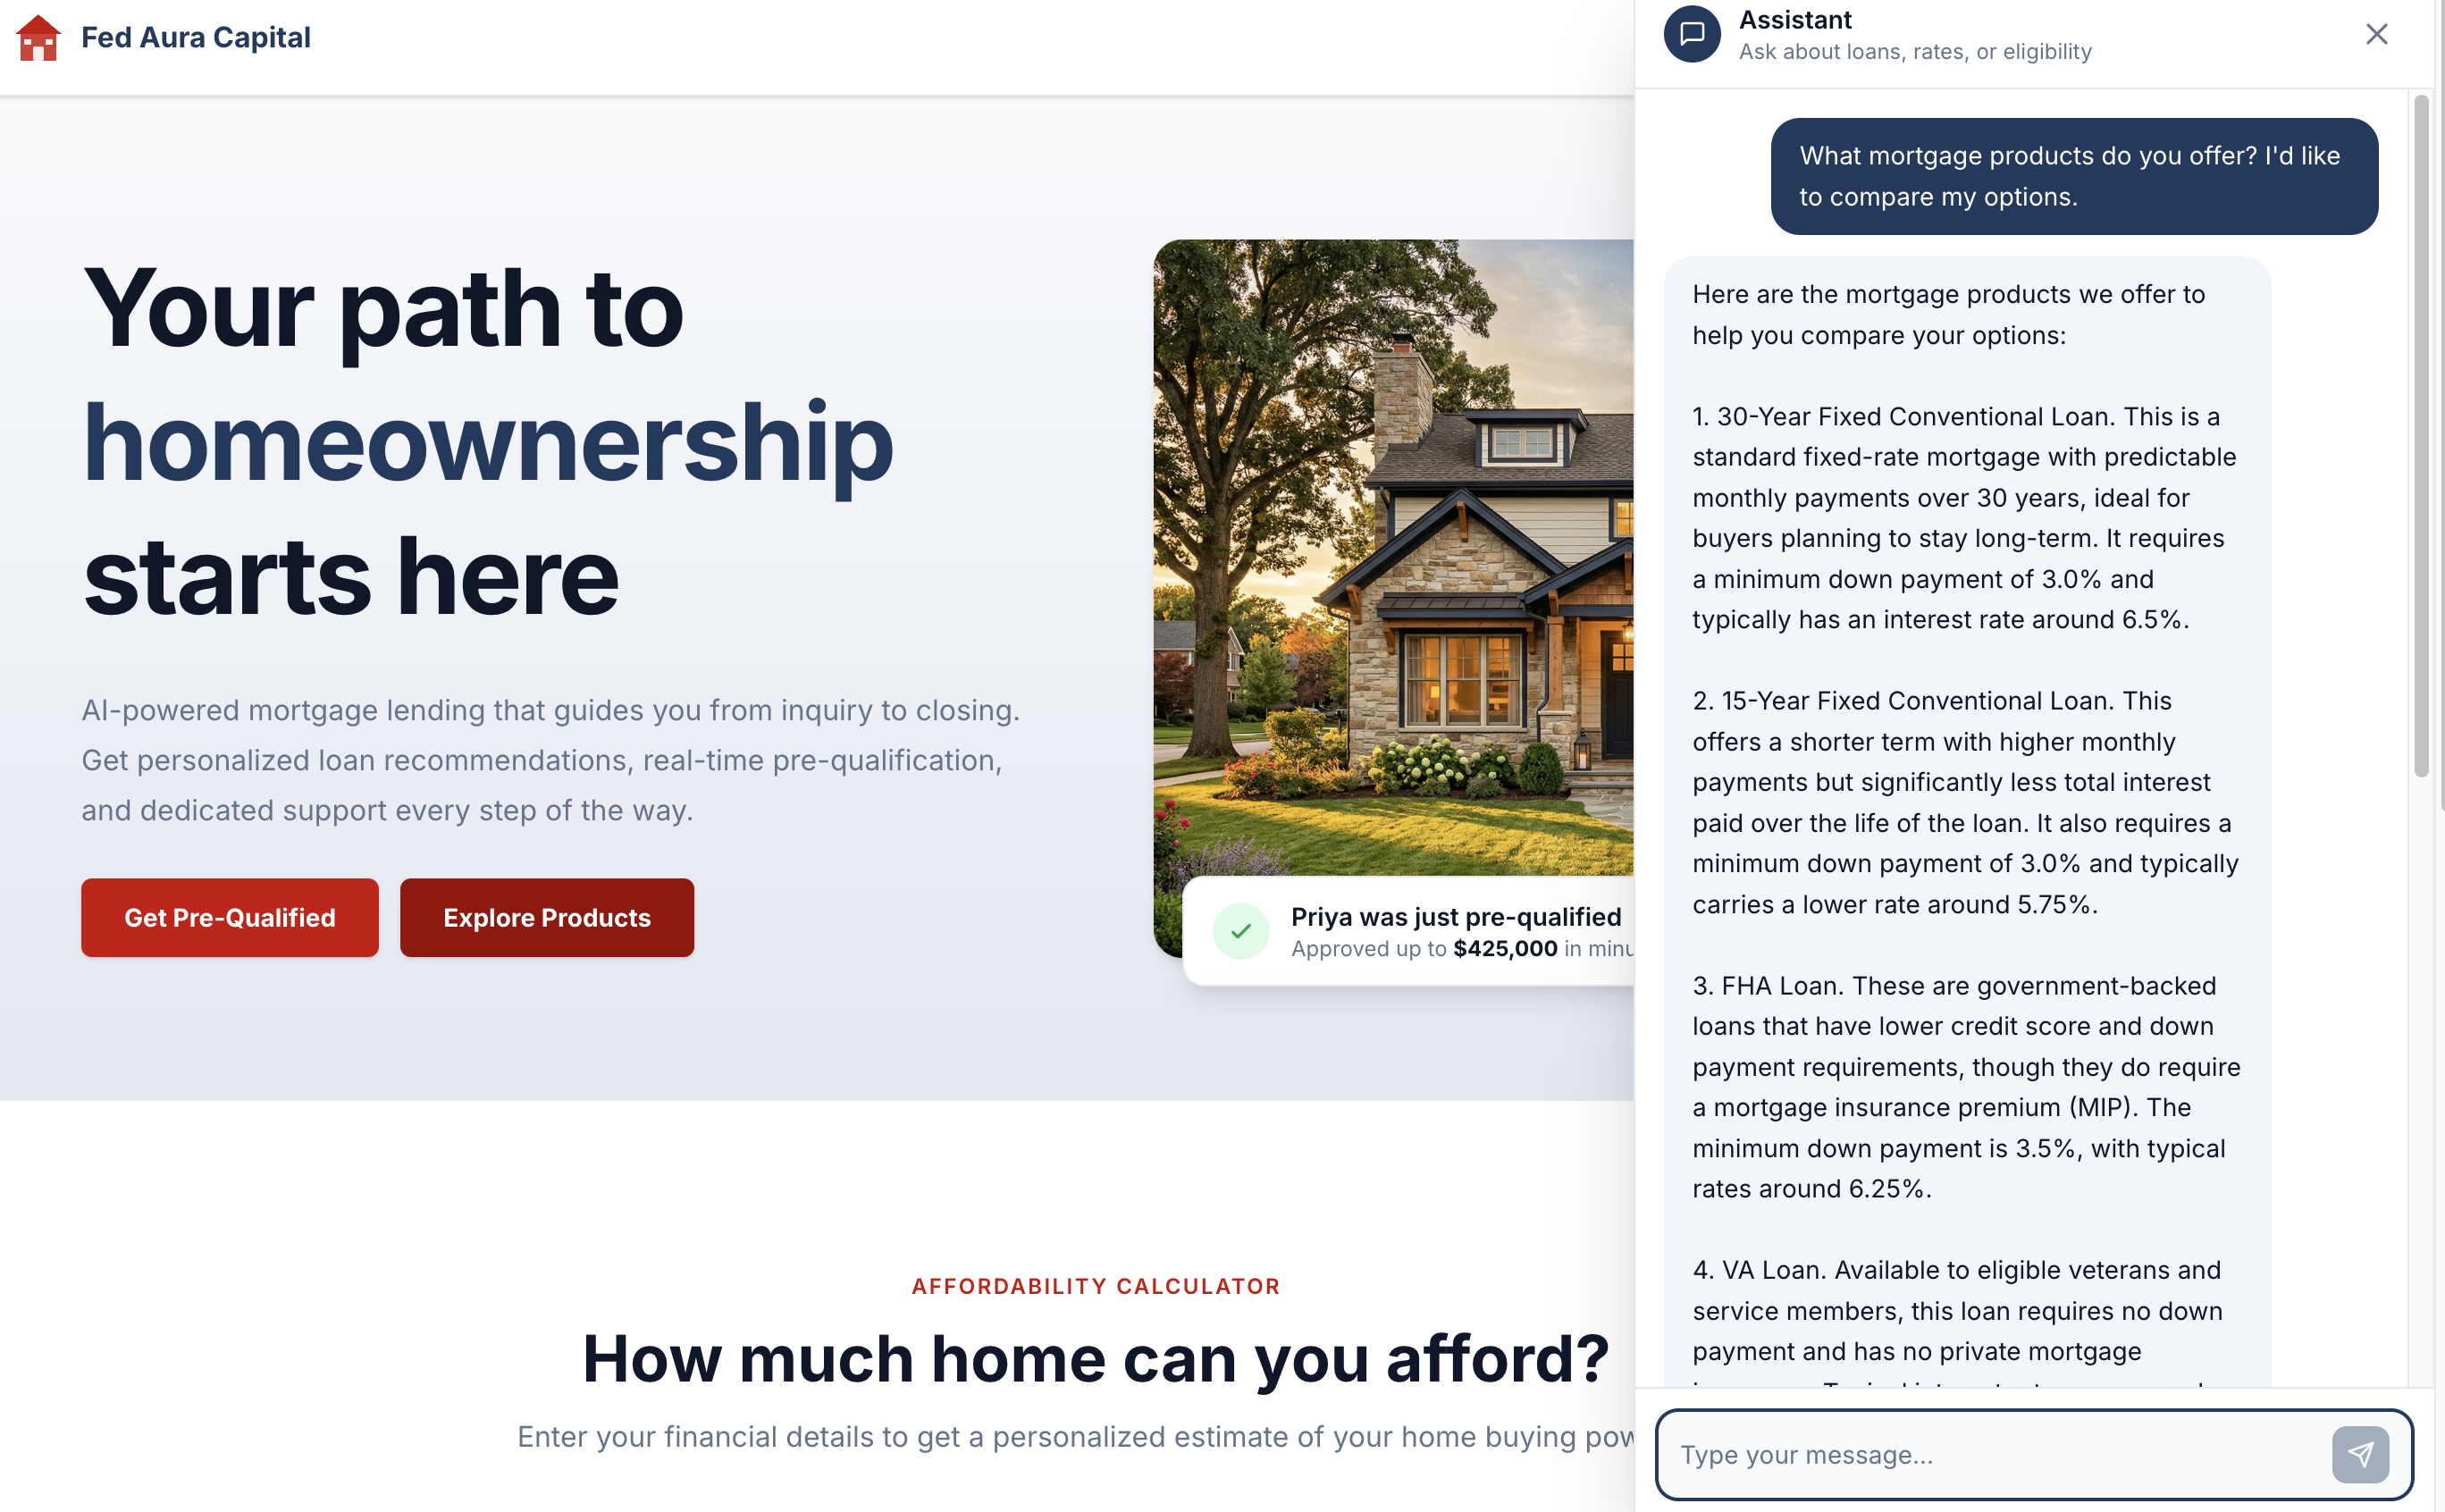
| The LLM backend has rate limiting and may occasionally time out. If the agent does not respond or you see an error, reload the page and ask the question again. |
| Because the application uses generative AI, responses are non-deterministic. The exact wording, formatting, and details may differ from the screenshots shown in this workshop. |
Exercise 2: Explore the multi-agent architecture
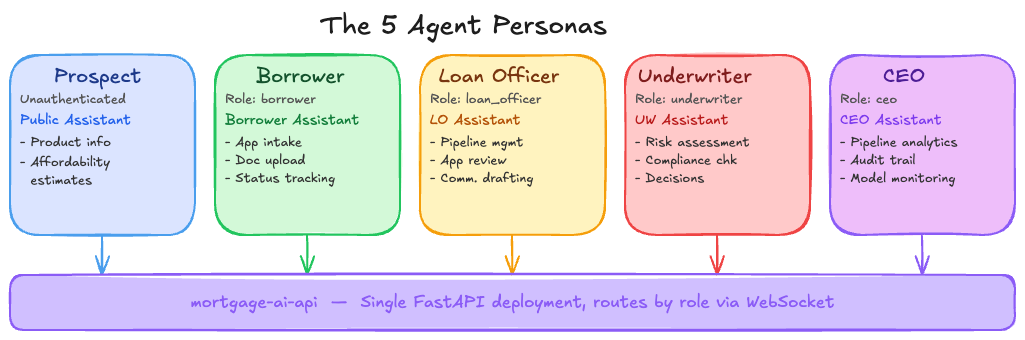
Now that you’ve seen the application in action, let’s explore what’s running under the hood. The mortgage-ai system serves 5 distinct agent personas through a single API deployment.
Understanding the architecture
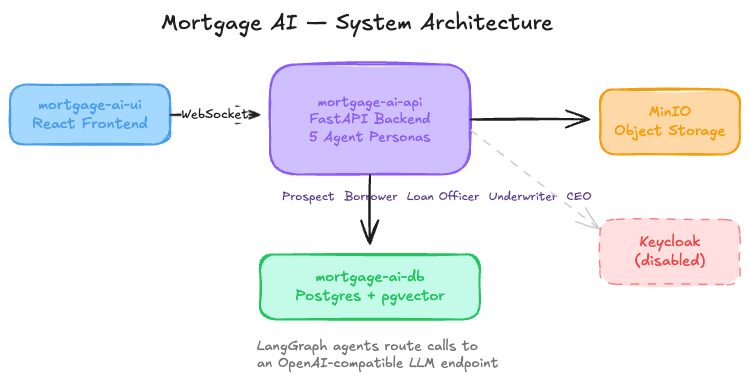
The mortgage-ai system runs as a single FastAPI service with 5 LangGraph agent implementations inside it. Each agent serves a different persona in the lending workflow, but they all run in the same pod.
System architecture:
Deployed components:
| Component | Purpose |
|---|---|
mortgage-ai-api |
One FastAPI pod containing all 5 agent implementations, routes by role via WebSocket |
mortgage-ai-ui |
React frontend for interacting with agents |
mortgage-ai-db |
PostgreSQL with pgvector for document storage and RAG (Retrieval-Augmented Generation) embeddings |
minio |
S3-compatible object storage for uploaded documents |
keycloak |
Identity provider (disabled for this workshop) |
The 5 agent personas
Each agent has its own endpoint, tools, and responsibilities. They don’t call each other directly—instead, they’re isolated workflows serving different user roles:
| Persona | Role | Agent | Key Capabilities |
|---|---|---|---|
Prospect |
Unauthenticated |
Public Assistant |
Product info, affordability estimates |
Borrower |
|
Borrower Assistant |
Application intake, document upload, status tracking, condition response |
Loan Officer |
|
LO Assistant |
Pipeline management, application review, communication drafting, knowledge base search |
Underwriter |
|
Underwriter Assistant |
Risk assessment, compliance checks, condition management, decisions |
CEO |
|
CEO Assistant |
Pipeline analytics, audit trail, decision trace, model monitoring |
API endpoints (all served by the same mortgage-ai-api pod):
/api/prospect/chat    - Prospect Agent (initial inquiries)
/api/borrower/chat    - Borrower Agent (application intake)
/api/loanofficer/chat - Loan Officer Agent (pipeline management)
/api/underwriter/chat - Underwriter Agent (risk assessment)
/api/ceo/chat         - Executive Agent (analytics)
How a request flows
Request path: User → UI → WebSocket → API router → Specific agent → LangGraph workflow → Tools (DB, MCP, LLM) → Response
Example (CEO asking "What’s the portfolio health?"):
-
User asks question in UI
-
WebSocket routes to
/api/ceo/chatbased on authenticated role -
CEO Agent (LangGraph workflow) receives the question
-
Agent decides which tools to call:
get_pipeline_summary,calculate_pull_through_rate -
Each tool may query the database or call external MCP tools
-
Agent calls the LLM multiple times to reason about tool results
-
Final response is sent back to the user
Why this matters for observability: A single user question can trigger 5+ LLM calls, 10+ tool invocations, and multiple database queries. When something fails or returns wrong data, you need to trace the entire decision path to find the root cause.
|
Common failure modes in multi-agent architectures Understanding how these systems fail is key to implementing effective observability: • Silent tool failures: MCP tool returns empty data, but the agent proceeds anyway and generates a response based on incomplete information • Cascading latency: A slow database query delays the LLM call, which delays the response—but you can’t tell which step caused the bottleneck • Context overflow: Agent tries to pass too much data to the LLM, the call fails with a cryptic error, and the user sees a generic timeout • Non-deterministic failures: The same question produces different results due to LLM variations, making bugs difficult to reproduce • Distributed failures: One agent’s tool call fails, affecting downstream agents without clear error propagation |
Verify the deployment
Before exploring the application, let’s confirm all components are running and healthy. We’ll check two things: that the OpenShift pods are ready, and that the API can successfully connect to its database.
-
Navigate to the Terminal tab. View the pods and their status:
oc get pods -n wksp-user1This command shows all pods in your namespace and their readiness status. All pods should show
Runningwith1/1or2/2containers ready. If any pod showsCrashLoopBackOff,Error, or0/1, the deployment has not completed successfully. -
Check the API service health endpoint:
MORTGAGE_HEALTH=$(oc get route mortgage-ai-api-health-route -n wksp-user1 -o jsonpath='{.spec.host}')
curl -sk https://${MORTGAGE_HEALTH}/health/ | jq -r .
This health check verifies two critical dependencies for the multi-agent system: the FastAPI service itself, and its connection to the PostgreSQL database (which stores application state, embeddings for RAG, and audit trails).
Expected output:
[
  {
    "name": "API",
    "status": "healthy",
    "message": "API is running",
    "version": "0.1.0",
    "start_time": "2026-04-07T22:21:27.657181+00:00"
  },
  {
    "name": "Database",
    "status": "healthy",
    "message": "PostgreSQL connection successful",
    "version": "0.1.0",
    "start_time": "2026-04-07T22:21:19.877102+00:00"
  }
]
What this result means: Both the API and Database components report
"status": "healthy". This confirms the FastAPI pod is running and can establish a connection to PostgreSQL. Without a healthy database connection, the agents cannot access their knowledge base, retrieve application data, or execute RAG workflows. If either component shows a status other than"healthy", troubleshoot that service before proceeding.
Exercise 3: Experience the observability gap
Now that you understand the 5 agent personas and how they collaborate, let’s experience firsthand the observability challenge that comes with distributed AI systems.
You’ll interact with the application as a CEO and ask the assistant a question. The response will look correct, but you’ll have no way of knowing what happened behind the scenes.
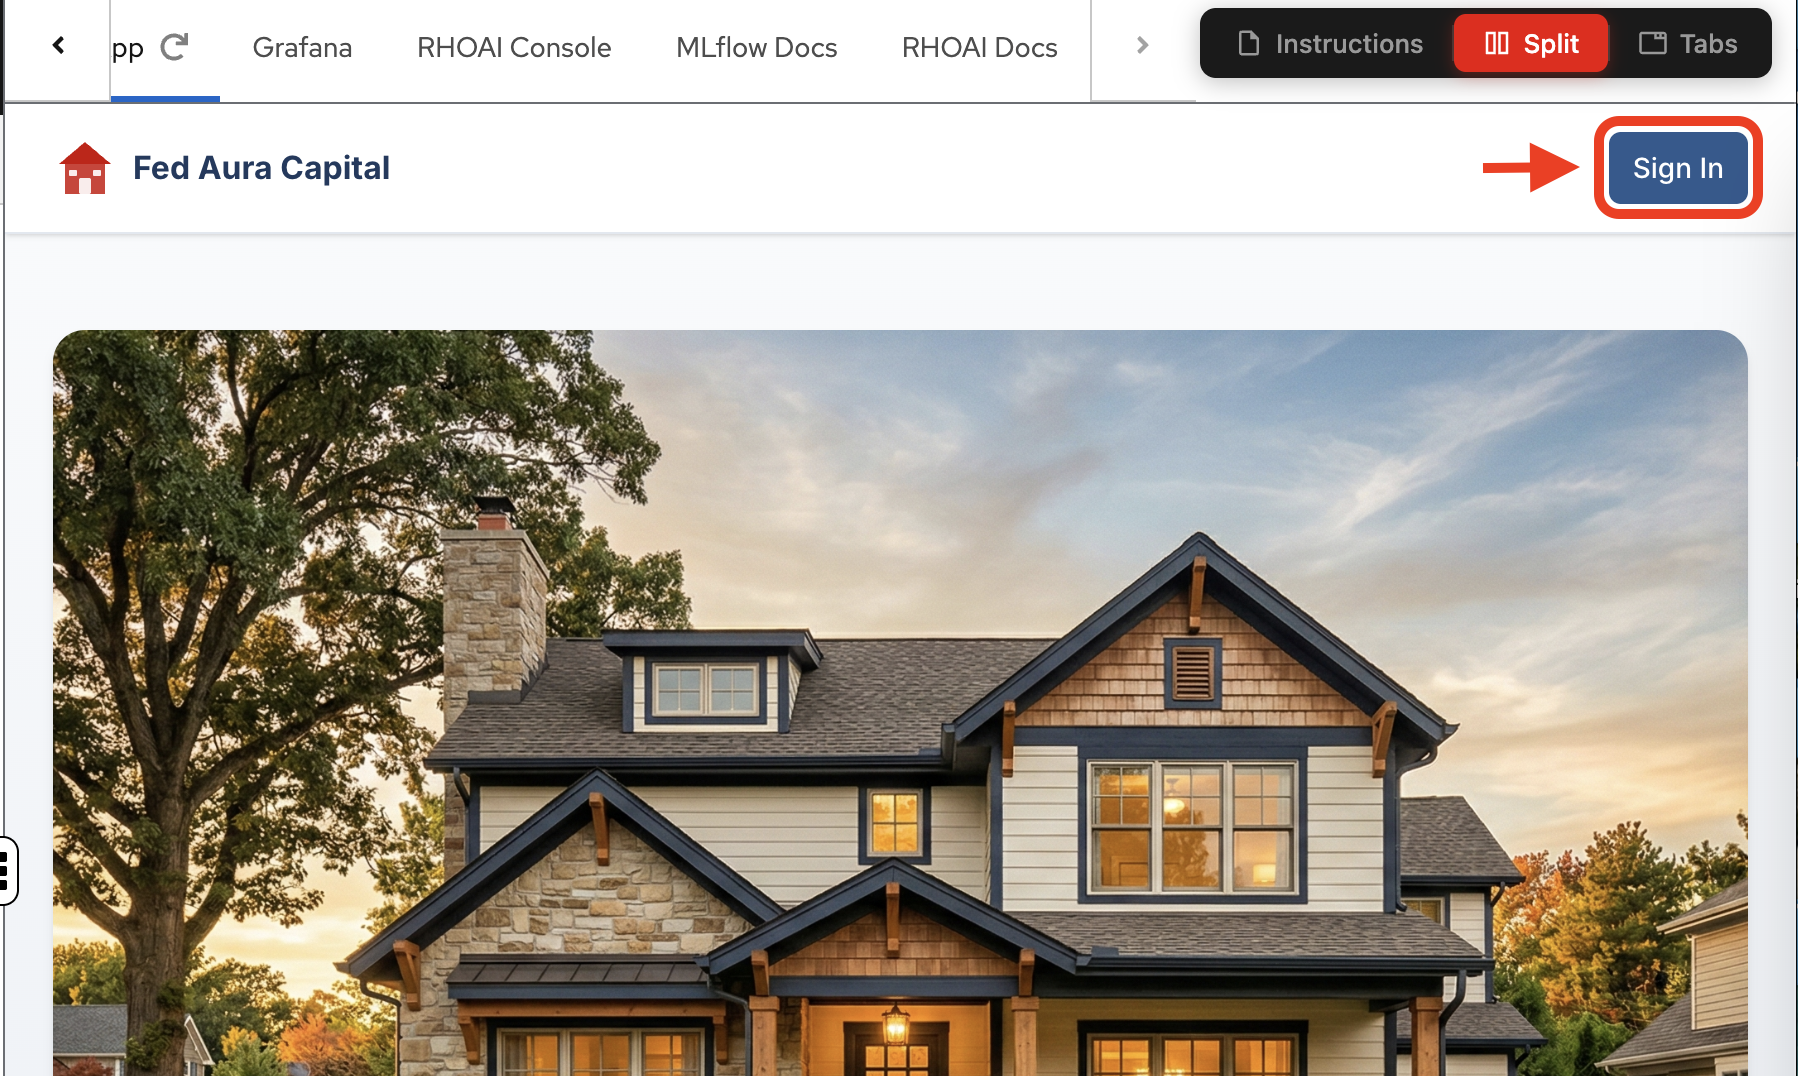
-
From the application landing page, click Sign In.
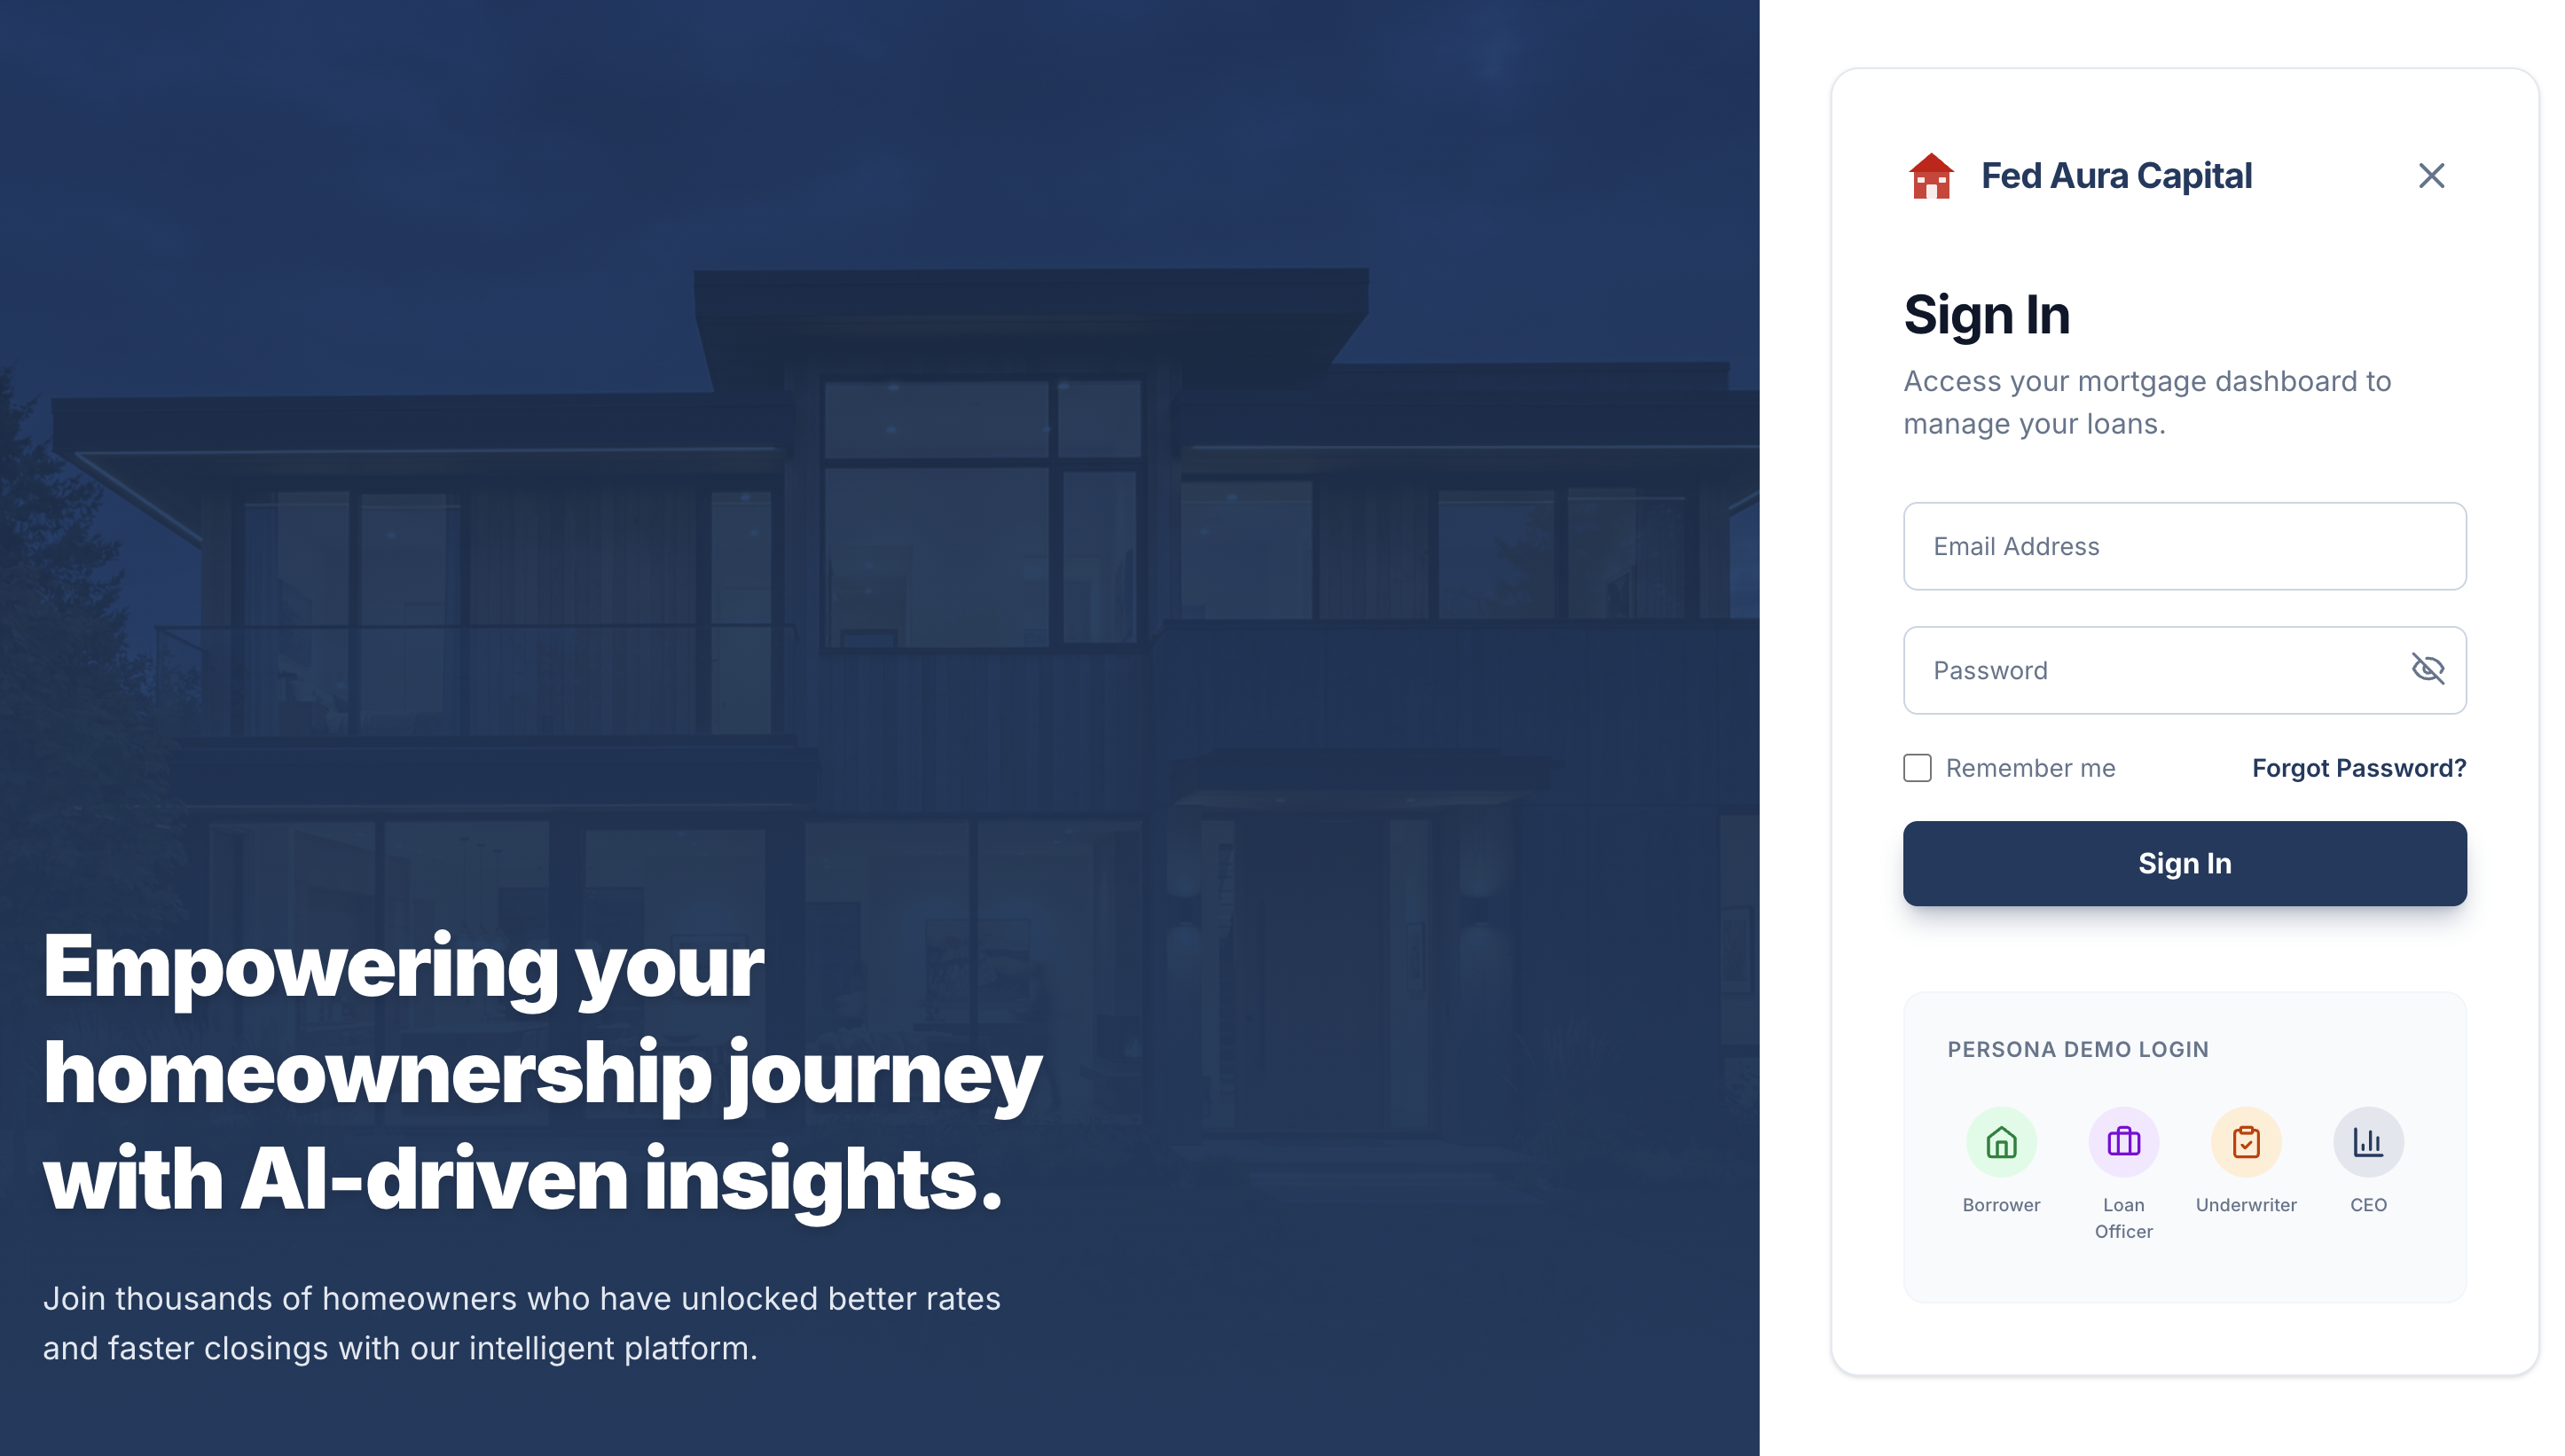
-
In the sign-in dialog, use the Persona Demo Login section at the bottom and select the CEO persona:
-
Click
Sign In: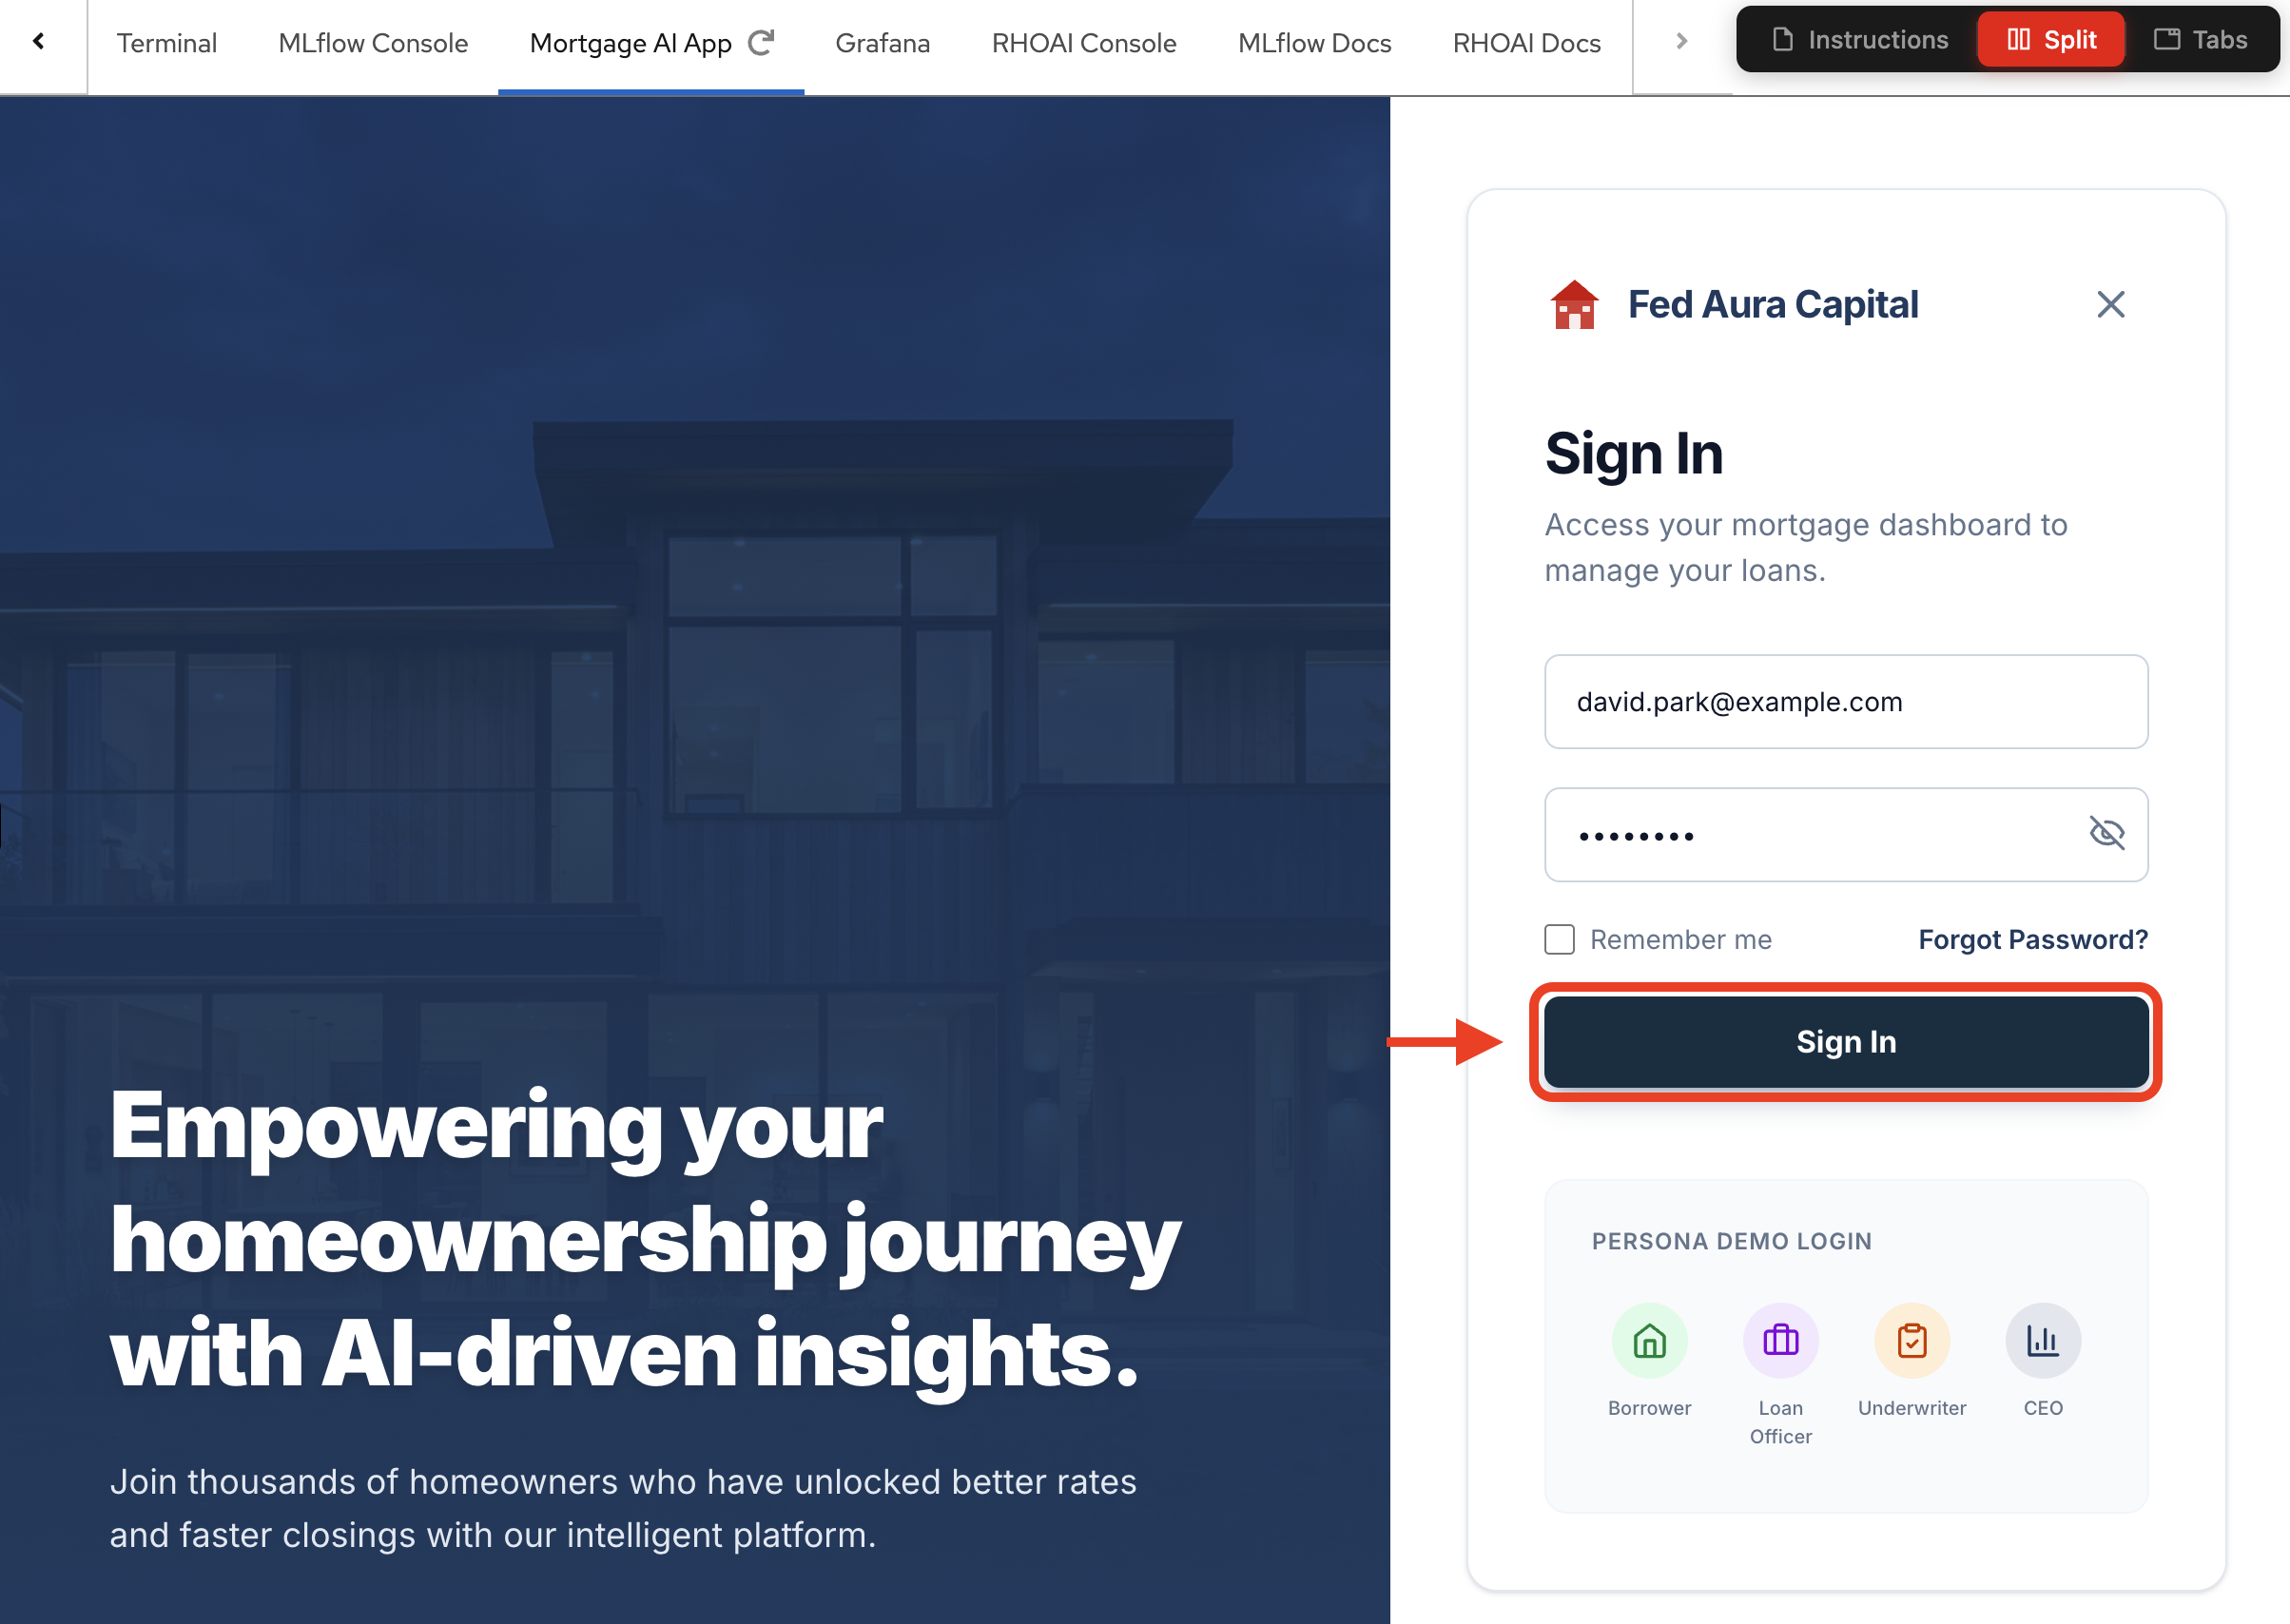
-
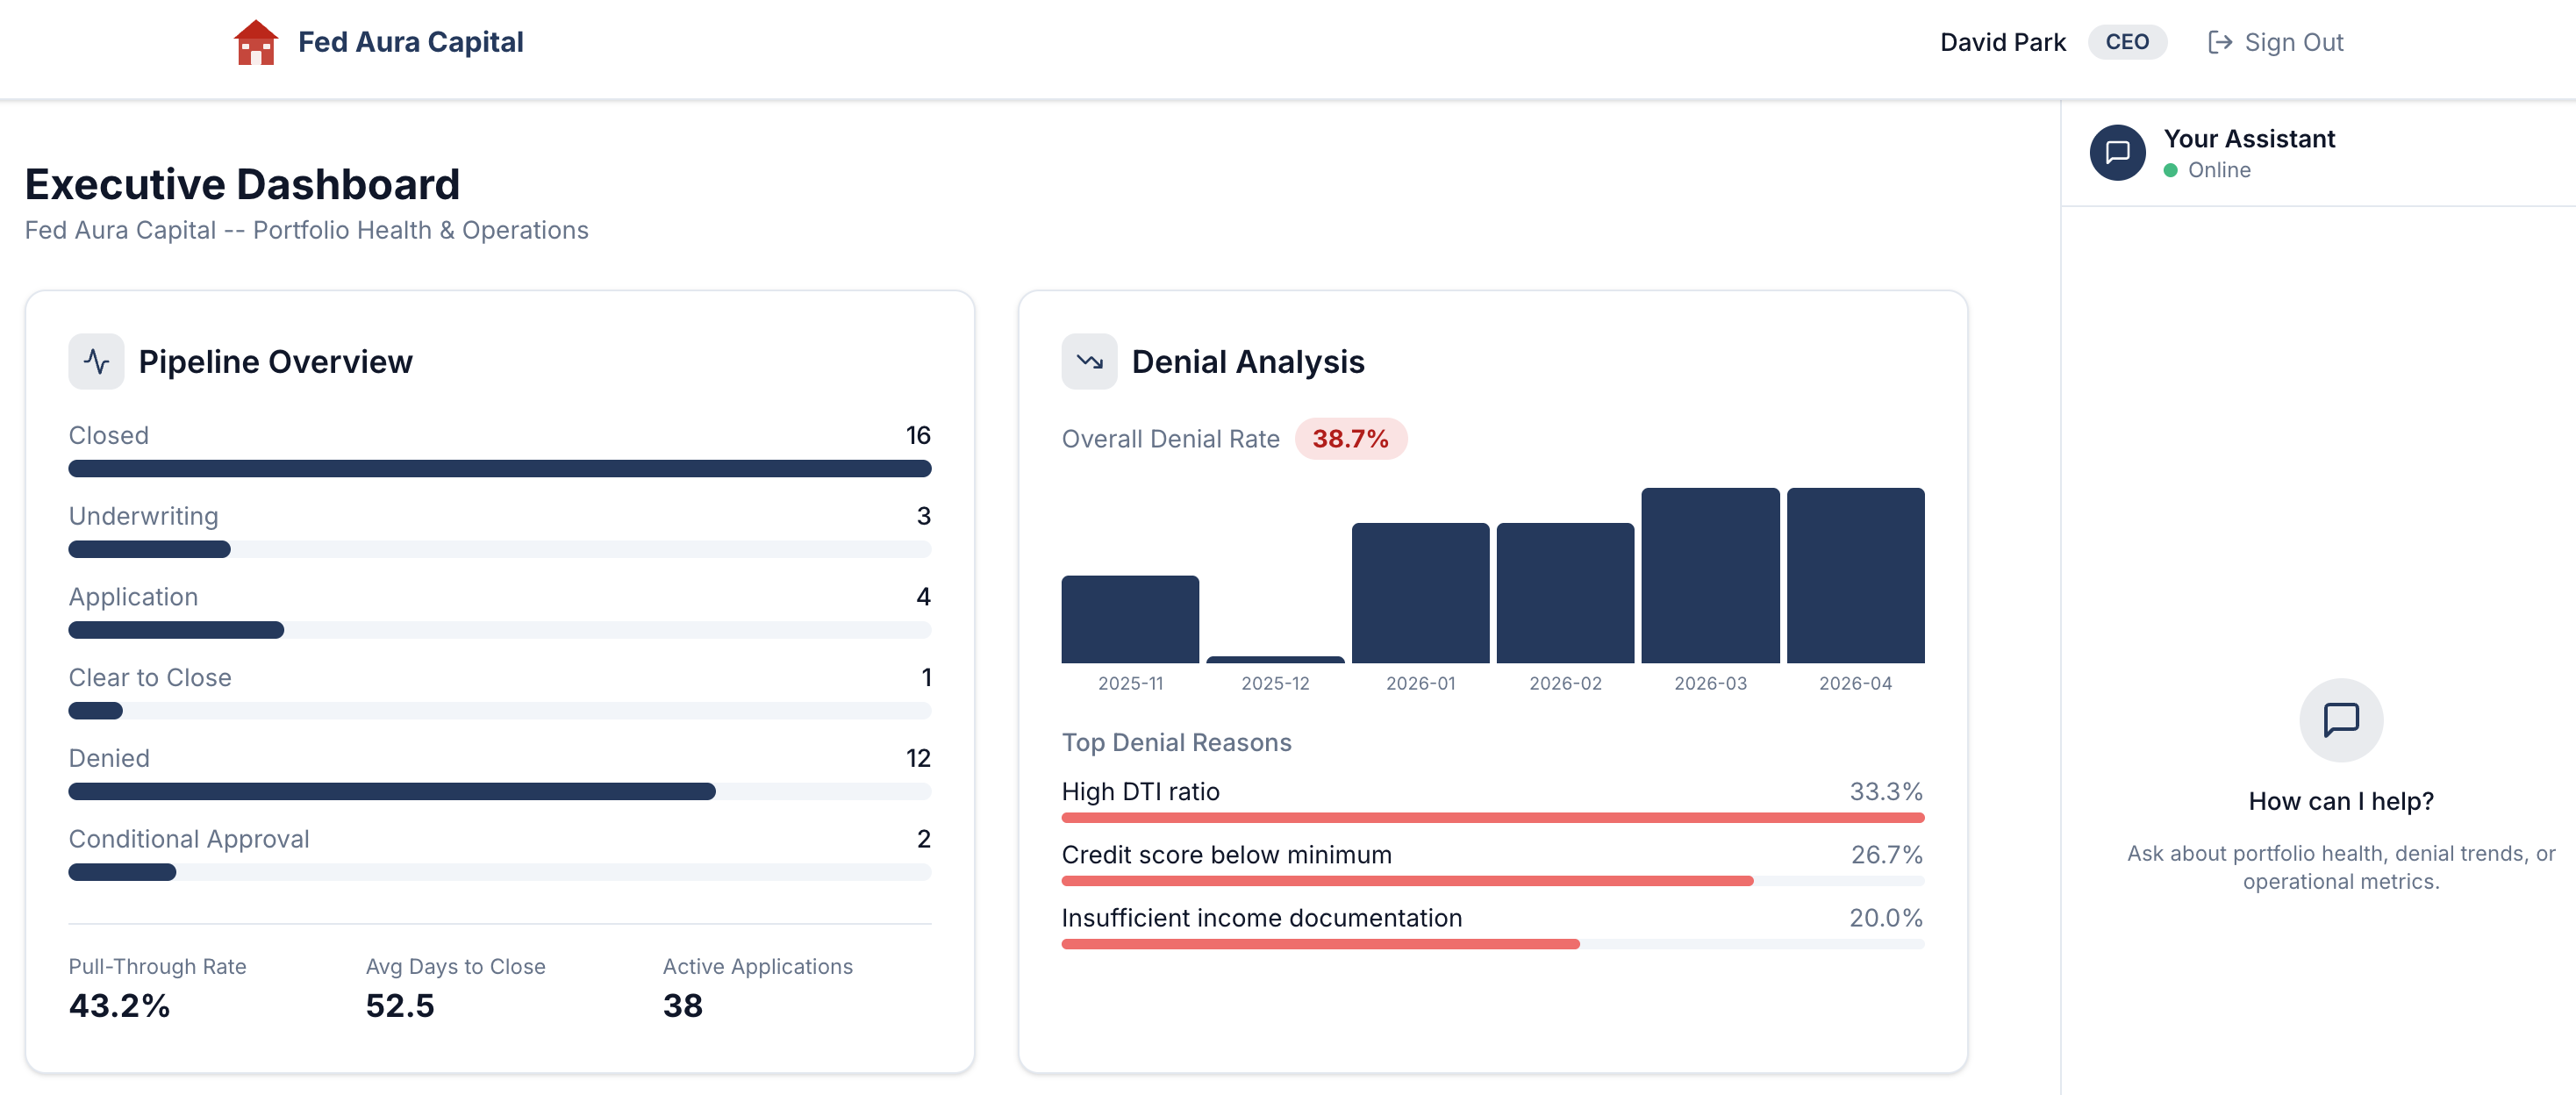
After signing in, you’ll land on the Executive Dashboard, the CEO persona’s view of portfolio health and operations:
-
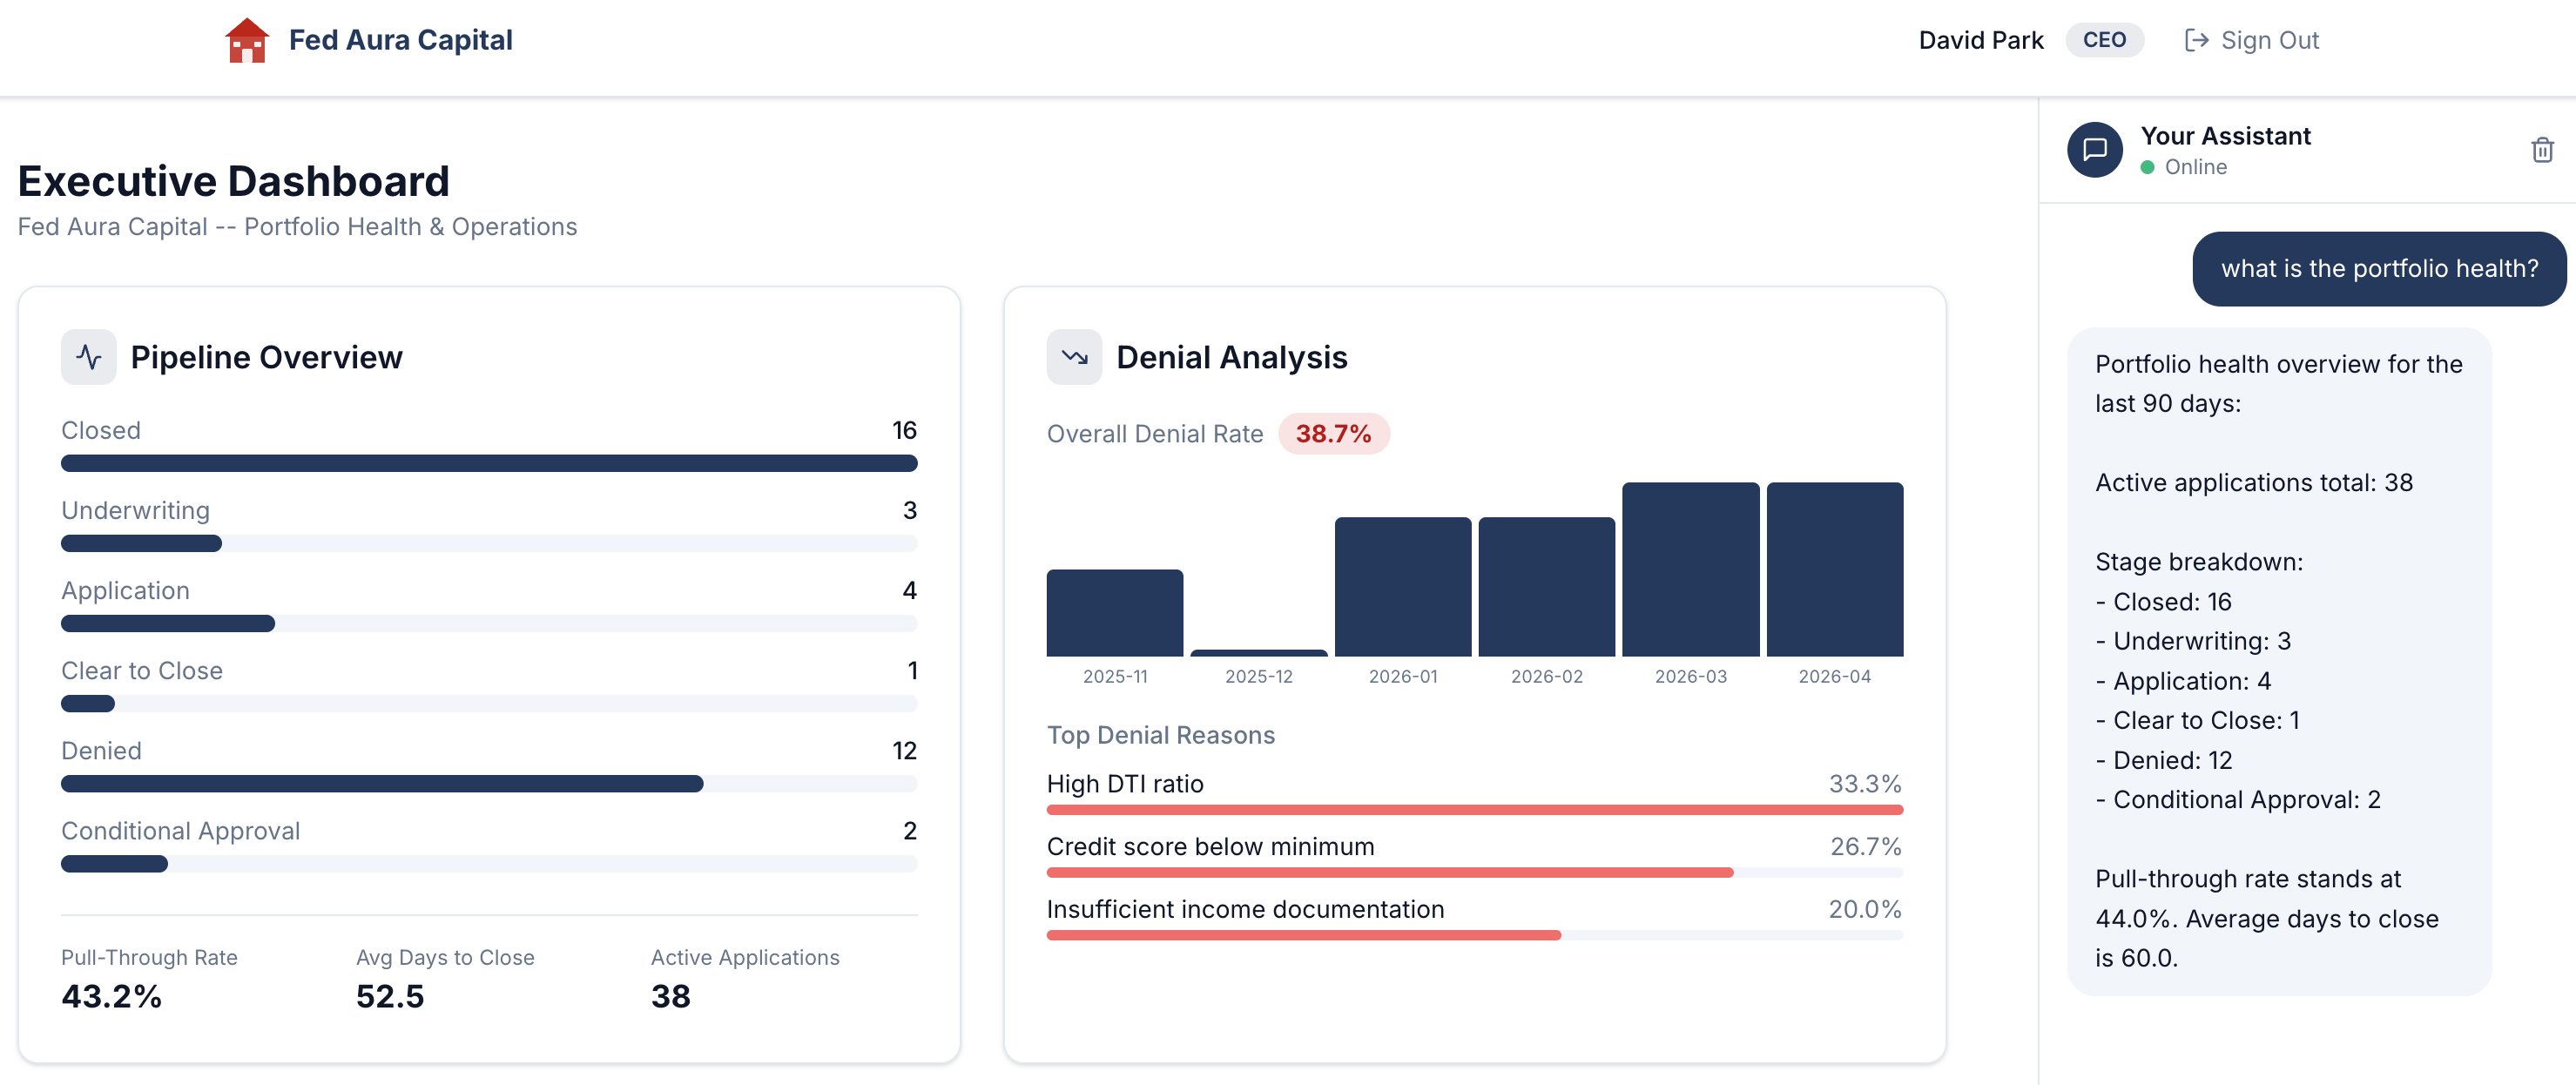
In the Your Assistant chat panel on the right, type the following question (if needed, adjust the center divider to reveal the chat panel or select the chat icon in the bottom right corner):
Show me the current pipeline status -
The assistant responds with a detailed portfolio health overview: active applications, stage breakdown, pull-through rate, and average days to close:
Build a conversation for later analysis
Before we move on, let’s generate a richer session with multiple conversation exchanges (called "turns" in AI terminology — each turn is one question from you and one response from the agent). This will give us more data to explore when we get to tracing in Module 4.
-
In the same chat, ask a follow-up question:
What are the denial trends? -
Then ask one more:
How are my loan officers doing?
Each question triggers a different tool call behind the scenes. By the time you finish, your CEO session will have 3 turns spanning pipeline health, denial analysis, and officer performance. In Module 4, you’ll trace every step of this conversation end-to-end.
The observability challenge
The response looks great. But stop and think about what just happened behind the scenes:
-
Which agent processed your question? Was it a single agent, or did multiple agents collaborate?
-
Which tools did the agent invoke to gather pipeline data, denial rates, and performance metrics?
-
How long did each step take? Was the LLM call fast, or did a tool call add latency?
-
What if the response was wrong? How would you trace back to the root cause?
-
What if a tool call failed silently? Would you even know?
Without proper observability instrumentation, these questions are unanswerable. The application gives you a polished response, but the entire decision-making process (the agent routing, tool invocations, LLM calls, and data retrieval) remains a black box.
Why traditional monitoring isn’t enough:
Traditional application monitoring tracks HTTP requests, error rates, and response times. For the mortgage-ai API, that means you’d see:
-
POST /api/ceo/chat→ 200 OK, 2.3s response time
But you wouldn’t see:
-
Which tools the CEO agent called (
get_pipeline_summary,calculate_pull_through_rate) -
How many LLM calls happened (was it 3 or 8?)
-
Which call took 1.8s of that 2.3s total
-
Whether the agent retrieved the correct data from the database
-
If any tool calls failed silently but the agent still generated a response
This is why AgentOps requires specialized observability: you need to see inside the decision-making process, not just the HTTP wrapper around it. In the next modules, you’ll learn how to instrument this visibility using the 3 pillars of observability.
Under the hood: Production-ready AI patterns
This application demonstrates key patterns for regulated industries:
-
Multi-agent orchestration: 5 LangGraph agents with role-scoped tools and RBAC enforcement
-
Compliance knowledge base: RAG using pgvector with tiered boosting (federal regulations > agency guidelines > internal policies)
-
Model routing: Complexity-based routing between fast and capable LLM tiers
-
Comprehensive audit trail: Hash-chained, append-only audit events with MLflow trace correlation
-
PII masking: Middleware-based masking for executive roles (SSN, DOB, account numbers)
-
Safety shields: Input and output content filters with escalation pattern detection
Module summary
What you accomplished:
-
Explored the 5 agent personas and the multi-agent architecture
-
Interacted with agents via the application UI
-
Experienced the observability gap in distributed AI systems
Key takeaways:
-
Multi-agent systems distribute decision-making across multiple components
-
A single API can serve multiple agent personas with different capabilities
-
Specialized observability approaches are required for AgentOps
Next steps:
Module 2 will introduce the 3 pillars of observability (metrics, logs, and traces) and how different personas (SRE/Platform Engineering vs. AI Developer/Engineer) approach monitoring these systems.