Module 4: Tracing and MLflow
Metrics tell you what is happening, but traces tell you why. In this module, you’ll explore MLflow tracing to gain end-to-end visibility into the Fed Aura Capital multi-agent mortgage system. You’ll trace the requests you made in Module 1 across LangGraph agents and tool calls, closing the observability gap you experienced firsthand.
| In this module, you’re wearing both hats: SREs use traces to diagnose latency and failures, while AI Developers use them to understand agent reasoning and tool behavior. |
Learning objectives
By the end of this module, you’ll be able to:
-
Navigate the MLflow UI to find and analyze request traces
-
Correlate traces back to user interactions from Module 1
-
Analyze multi-agent execution timelines, tool calls, and LLM invocations
-
Understand how MLflow captures user identity, inputs, outputs, and latency
Introduction to MLflow tracing
MLflow Tracing is an OpenTelemetry-compatible LLM observability solution that captures inputs, outputs, and metadata for each step of a request. For Fed Aura Capital, this means visibility into the complete path of loan applications across agents, every LLM call with its prompt and response, all tool invocations, and agent decision points. Each request creates a trace (the complete request flow) composed of spans (individual operations like LLM calls or tool invocations) organized in a parent-child tree showing what called what.
Exercise 1: Access the MLflow tracking server
Red Hat OpenShift AI includes MLflow as part of the platform.
-
Navigate to the MLflow Console tab. If prompted, log in with username
user1, passwordopenshift. Then selectwksp-user1from the Select workspace dropdown in the top-left corner: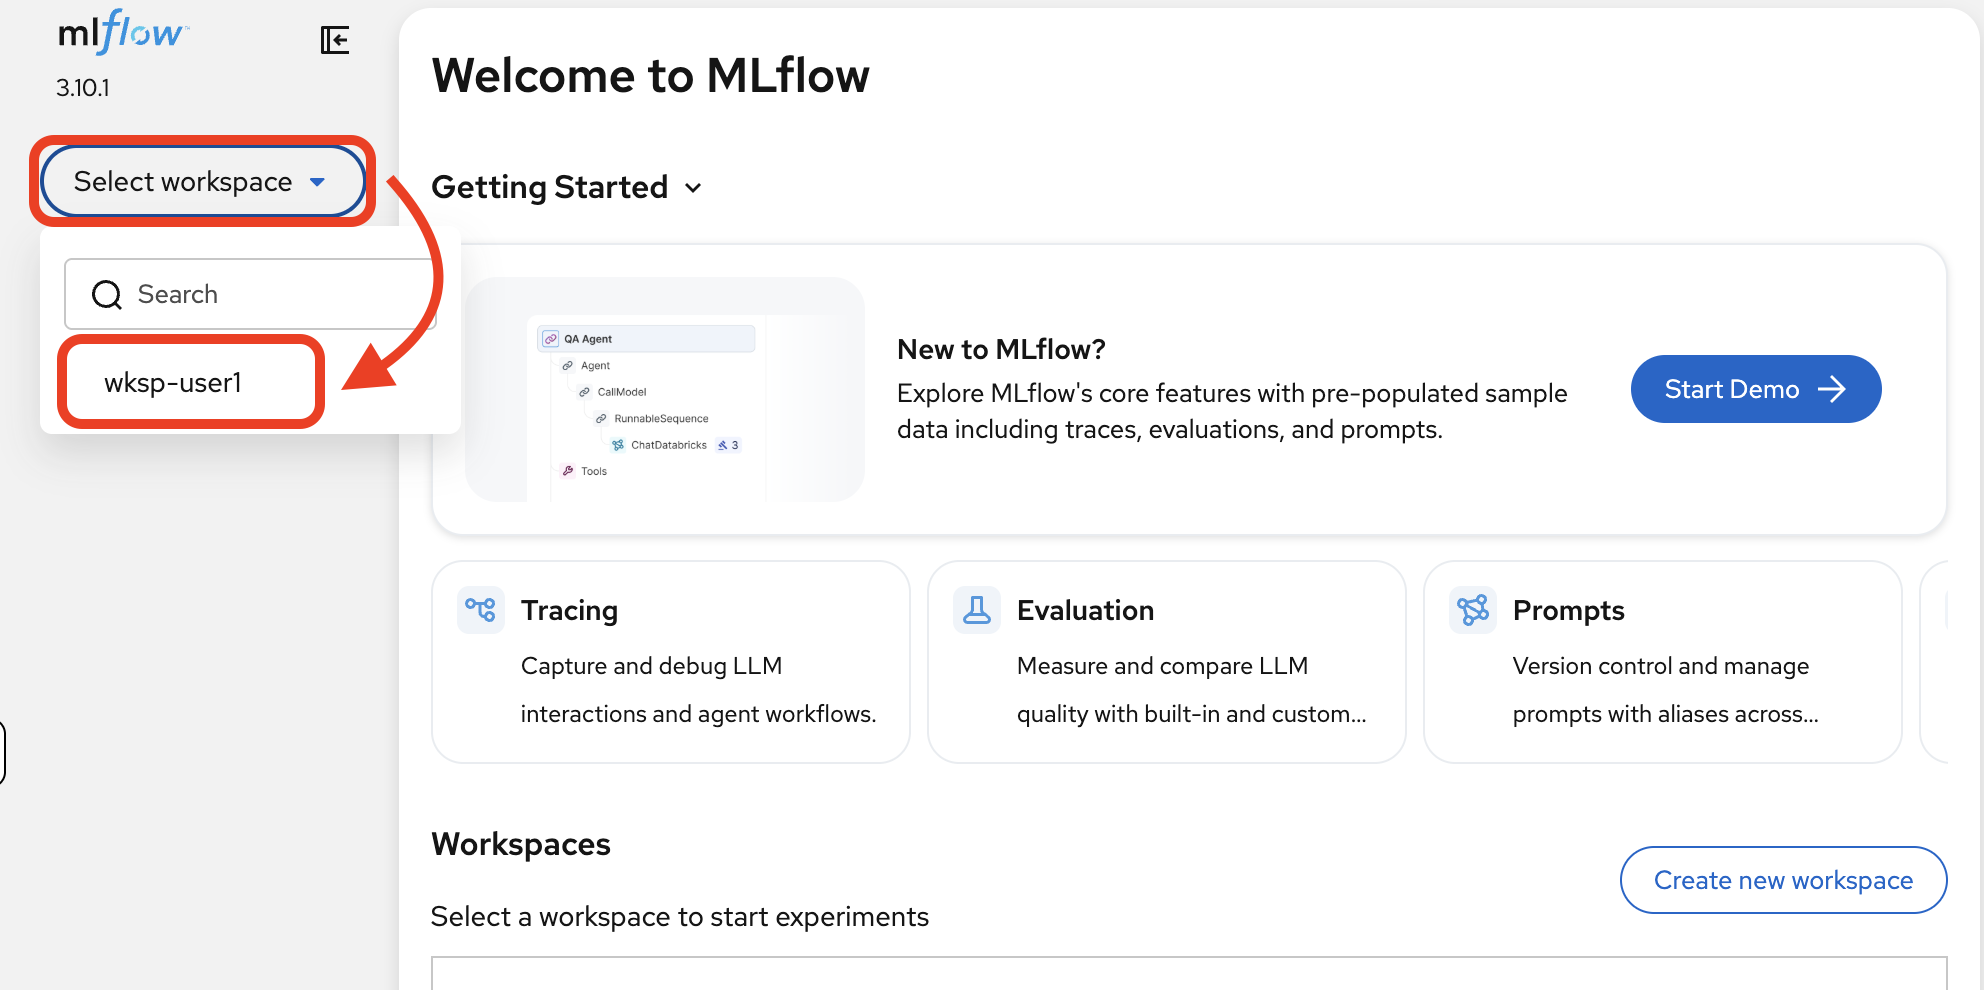
Red Hat OpenShift AI (RHOAI) deploys a single shared MLflow instance that provides namespace-based isolation through workspaces. Each data science project (OpenShift namespace) maps to its own MLflow workspace, giving teams logically separated experiments, traces, registered models, and prompts, all while sharing a single tracking server. -
MLflow provides three main capabilities. For this module, you’ll focus on Tracing to analyze the agent workflows from Module 1:
-
Tracing: Capture and debug LLM interactions and agent workflows
-
Evaluation: Measure and compare LLM quality with built-in and custom scorers (Module 5)
-
Prompts: Version control and manage prompts with aliases across teams (Module 5)
-
How does tracing work?
When you deployed the mortgage-ai application in Module 1, tracing was already enabled. You never had to configure it manually. Every LLM call, tool invocation, and agent decision was recorded automatically. Here’s how.
MLflow autolog: one-line tracing
MLflow Tracing integrates with 40+ popular LLM and AI agent frameworks, offering a one-line automatic tracing experience. Call autolog() once at application startup, and all your LangChain operations (LLM calls, tool invocations, agent decisions) are automatically captured—no changes needed to your agent logic.
The mortgage-ai application uses LangChain autologging. In observability.py, the entire tracing setup is:
import mlflow
import mlflow.langchain

mlflow.set_tracking_uri(settings.MLFLOW_TRACKING_URI)
mlflow.set_experiment(settings.MLFLOW_EXPERIMENT_NAME)
mlflow.langchain.autolog() (1)| 1 | This single line enables automatic tracing for all LangChain and LangGraph operations: every LLM call, tool invocation, and agent decision is captured as spans without any code changes to the agents themselves. |
MLflow’s automatic tracing provides:
-
Zero code changes for basic observability: autolog hooks into the framework at the library level
-
Unified traces across multi-framework apps: LangChain, LangGraph, and custom tools all appear in a single trace
-
Rich metadata including inputs, outputs, token counts, model names, and latency
-
Production-ready scaling: traces are sent asynchronously to avoid blocking the application
OpenTelemetry compatibility
MLflow Tracing is built on OpenTelemetry, the industry standard for distributed tracing. This means you can also export traces to other backends (Jaeger, Zipkin, Grafana Tempo) alongside MLflow.
Exercise 2: Find your first trace
In Module 1, you clicked Explore Products and chatted with the Prospect Agent. That conversation looked like a simple exchange, but MLflow captured every step. Let’s find that trace.
-
In MLflow, click Experiments in the left sidebar, then select the mortgage-ai experiment. This is the experiment configured by the mortgage-ai application where all traces are recorded.
-
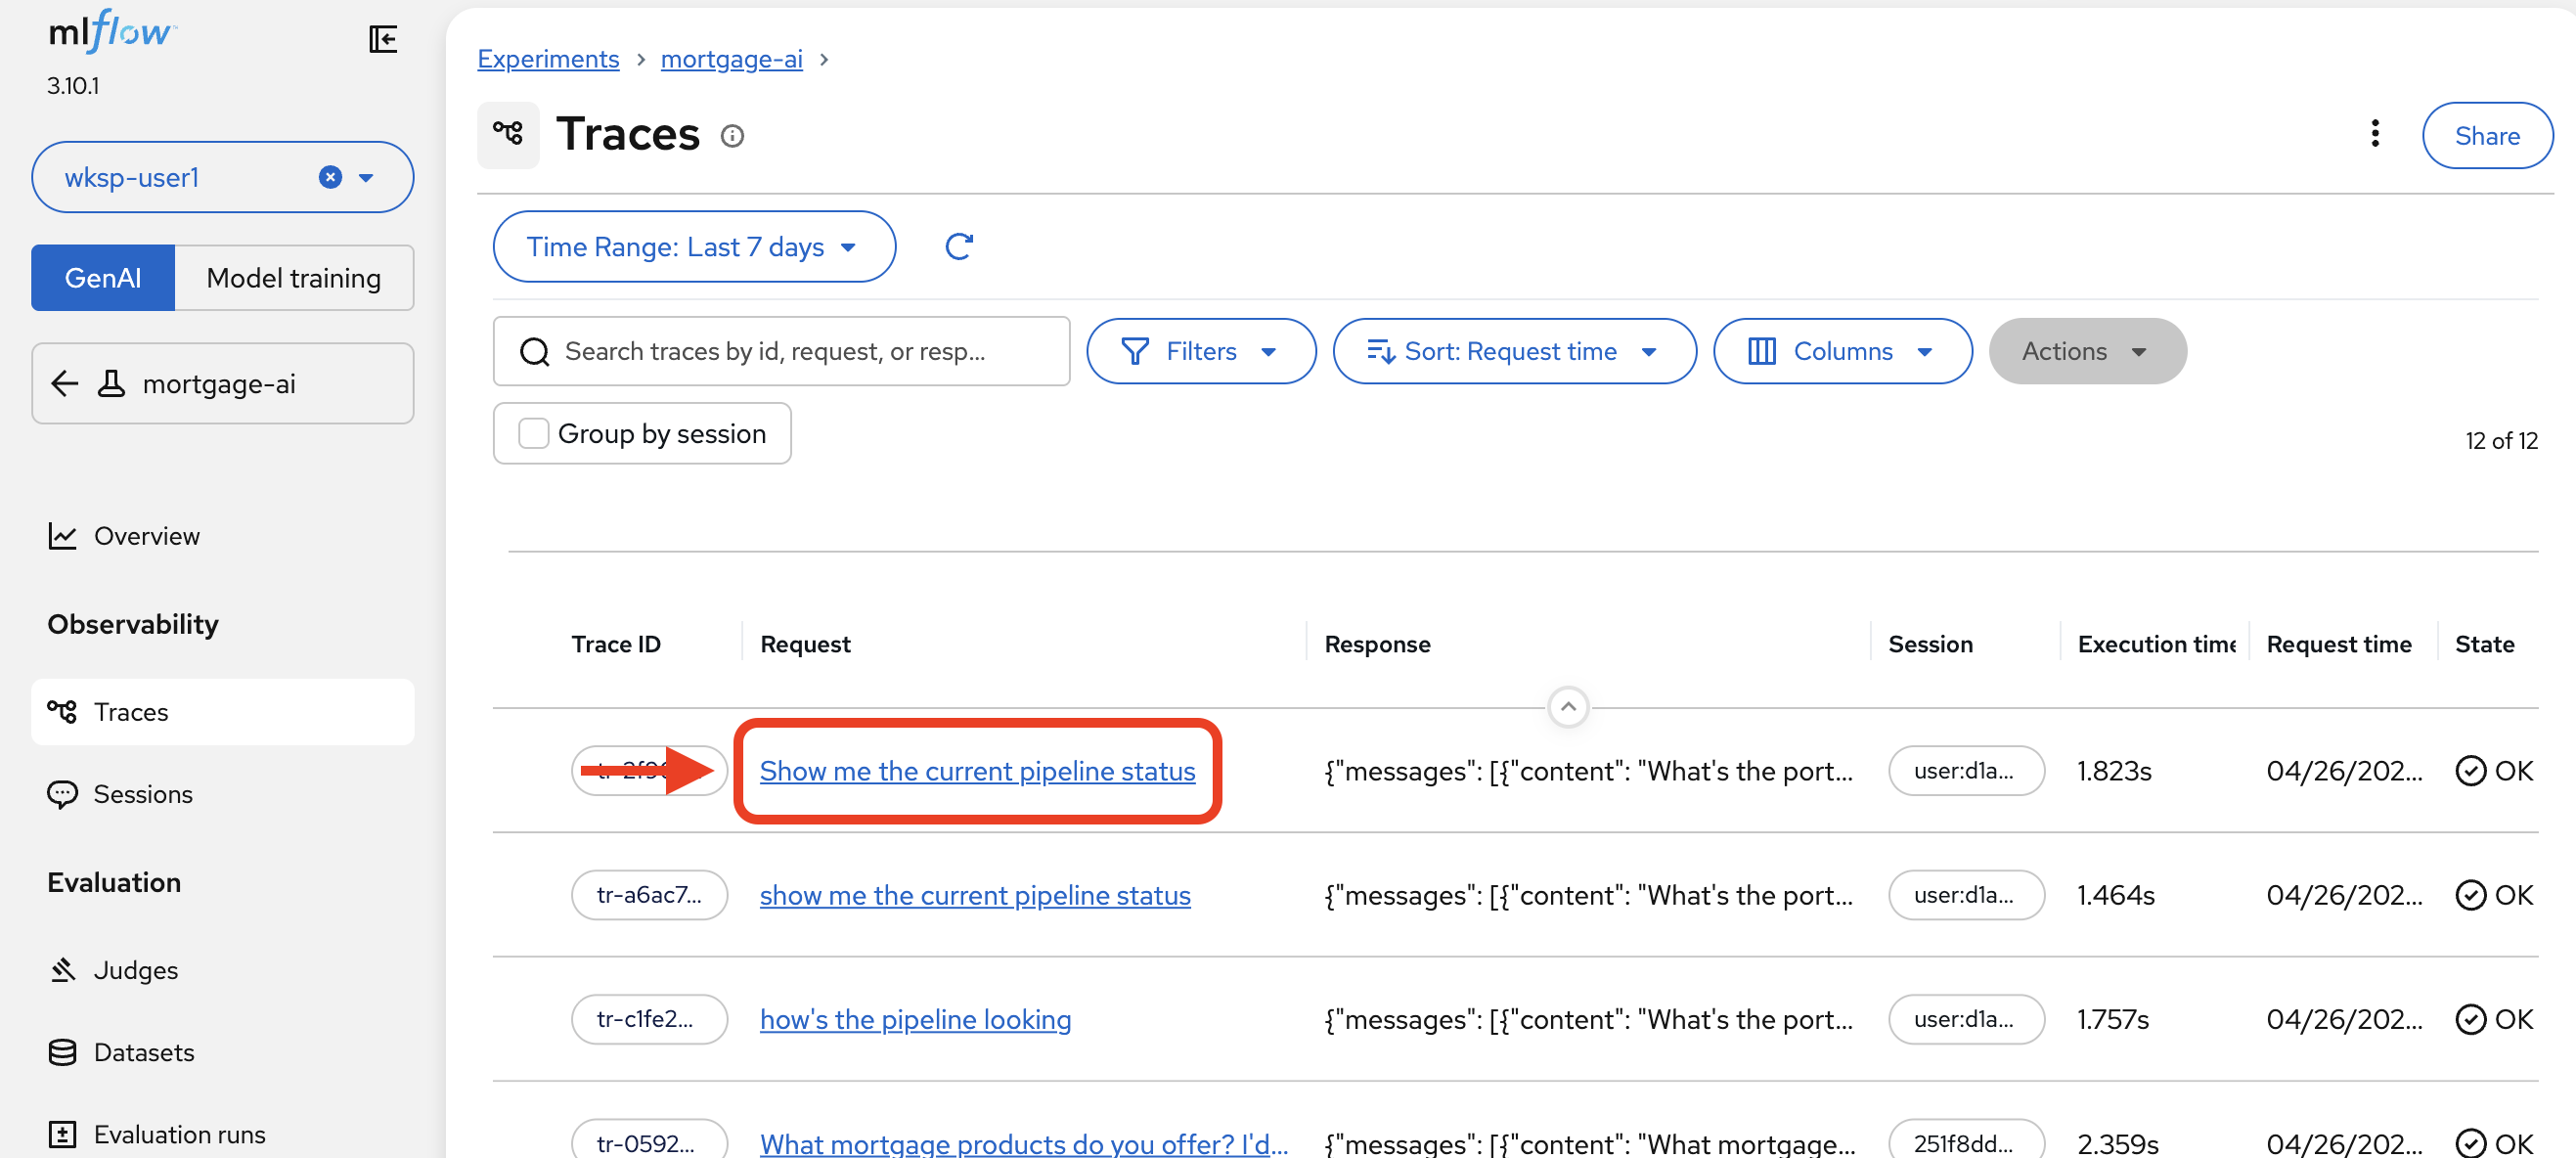
Click Traces in the left sidebar. You’ll see a list of all traced requests, sorted by most recent:
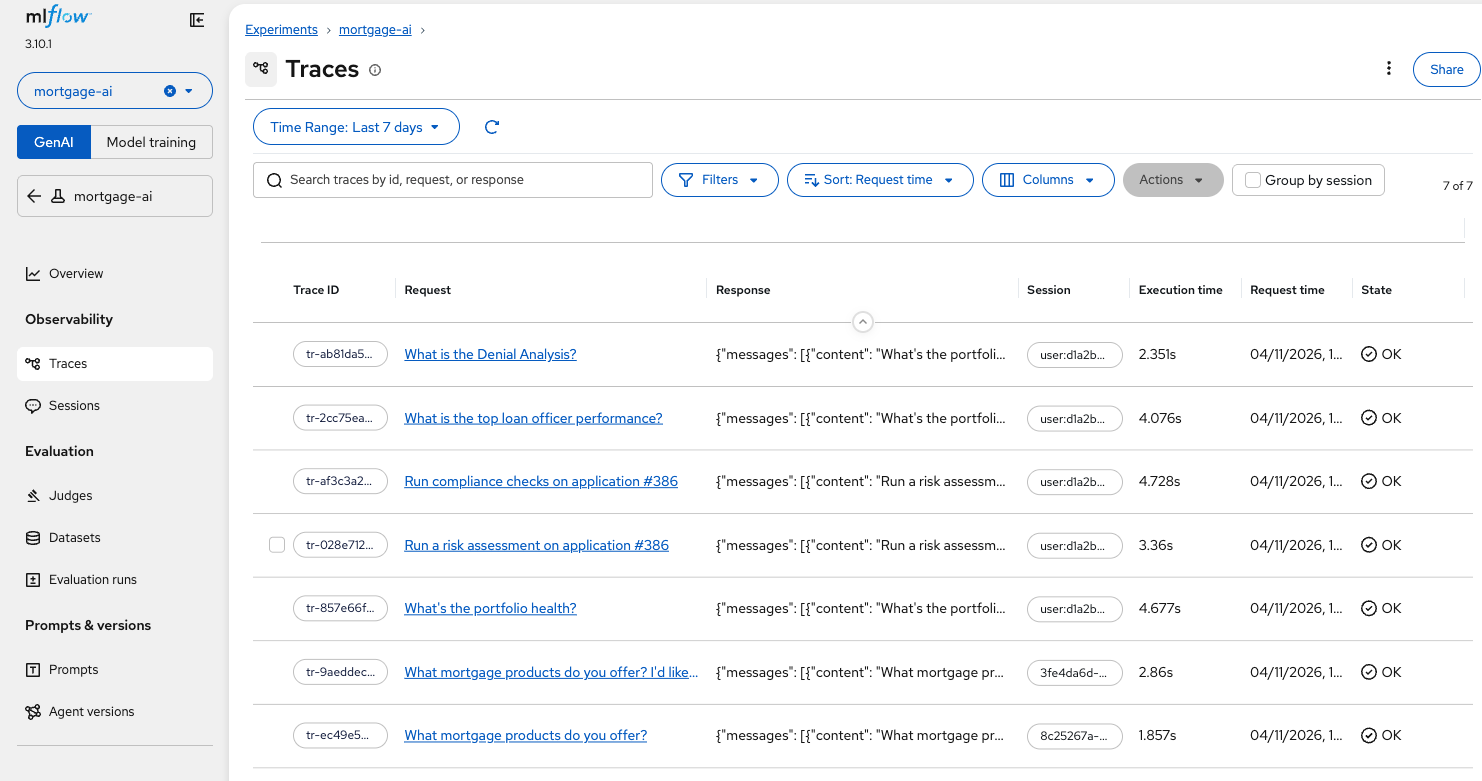
Each row shows the Trace ID, the Request (what the user asked), the Response (what the agent returned), Execution time, and State. Notice the trace at the bottom, "What mortgage products do you offer? I’d like…", this is the Explore Products conversation from Module 1.
-
Click on that trace to open its Summary view:
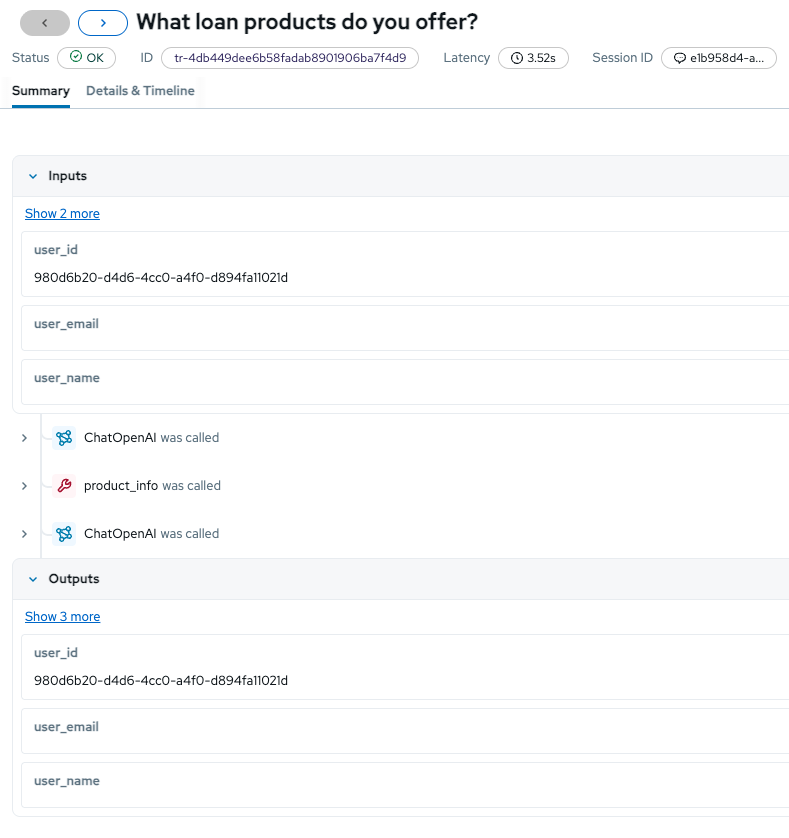
The Summary tab reveals what was invisible in Module 1:
-
Inputs: The user context passed to the agent
-
Span sequence: The operations that executed (
ChatOpenAI was called, tool invocations, and follow-up LLM calls) -
Outputs: The complete response returned to the user, including metadata
-
Exercise 3: Analyze the CEO trace end-to-end
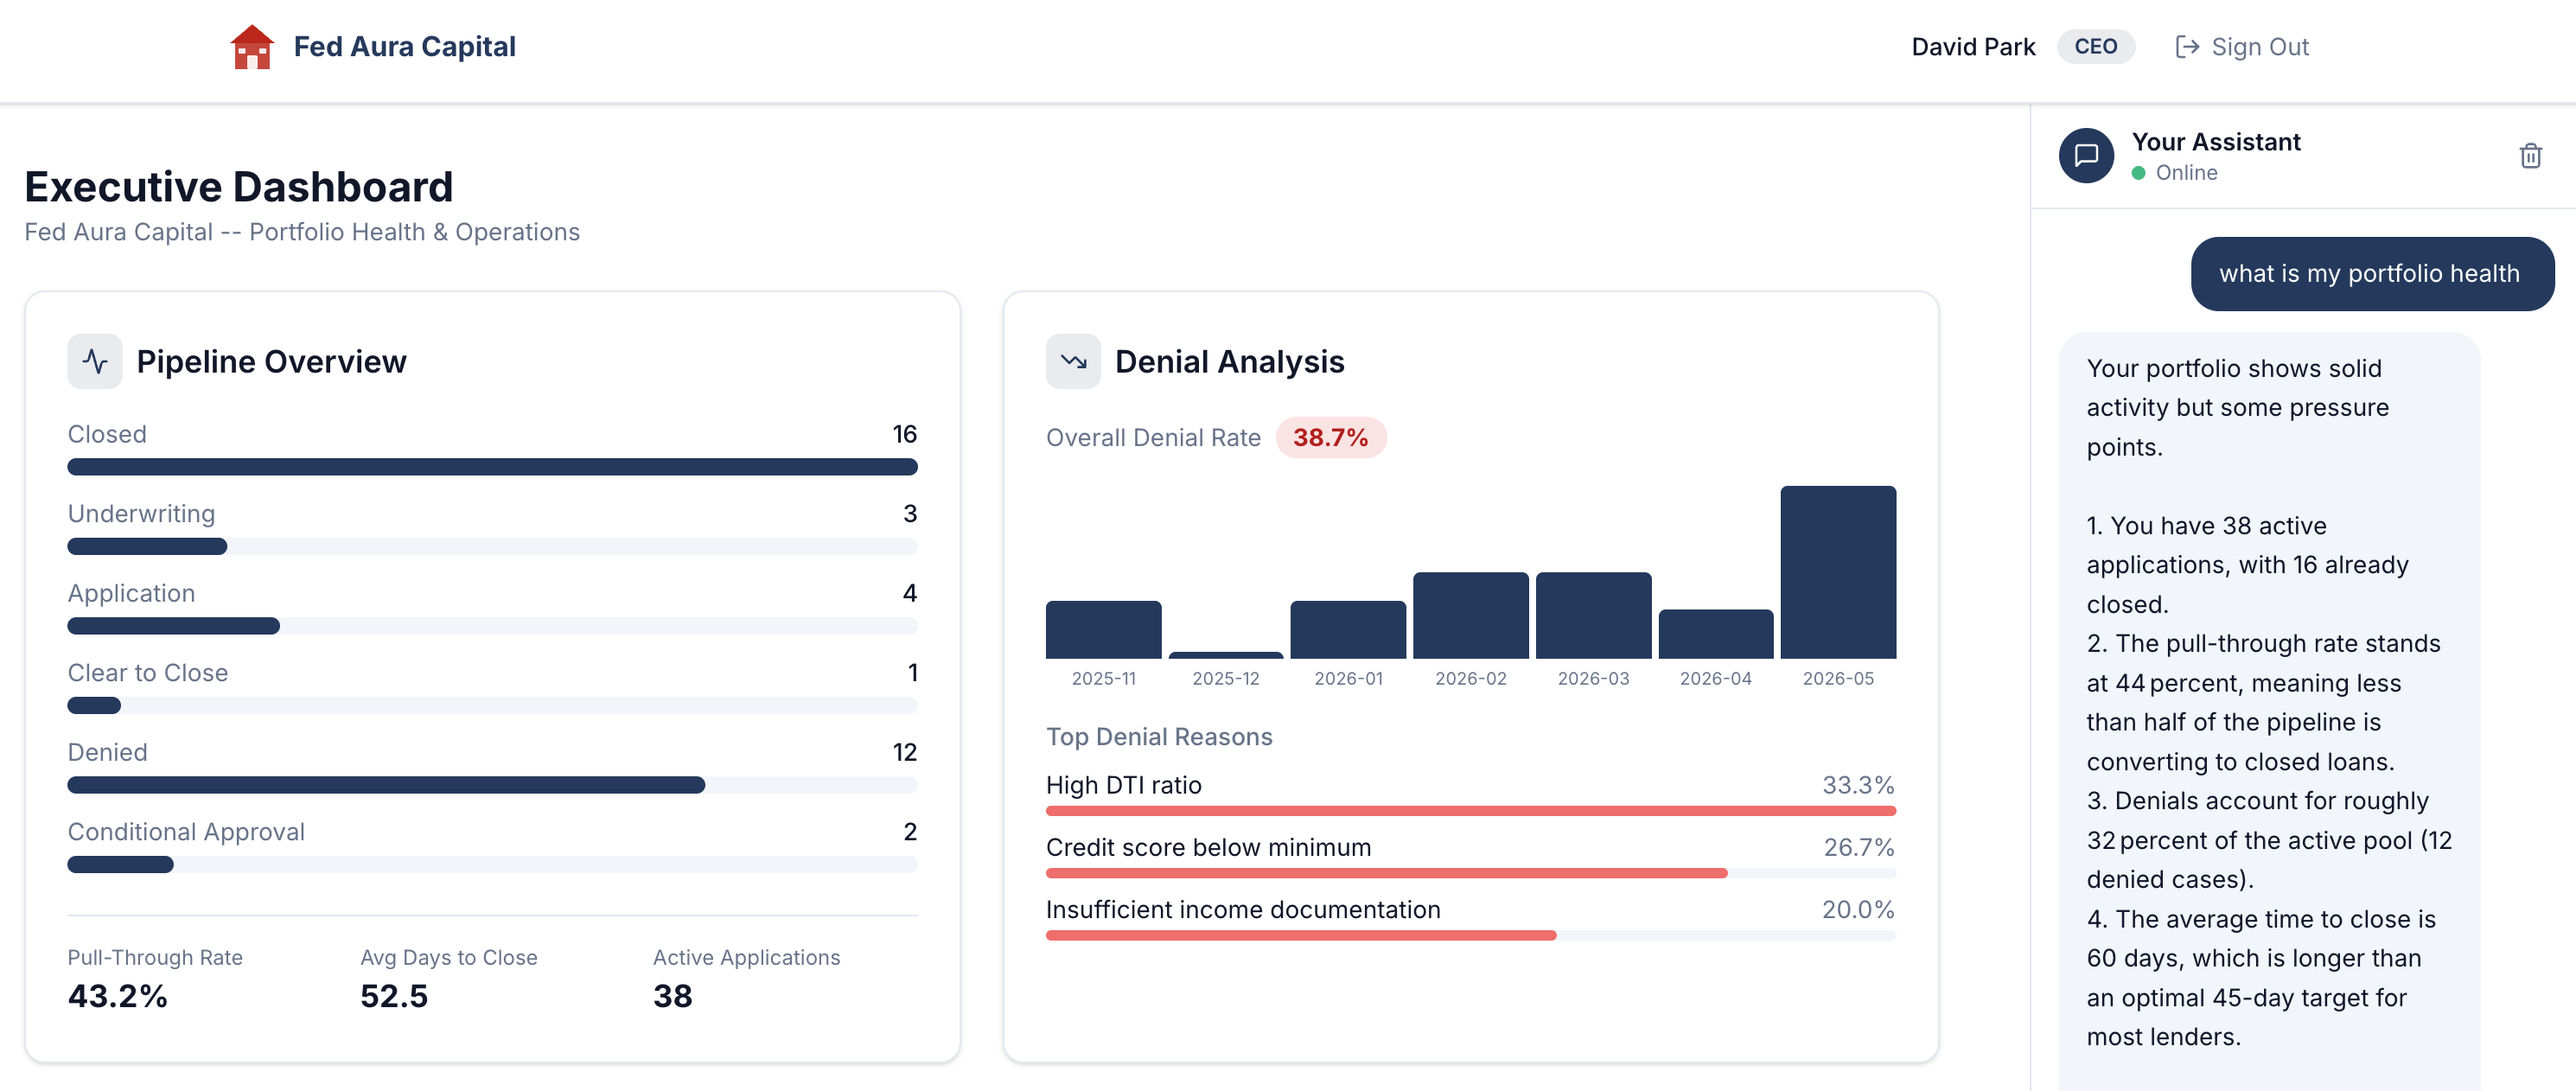
Remember Module 1, Exercise 3? You signed in as CEO David Park, asked "What is my portfolio health?", and got a detailed response. We pointed out the observability gap: you had no way of knowing which agents processed your question, which tools were invoked, or how long each step took.
Now let’s close that gap.
Find the CEO trace
-
Return to the MLflow Traces list and locate the trace for "Show me the current pipeline status":
Notice the execution time. That’s the total end-to-end latency for a question that seemed to be answered instantly in the chat UI.
Examine user identity tracking
-
Click on the trace to open the Summary tab.
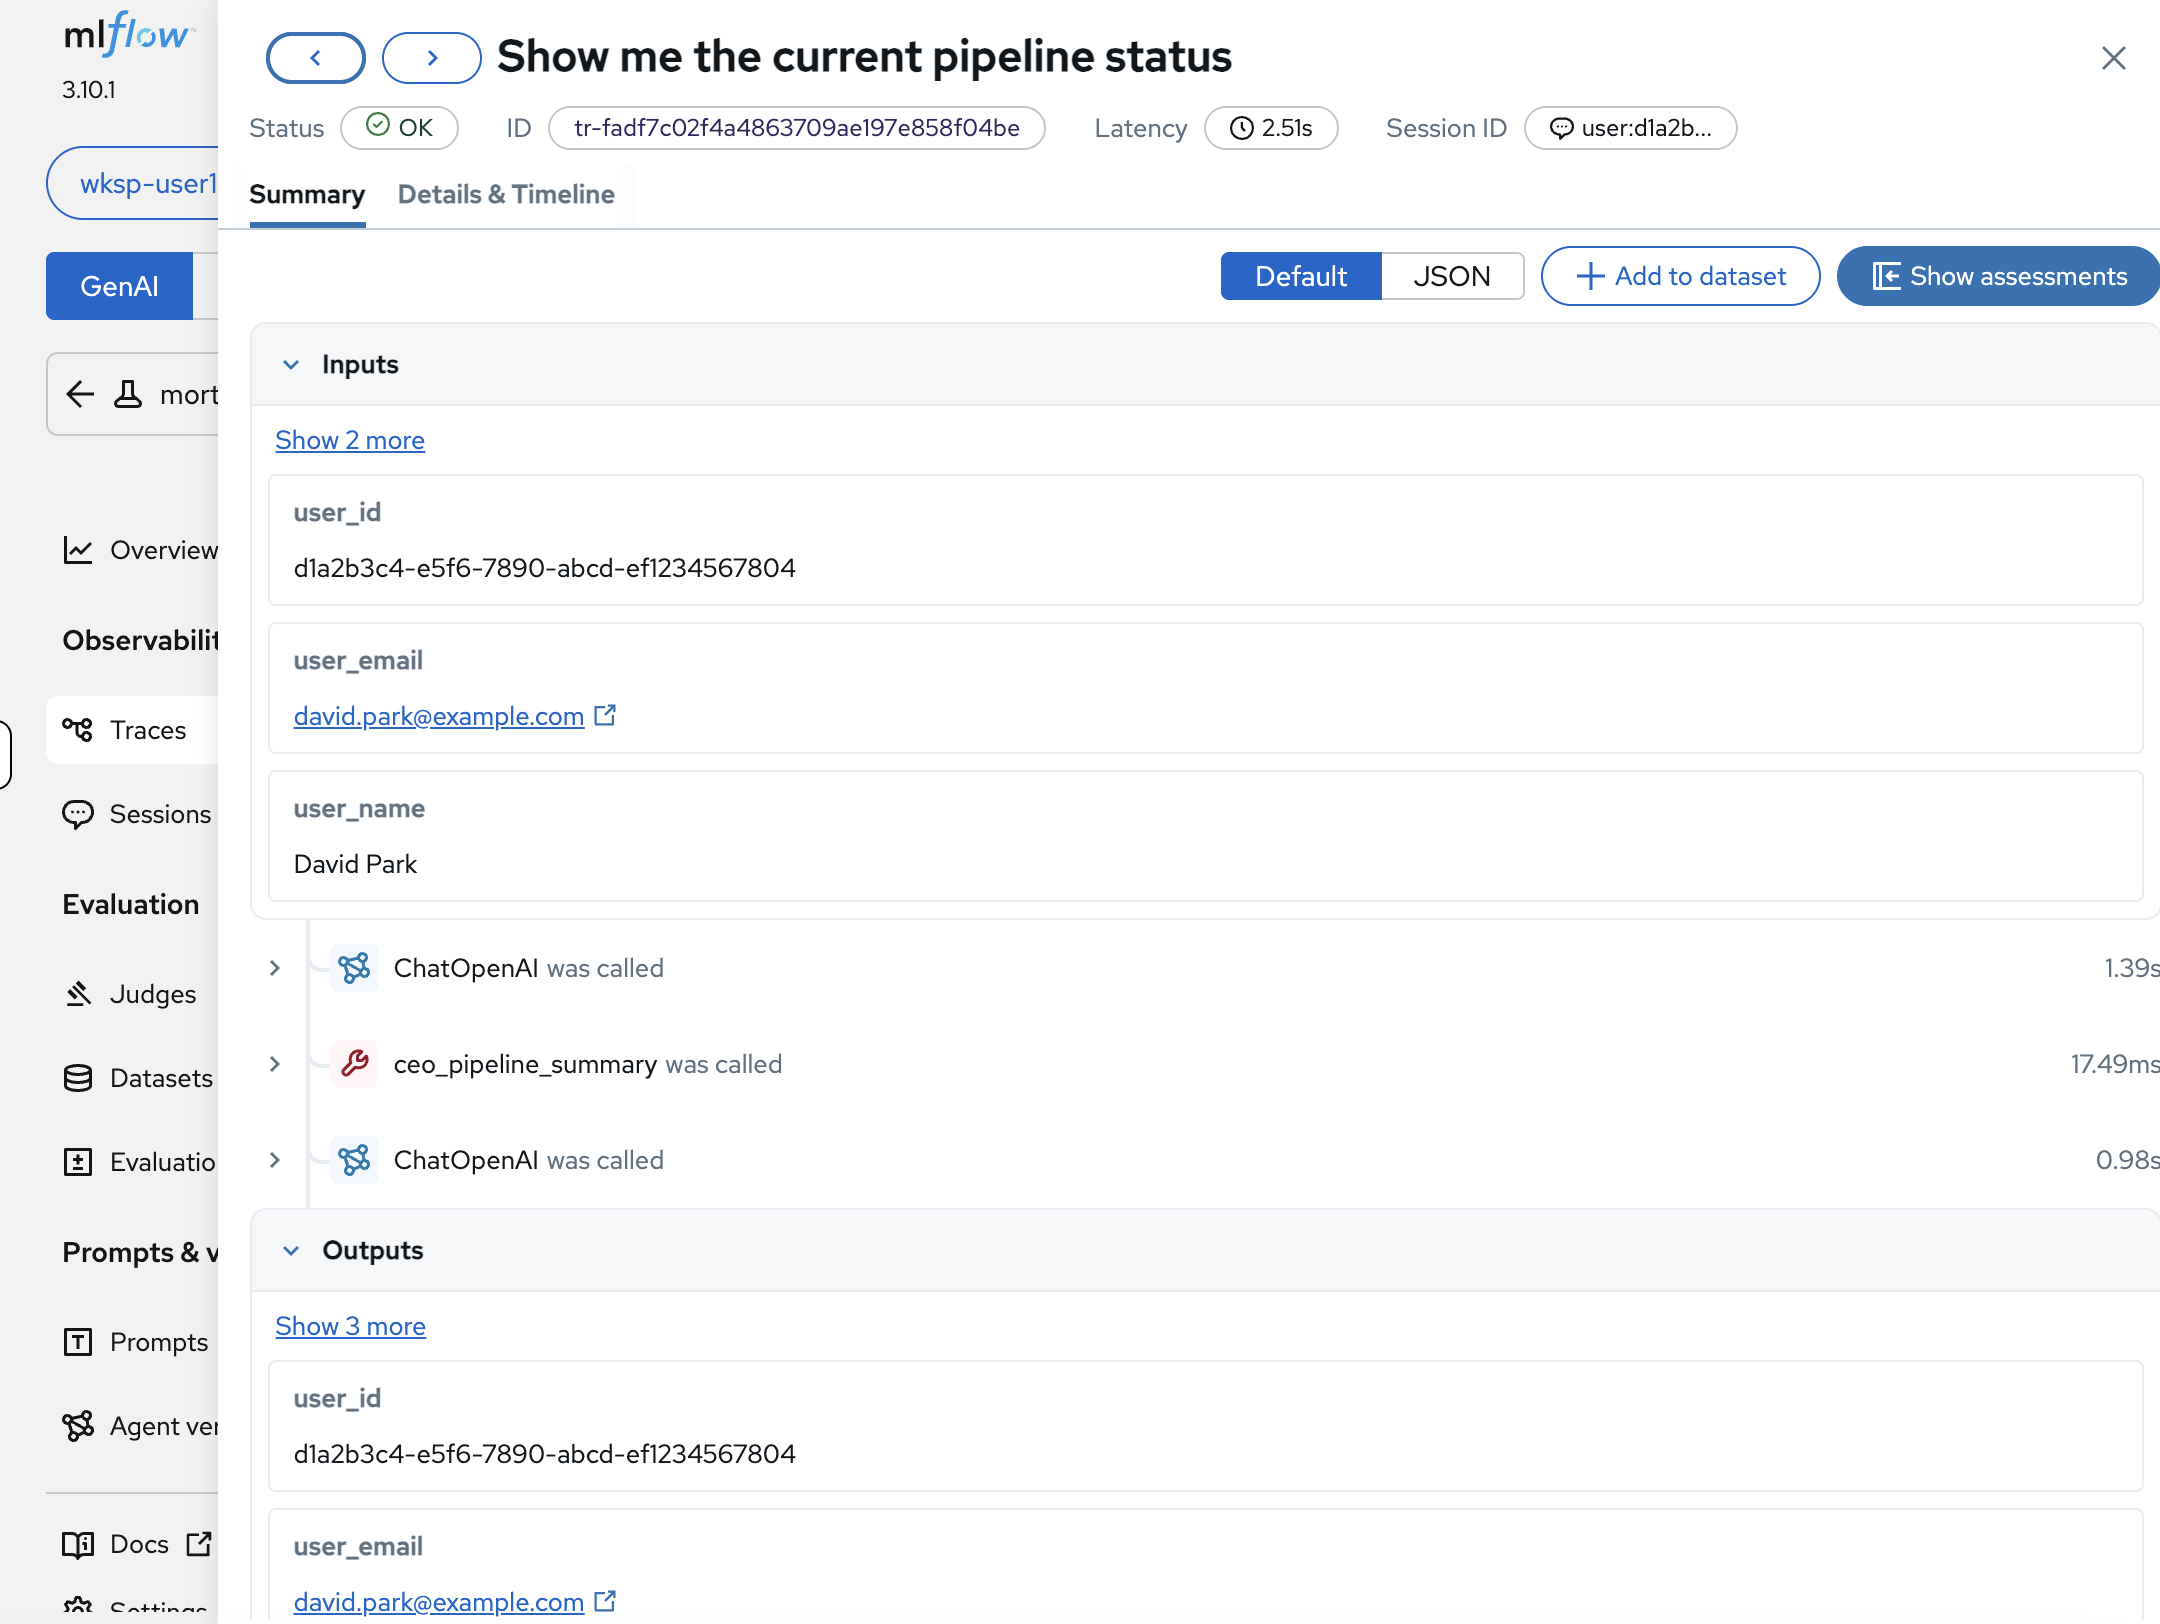
MLflow captures the full user context with every trace:
-
user_id:
d1a2b3c4-e5f6-7890-abcd-ef1234567804, the authenticated user’s UUID -
user_email:
david.park@example.com, traceable identity -
user_name:
David Park, the CEO persona
Below the inputs, the span sequence shows the agent’s execution plan:
ChatOpenAIwas called (the LLM decides what to do), thenceo_pipeline_summarywas called (the tool fetches data), thenChatOpenAIwas called again (the LLM formulates the response).If you don’t see a tool call (e.g., ceo_pipeline_summary) in the span sequence, go back to the Mortgage AI App and ask the same question again. LLMs are non-deterministic: even with an optimized system prompt, the model may occasionally answer from its training data without invoking the tool. Repeat until you see a trace that includes the tool call, then continue with the next steps. -
Explore the execution timeline
-
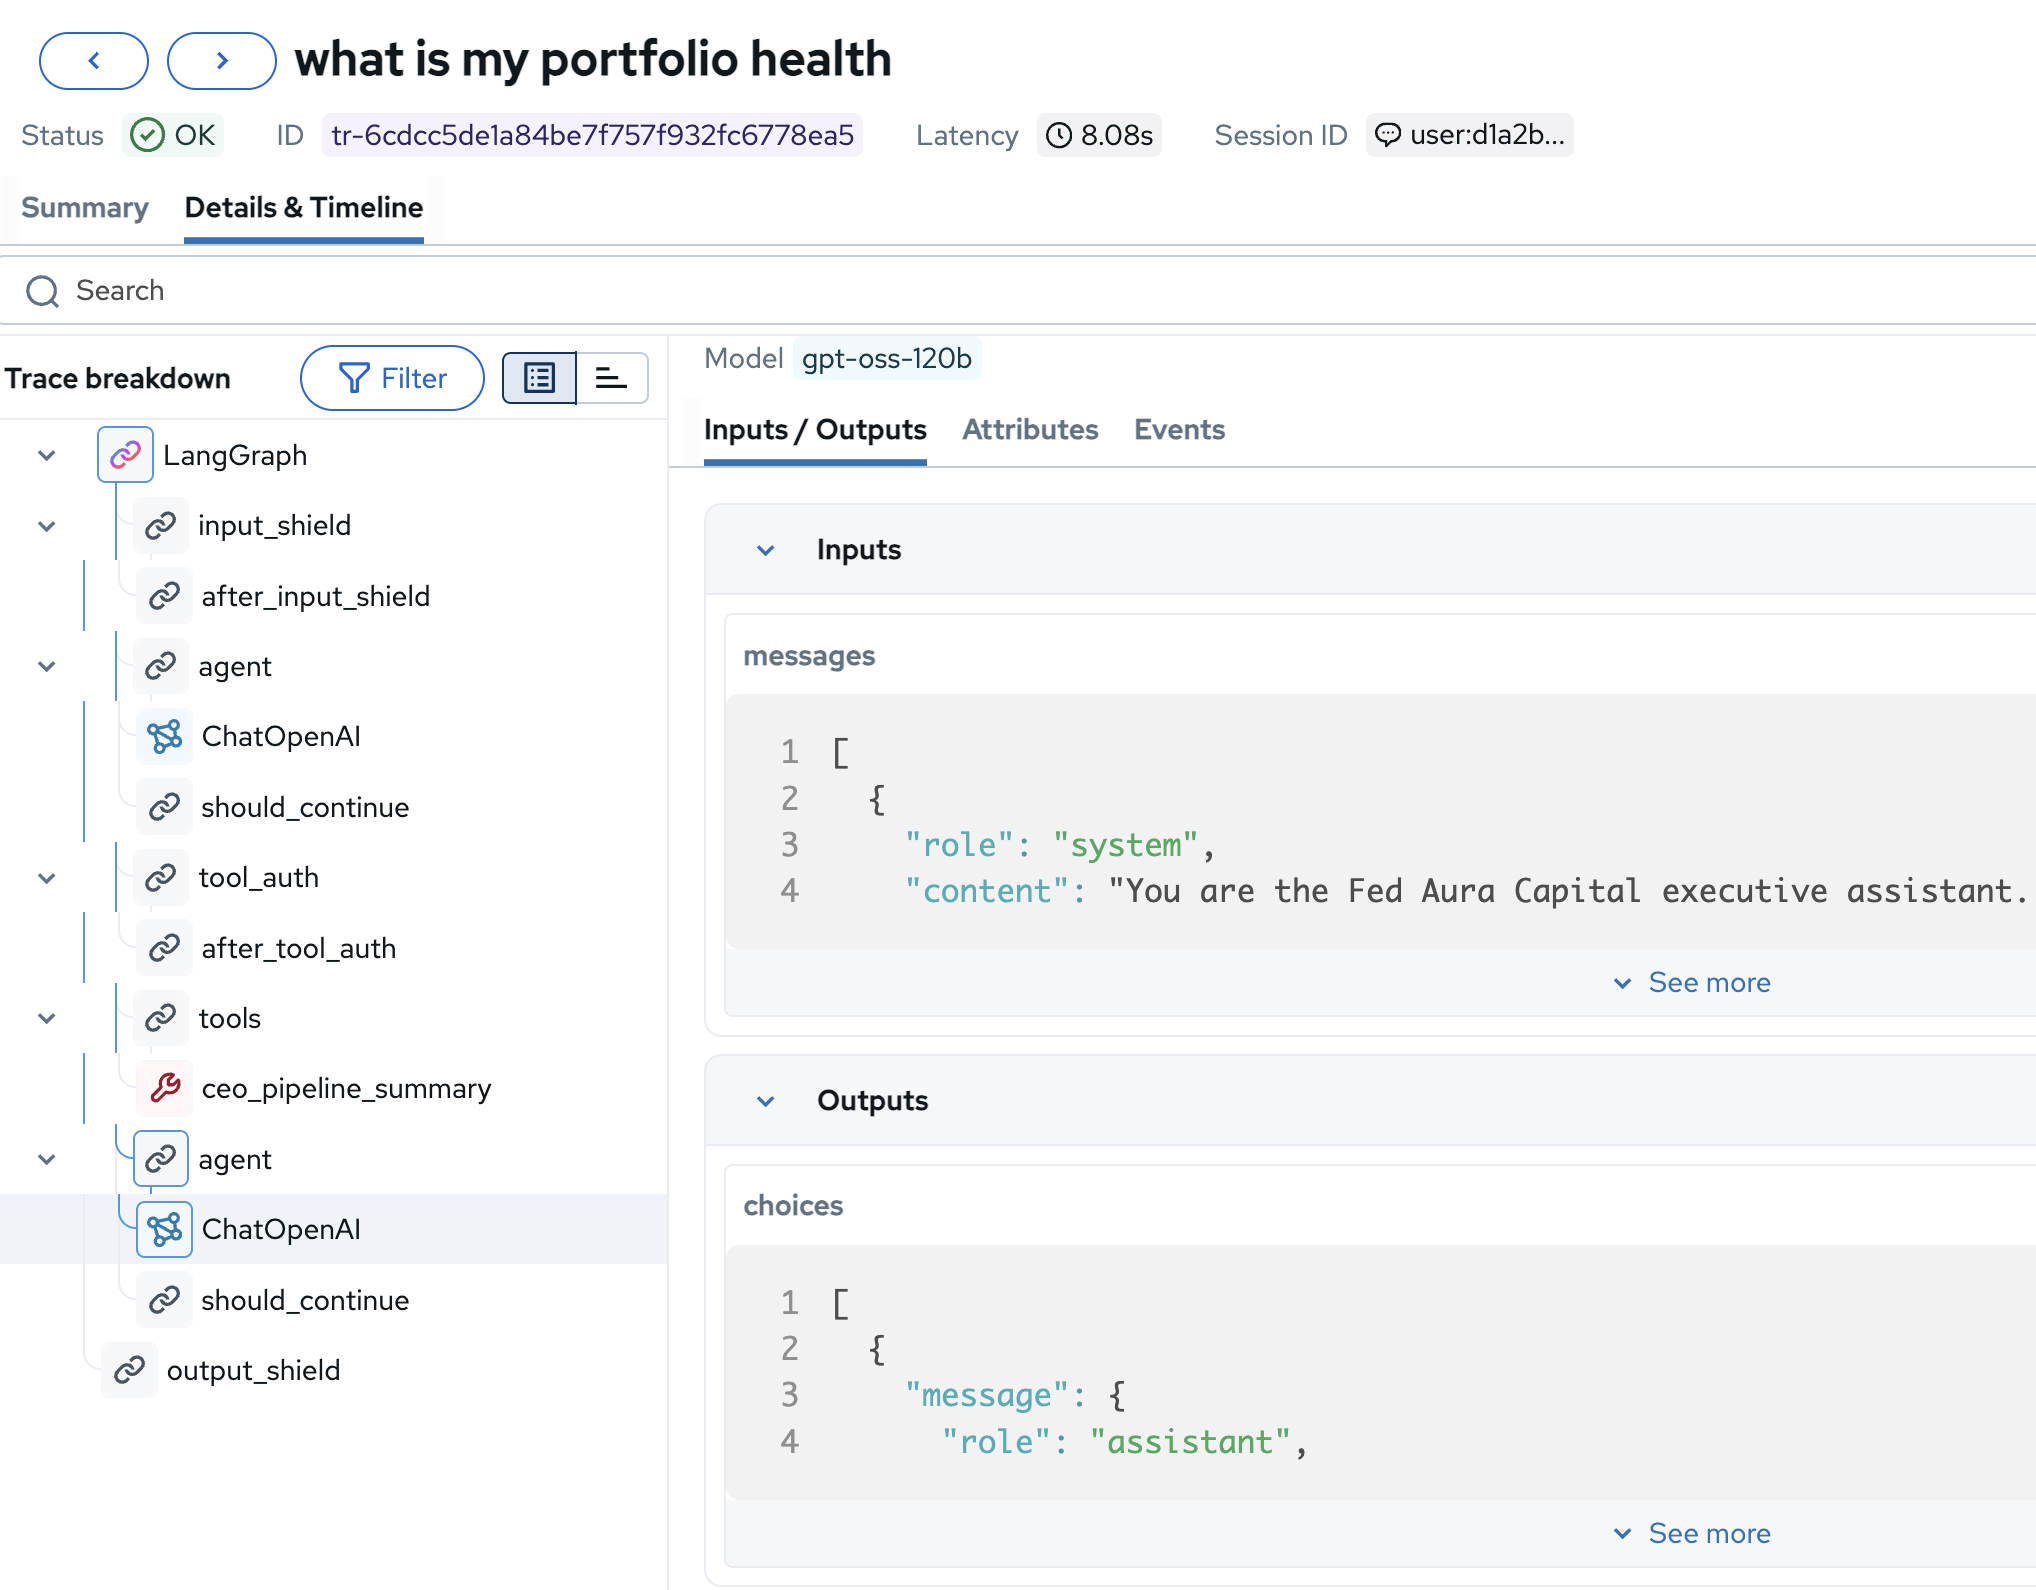
Click the Details & Timeline tab, then click Show execution timeline to see the full trace breakdown:
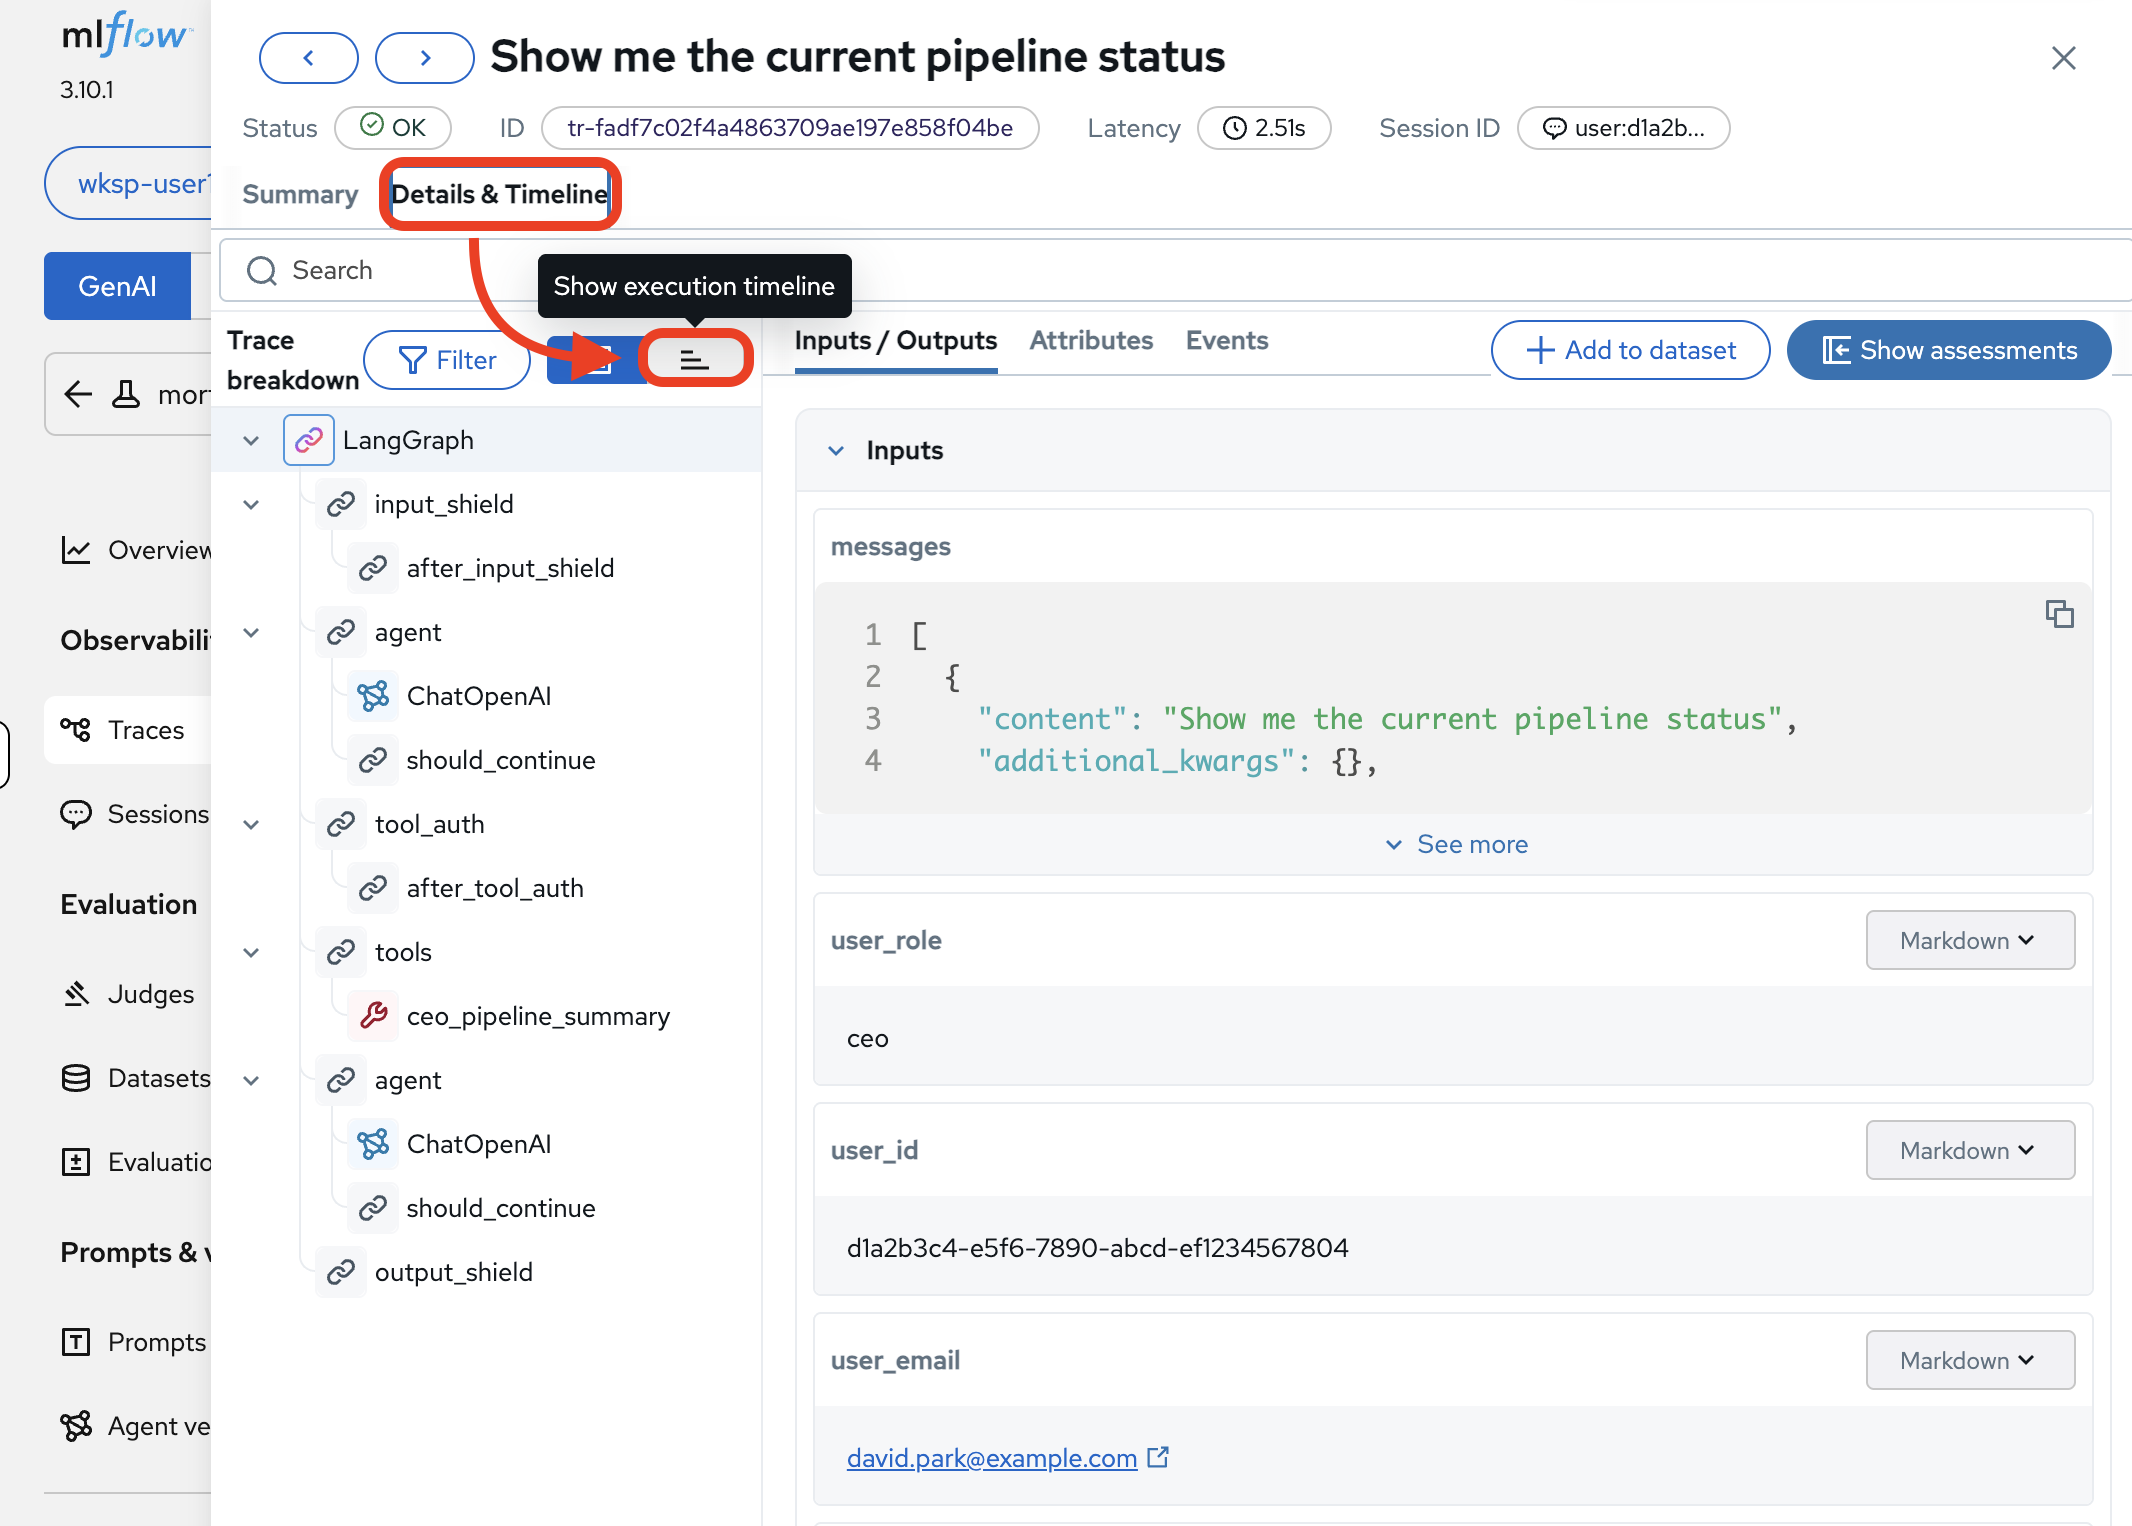
The trace tree shows the complete execution path:
LangGraph→input_shield→agent→ChatOpenAI(1.26s, decides to call a tool) →tool_auth→ceo_pipeline_summary(17ms, fetches pipeline data) →agent→ChatOpenAI(6.44s, composes the response) →output_shield. Now you can answer every question from Module 1’s observability challenge.Full span breakdown (click to expand)
Span What It Does LangGraphRoot orchestrator: manages the full agent workflow
input_shieldSafety filter: checks the input for harmful content
agent(first)LangGraph agent node: routes to the LLM
ChatOpenAI(first)LLM call: decides to call the
ceo_pipeline_summarytoolshould_continueDecision point: should the agent keep processing?
tool_authAuthorization check: does the CEO role have access to this tool?
tools→ceo_pipeline_summaryTool execution: queries the database for pipeline data
agent(second)LangGraph agent node: routes the tool result back to the LLM
ChatOpenAI(second)LLM call: formulates a natural-language response from the raw pipeline data
output_shieldSafety filter: checks the output before returning to the user
Inspect the tool call
-
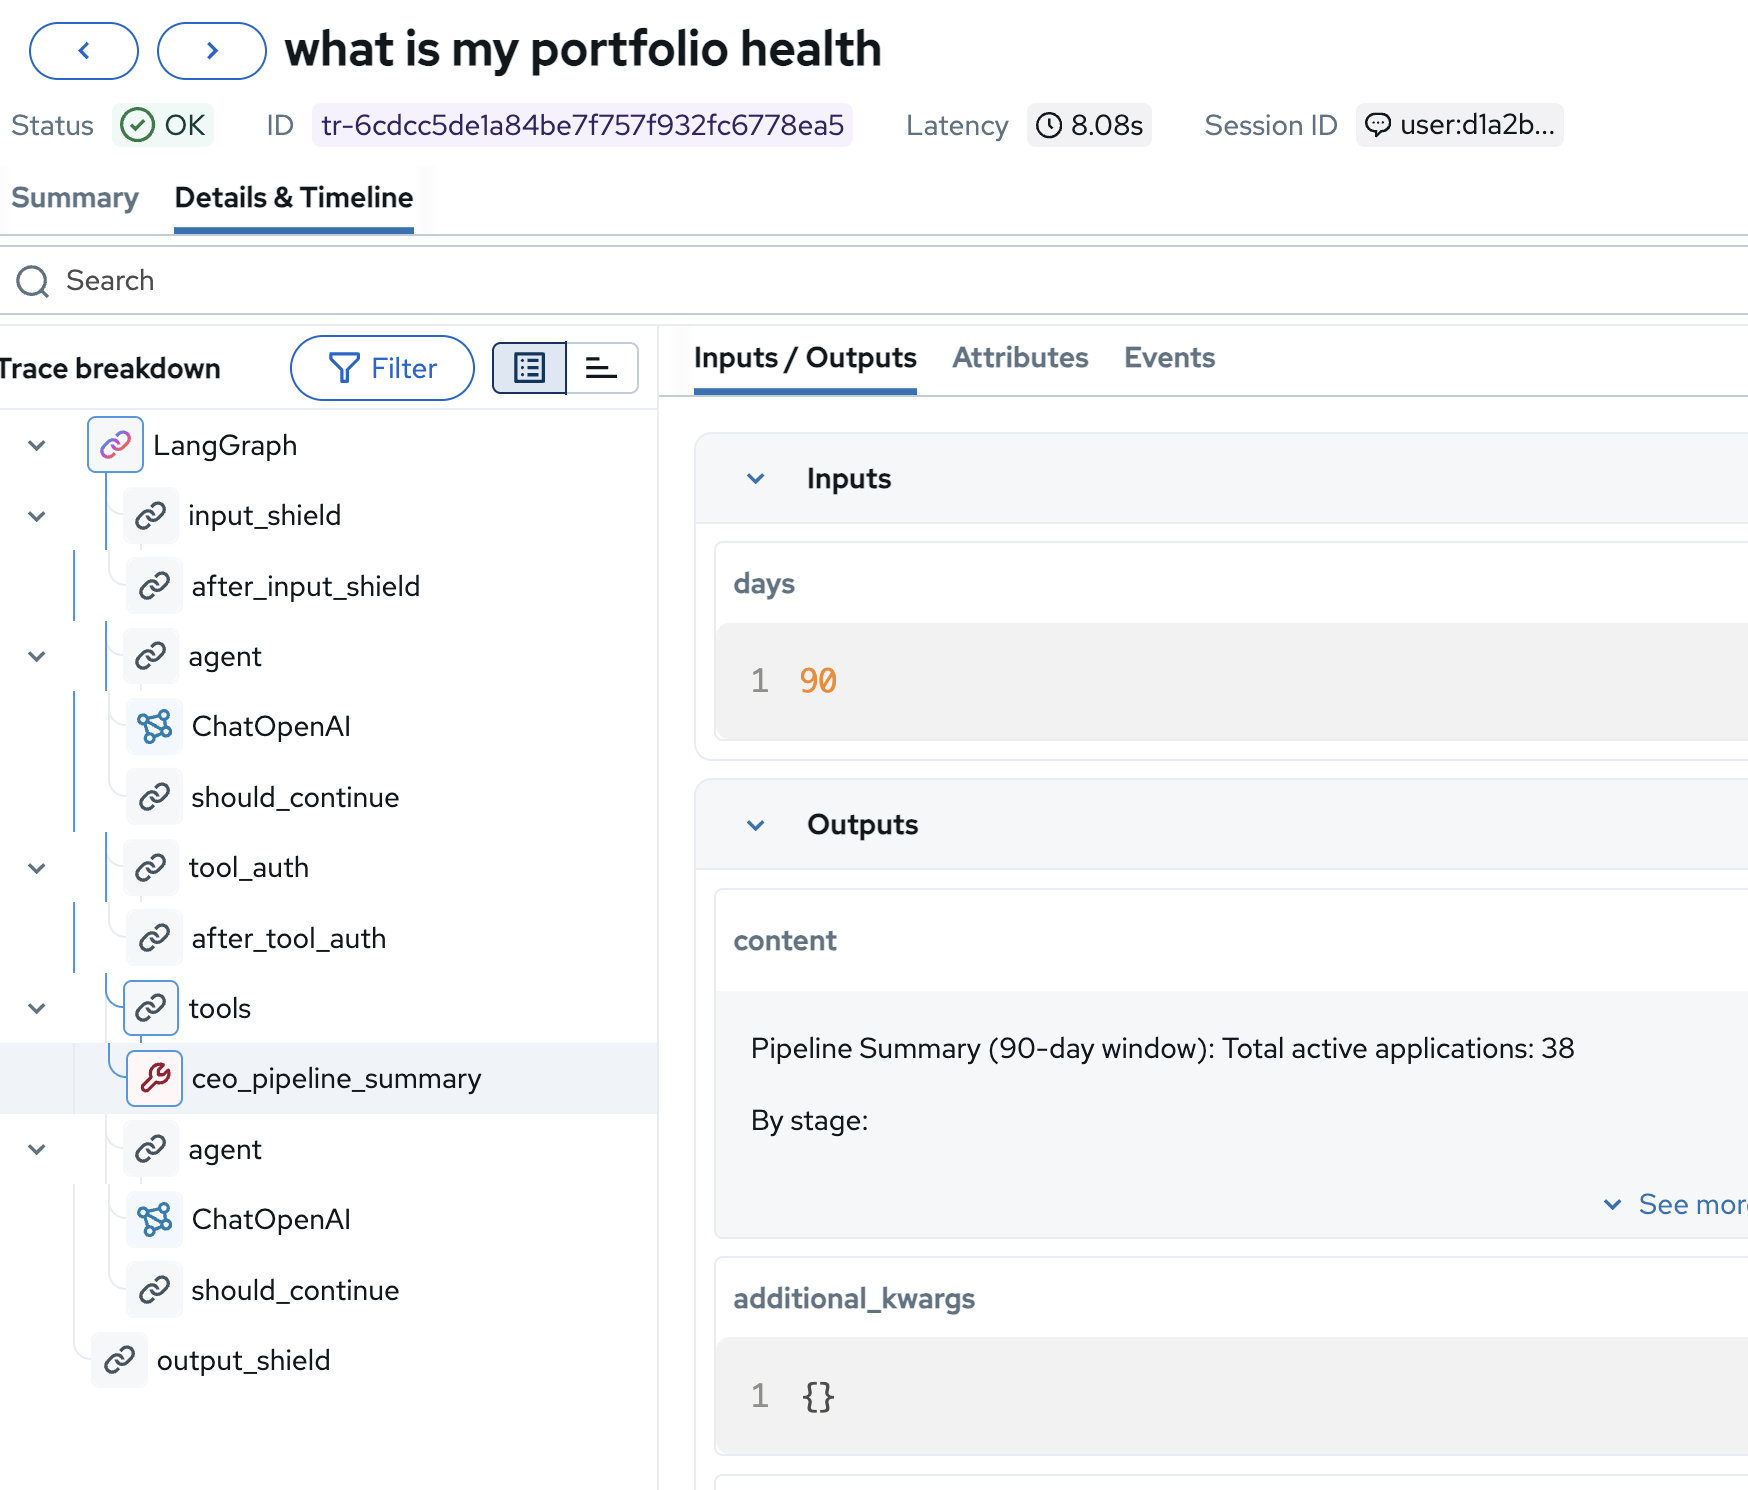
In the trace tree, click on the ceo_pipeline_summary span to see the tool’s inputs and outputs:
-
Inputs:
days: 90, the tool queries a 90-day window of pipeline data -
Outputs:
"Pipeline Summary (90-day window): Total active applications: 38…", the raw data the LLM used to compose its response
This is where the agent got its numbers. If the CEO’s response ever contains incorrect data, you can trace it directly to this tool’s output and verify whether the issue is in the tool logic or the LLM’s interpretation.
-
Inspect the LLM call
-
Click on the final ChatOpenAI span to see the actual LLM invocation:
-
Model:
gpt-oss-120b, the exact model serving this request -
Inputs → messages: The system prompt ("You are the Fed Aura Capital executive assistant") and the conversation context including the tool result
-
Outputs → choices: The complete LLM response before any post-processing
This level of detail is essential for debugging: you can see the exact prompt the model received, which model version handled it, and the raw completion before safety filters and formatting.
-
Exercise 4: Explore user sessions
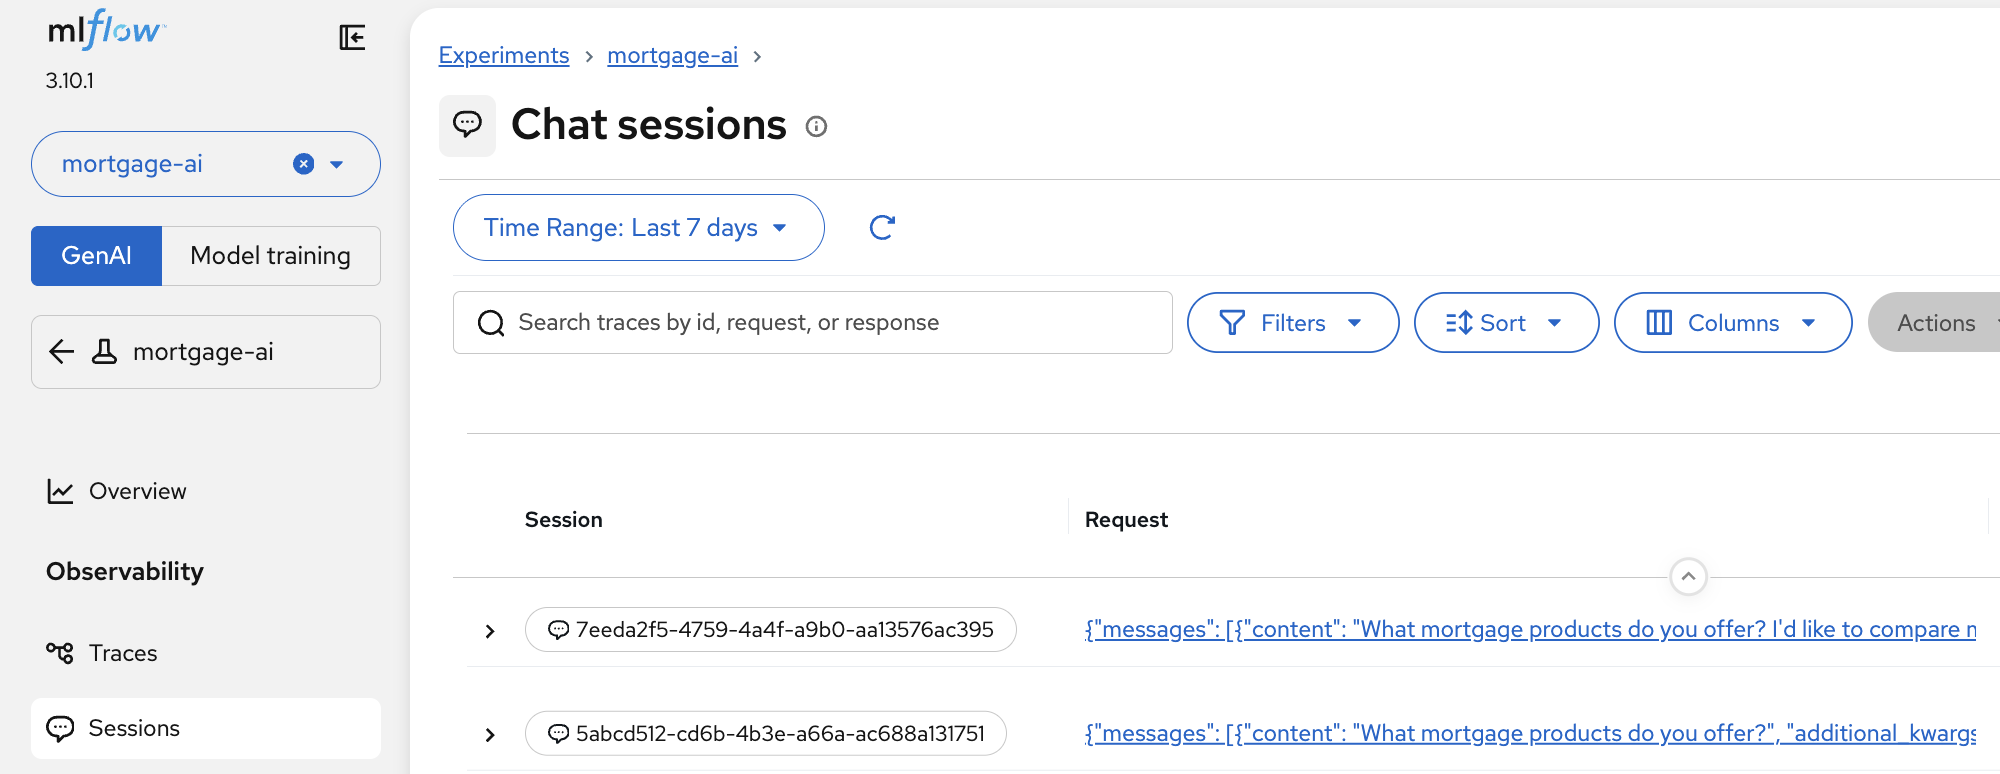
Many real-world AI applications use sessions to maintain multi-turn user interactions. MLflow Tracing provides built-in support for associating traces with users and grouping them into sessions. Tracking users and sessions in your LLM application or AI agent provides essential context for understanding user behavior, analyzing conversation flows, and improving personalization.
-
In MLflow, click Sessions in the left sidebar under Observability:
-
In the mortgage-ai application, each chat conversation is tracked as a session. MLflow groups all turns within a session together, letting you see the full conversation flow:
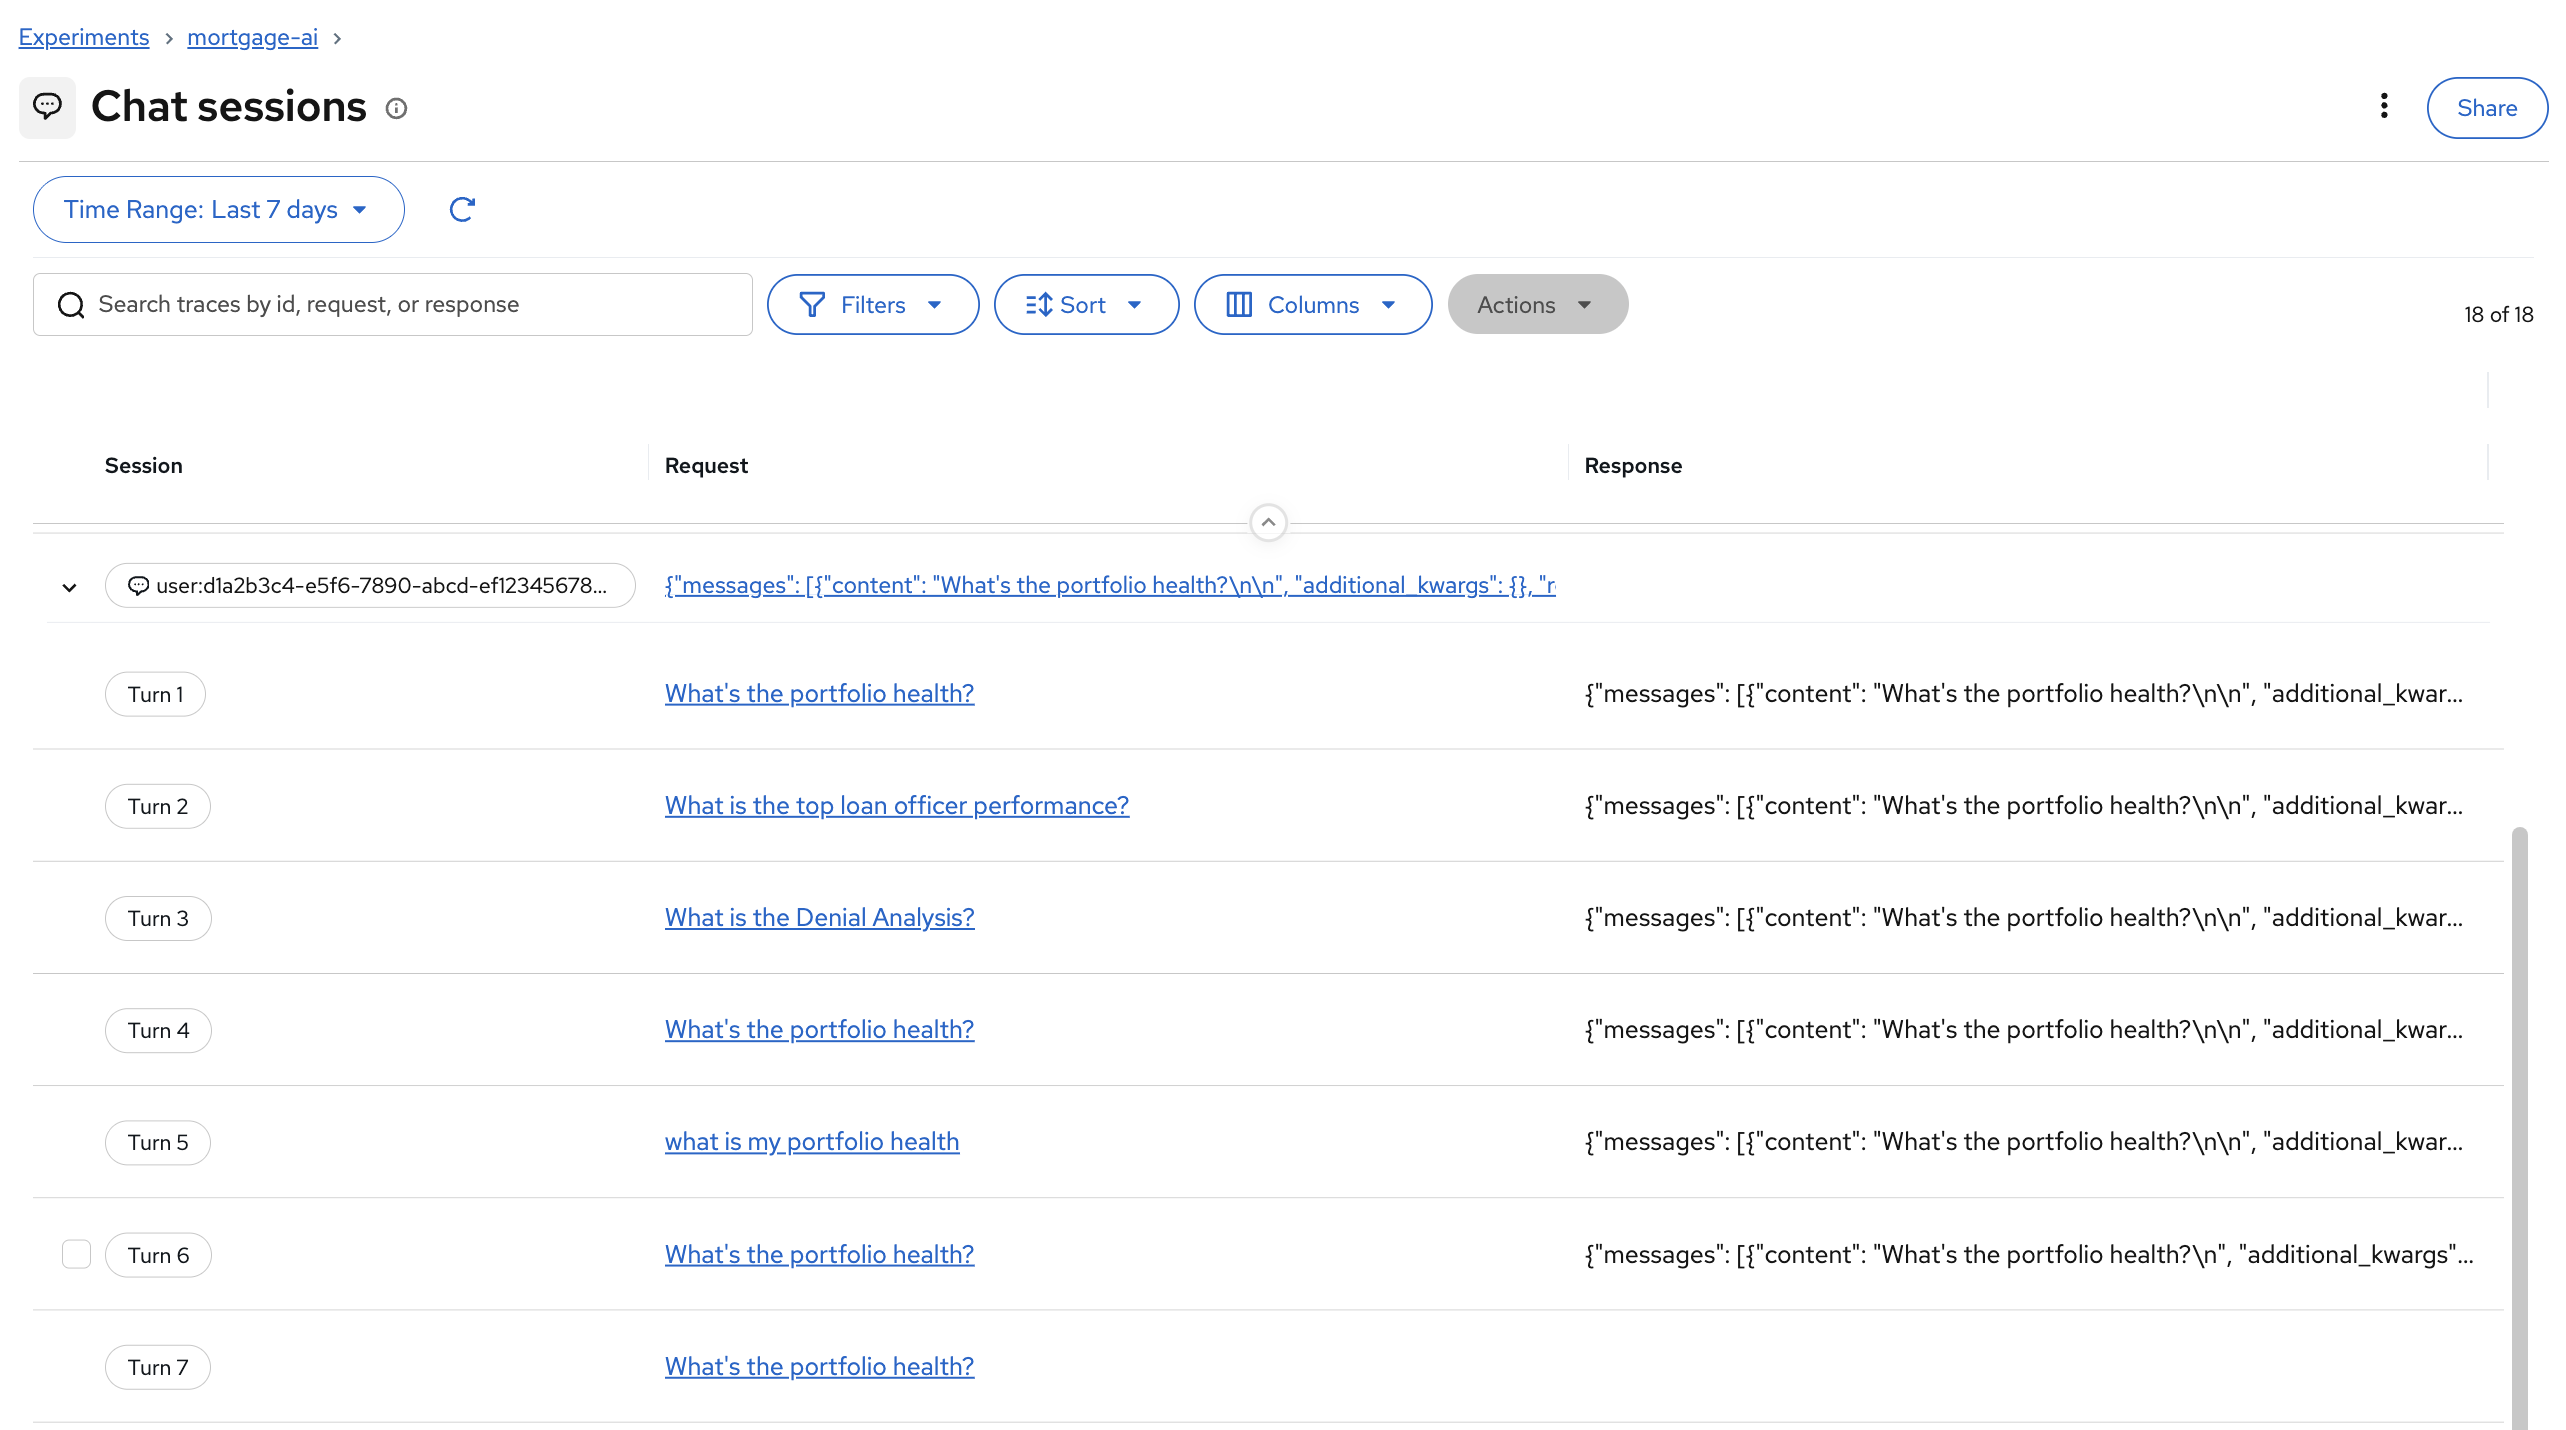
Clicking into a session reveals each turn with its inputs and outputs. You can click View full trace on any turn to jump directly to the detailed trace view:
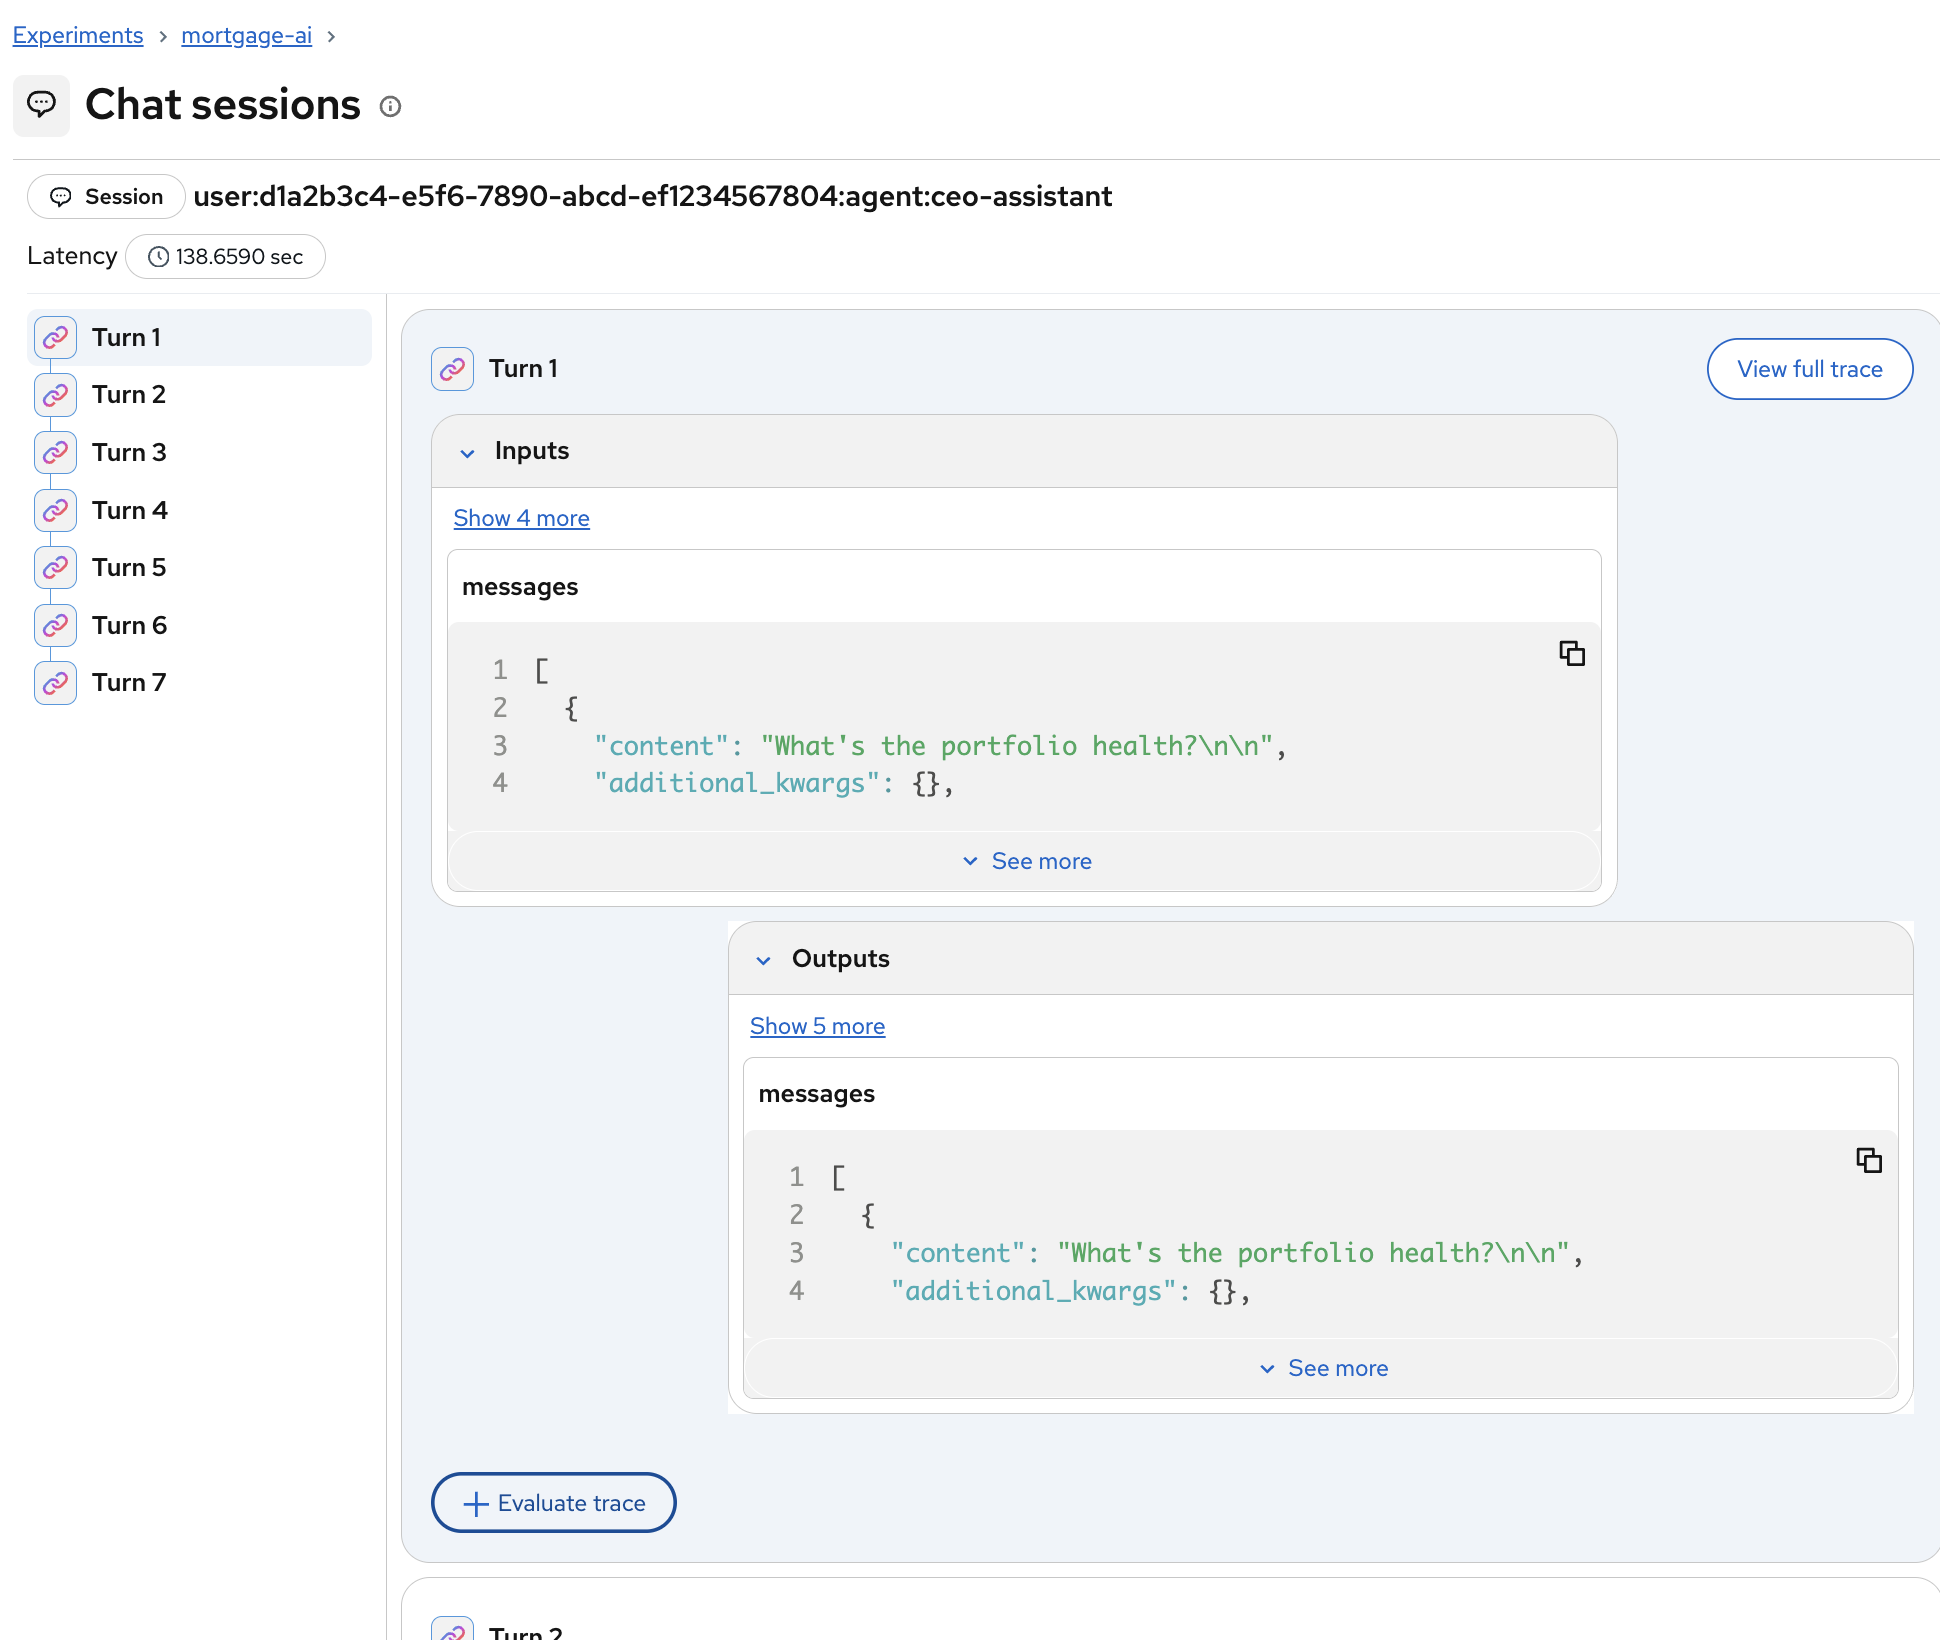
This is especially valuable for debugging multi-turn conversations where agent behavior degrades over time. You can see the full context the agent had at each step.
Module summary
What you accomplished:
-
Accessed MLflow and found traces from your Module 1 interactions
-
Analyzed the CEO trace end-to-end: input shields, LLM calls, tool authorization, tool execution, and output shields
-
Inspected individual spans to see tool inputs/outputs and LLM prompts/completions
Key takeaways:
-
MLflow autolog provides end-to-end tracing with zero code changes: one line enables it
-
Traces capture user identity, execution timelines, and tool/LLM details, closing the observability gap for multi-agent systems
-
Individual span inspection lets you pinpoint issues to specific components: tool logic, LLM prompts, or safety filters
Next steps:
You’ve completed the core observability modules! You now have metrics, traces, and logs working together to monitor your multi-agent system.
Option 1 - Continue to Advanced Topics (recommended if time permits):
Module 5: Agent & LLM Evaluations introduces quality assessment frameworks, combining tracing with evaluations to catch regressions before production. Module 6 automates these evaluations into CI/CD pipelines.
Option 2 - Skip to Conclusion:
If you’re short on time, skip to the Conclusion, which recaps your observability journey and provides resources for continuing your learning.