Module 2: Observability pillars, concepts, and personas
Revisiting your CEO conversation
Remember when you asked the CEO Assistant "What’s the portfolio health?" in Module 1? That single question generated a polished response with pipeline statistics and metrics. But what actually happened behind the scenes?
Your question triggered:
-
30+ metrics: Token counts, LLM latency, database query times, tool call durations
-
15+ log events: Agent decisions, tool parameters, prompt/completion pairs, database results
-
1 distributed trace: Spanning 5+ LLM calls and 3+ tool invocations across the CEO agent workflow
All you saw was the final answer. The decision-making process—which tools were called, how long each step took, whether any calls failed—remained completely invisible.
This is the observability gap in action.
In this module, you’ll learn the 3 pillars of observability (metrics, logs, traces) that make that invisible decision-making process visible. You’ll understand what Fed Aura Capital needs to capture from your CEO conversation to debug issues, optimize performance, and ensure quality.
| This is a conceptual module: no terminal or cluster work required. The goal is to build a shared vocabulary before diving into hands-on tooling in Modules 3-6. |
Learning objectives
By the end of this module, you’ll be able to:
-
Define the 3 pillars of observability: metrics, logs, and traces
-
Explain how each pillar applies specifically to multi-agent AI systems
-
Distinguish between the observability needs of SRE/Platform Engineers and AI Developers/Engineers
-
Map observability tools to persona-specific use cases in Fed Aura Capital
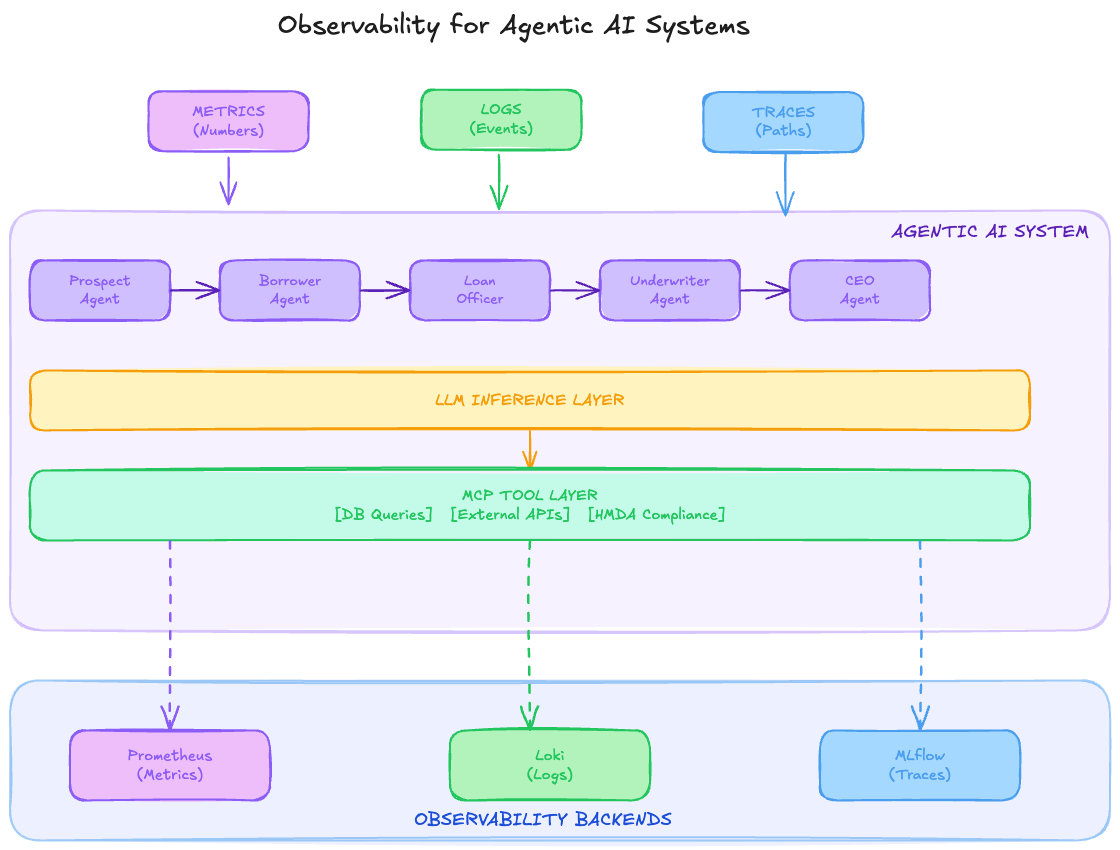
The 3 pillars of observability
Before diving into tools and implementation, let’s establish a shared vocabulary for observability in the context of agentic AI systems.
Pillar 1: Metrics
Definition: Numeric measurements collected at regular intervals that represent the state of a system.
For traditional systems:
-
CPU utilization, memory usage, request rate
-
Error rates, latency percentiles
-
Queue depths, connection counts
For agentic AI systems:
-
Token usage per agent per request
-
LLM inference latency
-
Agent decision confidence scores
-
MCP tool call success/failure rates
-
Agent handoff frequencies
-
Model response quality scores
Pillar 2: Logs
Definition: Timestamped, immutable records of discrete events.
For traditional systems:
-
Application errors and exceptions
-
Access logs, audit trails
-
Debug information
For agentic AI systems:
-
Agent reasoning chains and decision rationale
-
Prompt/completion pairs for debugging
-
Tool invocation parameters and responses
-
Compliance audit events (critical for Fed Aura Capital!)
-
Agent state transitions
Pillar 3: Traces
Definition: Records of the path of a request as it propagates through a distributed system.
For traditional systems:
-
Service-to-service call chains
-
Database query execution paths
-
External API integrations
For agentic AI systems:
-
Multi-agent workflow execution paths
-
LLM inference spans with prompt/completion
-
MCP tool call chains
-
Agent-to-agent handoff sequences
-
Complete decision paths from input to output
Exercise 1: Map pillars to Fed Aura Capital needs
Let’s apply these concepts to Fed Aura Capital’s multi-agent mortgage system.
-
Review this mapping of observability needs:
Pillar Traditional Need Fed Aura Capital AI Need Metrics
Request rate, error rate
Agent token consumption, model latency, compliance check pass rate
Logs
Error messages
Agent reasoning chains, compliance audit trail, PII access logs
Traces
Service call graph
Loan application flow across 5 agents, MCP tool execution path
-
Identify which pillar helps answer each question. Try to answer before revealing the solution:
-
"How many tokens did we consume processing loan applications today?"
Details
Metrics: token usage counters track consumption over time.
-
"Why is the API failing after we upgraded the model configuration?"
Details
Logs: error details and config mismatches are captured in log events.
-
"Where is the bottleneck in our loan processing pipeline?"
Details
Traces: end-to-end request traces reveal which agent or tool call is slowest.
-
"Is our compliance check service degrading?"
Details
Metrics: latency percentiles and error rate trends show degradation over time.
-
"What was the complete path of application #12345?"
Details
Traces: distributed traces reconstruct the full request flow across all agents.
-
Exercise 2: 2 personas, one observability stack
At Fed Aura Capital, 2 primary teams need observability but focus on different things. Let’s identify who owns what in the AgentOps observability stack.
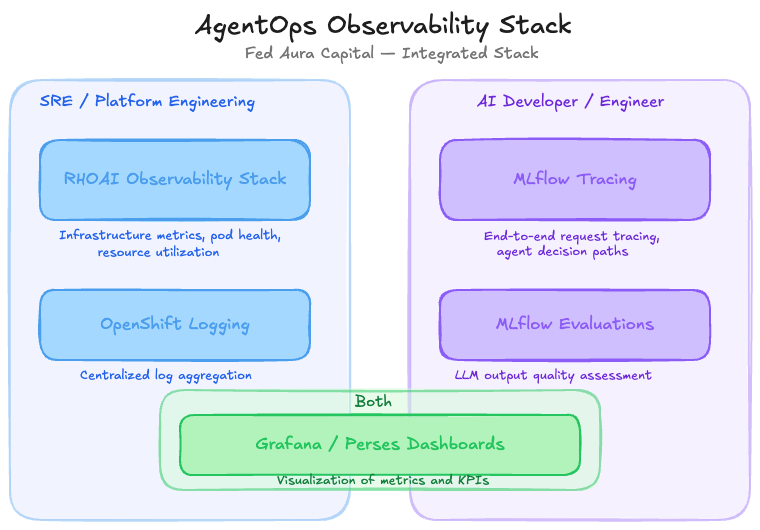
The stack serves both personas:
-
SRE / Platform Engineering: system health, SLOs, capacity. Uses Red Hat OpenShift AI (RHOAI) Observability Stack, OpenShift Logging, and Grafana dashboards.
-
AI Developer / Engineer: model behavior, decision quality, agent performance. Uses MLflow Tracing, MLflow Evaluations, and Grafana dashboards.
-
Grafana / Perses Dashboards: shared by both personas for metrics and KPI visualization.
For each scenario below, decide which persona is responsible. Click to reveal the answer:
-
"MLflow tracking server is running out of disk space"
Details
SRE/Platform Engineering: infrastructure and storage management.
-
"Loan approval rate dropped 15% after a model update"
Details
AI Developer/Engineer: model behavior change requires investigation of outputs and traces.
-
"P99 latency for the underwriter agent exceeded SLO"
Details
SRE/Platform Engineering: SLO tracking and performance monitoring.
-
"Agent is providing inconsistent advice to similar inquiries"
Details
AI Developer/Engineer: output quality and prompt debugging.
-
"Kubernetes pods for the MCP server keep restarting"
Details
SRE/Platform Engineering: pod health and infrastructure troubleshooting.
-
"Compliance check agent is flagging too many false positives"
Details
AI Developer/Engineer: agent decision logic and evaluation tuning.
Some issues require collaboration between both personas:
-
Latency spikes: SRE identifies the symptom (high latency), AI Developer investigates the cause (complex prompt, model issue)
-
Error rate increases: SRE sees the metric, AI Developer analyzes the failed traces
-
Resource exhaustion: SRE manages capacity, AI Developer optimizes token usage
Module summary
What you accomplished:
-
Mapped the 3 pillars of observability (metrics, logs, traces) to agentic AI needs
-
Identified SRE vs AI Developer responsibilities in the observability stack
-
Recognized where both personas must collaborate
Key takeaways:
-
Metrics, logs, and traces each serve unique purposes. Agentic apps add token usage, agent reasoning, and multi-agent workflow paths.
-
SRE/Platform Engineers focus on system health; AI Developers focus on model behavior
-
Effective AgentOps requires collaboration between both personas
Next steps:
Module 3 will explore metrics and logs hands-on using pre-deployed Grafana dashboards and LokiStack.