Module 3: Metrics and logs for agentic applications
Metrics tell you what is happening in your system. Logs tell you what exactly happened and when. In this module, you’ll explore a pre-deployed Grafana dashboard that monitors the mortgage-ai multi-agent system, then investigate application logs using LokiStack in the OpenShift Console.
| In this module, you’re wearing your SRE / Platform Engineering hat, focusing on system health, request rates, error rates, and operational logs. |
Learning objectives
By the end of this module, you’ll be able to:
-
Identify the key metrics that matter for multi-agent AI systems
-
Navigate the pre-deployed Mortgage-AI Grafana dashboard
-
Explore and filter application logs using LokiStack and Log Query Language (LogQL)
-
Explain how metrics and logs work together for agentic observability
What makes agentic metrics different?
Traditional applications need request rate, error rate, and latency. Agentic applications need all of that plus metrics that capture LLM behavior, agent routing, and tool execution. Here are the 6 metrics that matter most:
| Metric | Prometheus Name | What It Tells You |
|---|---|---|
Request Rate & Errors |
|
How much traffic are we getting? How many requests are failing? |
Latency Percentiles |
|
How fast are we responding? Are there outliers? |
LLM Token Usage |
|
How many tokens are we burning? What’s the cost per conversation? |
LLM Inference Latency |
|
How long does the model take to respond? Is it the bottleneck? |
Tool Call Success Rate |
|
Are agent tools working? Which ones are failing? |
Agent Routing |
|
Are queries routing to the fast or capable model? Is the classifier working? |
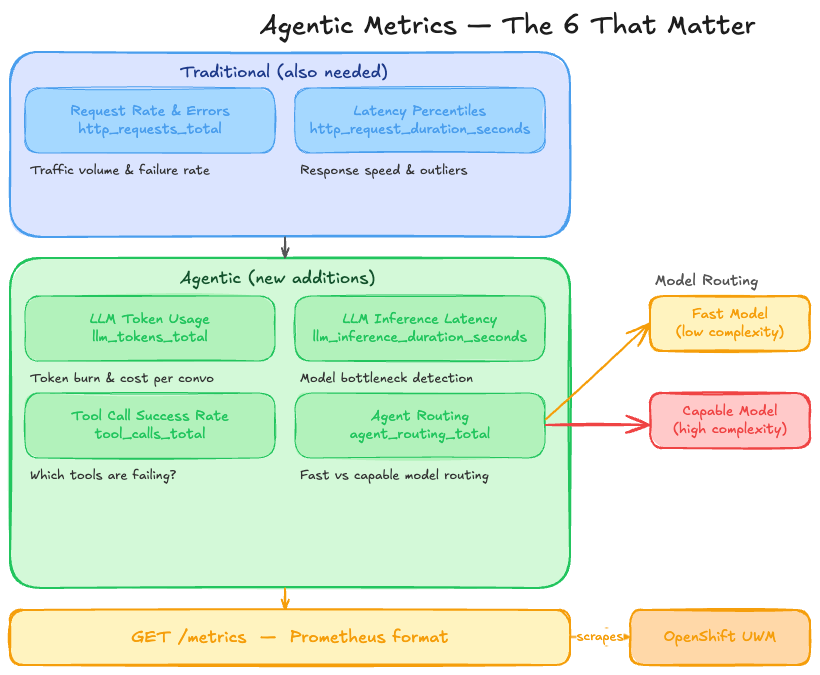
The mortgage-ai API exposes all these at GET /metrics in Prometheus format. OpenShift User Workload Monitoring (a built-in Prometheus instance that comes with Red Hat OpenShift AI) scrapes them automatically every 30 seconds and stores them in a time-series database.
This means you don’t need to set up Prometheus yourself—the platform handles collection and storage. You just need to:
-
Expose metrics from your application (mortgage-ai already does this)
-
Configure a visualization platform (we’re using Grafana in this workshop) to query the OpenShift Prometheus data source (already configured)
-
Build dashboards to visualize the metrics (you’ll explore this next)
Complete metrics reference (click to expand)
The mortgage-ai backend exposes 10 custom metrics defined in packages/api/src/core/metrics.py:
| Prometheus Name | Type | Labels |
|---|---|---|
|
Counter |
|
|
Histogram |
|
|
Counter |
|
|
Counter |
|
|
Counter |
|
|
Histogram |
|
|
Gauge |
|
|
Counter |
|
|
Counter |
|
|
Counter |
|
Additionally, prometheus-fastapi-instrumentator provides automatic HTTP metrics (http_requests_total, http_request_duration_seconds_bucket).
Exercise 1: Explore the Mortgage-AI Grafana dashboard
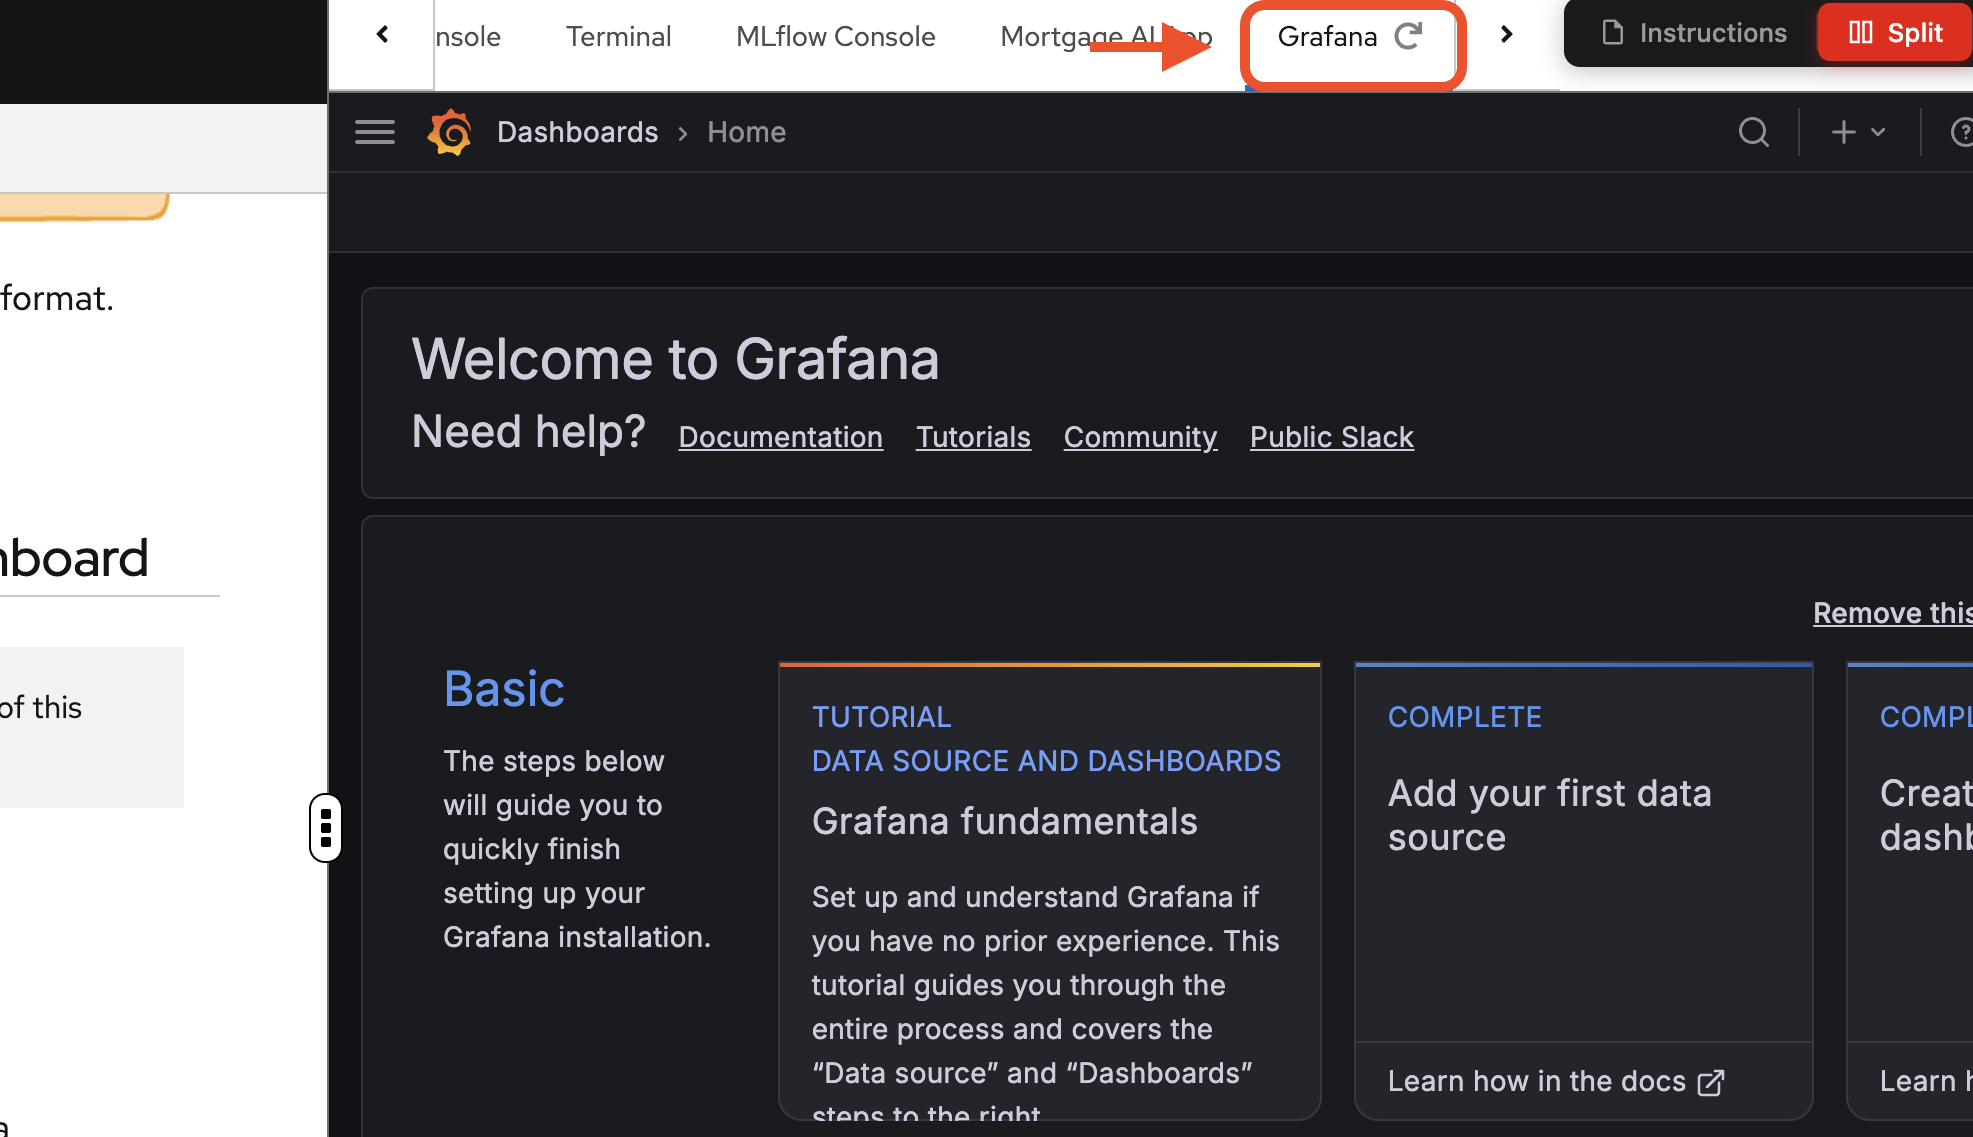
Navigate to the Grafana tab to access the dashboard.
If prompted, login again with your credentials:
-
Username: user1
-
Password: openshift
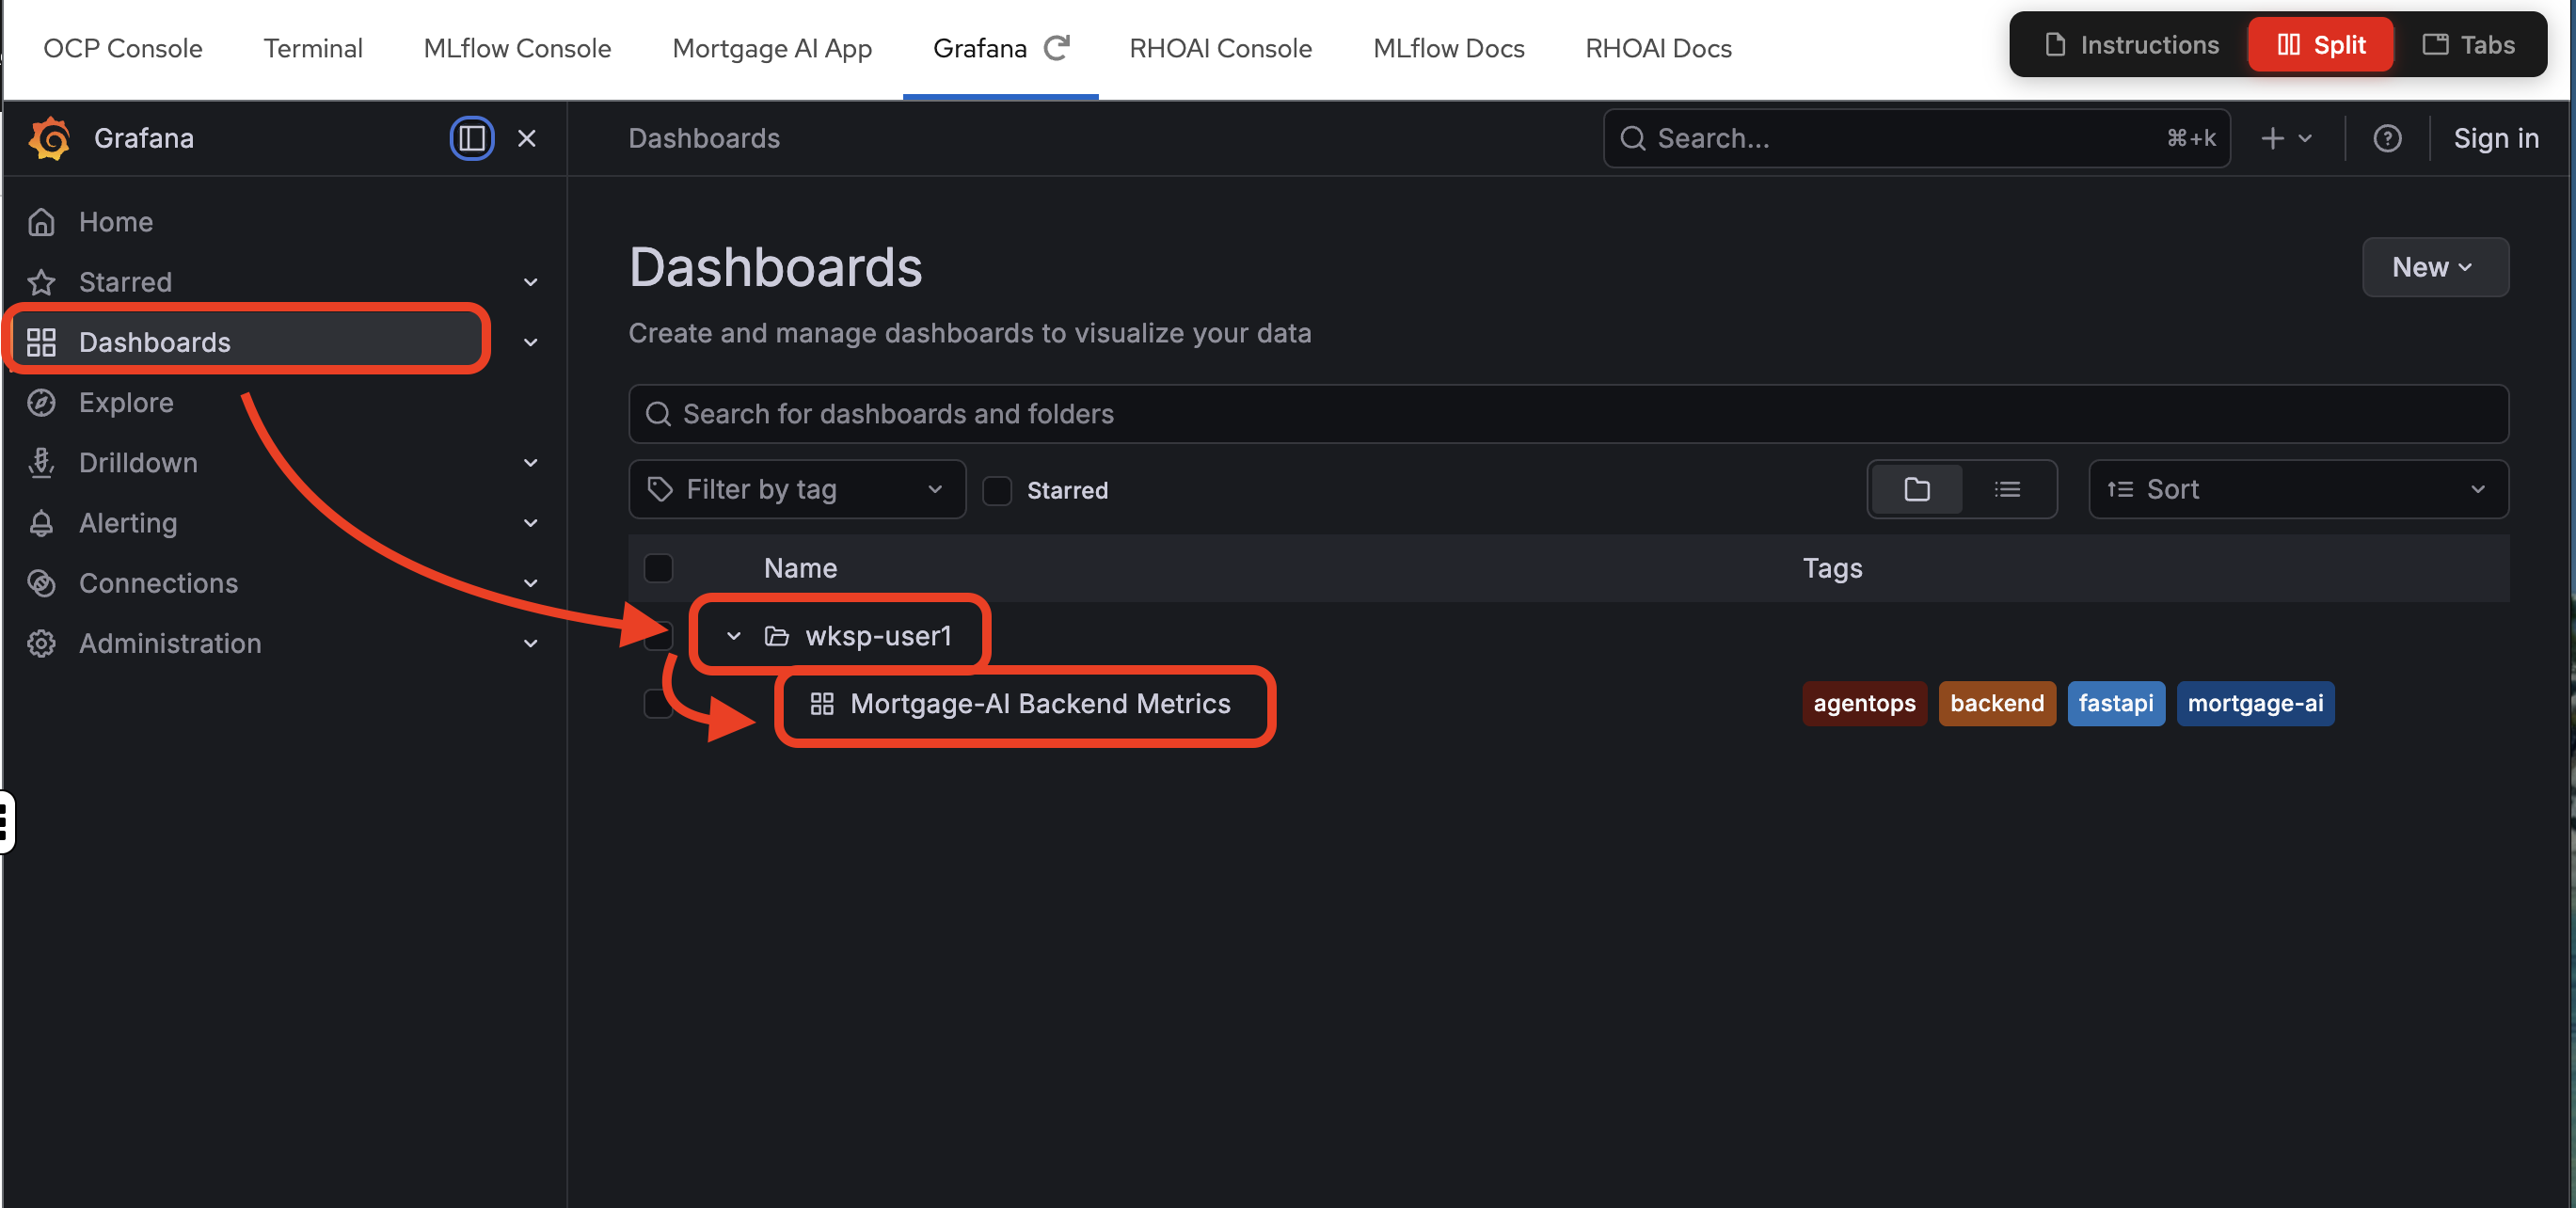
The Grafana instance is pre-deployed in your workspace namespace with a Mortgage-AI Backend Metrics dashboard already configured. It connects to 2 Prometheus datasources:
-
User Workload Monitoring: scrapes the mortgage-ai application metrics (default)
-
Red Hat OpenShift AI (RHOAI) Prometheus: provides model serving metrics from OpenShift AI
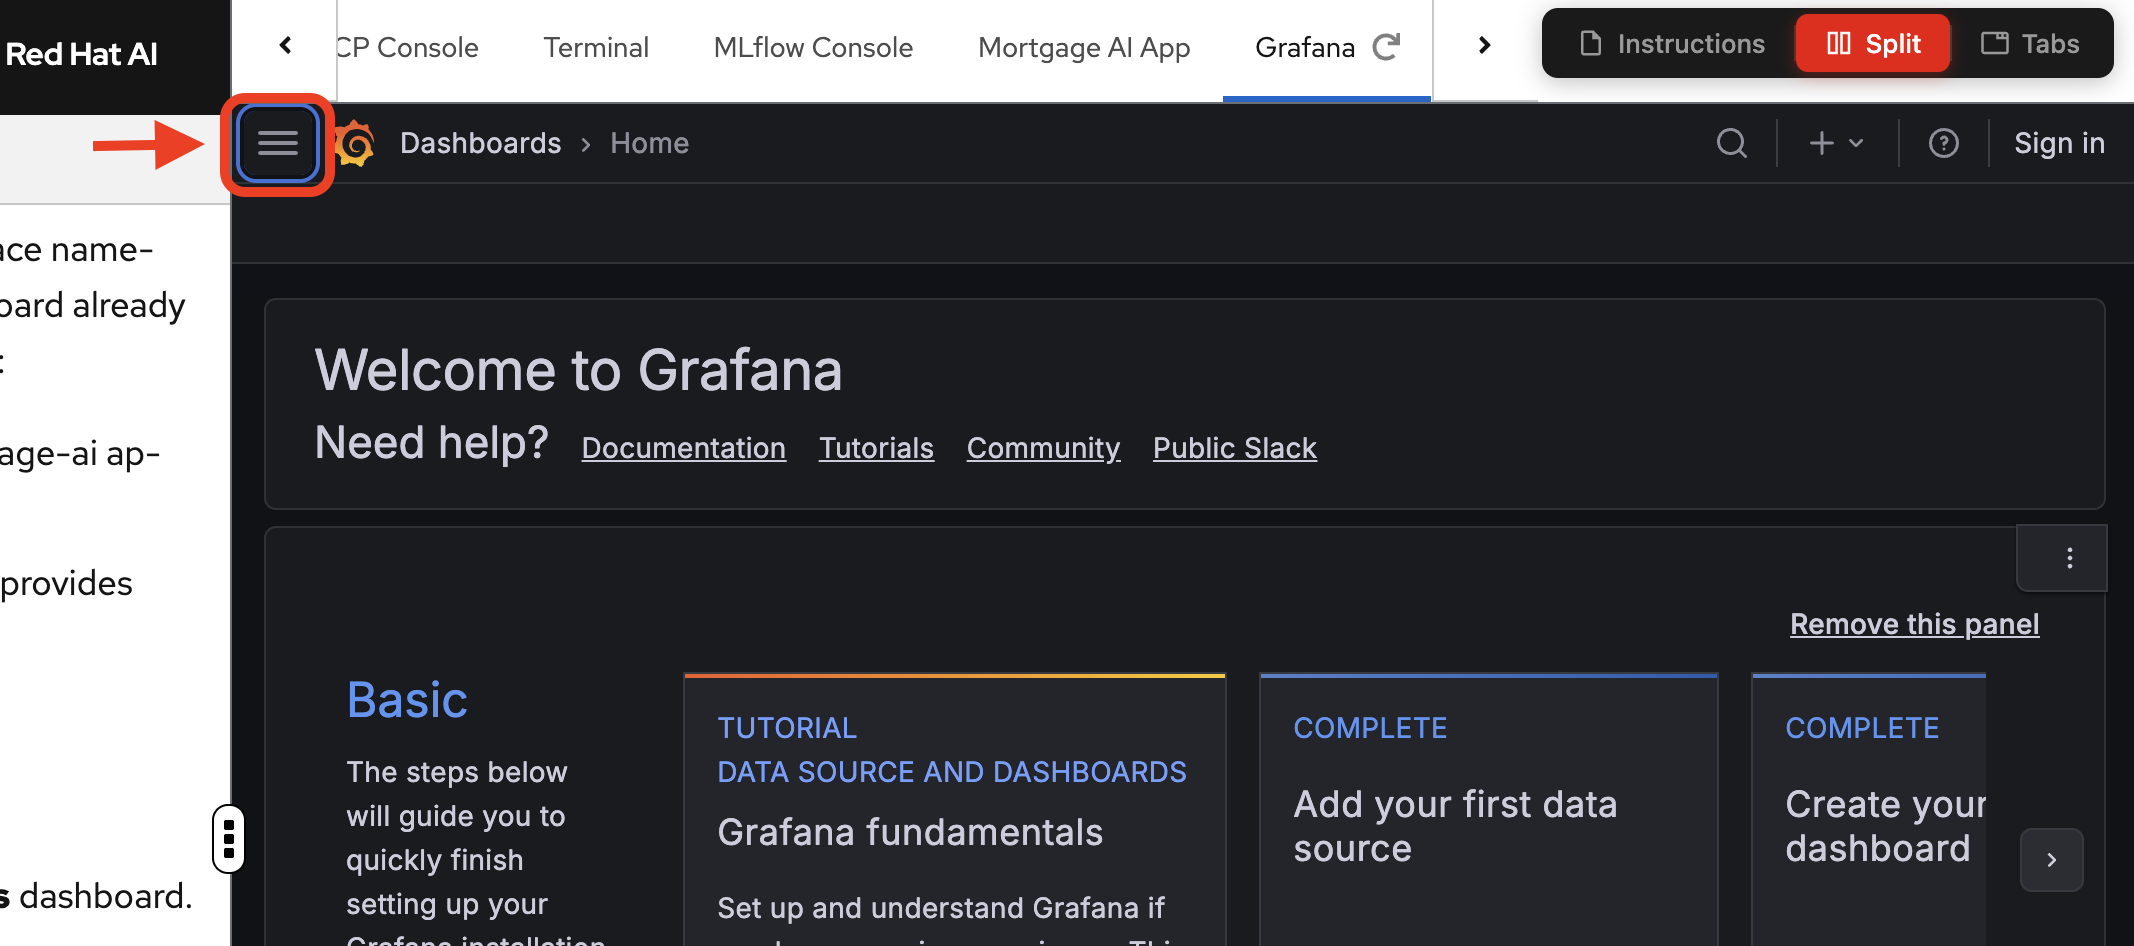
Let’s open it and see what’s there.
-
Open the Grafana tab.
-
Navigate to the Mortgage-AI Backend Metrics dashboard.
Overview and HTTP panels
The top of the dashboard gives you an at-a-glance view of system health:
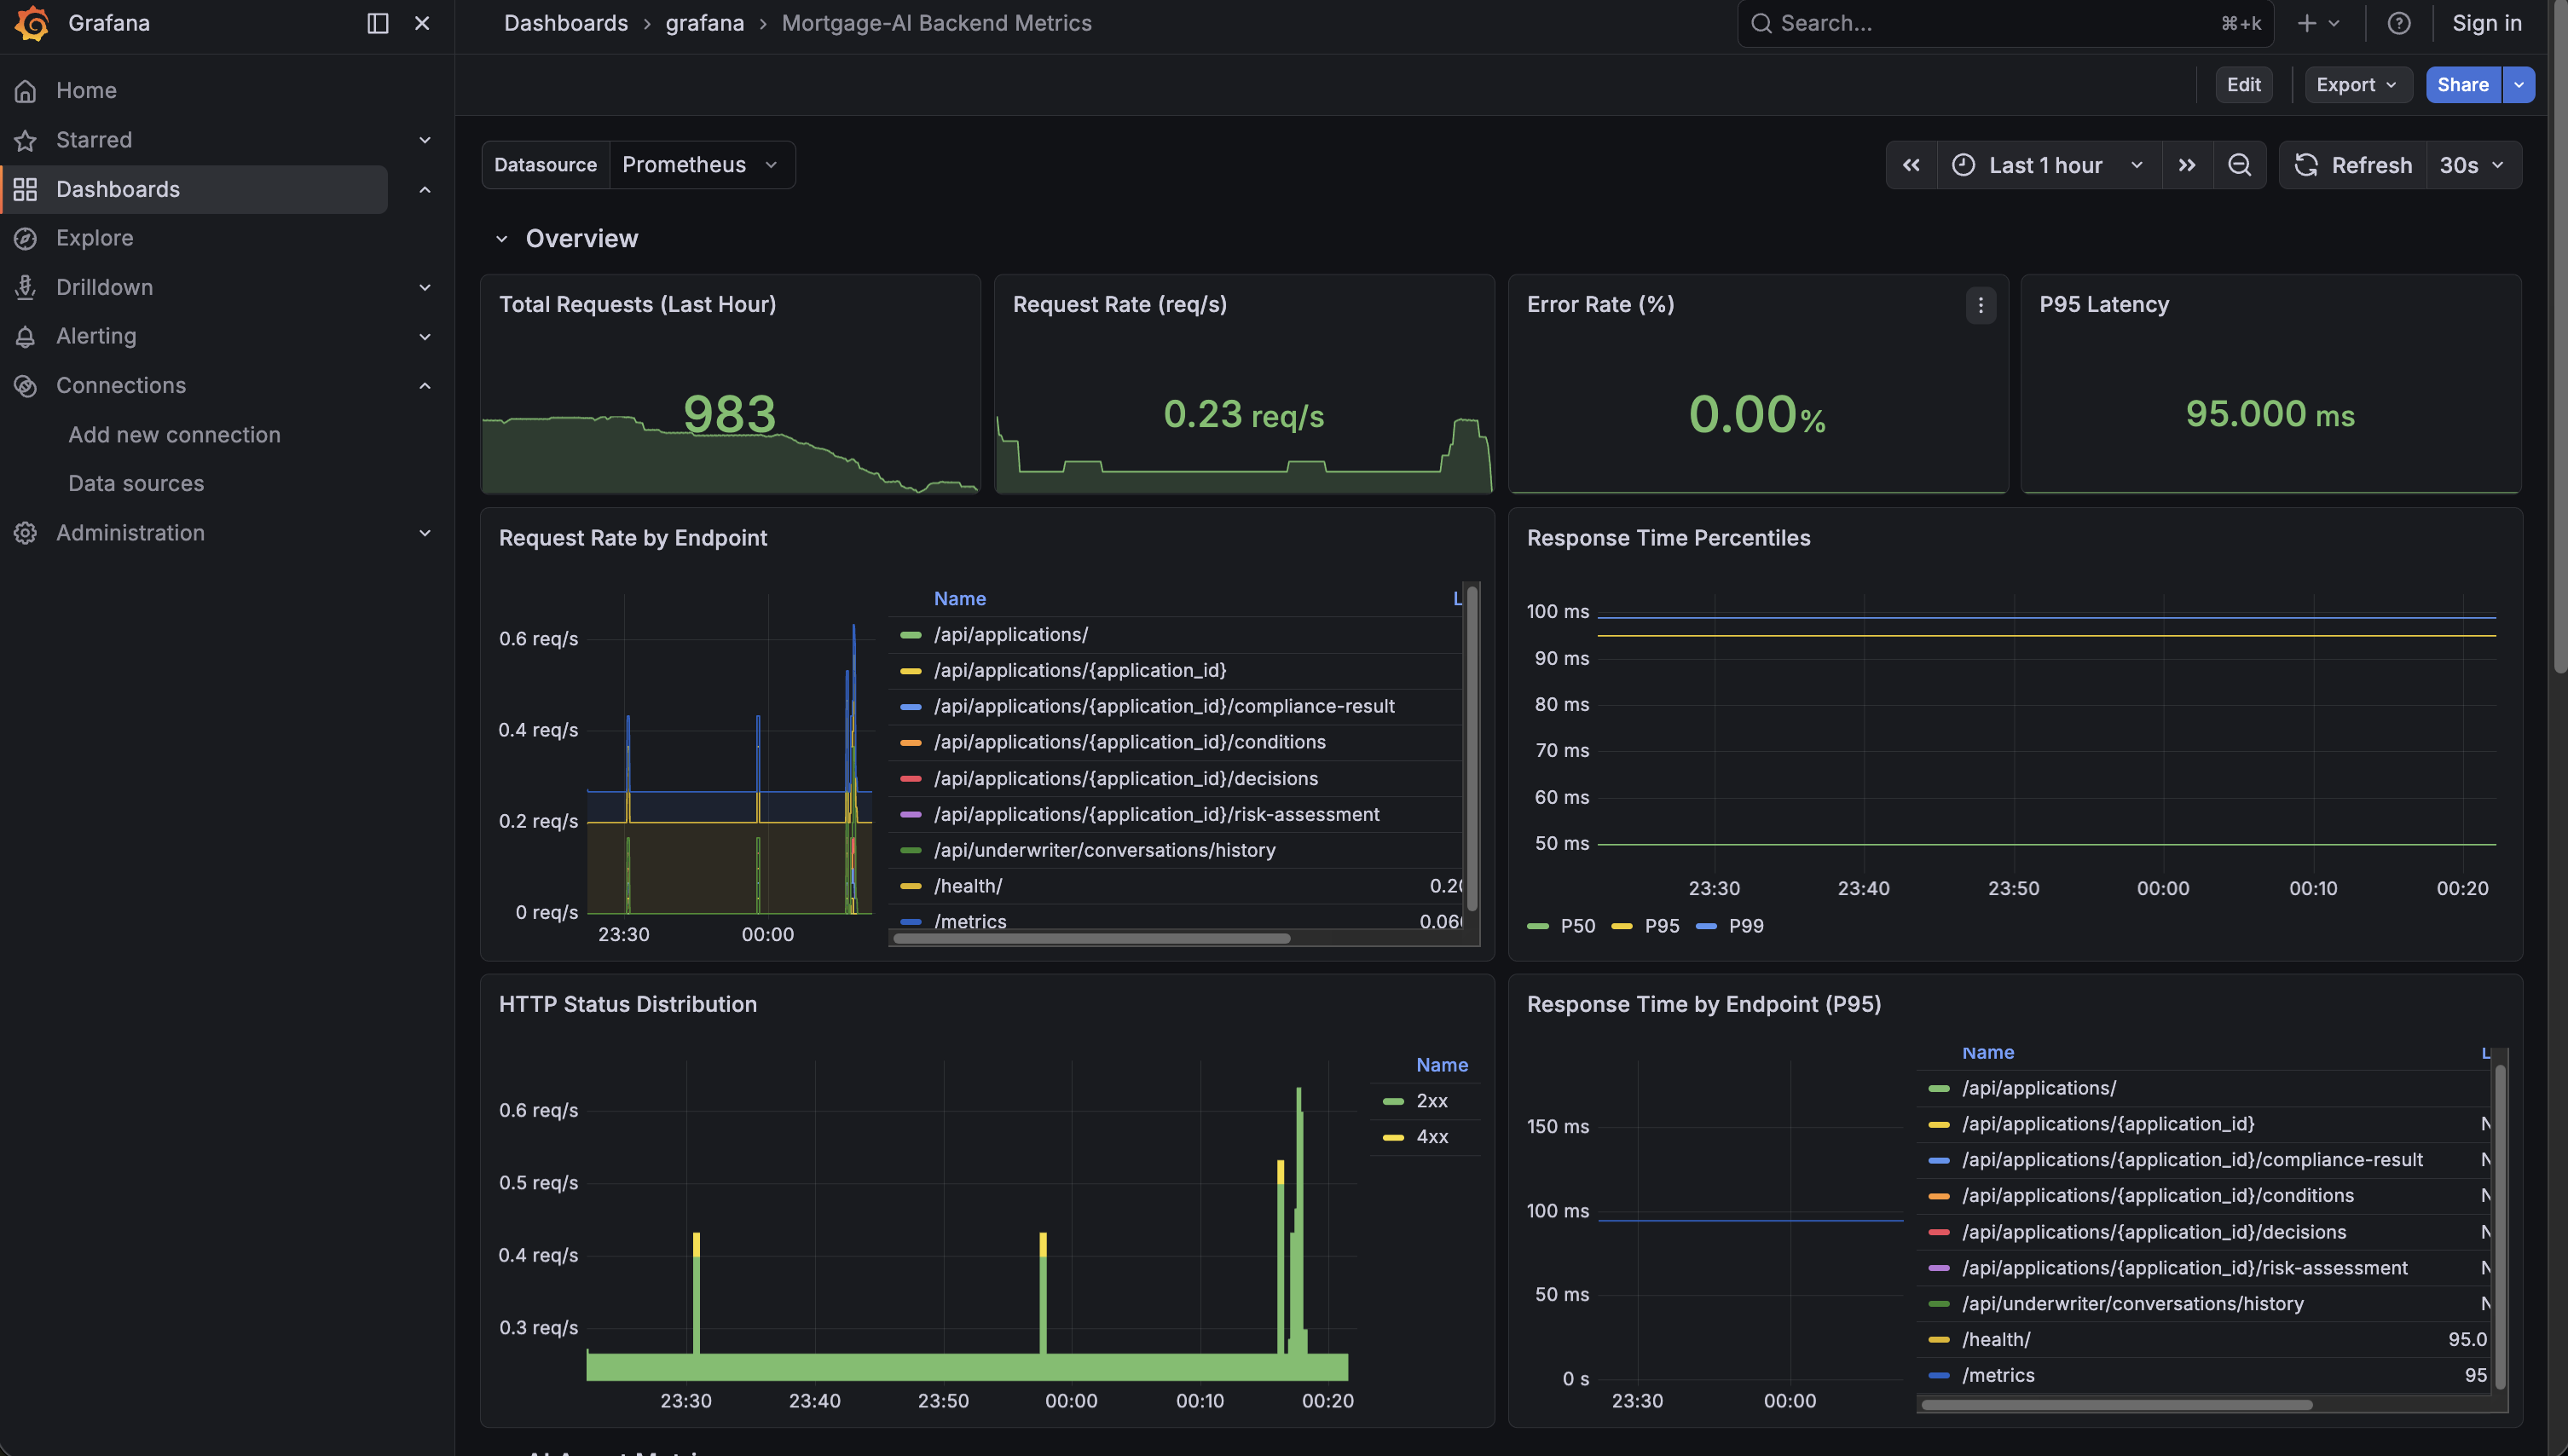
What you’re seeing:
-
Total Requests (Last Hour): how many requests hit the API. In the screenshot, ~983 requests.
-
Request Rate: current throughput in requests per second.
-
Error Rate (%): percentage of 5xx responses. Green means healthy.
-
P95 Latency: 95% of requests complete faster than this value. Under 100ms is excellent.
Below the overview, the HTTP panels break down traffic by endpoint and status code. Look for:
-
Which endpoint gets the most traffic (likely
/api/prospect/chat) -
Any yellow (4xx) or red (5xx) bars in the HTTP Status Distribution
-
Which endpoints have the highest P95 latency
Prometheus Query Language (PromQL) details for Overview panels (click to expand)
-
Request Rate:
sum(rate(http_requests_total{namespace=~"$namespace"}[5m])) -
Error Rate:
(sum(rate(http_requests_total{namespace=~"$namespace", status=~"5.."}[5m])) / sum(rate(http_requests_total{namespace=~"$namespace"}[5m])) * 100) or vector(0) -
P95 Latency:
histogram_quantile(0.95, sum(rate(http_request_duration_seconds_bucket{namespace=~"$namespace"}[5m])) by (le))
rate() calculates per-second averages over a time window. histogram_quantile() computes percentiles from histogram buckets.
AI agent metrics
Scroll down to the AI Agent Metrics row. This is where it gets interesting. These metrics are unique to agentic applications:
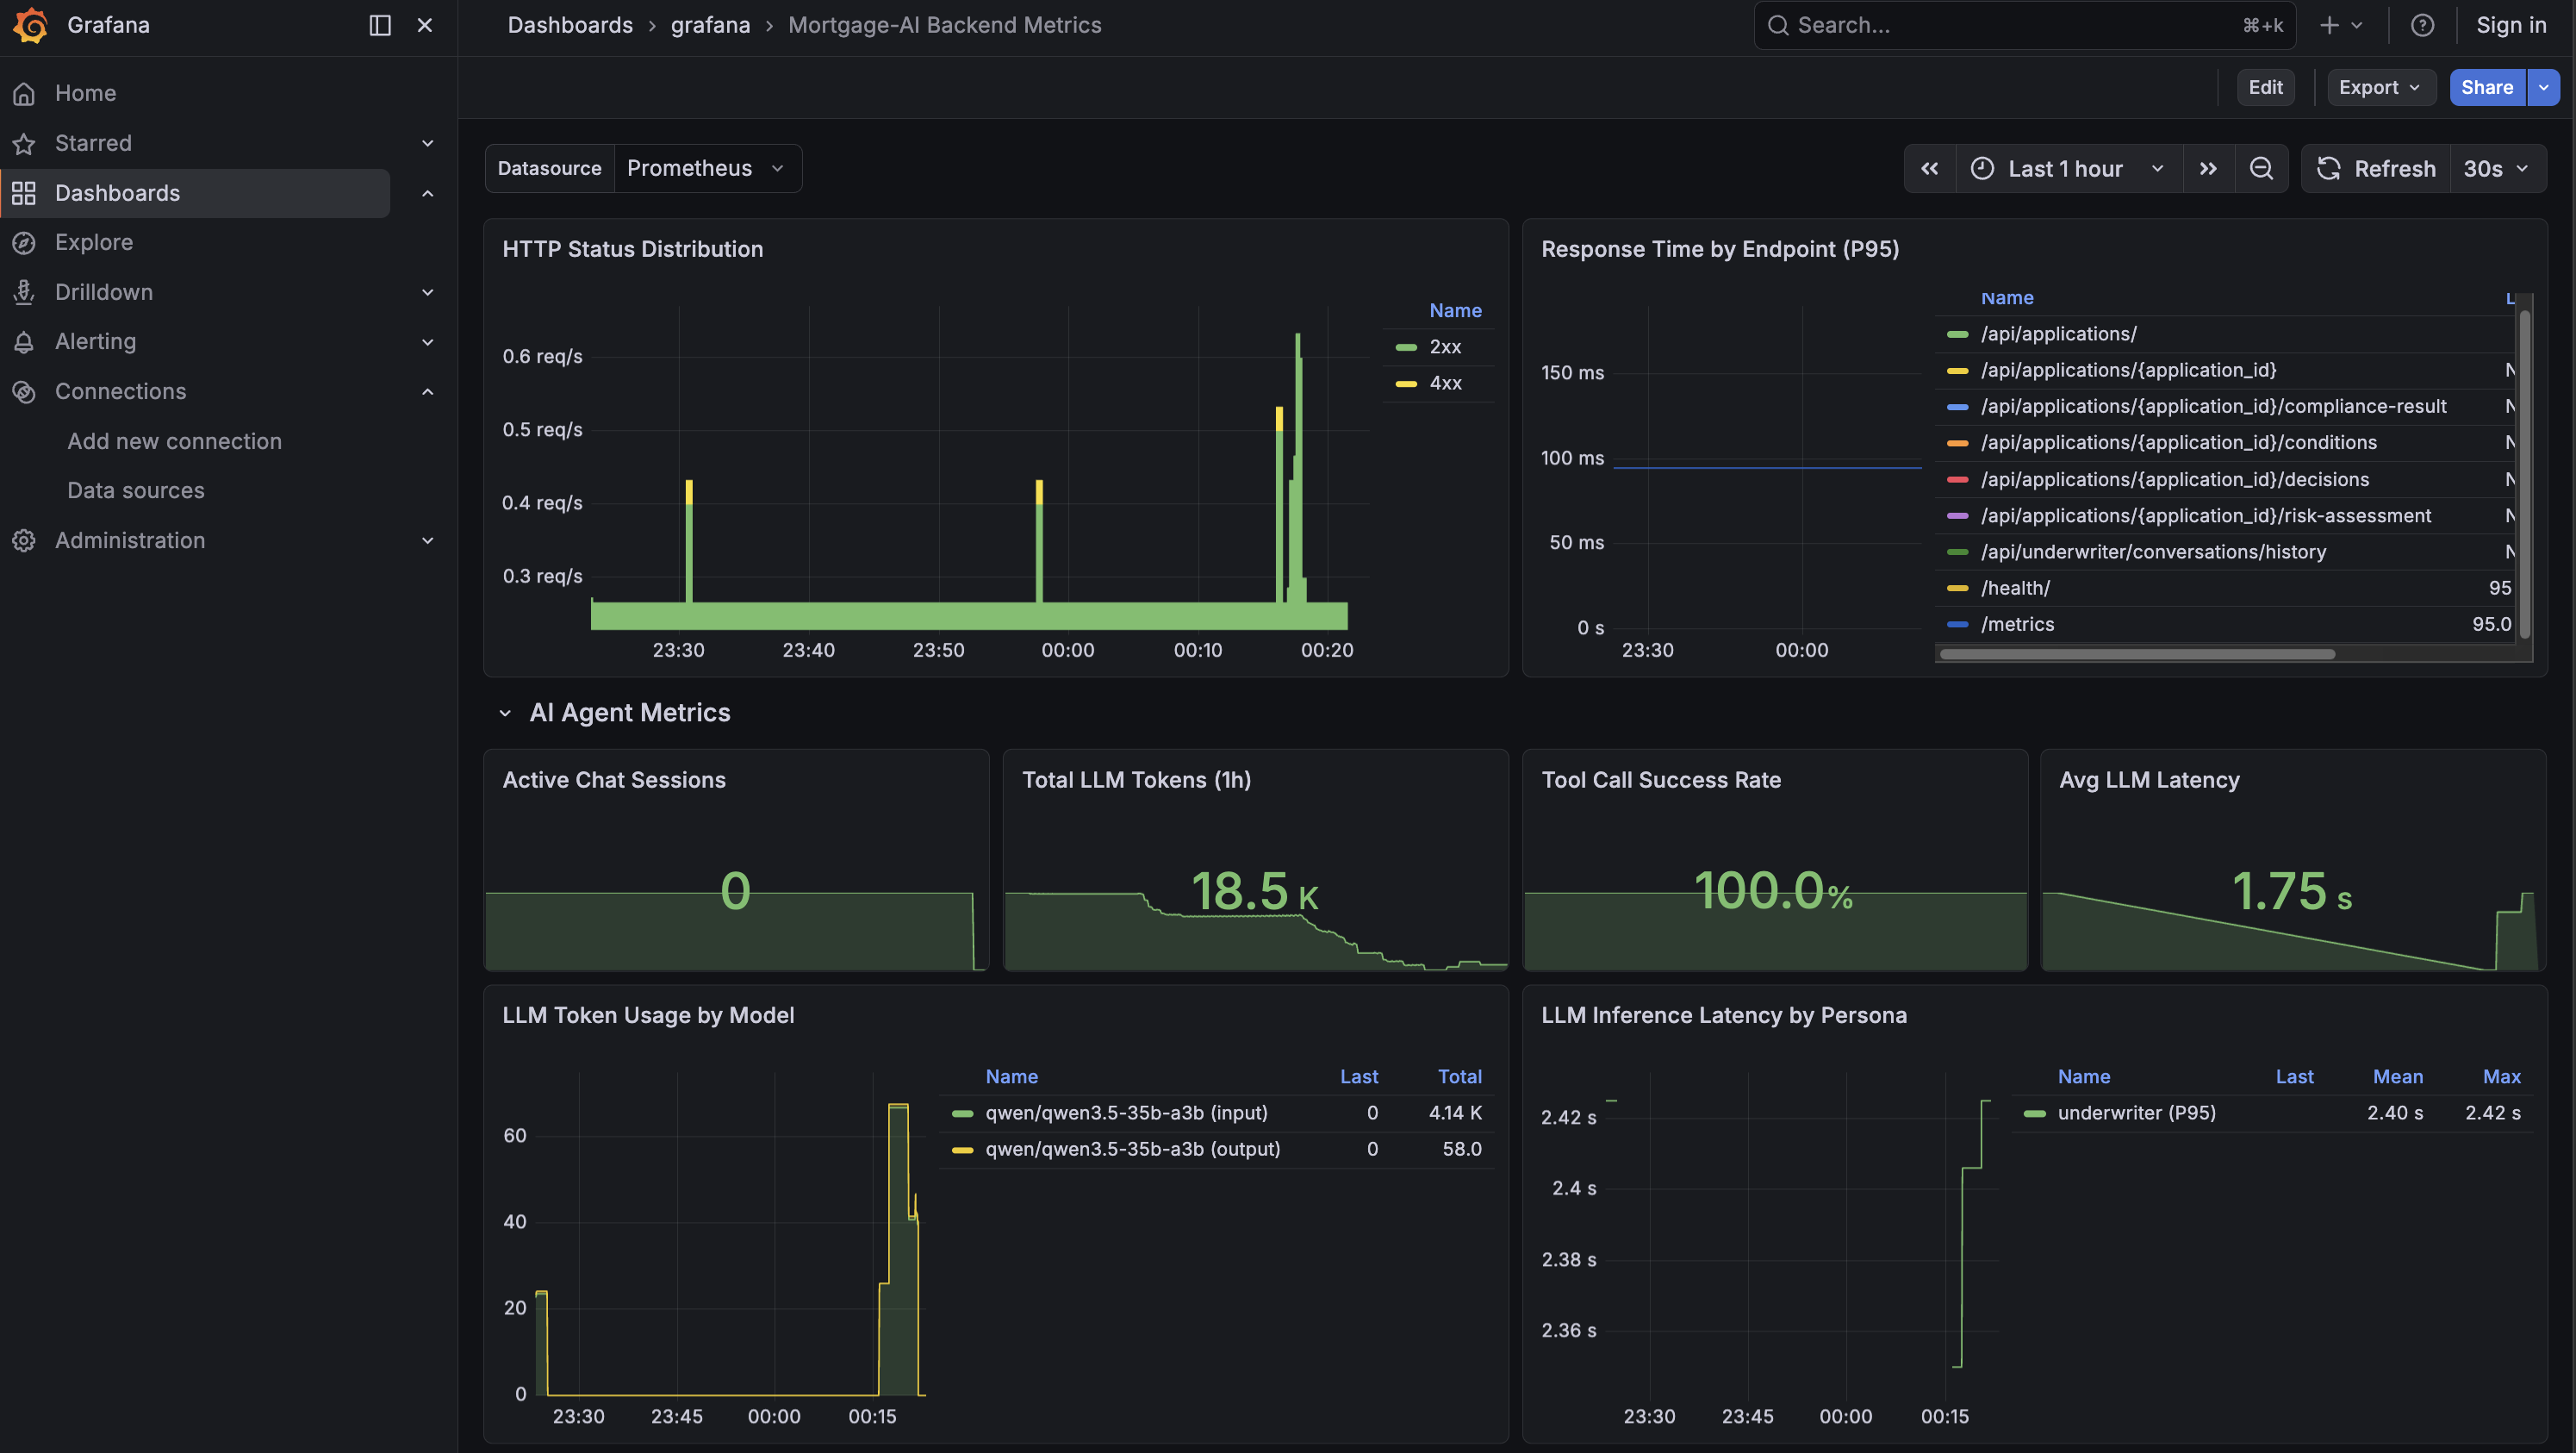
The 4 stat panels at the top of this section show:
-
Active Chat Sessions: live WebSocket connections. How many users are chatting right now?
-
Total LLM Tokens: cumulative tokens consumed since the API started. This is your cost proxy, in the screenshot, 18.5K tokens.
-
Tool Call Success Rate: are agent tools working? 100% means everything is healthy.
-
Avg LLM Latency: median time for an LLM inference call. 1.75s in the screenshot.
Below the stats, the detail panels show:
-
LLM Token Usage by Model: which model burns the most tokens? Is input or output dominant?
-
LLM Inference Latency by Persona: which agent persona is slowest? A slow underwriter agent might indicate complex compliance tool calls.
-
Agent Routing Distribution: pie chart of simple vs complex routing. A high ratio of complex queries means the capable model is doing most of the work.
-
Tool Calls by Status: green for success, red for failures. A spike in red means tool integrations are breaking.
PromQL details for AI Agent Metrics (click to expand)
-
LLM Tokens:
sum(increase(llm_tokens_total{namespace=~"$namespace"}[1h])) -
Tool Success Rate:
(sum(tool_calls_total{namespace=~"$namespace", status="success"}) / sum(tool_calls_total{namespace=~"$namespace"}) * 100) or vector(100) -
LLM Latency:
histogram_quantile(0.50, sum(rate(llm_inference_duration_seconds_bucket{namespace=~"$namespace"}[5m])) by (le)) -
Routing Distribution:
sum(agent_routing_total{namespace=~"$namespace"}) by (complexity)
The dashboard is managed as a GrafanaDashboard custom resource and version-controlled via GitOps. Run oc get grafanadashboard -n wksp-user1 to see it.
|
The traffic you generated in Module 1 (Explore Products, CEO portfolio health) is already reflected in these panels. Set the time range to Last 1 hour to see it.
Exercise 2: Explore application logs with LokiStack
Metrics show aggregated health, but when something goes wrong you need the actual log events. Red Hat AI includes LokiStack, a high-performance log aggregation system that automatically collects everything your application writes to STDOUT or STDERR—no code changes needed. Let’s explore the mortgage-ai logs.
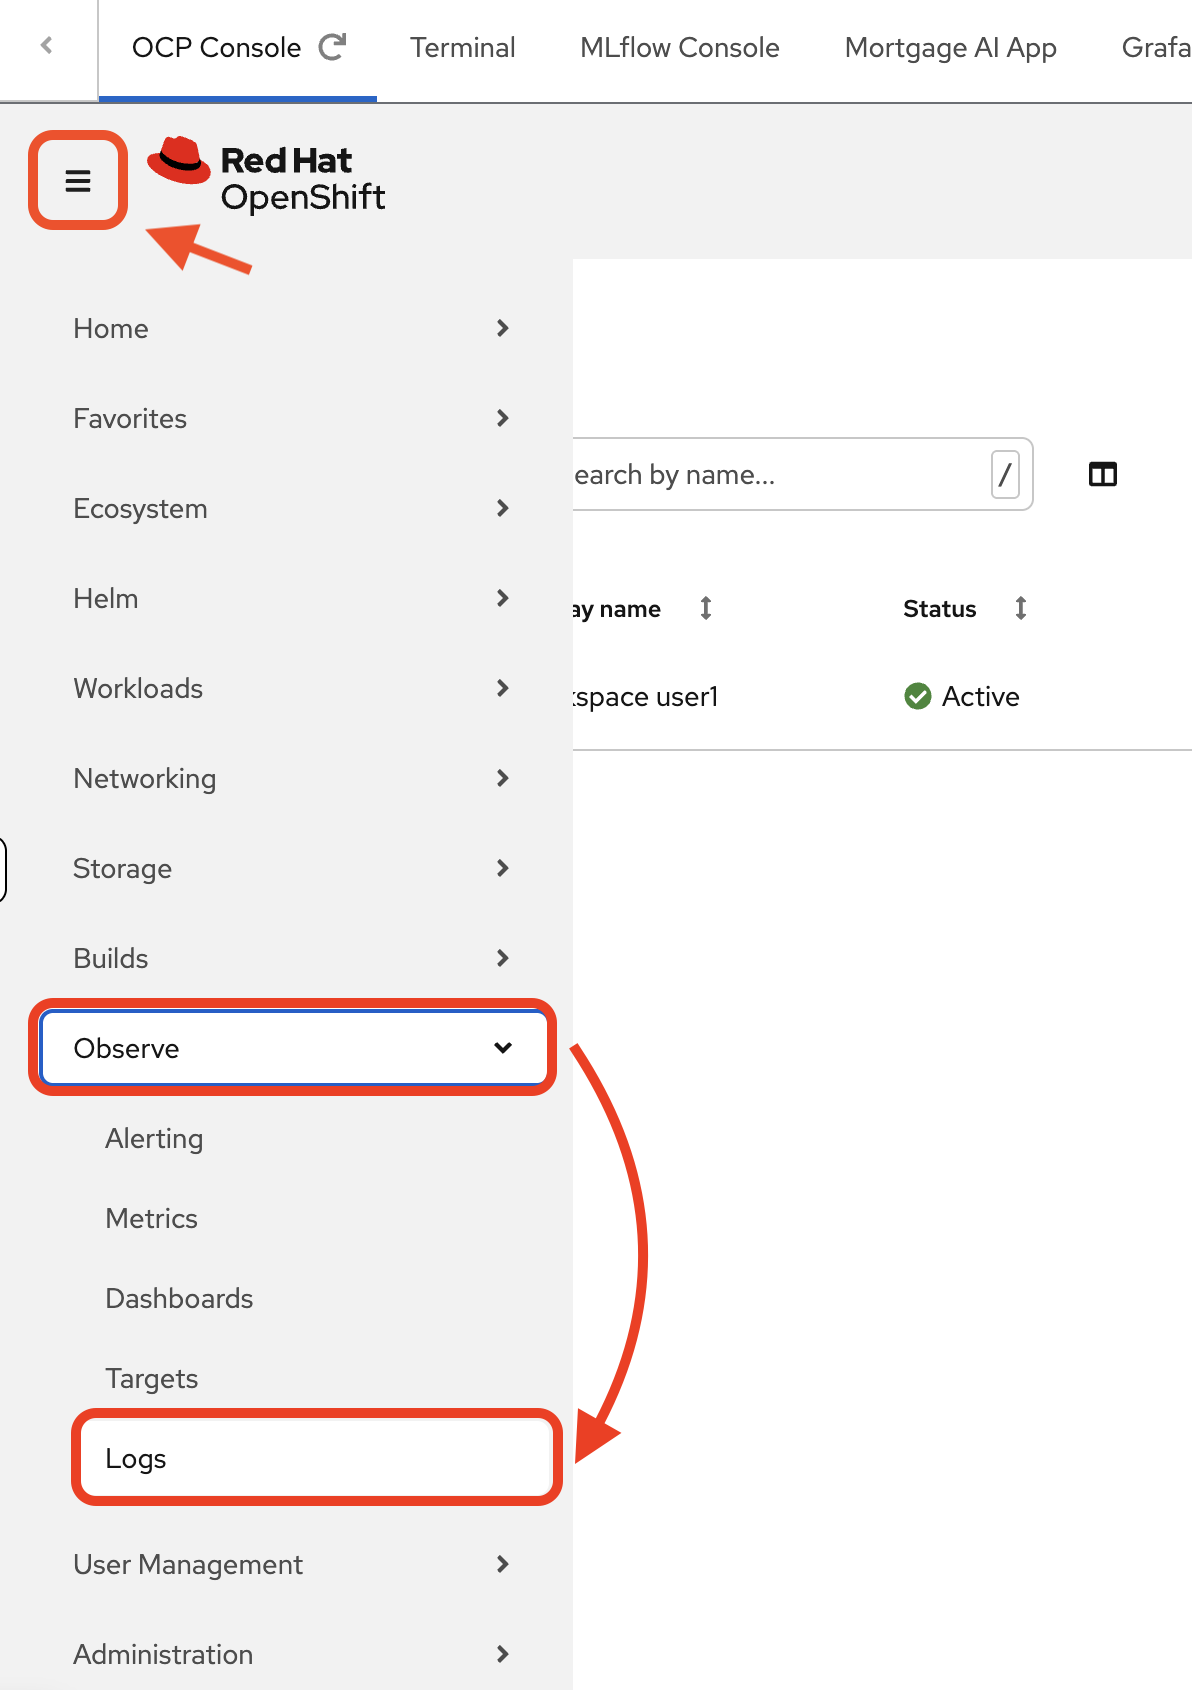
Navigate to the log viewer
-
Navigate to the OCP Console tab. Then navigate to Observe → Logs.
You’ll see a Forbidden — Missing permissions to get logs error:
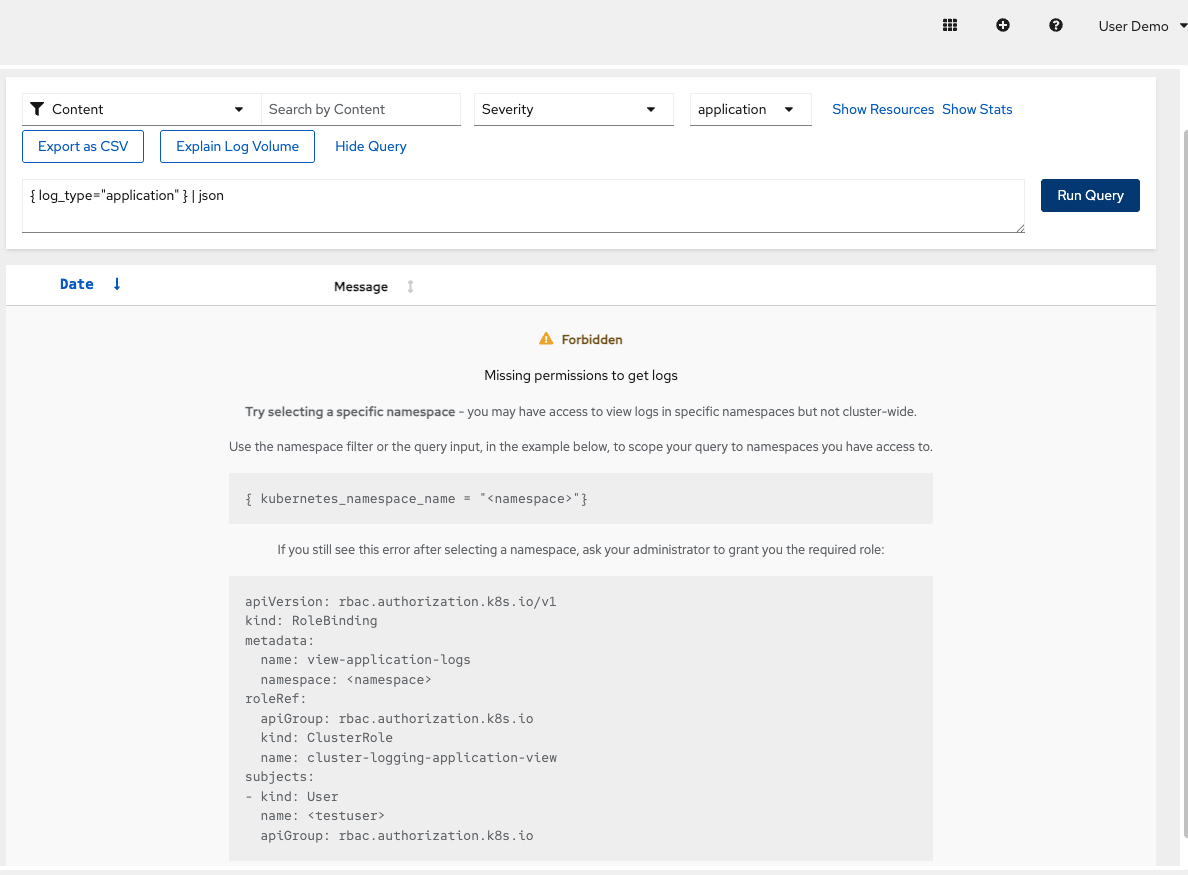
This is expected. Because you’re logged in as a regular user (
user1), OpenShift restricts log access to only your namespace for security. Cluster-wide log access is reserved for cluster administrators.
Scope logs to your namespace
-
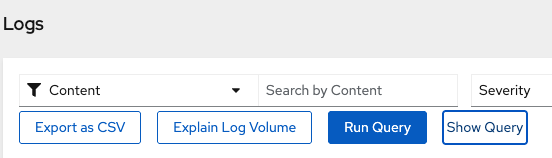
Click Show Query to open the query editor:
Enter this LogQL query to scope the logs to your namespace:
{ log_type="application", kubernetes_namespace_name="wksp-user1" }Click Run Query. You should now see logs from the mortgage-ai pods.
log_type="application"filters out infrastructure logs (kubelet, CRI-O). Thekubernetes_namespace_namelabel is injected automatically by the log collector.
Understanding the log format
What you see is structured JSON. Each log entry contains:
-
Kubernetes metadata: Pod IDs, container names, namespace labels, network configs
-
Application message: The actual log event from your application (in the
messagefield) -
Timestamps: When the event occurred
Scroll through a log entry to find the message field—that’s where the useful application data lives. The metadata helps correlate logs across containers and filter by pod, namespace, or container.
To quickly locate the message field in a log entry, use your browser’s find feature: Cmd+F (Mac) or Ctrl+F (Windows/Linux), then search for "message". This helps you skip past the Kubernetes metadata and jump straight to the application log content.
|
Extract application messages
-
Use LogQL to extract just the application messages and filter to API container logs:
{ log_type="application", kubernetes_namespace_name="wksp-user1", kubernetes_container_name="api" }
| json
| line_format "{{.message}}"
This strips the Kubernetes metadata and shows only what the application wrote to its logs.
How AI helps with log analysis
Raw logs contain rich data, but parsing JSON manually is tedious. In production, teams can use AI-powered observability tools to extract insights:
What AI assistants can do with these logs:
-
"Show me all errors from the CEO agent in the last hour"
-
"What caused the latency spike at 2pm?"
-
"Summarize today’s failed tool calls"
Example AI-generated insight:
Analysis of mortgage-ai logs (last hour):
• 42 tool calls: 40 succeeded, 2 failed
• Failures: get_credit_score timeout (30s)
• Slowest tool: get_pipeline_summary (avg 2.3s)
• Most active agent: Prospect (27 requests)
The raw data exists in LokiStack—AI makes it accessible without manual JSON parsing or complex queries.
Logs and traces are complementary
Logs capture detailed events: errors, warnings, debug output, tool results. They’re essential for:
-
Debugging specific failures ("What was the error message?")
-
Auditing compliance events ("Who accessed this PII?")
-
Investigating unexpected behavior ("Why did this calculation return zero?")
Module 4 introduces tracing, which complements logs by providing:
-
Hierarchical request flow across agents and tools
-
Timing breakdowns for each step
-
Parent-child relationships showing what called what
Together, logs and traces give you complete visibility: logs for detailed events, traces for request flow.
| LokiStack is a supported feature of Red Hat AI. Logs persist beyond pod lifetime—when a container restarts or gets redeployed, LokiStack retains the historical logs, making post-incident investigation possible. For multi-agent systems, this persistent log storage is essential for correlating events across API, UI, and database containers. |
Module summary
What you accomplished:
-
Explored the Grafana dashboard with HTTP and AI-specific agent metrics
-
Filtered application logs with LokiStack and LogQL queries
-
Correlated log entries across API and UI containers
Key takeaways:
-
Agentic apps need metrics beyond HTTP: token usage, inference latency, routing decisions, and tool success rates
-
Logs provide the detail that metrics aggregate away. This detail is essential for debugging ephemeral containers.
-
Metrics answer "how much?" and "how fast?". Logs answer "what exactly happened?"
Next steps:
Module 4 will introduce MLflow tracing, the key to understanding why things happen, not just what is happening.