Module 1: Transportation robot
This module explores the complete infrastructure running on Red Bot Logistics' autonomous transportation robots. Each robot runs Red Hat Device Edge (MicroShift), a lightweight Kubernetes platform optimized for resource-constrained environments.
Learning objectives
By the end of this module, you will be able to:
-
Connect to robot infrastructure via bastion host and verify MicroShift is operational
-
Deploy MinIO object storage using GitOps automation
-
Deploy AI model serving infrastructure with KServe
-
Deploy and access the Battery Monitoring System dashboard
Exercise 1.1: Robot infrastructure setup
Access the robot infrastructure and verify MicroShift is running.
Connect to transportation robot
Establish an SSH connection to the bastion host:
ssh {bastion_ssh_user_name}@{bastion_public_hostname} -p {bastion_ssh_port}Credential |
Value |
ssh user name |
|
ssh password |
|
If a message regarding the authenticity of the host is displayed, type yes to establish the connection.
|
Once connected to the bastion, access the transportation robot’s MicroShift VM:
virtctl ssh cloud-user@vmi/microshift -n microshift-001 --identity-file=/home/lab-user/.ssh/microshift-001Check MicroShift is running
Check that MicroShift is running:
sudo systemctl status microshiftExpected output should show active (running):
● microshift.service - MicroShift
     Loaded: loaded (/usr/lib/systemd/system/microshift.service; enabled)
     Active: active (running) since ...
Additionally you can check if all the MicroShift pods are Running:
oc get pods -AYou should see various pods in Running status across different namespaces:
NAMESPACE                  NAME                                         READY   STATUS      RESTARTS        AGE
kube-system                csi-snapshot-controller-74795dc54f-lp9tf     1/1     Running     0               1d
openshift-dns              dns-default-vk7fd                            2/2     Running     0               1d
openshift-dns              node-resolver-4dfs2                          1/1     Running     0               1d
openshift-gitops           argocd-application-controller-0              1/1     Running     0               1d
openshift-gitops           argocd-redis-648648759c-dngbg                1/1     Running     0               1d
openshift-gitops           argocd-repo-server-7bf65c5f8f-ljjzc          1/1     Running     0               1d
openshift-ingress          router-default-59f4f4c47b-hnqh9              1/1     Running     0               1d
openshift-ovn-kubernetes   ovnkube-master-p5dfb                         4/4     Running     0               1d
openshift-ovn-kubernetes   ovnkube-node-8cp97                           1/1     Running     0               1d
openshift-service-ca	   service-ca-755884c9cf-f2g4n                  1/1     Running     0               1d
openshift-storage          lvms-operator-65d4bdf577-j2g9z               1/1     Running     0               1d
openshift-storage          vg-manager-vg6lr                             1/1     Running     0               1d
redhat-ods-applications    kserve-controller-manager-548d8c4ffb-7pg5x   1/1     Running     0               1d
The following namespaces contain the essential MicroShift components:
| Namespace | Purpose |
|---|---|
|
Contains the core Kubernetes system pods |
|
Handles DNS resolution services for the cluster |
|
Provides the networking layer with OVN (Open Virtual Network) for communication between pods and services |
|
Manages local volume management services (LVM) for persistent storage |
|
Provides certificate authority services for internal cluster communication |
|
Handles external traffic routing to services running in the cluster |
Beyond the core MicroShift functionality, we can see that additional services are enabled:
| Namespace | Purpose |
|---|---|
|
Provides GitOps capabilities with ArgoCD components for continuous deployment and configuration management. Allows managing applications through Git-based workflows. |
|
Runs the KServe controller manager, which provides AI/ML model serving capabilities. Essential for deploying and managing AI models for stress detection and time-to-failure prediction. |
Exercise 1.2: MinIO storage deployment
MinIO provides S3-compatible object storage for AI models on the robot. The inference bucket stores 2 AI models:
-
Stress Detection - identifies battery stress conditions
-
Time to Failure - predicts remaining battery life
Both models are stored in OpenVINO IR format (.xml and .bin files) in versioned directories.
Create GitOps application project
Create the default project for GitOps applications:
oc apply -f - <<EOF
kind: AppProject
apiVersion: argoproj.io/v1alpha1
metadata:
  name: default
  namespace: openshift-gitops
spec:
  clusterResourceWhitelist:
  - group: '*'
    kind: '*'
  destinations:
  - namespace: '*'
    server: '*'
  sourceRepos:
  - '*'
EOF
Deploy MinIO using GitOps
Deploy MinIO by creating a GitOps Application:
oc apply -f - <<EOF
apiVersion: argoproj.io/v1alpha1
kind: Application
metadata:
  name: minio-microshift
  namespace: openshift-gitops
spec:
  destination:
    server: https://kubernetes.default.svc
  source:
    path: bootstrap/minio-microshift/groups/dev
    repoURL: https://github.com/rhpds/ai-lifecycle-edge-gitops.git
    targetRevision: main
  project: default
  syncPolicy:
    automated:
      prune: true
      selfHeal: true
EOF
This deploys:
-
Namespace -
minionamespace for isolation -
Deployment - MinIO server instance
-
Service & Route - Web dashboard access
-
PersistentVolumeClaim - Storage for model files
-
Bucket creation - Automatically creates
inferencebucket -
Model download - Downloads baseline Stress Detection and Time to Failure models from GitHub
Watch the deployment:
watch oc get pods -n minio
Press Ctrl+C to exit when pods show Running and Completed status.
|
Access MinIO dashboard
Once deployed, access the MinIO web console:
-
Open the MinIO dashboard and login with credential:
https://minio-microshift-001.apps.cluster.example.comCredential Value Username
minioPassword
minio123 -
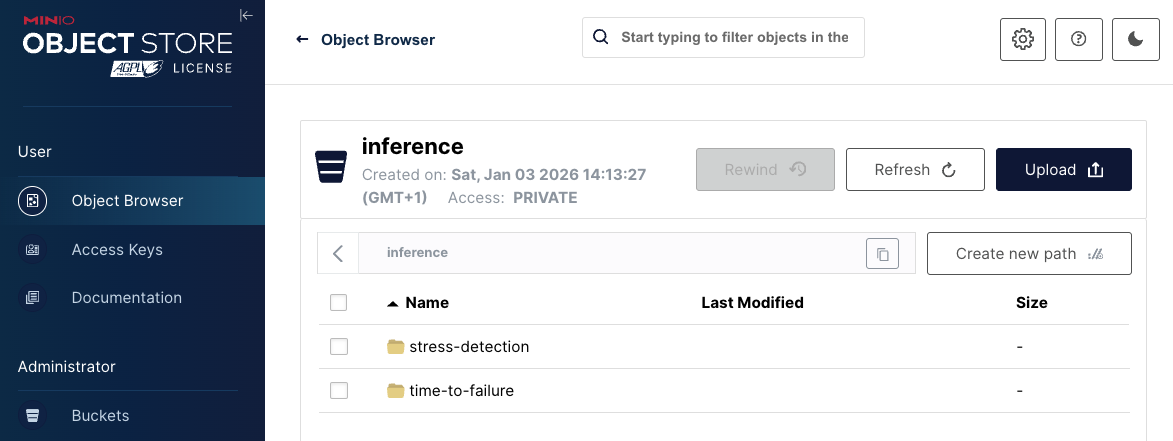
Verify the
inferencebucket contains 2 directories:-
stress-detection/1/- Baseline Stress Detection model files (.xml,.bin) -
time-to-failure/1/- Baseline Time to Failure model files (.xml,.bin)
-
Exercise 1.3: Model serving deployment
The inference server loads AI models from MinIO and exposes REST API endpoints for real-time predictions. It uses KServe optimized for edge deployments.
Deploy model serving using GitOps
Deploy the inference server GitOps application:
oc apply -f - <<EOF
apiVersion: argoproj.io/v1alpha1
kind: Application
metadata:
  name: model-server
  namespace: openshift-gitops
spec:
  destination:
    server: https://kubernetes.default.svc
  source:
    path: bootstrap/model-server/groups/dev
    repoURL: https://github.com/rhpds/ai-lifecycle-edge-gitops.git
    targetRevision: main
  project: default
  syncPolicy:
    automated:
      prune: true
      selfHeal: true
EOF
This deploys:
-
Namespace -
inferencenamespace for model serving -
ServingRuntime - Defines the model server container (OpenVINO Model Server)
-
Service Account: Provides S3 credentials to access MinIO storage
-
Service & Routes - External access to inference endpoints
-
InferenceServices (2): Connects models from MinIO to the ServingRuntime
-
stress-detection- Loads stress detection model from MinIO -
time-to-failure- Loads time-to-failure model from MinIO
-
Watch the deployment:
watch oc get pods -n inference
Press Ctrl+C to exit when all pods show Running status.
|
Test inference endpoints
Verify that models are loaded and responding to inference requests.
Test stress detection model:
curl -s -X POST http://$(oc get pod -n inference -l app=isvc.stress-detection-predictor -o jsonpath='{.items[0].status.podIP}'):8888/v2/models/stress-detection/infer \
     -H "Content-Type: application/json" \
     -d '{"inputs": [{"name": "keras_tensor", "shape": [1, 9], "datatype": "FP32", "data": [0.5, 0.5, 0.5, 0.5, 0.5, 0.5, 0.5, 0.5, 0.5]}]}' | \
     jq -r '.outputs[0].data[0] | if . > 0.5 then "STRESSED" else "NORMAL" end'
Expected output: STRESSED or NORMAL
Test time to failure model:
curl -s -X POST http://$(oc get pod -n inference -l app=isvc.time-to-failure-predictor -o jsonpath='{.items[0].status.podIP}'):8888/v2/models/time-to-failure/infer \
     -H "Content-Type: application/json" \
     -d '{"inputs": [{"name": "keras_tensor", "shape": [1, 5], "datatype": "FP32", "data": [40.0, 48.0, 162.5, -2.0, -18.0]}]}' | \
     jq -r '.outputs[0].data[0] | "Predicted Time Before Failure: \(.) hours"'
Expected output: Predicted Time Before Failure: <number> hours
Exercise 1.4: Battery monitoring system deployment
The Battery Monitoring System (BMS) brings together all robot components to provide real-time battery health monitoring. It collects telemetry data, displays it on a dashboard, and uses the AI inference endpoints to generate predictions.
Deploy BMS using GitOps
Deploy the complete Battery Monitoring System application:
oc apply -f - <<EOF
apiVersion: argoproj.io/v1alpha1
kind: Application
metadata:
  name: battery-simulation
  namespace: openshift-gitops
spec:
  destination:
    server: https://kubernetes.default.svc
    namespace: battery-demo
  source:
    path: bootstrap/battery-simulation/groups/dev
    repoURL: https://github.com/rhpds/ai-lifecycle-edge-gitops.git
    targetRevision: main
    kustomize:
      patches:
        - target:
            kind: ConfigMap
            name: bms-dashboard-config
          patch: |-
            - op: replace
              path: /data/config.json
              value: |
                {
                  "BATTERY_METRICS_WS_ENDPOINT": "wss://mqtt2ws-microshift-001.apps.cluster.example.com/battery/metrics/",
                  "OPEN_AI_API_KEY": "my-key",
                  "STRESS_DETECTION_AI_API_ENDPOINT": "https://stress-detection-predictor-microshift-001.apps.cluster.example.com/",
                  "TIME_TO_FAILURE_AI_API_ENDPOINT": "https://time-to-failure-predictor-microshift-001.apps.cluster.example.com/",
                  "BATTERY_SIMULATION_API_ENDPOINT": "https://battery-simulation-microshift-001.apps.cluster.example.com/",
                  "AUTO_INFERENCE_INTERVAL_MS": 30000
                }
  project: default
  syncPolicy:
    automated:
      prune: true
      selfHeal: true
EOF
This deploys:
-
Battery Simulator - Quarkus app generating realistic telemetry
-
MQTT Broker - Mosquitto broker as central messaging hub
-
Data Processors -
mqtt2ws(WebSocket) anddata-ingester(InfluxDB) -
InfluxDB - Time-series database for historical sensor data
-
BMS Dashboard - Web UI showing real-time telemetry and AI predictions
Monitor the deployment:
watch oc get pods -n battery-demo
Press Ctrl+C to exit when all pods show Running status.
|
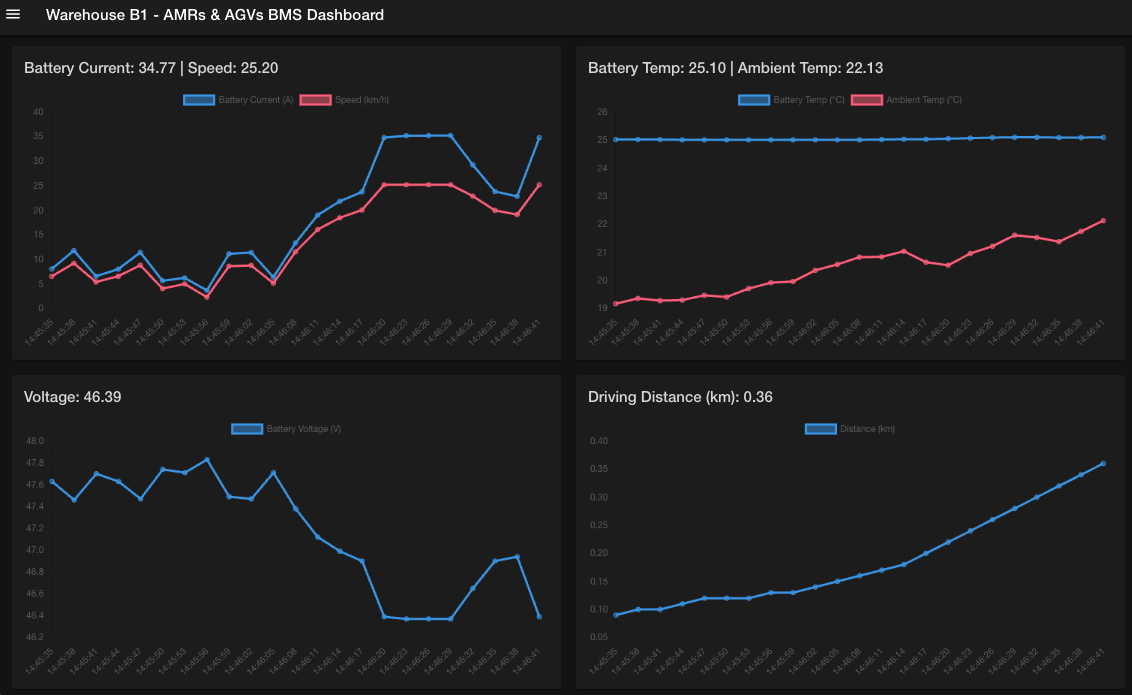
Access the BMS dashboard
Open the Battery Monitoring System dashboard:
https://bms-dashboard-microshift-001.apps.cluster.example.comThe dashboard will display real-time battery telemetry data, AI predictions for stress detection and time-to-failure, and provide alerting capabilities for battery health monitoring.
Check data in InfluxDB
Also you can access the InfluxDB dashboard where the sensor data is collected and prepared to be sent to the BMS dashboard.
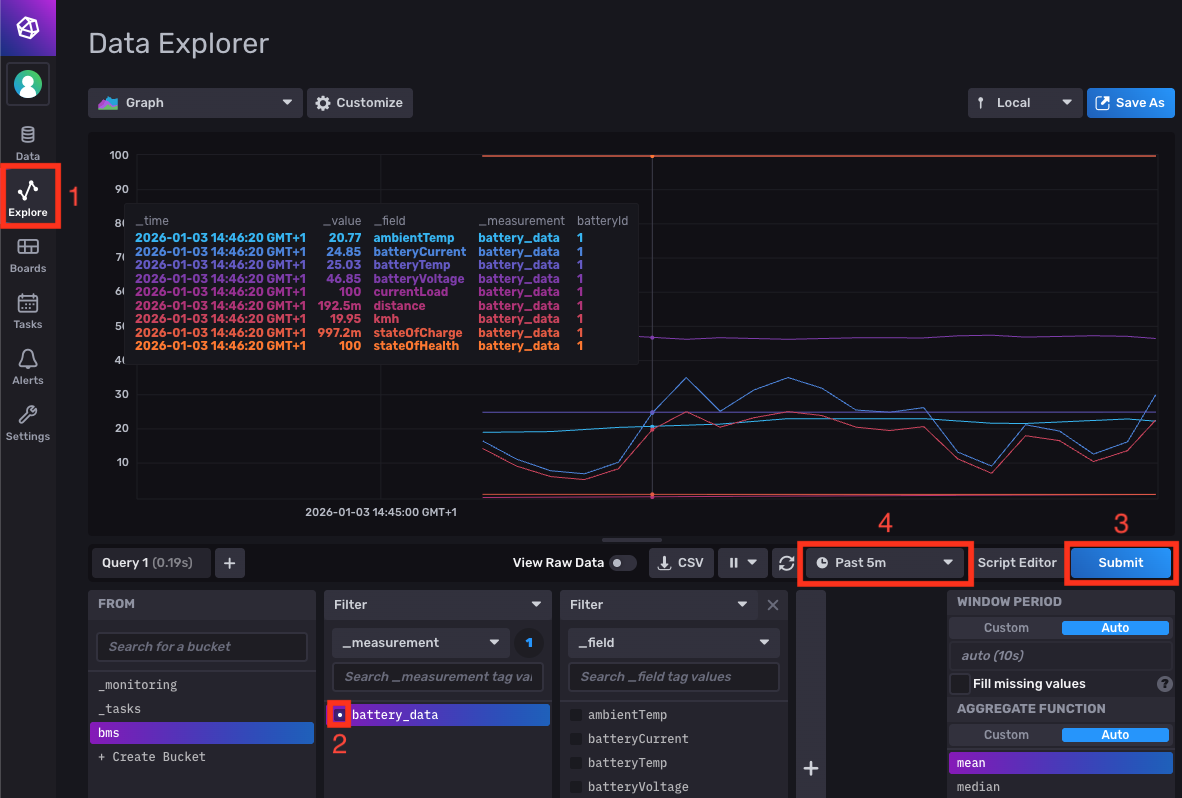
Access the InfluxDB dashboard to see historical sensor data:
-
Open the InfluxDB dashboard and login with credentials:
https://influx-db-microshift-001.apps.cluster.example.comCredential Value Username
adminPassword
password -
Navigate to Explore in the left menu
-
Query battery data:
-
Select the
bmsbucket from the dropdown -
Choose
battery_datameasurement -
Click Submit to execute the query
-
Adjust the time interval (e.g., "Past 5 minutes") to see recent data.
-
Verify
✓ All 7 BMS pods show 1/1 ready and Running status
✓ BMS dashboard loads successfully in browser
✓ Telemetry charts show live updates (voltage, temperature, etc.)
✓ AI Prediction panel displays stress detection status
✓ Time to Failure shows estimated hours remaining
✓ InfluxDB contains bms bucket with battery_data measurement
✓ Time-series graphs display sensor values
Summary
You have successfully deployed the complete transportation robot infrastructure on MicroShift. The robot now has:
✓ MicroShift - Lightweight Kubernetes platform running on RHEL 9.6
✓ MinIO Storage - S3-compatible storage with AI models in the inference bucket
✓ Model Serving - OpenVINO inference servers for Stress Detection and Time to Failure models
✓ Battery Monitoring System - Complete telemetry collection, visualization, and AI prediction
What You’ve Learned:
-
How to access edge infrastructure via bastion host
-
GitOps-based deployment for edge automation
-
S3 object storage for AI model distribution
-
KServe model serving architecture on edge devices
-
Inference API request/response format (KServe v2 protocol)
-
Real-time telemetry collection and time-series storage
-
Integration of AI predictions into monitoring dashboards
The robot is now operational with real-time battery health monitoring.
Next, you’ll explore the Single Node OpenShift (SNO) retraining server where AI models are automatically retrained every 10 minutes using fresh data from the robot fleet.
Navigate to Module 2: Red Hat OpenShift AI configuration.