Module 6: Test alerts
This module explores the alerting and monitoring infrastructure that ensures AI models continue to perform accurately over time. You’ll test the battery monitoring system alerts and understand how real-time predictions trigger notifications.
Learning objectives
By the end of this module, you will be able to:
-
Understand the Battery Monitoring System (BMS) dashboard architecture
-
Test stress detection alerts with simulated battery conditions
-
Verify time-to-failure predictions trigger maintenance notifications
-
Monitor real-time inference execution on the robot edge devices
-
Understand the complete data flow from sensors through AI to alerting
Exercise 6.1: Review the BMS dashboard
The Battery Monitoring System (BMS) dashboard provides a comprehensive view of battery health through real-time telemetry visualization and AI-powered predictions. This exercise explores the key components of the dashboard interface.
Open the Battery Monitoring System dashboard:
https://bms-dashboard-microshift-001.apps.cluster.example.comThe dashboard displays three main panels:
-
Alerts - Real-time AI inference results from both models
-
Actions - Control panel for battery stress simulation and to manually trigger inference
-
Battery Telemetry - Live voltage, temperature, state of charge graphs, etc
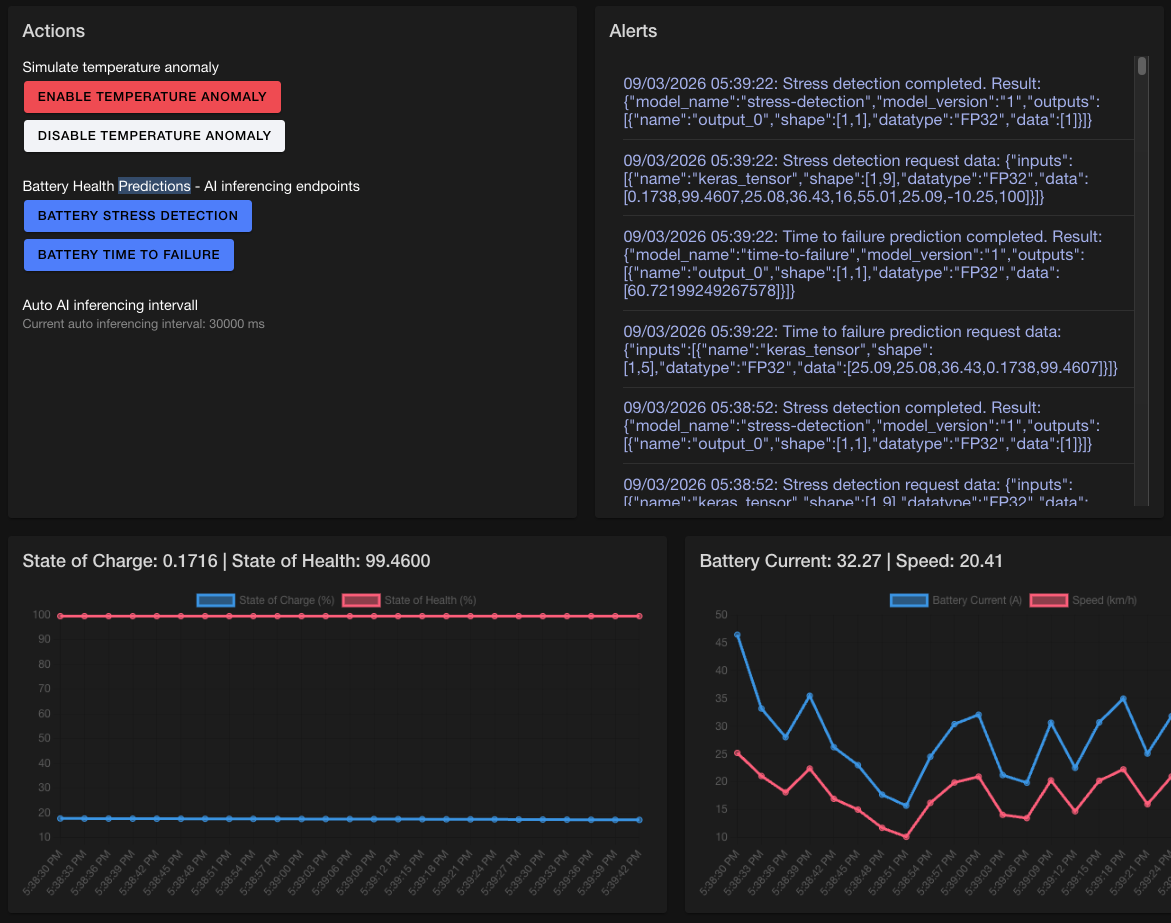
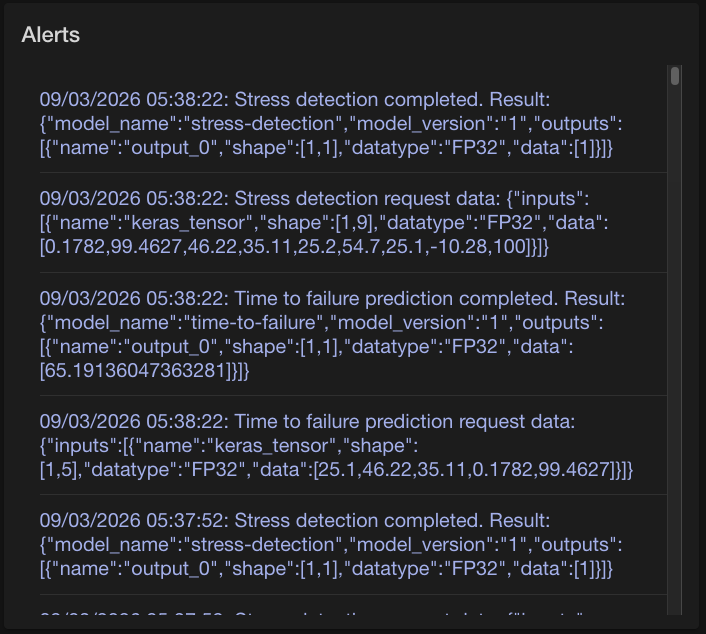
Alerts panel
The Alerts panel displays real-time inference results from both AI models running on the robot edge devices. Every few seconds, the dashboard automatically sends current battery telemetry to the inference endpoints and displays the prediction results.
The dashboard continuously queries both model serving endpoints running in the Microshift robot:
-
Stress Detection endpoint
-
Time to Failure endpoint
Each inference request sends current battery telemetry as a JSON payload to the model endpoints.
For Stress Detection the Alerts panel shows entries like:
09/03/2026 05:27:52: Stress detection completed.
Result: {"model_name":"stress-detection","model_version":"1",
        "outputs":[{"name":"output_0","shape":[1,1],
                   "datatype":"FP32","data":[1]}]}
Interpreting the response:
-
model_name: "stress-detection"- Confirms which model processed the request -
model_version: "1"- Indicates the model version currently deployed (increments after retraining) -
outputs[0].shape: [1,1]- Single prediction value returned -
outputs[0].datatype: "FP32"- 32-bit floating point number -
outputs[0].data: [1]- Stress score prediction
Stress score interpretation:
-
Value 0 - Battery operating normally, no stress detected
-
Value 1 - Battery under stress, immediate attention required
In the example above, data:[1] indicates maximum stress detected - the battery is experiencing critical stress conditions that require immediate investigation.
For Time to Failure the Alerts panel shows entries like:
09/03/2026 05:28:22: Time to failure prediction completed.
Result: {"model_name":"time-to-failure","model_version":"1",
        "outputs":[{"name":"output_0","shape":[1,1],
                   "datatype":"FP32","data":[64.732421875]}]}
-
model_name: "time-to-failure"- Confirms the time-to-failure prediction model -
model_version: "1"- Model version currently deployed -
outputs[0].shape: [1,1]- Single prediction value -
outputs[0].datatype: "FP32"- 32-bit floating point number -
outputs[0].data: [64.732421875]- Predicted hours until battery failure
Time to failure interpretation:
-
Value: Number of hours the battery can continue operating before failure
-
Example:
64.732421875hours = approximately 2.7 days of remaining operational life
Actions panel
While inference execution and battery data generation occur automatically in the background, the Actions panel provides manual controls for testing and simulating specific battery conditions. This panel allows operators to trigger on-demand inference requests and simulate temperature anomalies for testing purposes.
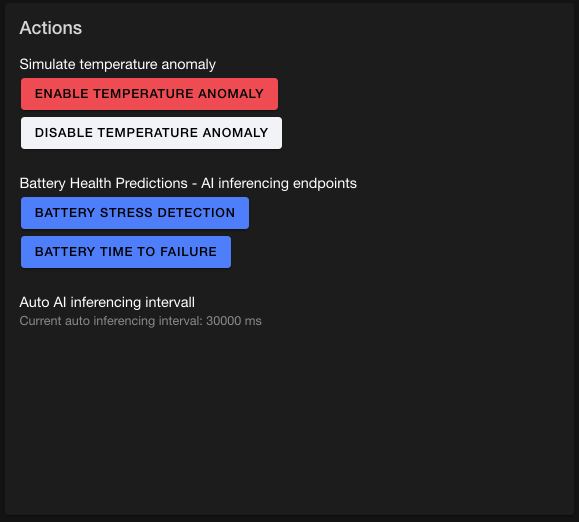
The Actions panel includes two buttons for manually triggering inference requests:
-
Battery Stress Detection - Sends an immediate inference request to the Stress Detection model
-
Battery Time to Failure - Sends an immediate inference request to the Time to Failure model
The Actions panel also includes controls for simulating temperature anomalies in the battery system:
-
Enable Temperature Anomaly - Injects a temperature spike into the battery simulation
-
Disable Temperature Anomaly - Returns battery temperature to normal simulation parameters
The Actions panel complements the automatic inference system by providing immediate feedback and enabling controlled testing scenarios without waiting for the automatic inference interval.
Battery Telemetry panel
The Battery Telemetry panel displays real-time graphs of critical battery metrics collected from the robot sensors. These visualizations provide operators with immediate insight into battery performance and operating conditions. The telemetry data shown in these graphs is also sent to the AI models for inference.
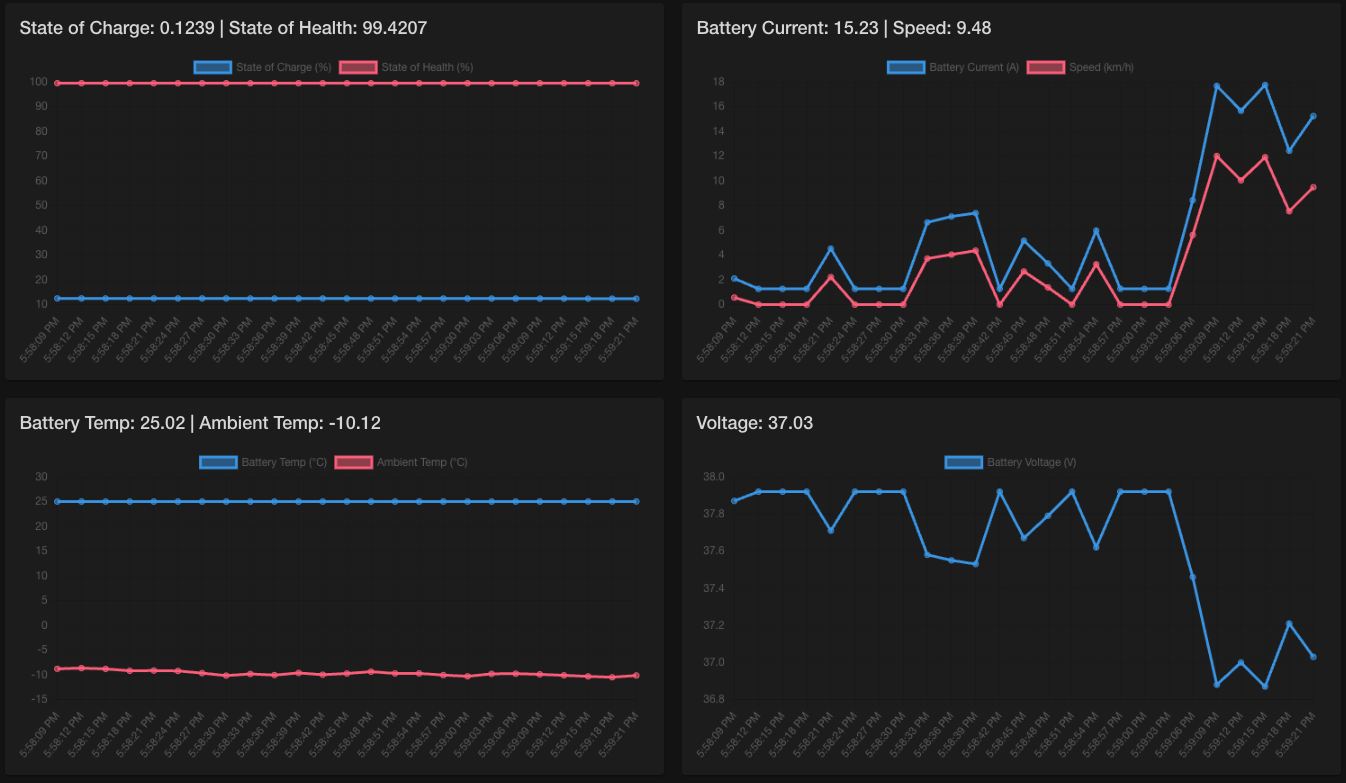
State of Charge & State of Health:
-
State of Charge (SoC) - Represents the current battery charge level as a percentage (0-1 range)
-
State of Health (SoH) - Indicates overall battery health as a percentage
These metrics work together to assess battery condition. A robot with low SoC (needs charging) but high SoH (battery still healthy) simply needs recharging. However, a battery with declining SoH requires eventual replacement regardless of charge level. The AI models use both values to predict stress and time-to-failure.
Battery Current & Speed:
-
Battery Current - Current flowing from the battery (positive = discharging, negative = charging)
-
Speed - Robot’s current movement speed in meters per second (km/h)
Higher robot speeds require more power, resulting in higher battery current draw. When speed increases, current draw typically increases proportionally. Observing this correlation helps validate sensor accuracy and identify anomalies (e.g., high current with low speed might indicate mechanical resistance or motor issues). This relationship is important for the AI models to understand normal vs. stressed battery behavior.
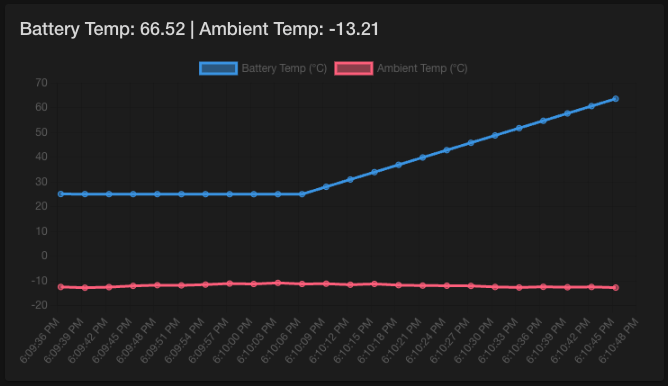
Battery Temperature & Ambient Temperature:
-
Battery Temp - Internal battery temperature (°C)
-
Ambient Temp - Environmental temperature around the robot (°C)
Battery temperature should remain within safe limits regardless of ambient conditions. A large temperature difference between battery and ambient indicates the battery is generating heat (normal during discharge) or external heating systems are active. If battery temperature rises significantly above ambient during light use, this could indicate internal stress or degradation that the AI models should detect.
Other parameters:
-
Voltage - Current battery voltage (V)
Voltage drops under load indicate battery health; rapid voltage drops suggest degradation.
-
Driving Distance - Total accumulated distance traveled by the robot (km)
Combined with battery metrics, helps predict when maintenance is needed based on usage patterns
When you observe unusual patterns in these graphs (e.g., rapid voltage drops, temperature spikes, erratic current draw), the AI models analyze the same data and generate alerts visible in the Alerts panel. The Telemetry panel provides the visual context to understand why AI models generate specific predictions.
Exercise 6.2: Test battery health alerts
In this section, we will make use of the Actions panel to simulate a stressed battery.
Simulate temperature anomaly
The battery simulator allows you to manually trigger stress conditions for testing:
-
Locate the Actions panel
-
Press the Enable temperature anomaly button
-
Observe the battery temperature increasing dramatically
-
At some point, you should see an alert popping up:

Trigger manual inference
-
In the Actions panel, press the Battery Stress Detection button
-
Check the Alerts panel and locate the latest
Stress detection completedalert09/03/2026 06:20:47: Stress detection completed. Result: {"model_name":"stress-detection","model_version":"1", "outputs":[{"name":"output_0","shape":[1,1], "datatype":"FP32","data":[1]}]} -
Verify the
outputs[0].datafield shows1, meaning the battery is under stress conditions -
In the Actions panel, press the Battery Time to Failure button
-
Check the Alerts panel and locate the latest
Time to failure prediction completedalert09/03/2026 06:21:52: Time to failure prediction completed. Result: {"model_name":"time-to-failure","model_version":"1", "outputs":[{"name":"output_0","shape":[1,1], "datatype":"FP32","data":[15.579248022]}]} -
Verify the
outputs[0].datafield shows a lower time to battery failure (compared to normal conditions) -
Finally, click Disable Temperature Anomaly to return the battery to normal operating conditions
Summary
You have successfully tested the complete AI-powered battery monitoring and alerting system:
✓ Dashboard Access - Accessed BMS dashboard with real-time telemetry visualization
✓ Auto-Inference - Verified automatic prediction updates every few seconds
✓ Stress Alerts - Simulated battery stress and verified alert triggers
✓ Time-to-Failure Predictions - Monitored remaining battery life estimates
✓ Inference Verification - Confirmed both model endpoints respond correctly
✓ Simulation Control - Tested battery parameter adjustment and reset
✓ Inference Log Monitoring - Observed real-time model server inference execution
What You’ve Learned:
-
Complete architecture of AI-powered monitoring system
-
Real-time inference log monitoring and performance analysis
-
Integration of AI inference into operational dashboards
-
Alert configuration at the edge
-
End-to-end testing with battery simulation
The Complete AI Lifecycle at the Edge:
Throughout this workshop, you’ve explored:
Module 1: Transportation robot - Deployed MicroShift, MinIO, model serving, and BMS on edge devices
Module 2: Red Hat OpenShift AI configuration - Configured Red Hat OpenShift AI for ML workloads
Module 3: Model training - Trained battery health prediction models in Jupyter notebooks
Module 4: Model serving - Deployed and tested inference endpoints for real-time predictions
Module 5: Pipeline automation - Configured automated retraining every 10 minutes
Module 6: Test alerts - Verified end-to-end monitoring and alerting system
You now understand how to build, deploy, and maintain self-improving AI systems at the edge.
This architecture enables:
-
Autonomous Operations - Robots operate with minimal human oversight
-
Predictive Maintenance - Prevent failures before they occur
-
Continuous Improvement - Models get better over time with fresh data
-
Edge Efficiency - Low latency inference where decisions are made
-
Operational Resilience - Automated recovery from failures
Thank you for completing the AI Lifecycle at the Edge workshop!