Introduction
Azure Red Hat OpenShift (ARO) clusters store log data inside the cluster by default. Understanding metrics and logs is critical in successfully running your cluster. Included with ARO is the OpenShift Cluster Logging Operator, which is intended to simplify log management and analysis within an ARO cluster, offering centralized log collection, powerful search capabilities, visualization tools, and integration with other other Azure systems like Azure Files.
In this section of the workshop, we’ll configure ARO to forward logs and metrics to Azure Files and view them using Grafana.
Configure Autoscaling for All Worker MachineSets
OpenShift Cluster Logging takes place in the cluster itself, so we need to scale up the number of worker nodes. We’ll use the MachineAutoscaler on each of the existing MachineSets to scale up the number of worker nodes.
-
To deploy the MachineAutoscalers, run the following command:
MACHINESETS=$(oc -n openshift-machine-api get machinesets -o name | cut -d / -f2 )

for MACHINESET in $(echo ${MACHINESETS}); do
cat <<EOF | oc apply -f -
---
apiVersion: "autoscaling.openshift.io/v1beta1"
kind: "MachineAutoscaler"
metadata:
  name: "${MACHINESET}"
  namespace: "openshift-machine-api"
spec:
  minReplicas: 1
  maxReplicas: 3
  scaleTargetRef:
    apiVersion: machine.openshift.io/v1beta1
    kind: MachineSet
    name: "${MACHINESET}"
EOF
done
| Be patient with this lab. As you progress through this lab deploying logging be aware that it will take about five minutes to provision each machine and another one minute for the Nodes to become Ready. |
-
Be prepareed to watch the progress of the MachineAutoscaler as you work through this lab with the following commands.
-
Get the list of Pods in state "Pending", which triggers the MachineAutoscaler to scale up the number of worker nodes
-
Get the list of Machines in the cluster, which you will see in various states as they are being provisioned
-
Get the list of Nodes as they become ready and the Pods in Pending are deployed to them
oc get pods -A | grep Pending
oc -n openshift-machine-api get machines -l "machine.openshift.io/cluster-api-machine-role=worker"
oc get nodes -o wide
-
Configure Metrics and Log Forwarding to Azure Files
-
First, let’s create our Azure Files storage account. To do so, run the following command::
AZR_STORAGE_ACCOUNT_NAME="storage${GUID}"

ARO_LOCATION=$(az aro show --resource-group openenv-${GUID} --name aro-cluster-${GUID} --query location -o tsv)

az storage account create --name "${AZR_STORAGE_ACCOUNT_NAME}" --allow-blob-public-access --resource-group "openenv-${GUID}" --location "${AZ_LOCATION}" --sku Standard_LRS
Sample OutputThe public access to all blobs or containers in the storage account will be disallowed by default in the future, which means default value for --allow-blob-public-access is still null but will be equivalent to false. { "accessTier": "Hot", "accountMigrationInProgress": null, "allowBlobPublicAccess": true, "allowCrossTenantReplication": false, [... Lots of output Omitted ...]You may get an error about rate limiting when running the
az storage account createcommand. If so just wait a few seconds and repeat the command. -
Next, let’s grab our storage account key. To do so, run the following command:
AZR_STORAGE_KEY=$(az storage account keys list --resource-group "openenv-${GUID}" -n "${AZR_STORAGE_ACCOUNT_NAME}" --query "[0].value" -o tsv)

echo ${AZR_STORAGE_KEY}
Sample Outputgr6ujd144KyO14BVQ5cEupJw/MWQx/XvXxQE/eG62oOvoVfnLVO68EcFGDygSXQD4pUGx+oA+wNJ+AStwccBSw== -
Now, let’s create a separate storage bucket for logs and metrics. To do so, run the following command:
az storage container create --name "aro-logs" \
  --account-name "${AZR_STORAGE_ACCOUNT_NAME}" \
  --account-key "${AZR_STORAGE_KEY}"
az storage container create --name "aro-metrics" \
  --account-name "${AZR_STORAGE_ACCOUNT_NAME}" \
  --account-key "${AZR_STORAGE_KEY}"
Sample Output{ "created": true } { "created": true } -
Deploy ElasticSearch CRDs (not used, but needed for a bug workaround):
oc create -f https://raw.githubusercontent.com/openshift/elasticsearch-operator/release-5.8/bundle/manifests/logging.openshift.io_elasticsearches.yamlSample Outputcustomresourcedefinition.apiextensions.k8s.io/elasticsearches.logging.openshift.io created -
Check that
helmis installed properly:helm versionSample Outputversion.BuildInfo{Version:"v3.15.4+60.el9", GitCommit:"fa384522f2878321c8b6b1a06f8ff5f86f47a937", GitTreeState:"clean", GoVersion:"go1.22.7 (Red Hat 1.22.7-2.el9_5)"} -
Next, let’s add the MOBB Helm Chart repository. To do so, run the following command:
helm repo add mobb https://rh-mobb.github.io/helm-charts/

helm repo update
Sample Output"mobb" has been added to your repositories Hang tight while we grab the latest from your chart repositories... ...Successfully got an update from the "mobb" chart repository Update Complete. ⎈Happy Helming!⎈ -
Now, we need to create a project (namespace) to deploy our logging resources to. To create that, run the following command:
oc new-project custom-loggingSample OutputNow using project "custom-logging" on server "https://api.rbrlitrg.westeurope.aroapp.io:6443". You can add applications to this project with the 'new-app' command. For example, try: oc new-app rails-postgresql-example to build a new example application in Ruby. Or use kubectl to deploy a simple Kubernetes application: kubectl create deployment hello-node --image=k8s.gcr.io/e2e-test-images/agnhost:2.33 -- /agnhost serve-hostname -
Next, we need to install a few operators to run our logging setup. These operators include the Red Hat Cluster Logging Operator, the Loki operator, the Grafana operator, and more. First, we’ll create a list of all the operators we’ll need to install by running the following command:
cat <<EOF > clf-operators.yaml subscriptions: - name: grafana-operator channel: v4 installPlanApproval: Automatic source: community-operators sourceNamespace: openshift-marketplace - name: cluster-logging channel: stable installPlanApproval: Automatic source: redhat-operators sourceNamespace: openshift-marketplace namespace: openshift-logging - name: loki-operator channel: stable installPlanApproval: Automatic source: redhat-operators sourceNamespace: openshift-marketplace namespace: openshift-operators-redhat - name: resource-locker-operator channel: alpha installPlanApproval: Automatic source: community-operators sourceNamespace: openshift-marketplace namespace: resource-locker-operator - name: patch-operator channel: alpha installPlanApproval: Automatic source: community-operators sourceNamespace: openshift-marketplace namespace: patch-operator operatorGroups: - name: custom-logging targetNamespace: ~ - name: openshift-logging namespace: openshift-logging targetNamespace: openshift-logging - name: openshift-operators-redhat namespace: openshift-operators-redhat targetNamespace: all - name: resource-locker namespace: resource-locker-operator targetNamespace: all - name: patch-operator namespace: patch-operator targetNamespace: all EOF -
Next, let’s deploy the Grafana, Cluster Logging, and Loki operators from the file we just created above. To do so, run the following command:
oc create ns openshift-logging

oc create ns openshift-operators-redhat

oc create ns resource-locker-operator

oc create ns patch-operator

helm upgrade -n custom-logging clf-operators \
  mobb/operatorhub --install \
  --values ./clf-operators.yaml
Sample Outputnamespace/openshift-logging created namespace/openshift-operators-redhat created namespace/resource-locker-operator created Release "clf-operators" does not exist. Installing it now. NAME: clf-operators LAST DEPLOYED: Tue Dec 19 09:40:44 2023 NAMESPACE: custom-logging STATUS: deployed REVISION: 1 TEST SUITE: None NOTES: . -
Now, let’s wait for the operators to be installed.
These commands will loop through each type of resource until the CRDs for the Operators have been deployed.
Eventually you’ll see the message
No resources found in custom-logging namespaceand be returned to a prompt.while ! oc get grafana; do sleep 5; echo -n .; done while ! oc get clusterlogging; do sleep 5; echo -n .; done while ! oc get lokistack; do sleep 5; echo -n .; done while ! oc get resourcelocker; do sleep 5; echo -n .; doneSample OutputNo resources found in custom-logging namespace. No resources found in custom-logging namespace. No resources found in custom-logging namespace. No resources found in custom-logging namespace. -
Now that the operators have been successfully installed, let’s use a helm chart to deploy Grafana and forward metrics to Azure Files. To do so, run the following command:
helm upgrade -n "custom-logging" aro-thanos-af \
  --install mobb/aro-thanos-af --version 0.6.3 \
  --set "aro.storageAccount=${AZR_STORAGE_ACCOUNT_NAME}" \
  --set "aro.storageAccountKey=${AZR_STORAGE_KEY}" \
  --set "aro.storageContainer=aro-metrics" \
  --set "enableUserWorkloadMetrics=true"
Sample OutputRelease "aro-thanos-af" does not exist. Installing it now. NAME: aro-thanos-af LAST DEPLOYED: Tue Dec 19 09:41:57 2023 NAMESPACE: custom-logging STATUS: deployed REVISION: 1 TEST SUITE: NoneIf you get an error during that command wait a few seconds and try it again. Sometimes the Patch Operator takes a little longer to fully deploy.
-
Wait until Grafana has successfully deployed. Run the following command:
oc -n custom-logging rollout status deploy grafana-deployment -
Next, let’s ensure that we can access Grafana. To do so, we should fetch its route and try browsing to it with your web browser. To grab the route, run the following command:
oc -n custom-logging get route grafana-route \
  -o jsonpath='{"https://"}{.spec.host}{"\n"}'
Sample Outputhttps://grafana-route-custom-logging.apps.nbybk9f3.eastus.aroapp.io -
You should already be logged into the cluster because you logged into the web console earlier. Accept all permissions by clicking on Allow selected permissions. You should see the Grafana dashboard.
If your browser displays an error that says 'Application is not available' wait a minute and try again.
If it persists you’ve hit a race condition with certificate creation.
Run the following command to try to resolve it:
oc patch -n custom-logging service grafana-alert -p '{ "metadata": { "annotations": null }}'

oc -n custom-logging delete secret aro-thanos-af-grafana-cr-tls

oc patch -n custom-logging service grafana-service \
    -p '{"metadata":{"annotations":{"retry": "true" }}}'

sleep 5

oc -n custom-logging rollout restart deployment grafana-deployment
Set up Log Forwarding
-
Now, set the storage class to use for the persistent volumes to be created - using the storage class that is set as the default storage class:
STORAGE_CLASS=$(oc get storageclass -o=jsonpath='{.items[?(@.metadata.annotations.storageclass\.kubernetes\.io/is-default-class=="true")].metadata.name}')

echo ${STORAGE_CLASS}
Sample Outputmanaged-csi -
Next, let’s use another helm chart to deploy forward logs to Azure Files. To do so, run the following command:
helm upgrade -n custom-logging aro-clf-blob \
 --install mobb/aro-clf-blob --version 0.1.3 \
 --set "azure.storageAccount=${AZR_STORAGE_ACCOUNT_NAME}"  \
 --set "azure.storageAccountKey=${AZR_STORAGE_KEY}"   \
 --set "azure.storageContainer=aro-logs" \
 --set "lokiStack.storageClassName=${STORAGE_CLASS}"
Sample OutputRelease "aro-clf-blob" does not exist. Installing it now. NAME: aro-clf-blob LAST DEPLOYED: Tue Dec 19 09:43:20 2023 NAMESPACE: custom-logging STATUS: deployed REVISION: 1 TEST SUITE: None -
Once the Helm Chart deploys its resource, we need to wait for the Log Collector agent to be started. To watch its status, run the following command:
oc -n openshift-logging rollout status daemonset collectorSample Outputdaemon set "collector" successfully rolled out -
Occasionally, the log collector agent starts before the operator has finished configuring Loki. To proactively address this, we need to restart the agent. To do so, run the following command:
oc -n openshift-logging rollout restart daemonset collectorSample Outputdaemonset.apps/collector restarted
View the Metrics and Logs
Now that the metrics and log forwarding are forwarding to Azure Files, let’s view them in Grafana.
-
First, we’ll need to fetch the route for Grafana and visit it in our web browser. To get the route, run the following command
oc -n custom-logging get route grafana-route \
   -o jsonpath='{"https://"}{.spec.host}{"\n"}'
Sample Outputhttps://grafana-route-custom-logging.apps.nbybk9f3.eastus.aroapp.io -
Browse to the provided route address in the same browser window as your OCP console and login using your OpenShift credentials. If you tested this before you are already logged in.
-
View an existing dashboard such as custom-logging -> Node Exporter -> USE Method -> Cluster (click on the search icon on the left to see the custom-logging dashboard).
These dashboards are copies of the dashboards that are available directly on the OpenShift web console under Observability".
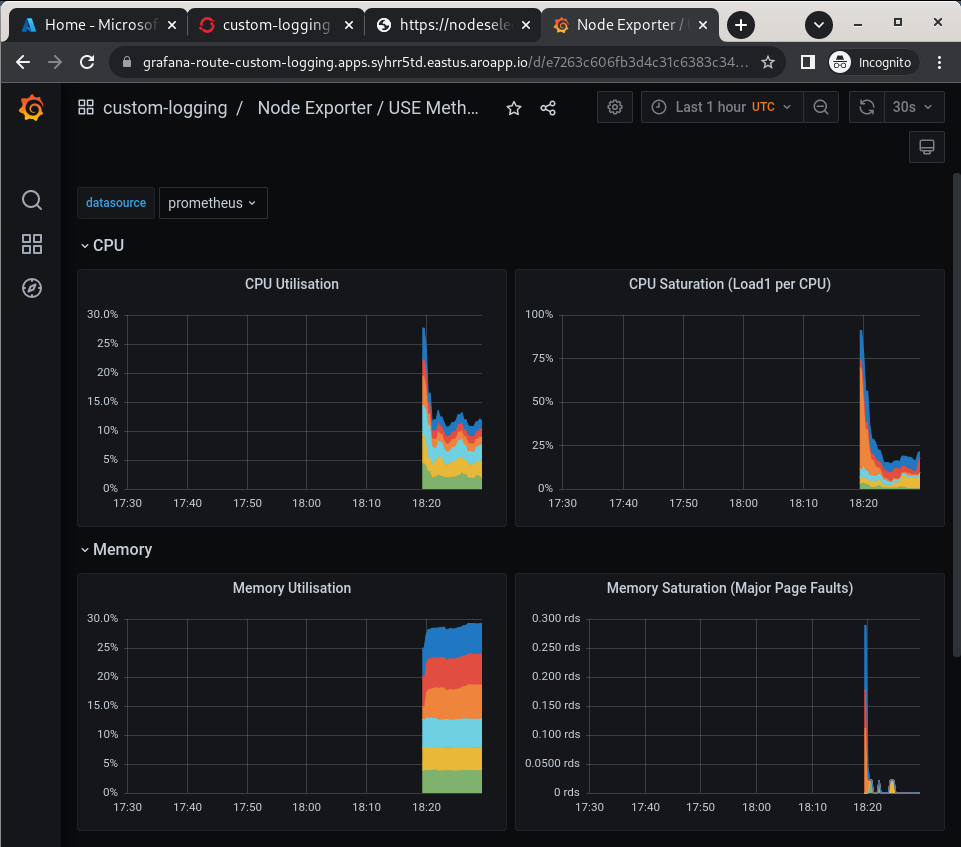
If you don’t see the graphs as in the screenshot above wait a minute and refresh the browser window - it takes a few minutes for the Grafana dashboard to start showing data.
-
Click the Explore (compass) Icon in the left hand menu, select “Loki (Application)” in the dropdown and search for
{kubernetes_namespace_name="custom-logging"}. Click the blue Run Query button on the top right to execute the search.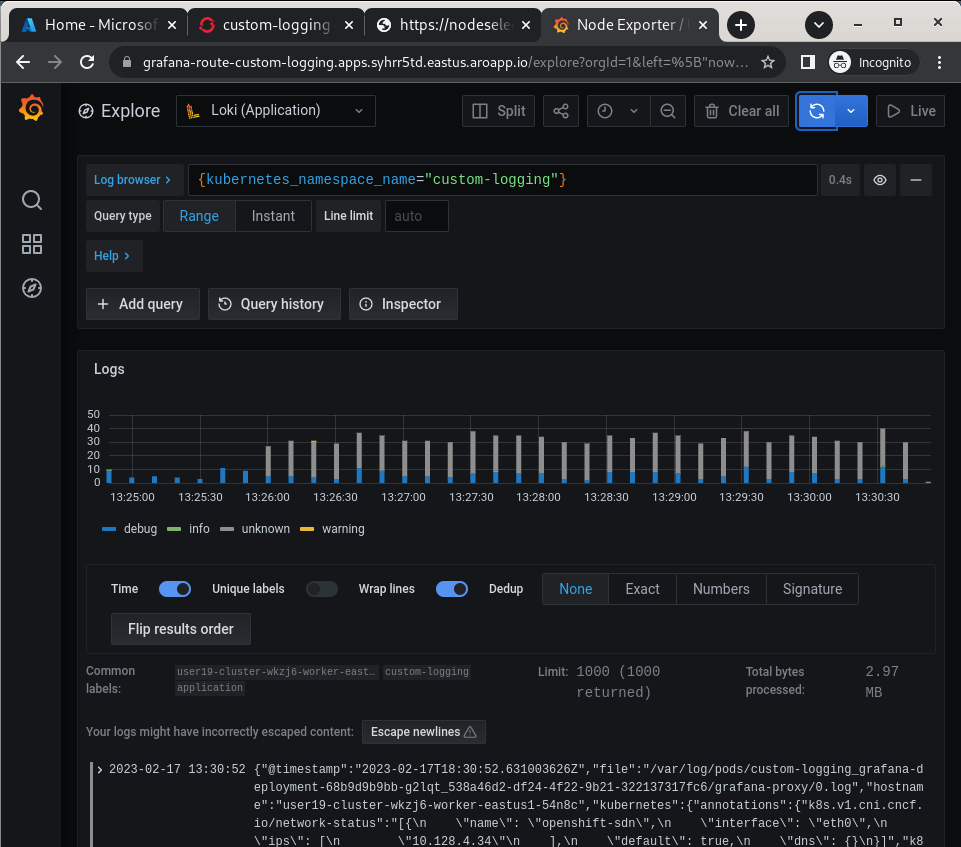
Enabling Custom Metrics
In order to display metrics from your own applications you need to enable custom metrics.
-
Check the cluster-monitoring-config ConfigMap object:
oc -n openshift-monitoring get configmap cluster-monitoring-config -o yamlSample OutputapiVersion: v1 data: {} kind: ConfigMap metadata: creationTimestamp: "2023-06-06T17:11:22Z" name: cluster-monitoring-config namespace: openshift-monitoring resourceVersion: "391968" uid: 5d84fef5-d798-4b11-bb2f-dd93fc6e76d8 -
Enable User Workload Monitoring:
oc patch configmap cluster-monitoring-config -n openshift-monitoring \ --patch='{"data":{"config.yaml": "enableUserWorkload: true\n"}}' -
Check that the User workload monitoring is starting up (wait until the output below matches what you see):
oc -n openshift-user-workload-monitoring get podsSample OutputNAME READY STATUS RESTARTS AGE prometheus-operator-78774d88c8-vq2pz 2/2 Running 0 23m prometheus-user-workload-0 6/6 Running 0 23m prometheus-user-workload-1 6/6 Running 0 23m thanos-ruler-user-workload-0 3/3 Running 0 23m thanos-ruler-user-workload-1 3/3 Running 0 23m -
Append
remoteWritesettings to the user-workload-monitoring config to forward user workload metrics to Thanos.Check if the User Workload Config Map exists:
oc -n openshift-user-workload-monitoring get \
  configmaps user-workload-monitoring-config -o yaml
Sample OutputapiVersion: v1 kind: ConfigMap metadata: creationTimestamp: "2023-06-07T09:14:09Z" name: user-workload-monitoring-config namespace: openshift-user-workload-monitoring resourceVersion: "392232" uid: c1a3c96a-1773-4a56-ba4d-537c7cb9a92a -
Update the ConfigMap:
cat << EOF | kubectl apply -f -
---
apiVersion: v1
kind: ConfigMap
metadata:
  name: user-workload-monitoring-config
  namespace: openshift-user-workload-monitoring
data:
  config.yaml: |
    prometheus:
      remoteWrite:
      - url: "http://thanos-receive.custom-logging.svc.cluster.local:9091/api/v1/receive"
EOF
Congratulations!
Your cluster is now configured to allow custom metrics.