Observe traffic using the Kiali web console
Kiali is an observability console for the OpenShift Service Mesh with service mesh configuration and validation capabilities. It helps you understand the structure and health of your service mesh by monitoring traffic flow to infer the topology and report errors.
-
First, grab the Kiali web console URL. To do so, run the following command:
echo "https://$(oc get routes -n istio-system kiali -o jsonpath='{.spec.host}')/console"Sample Outputhttps://kiali-istio-system.apps.rosa-6n4s8.1c1c.p1.openshiftapps.com/console -
Next, navigate to that URL in your web browser and click the
Login With OpenShiftbutton.
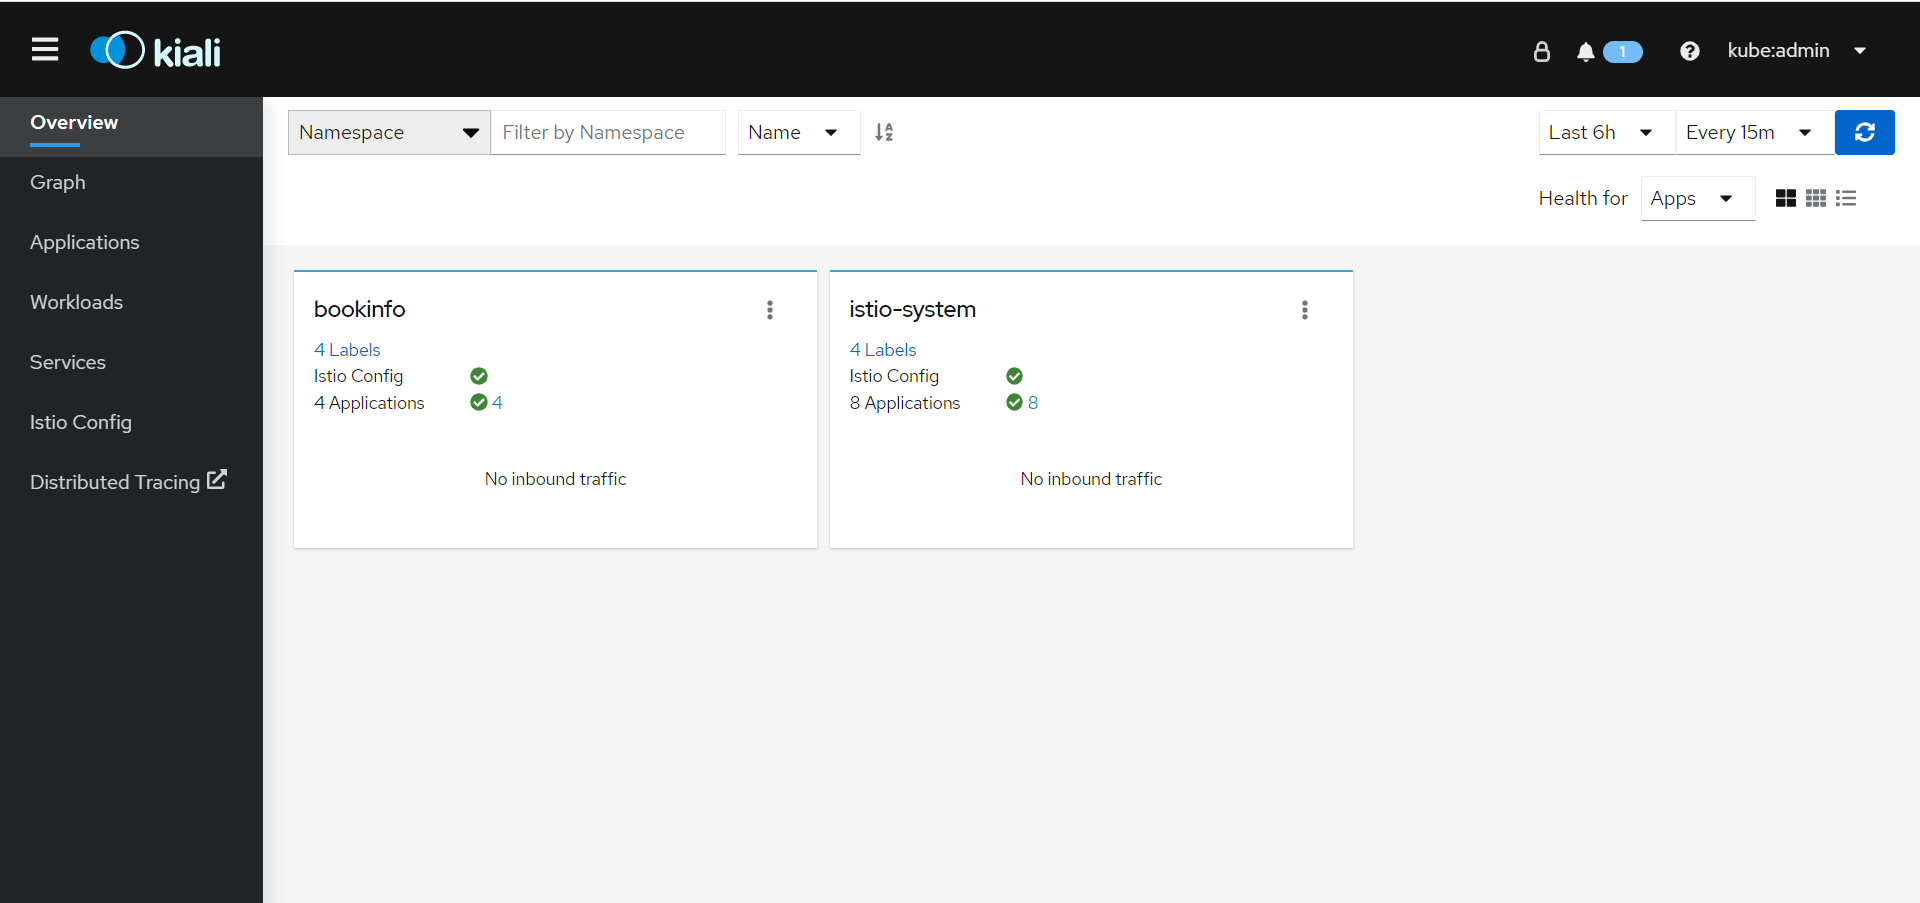
Once logged in, the Kiali Overview screen presents tiles for each project namespace.
-
Now, let’s generate some traffic against the product page service. To do so, run the following command in your terminal:
while true; do curl -sSL "http://$(oc -n istio-system get route istio-ingressgateway -o jsonpath='{.spec.host}')/productpage" | head -n 5; sleep 1; doneLeave the loop running and proceed to the next steps.
-
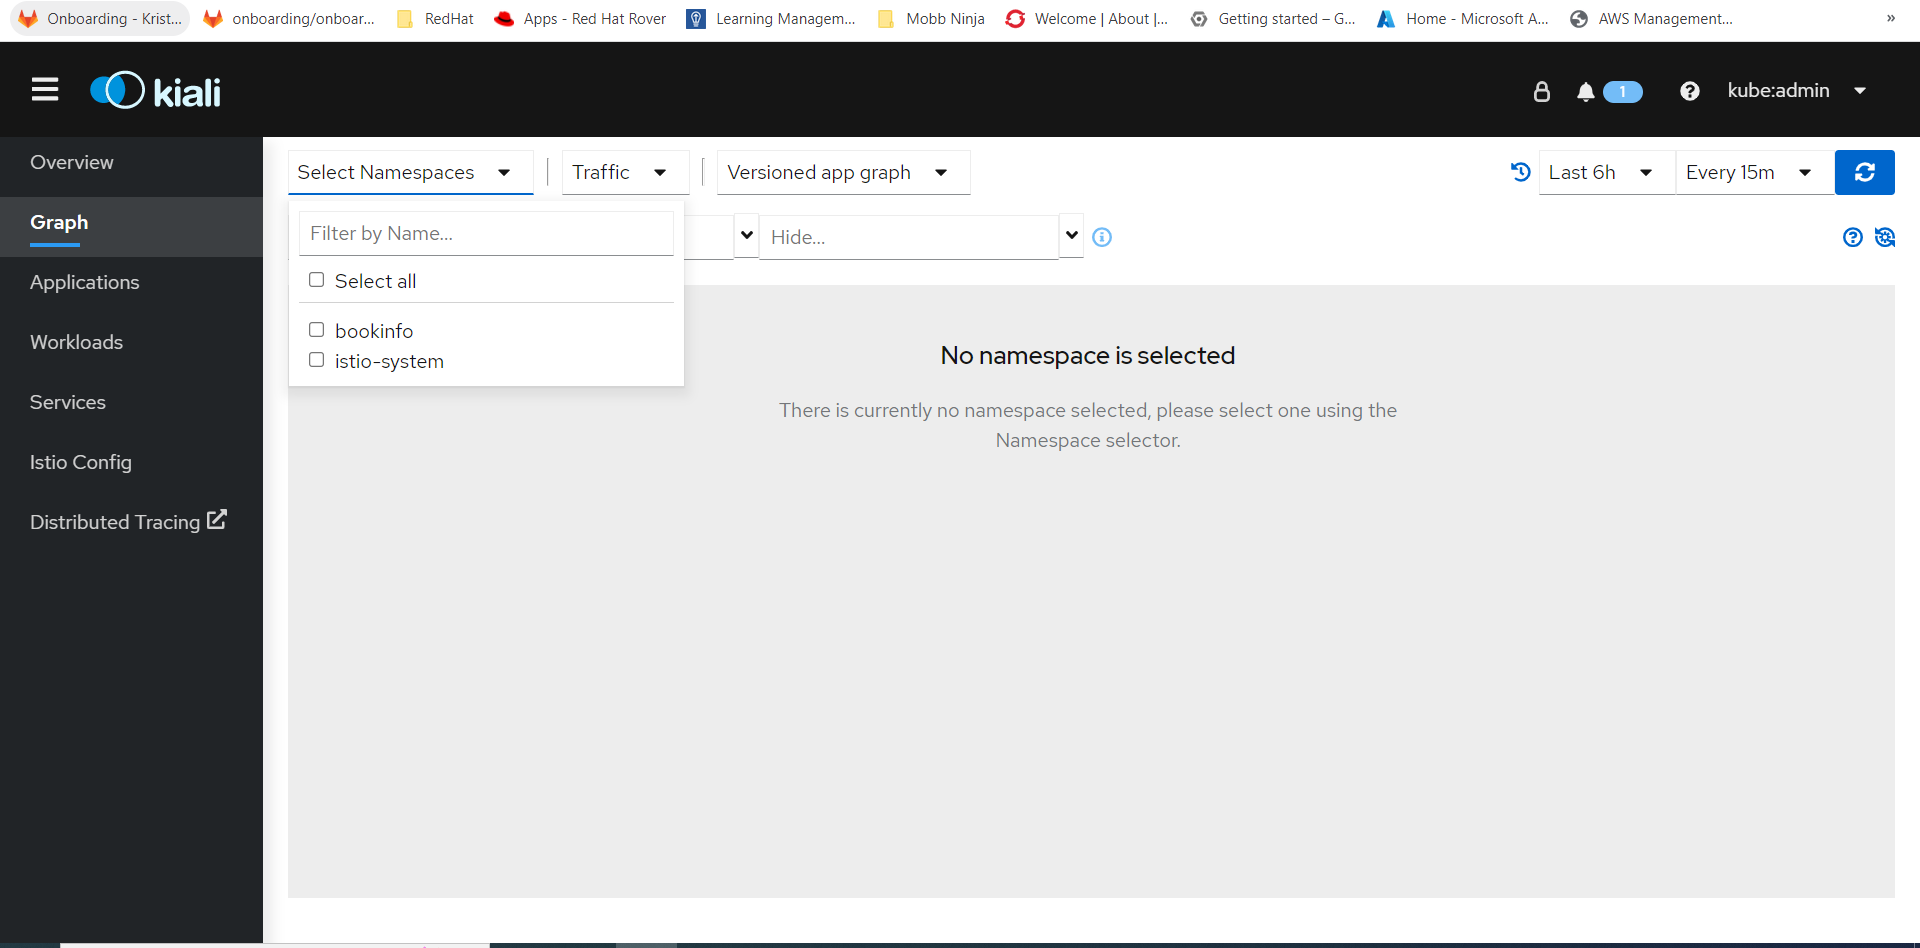
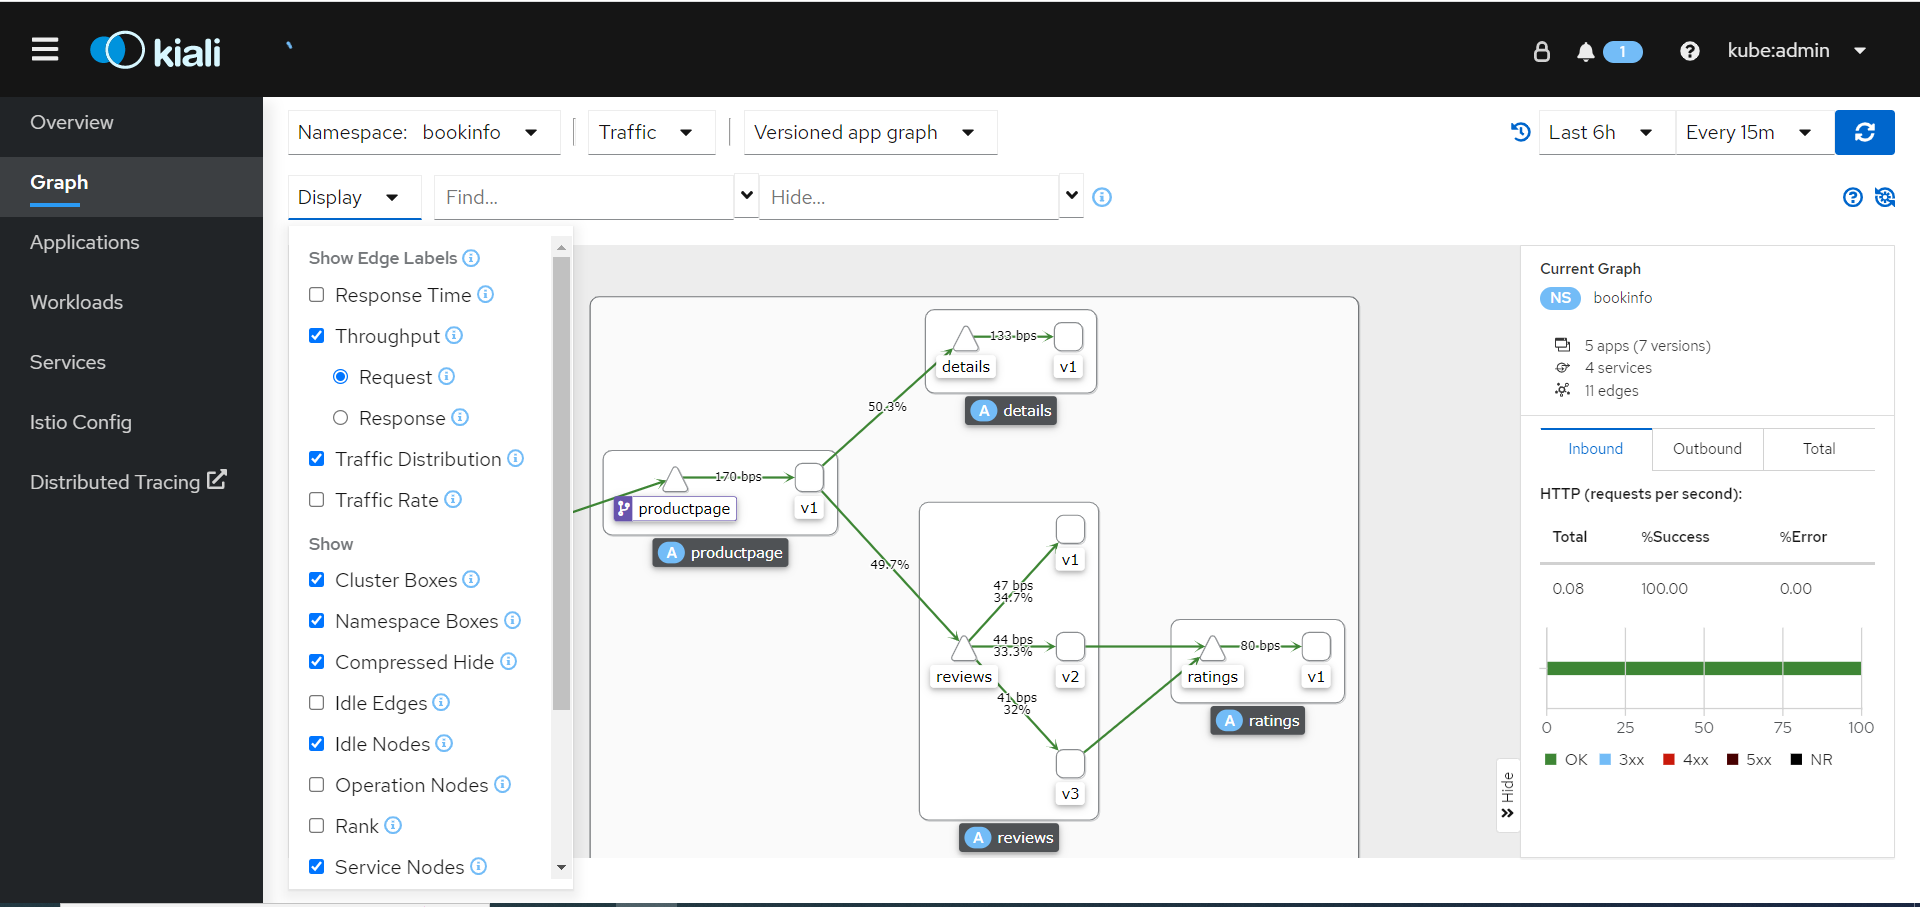
Return to the Kiali web console and click the Graph option in the sidebar.
-
Next, select bookinfo from the Namespace list, and App graph from the Graph Type list.
-
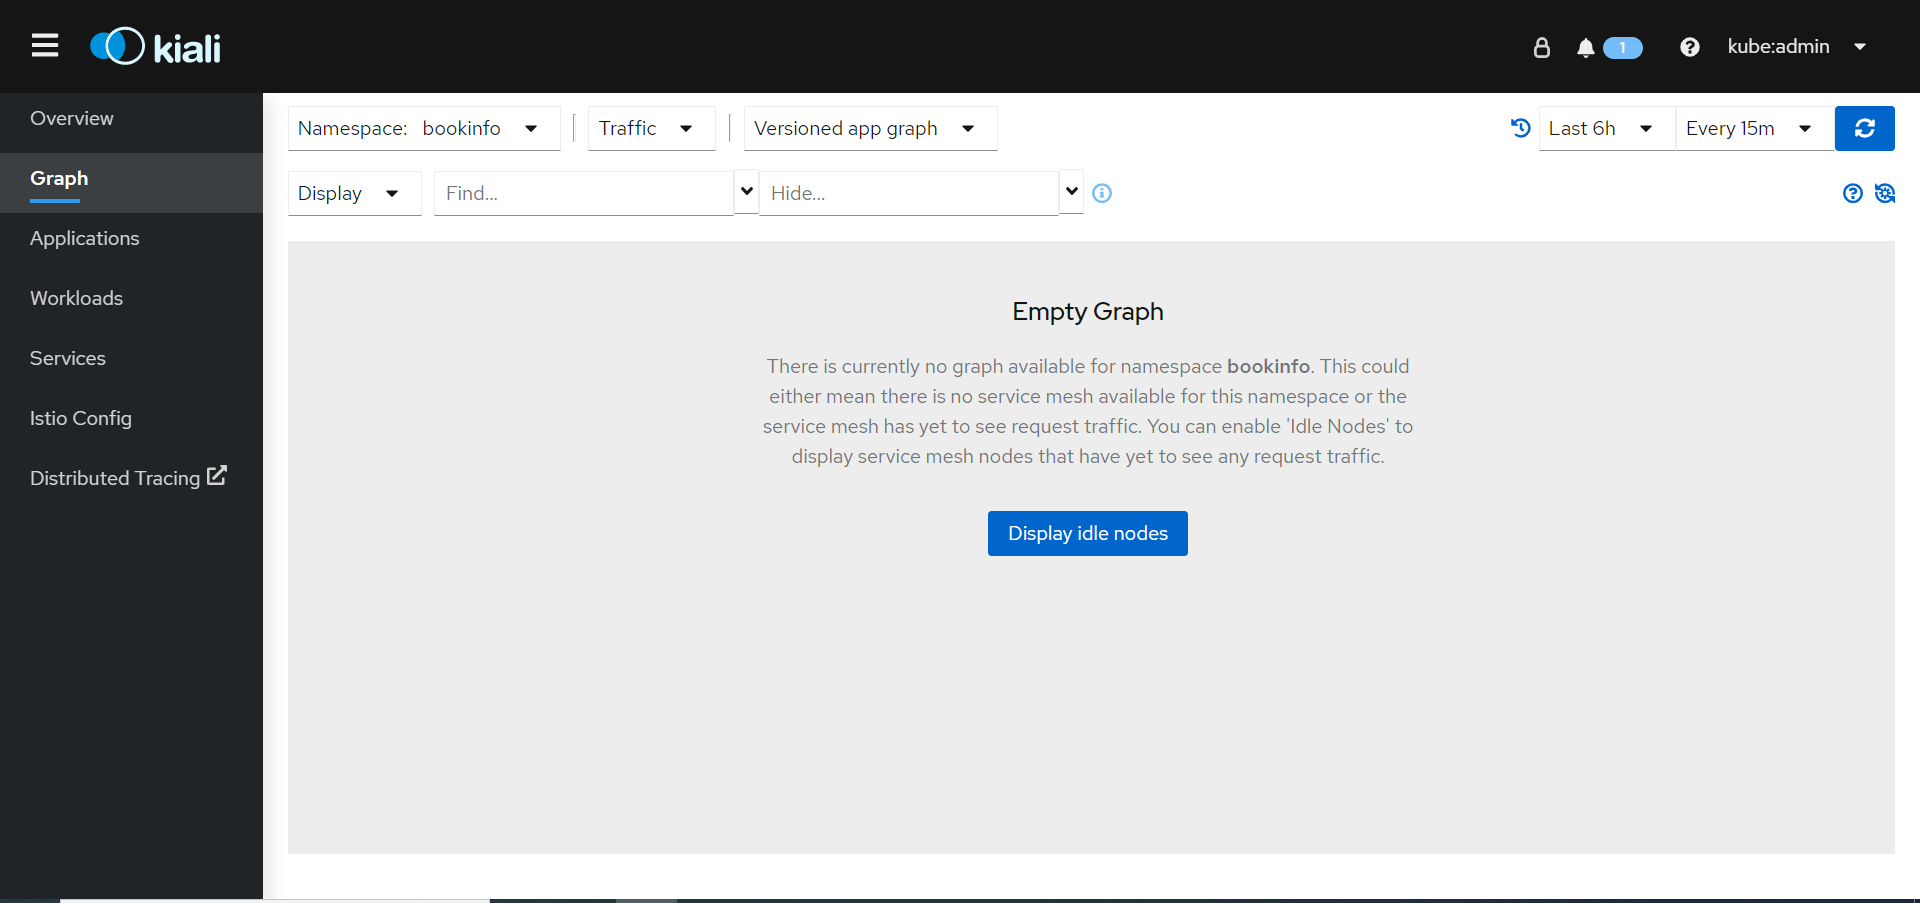
Next, choose the Display drop down and tick the Idle nodes box.
-
Next, view the graph and change the display settings to add or remove information from the graph.
-
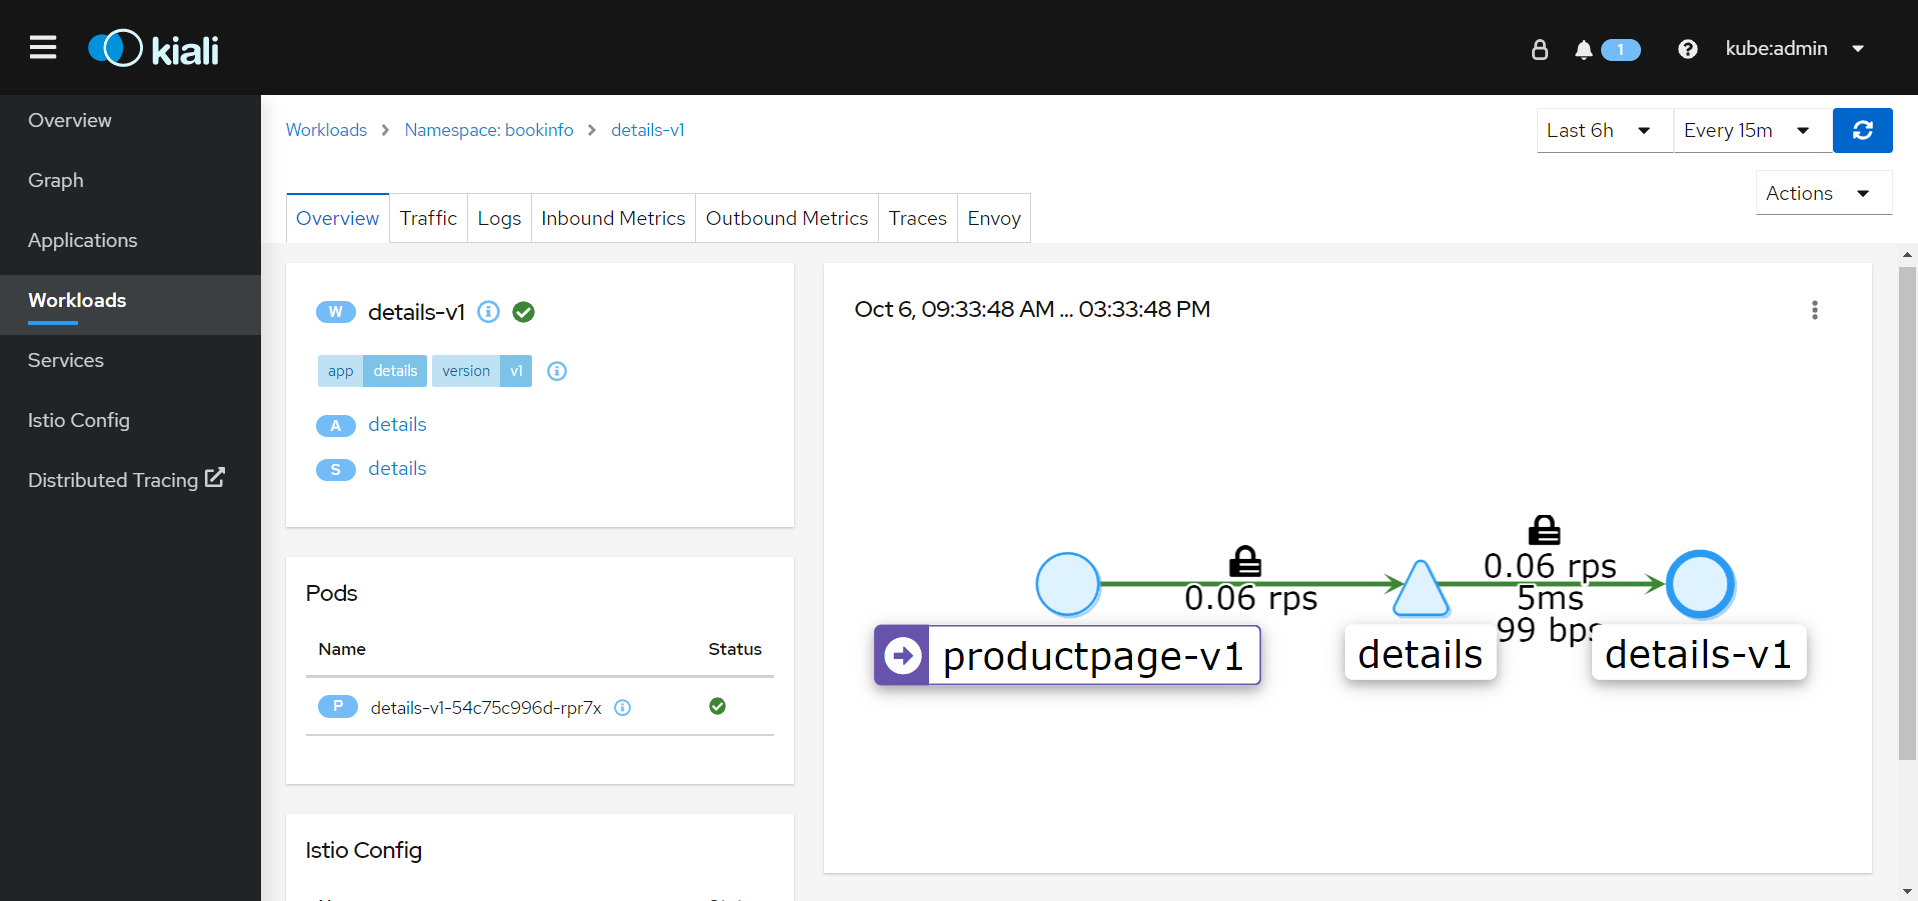
Next, click the Workload tab and select the details-v1 workload.
-
In your terminal window stop the traffic generation by pressing
Ctrl-C.
Congratulations! You should now see traffic flowing between the various services in your bookinfo application.