Navigating RHACS
Module Goals
-
Understand the various modules in RHACS.
-
Comfortably navigate the UI.
-
Set the foundation for exploring the rest of the modules in the roadshow.
-
Help you come up with questions for the RHACS team.
RHACS Basics
RHACS provides the tools and capabilities to address the security needs of a cloud-native development approach on Kubernetes. These security features represent any developer or administrator’s primary work across various environments, including multiple datacenters, private clouds, or public clouds that run Kubernetes clusters.
RHACS features
Using Red Hat Advanced Cluster Security for Kubernetes, you can gain comprehensive Kubernetes security that includes the following use cases:
-
Visibility: See your entire landscape of images, registries, containers, deployments, and runtime behavior.
-
Vulnerability Management: Identify and remediate vulnerabilities in container images and Kubernetes across the entire software development life cycle.
-
Compliance: Audit your systems against CIS Benchmarks, NIST, PCI, and HIPAA, with interactive dashboards and one-click audit reports.
-
Network Security: Visualize existing connections and enforce tighter segmentation using Kubernetes-native controls to reduce your blast radius.
-
Security Policy Guardrails: See all your deployments ranked by risk level, using context from Kubernetes' declarative data, to prioritize remediation.
-
Configuration Management: Apply best practices for Docker and Kubernetes to harden your environment for a more secure and stable application.
-
Threat Detection: Use rules, automated allow lists, and baselining to identify suspicious activity in your running applications accurately.
-
Incident Response: Take action, from failing builds and blocking deployments to killing pods and thwarting attacks, using Kubernetes for enforcement.
Accessing the RHACS Console
Your RHACS Console is available at: https://central-stackrox.apps.cluster-sample.sample.sandboxsample.opentlc.com
Administrator login is available with:
RHACS Console Username: |
sameple_admin |
RHACS Console Password: |
sample_password |
Please ensure that you have access before proceeding.
Introduction to the RHACS Console
The first section of this lab will focus on navigation and vulnerability management. This work will take place in the UI and require you to use both the dashboard and the lab environment.
Navigating the RHACS Console
In this section, you familiarize yourself with the RHACS console, including its tabs, search capabilities, and dashboard functionality.
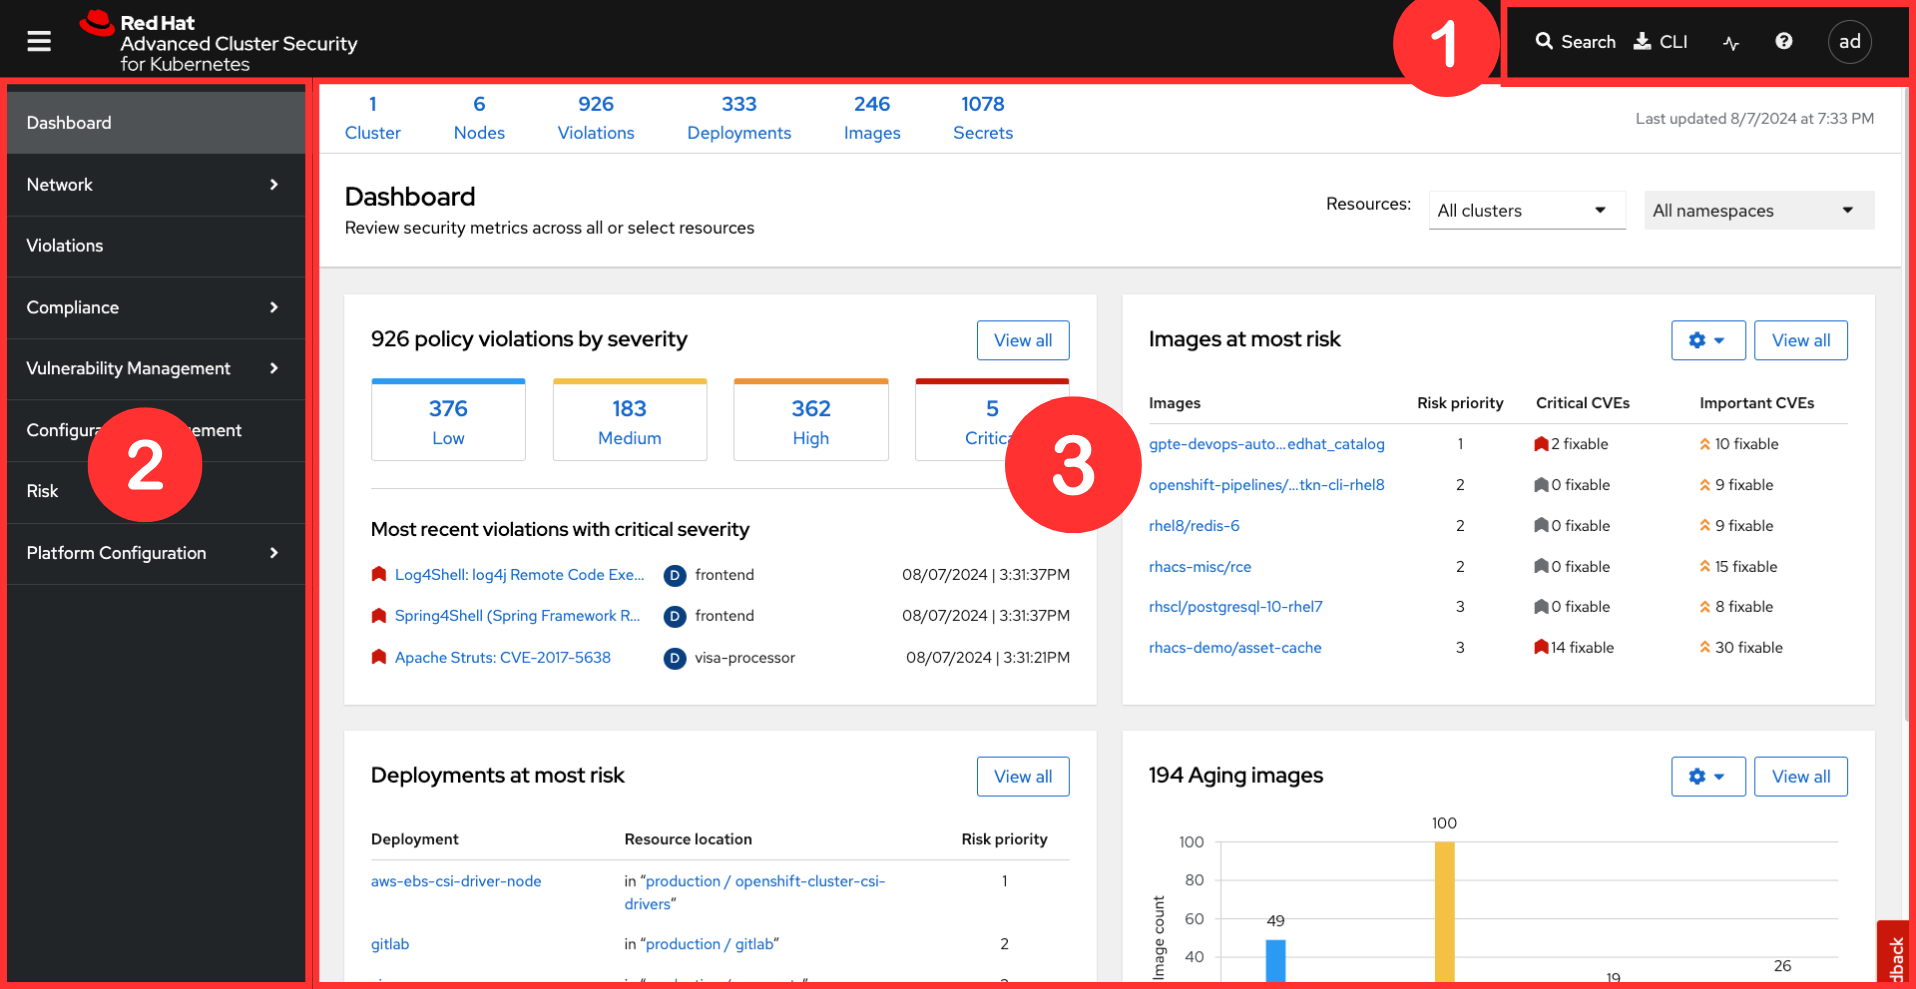
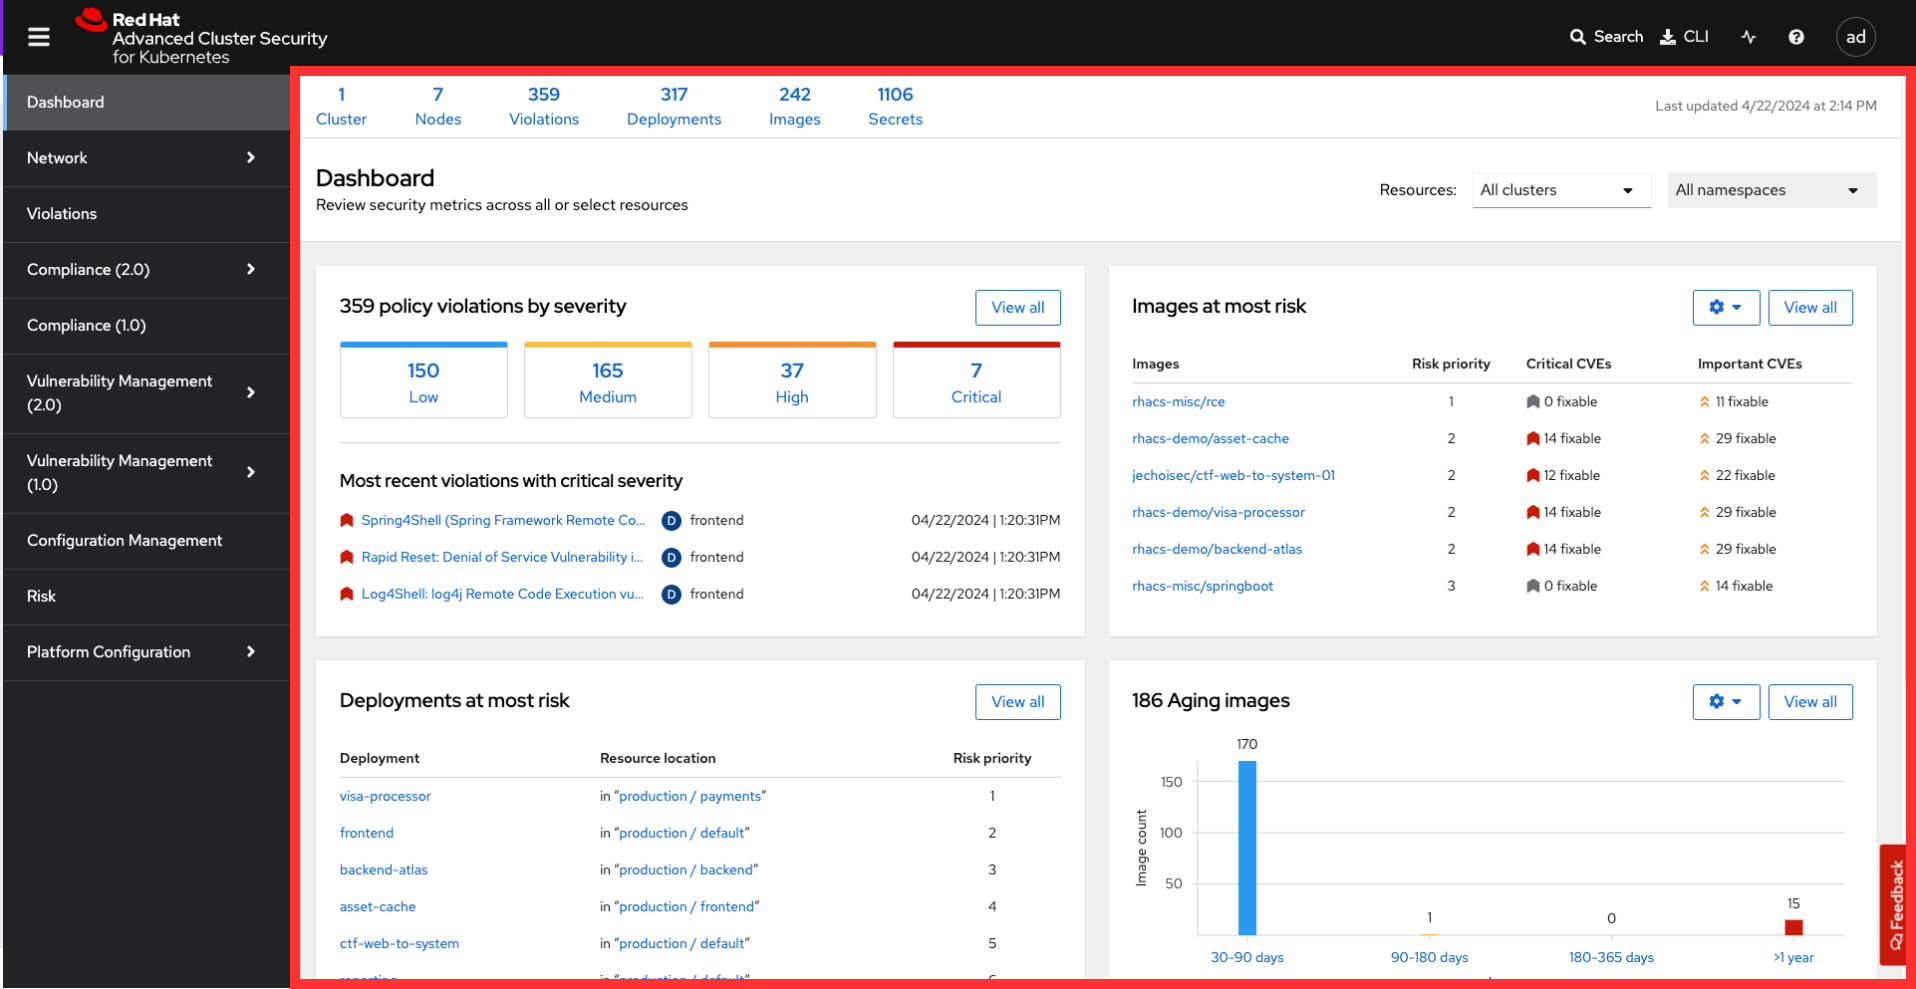
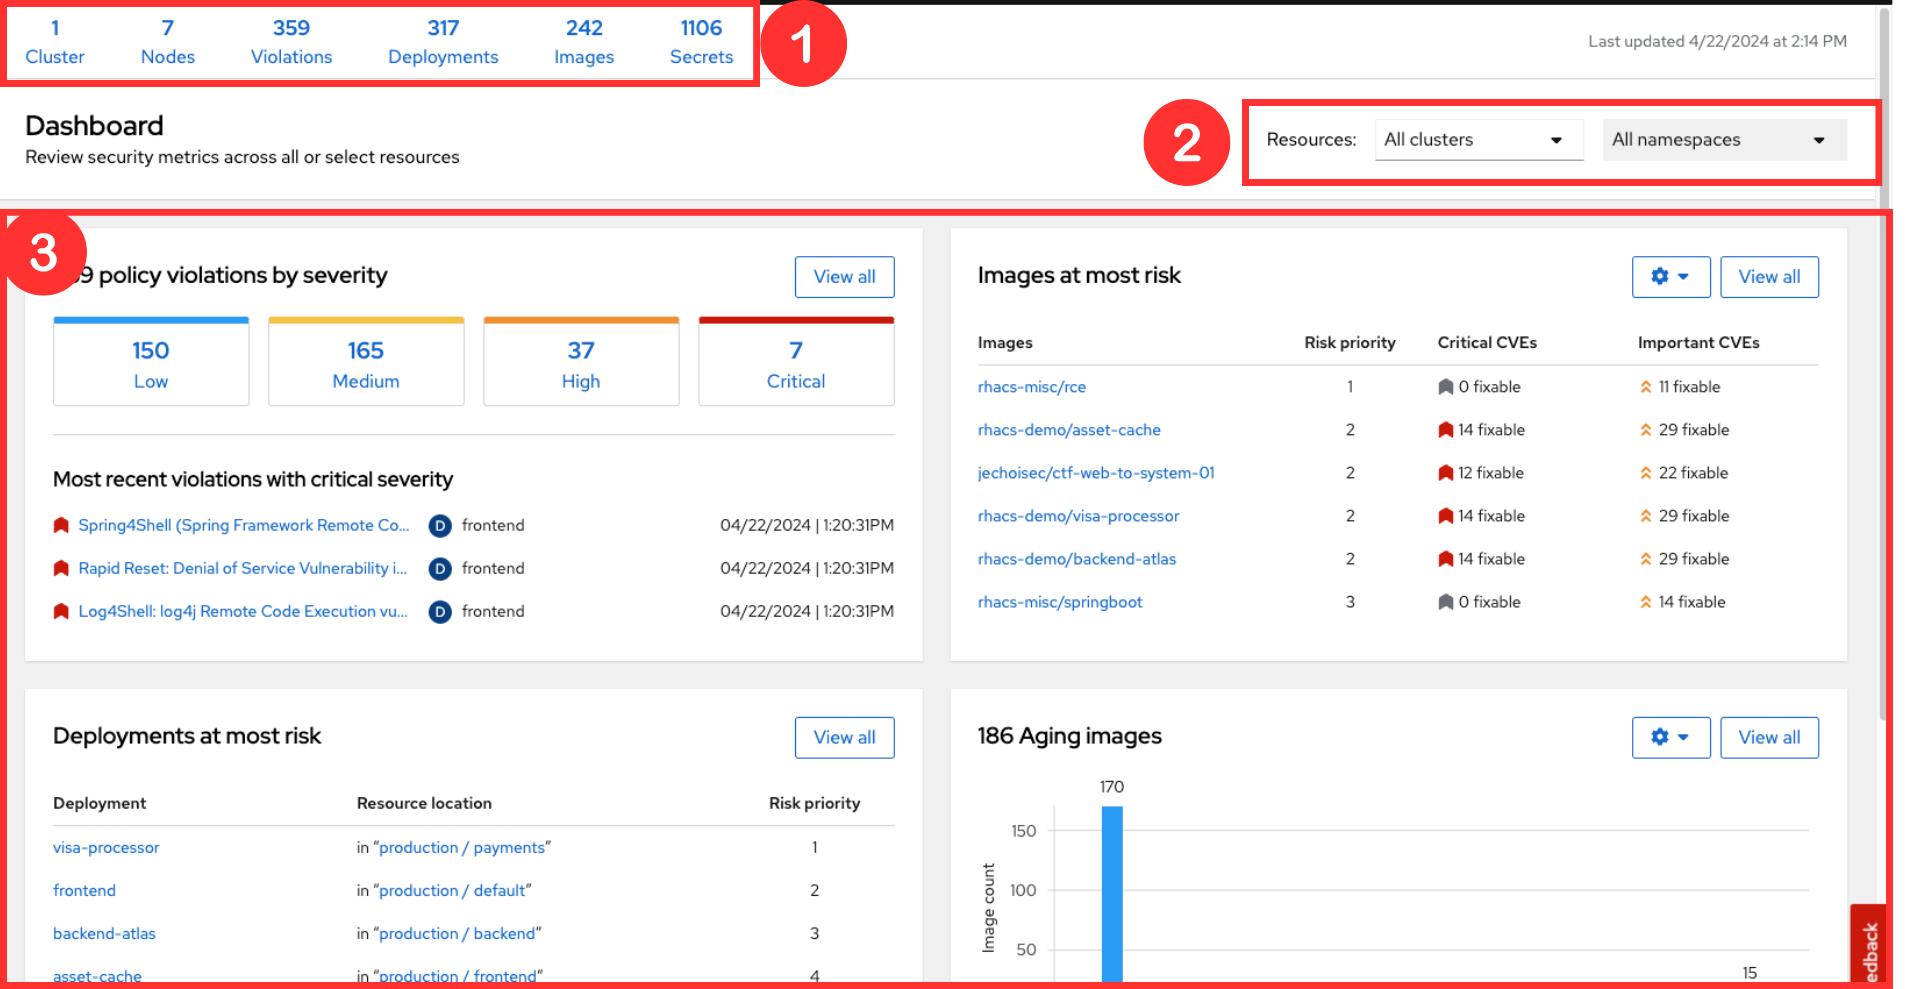
The "Dashboard" or RHACS home page has 3 sections:
-
Navigation bar
-
Navigation drawer
-
Dashboard
1. Navigation Bar
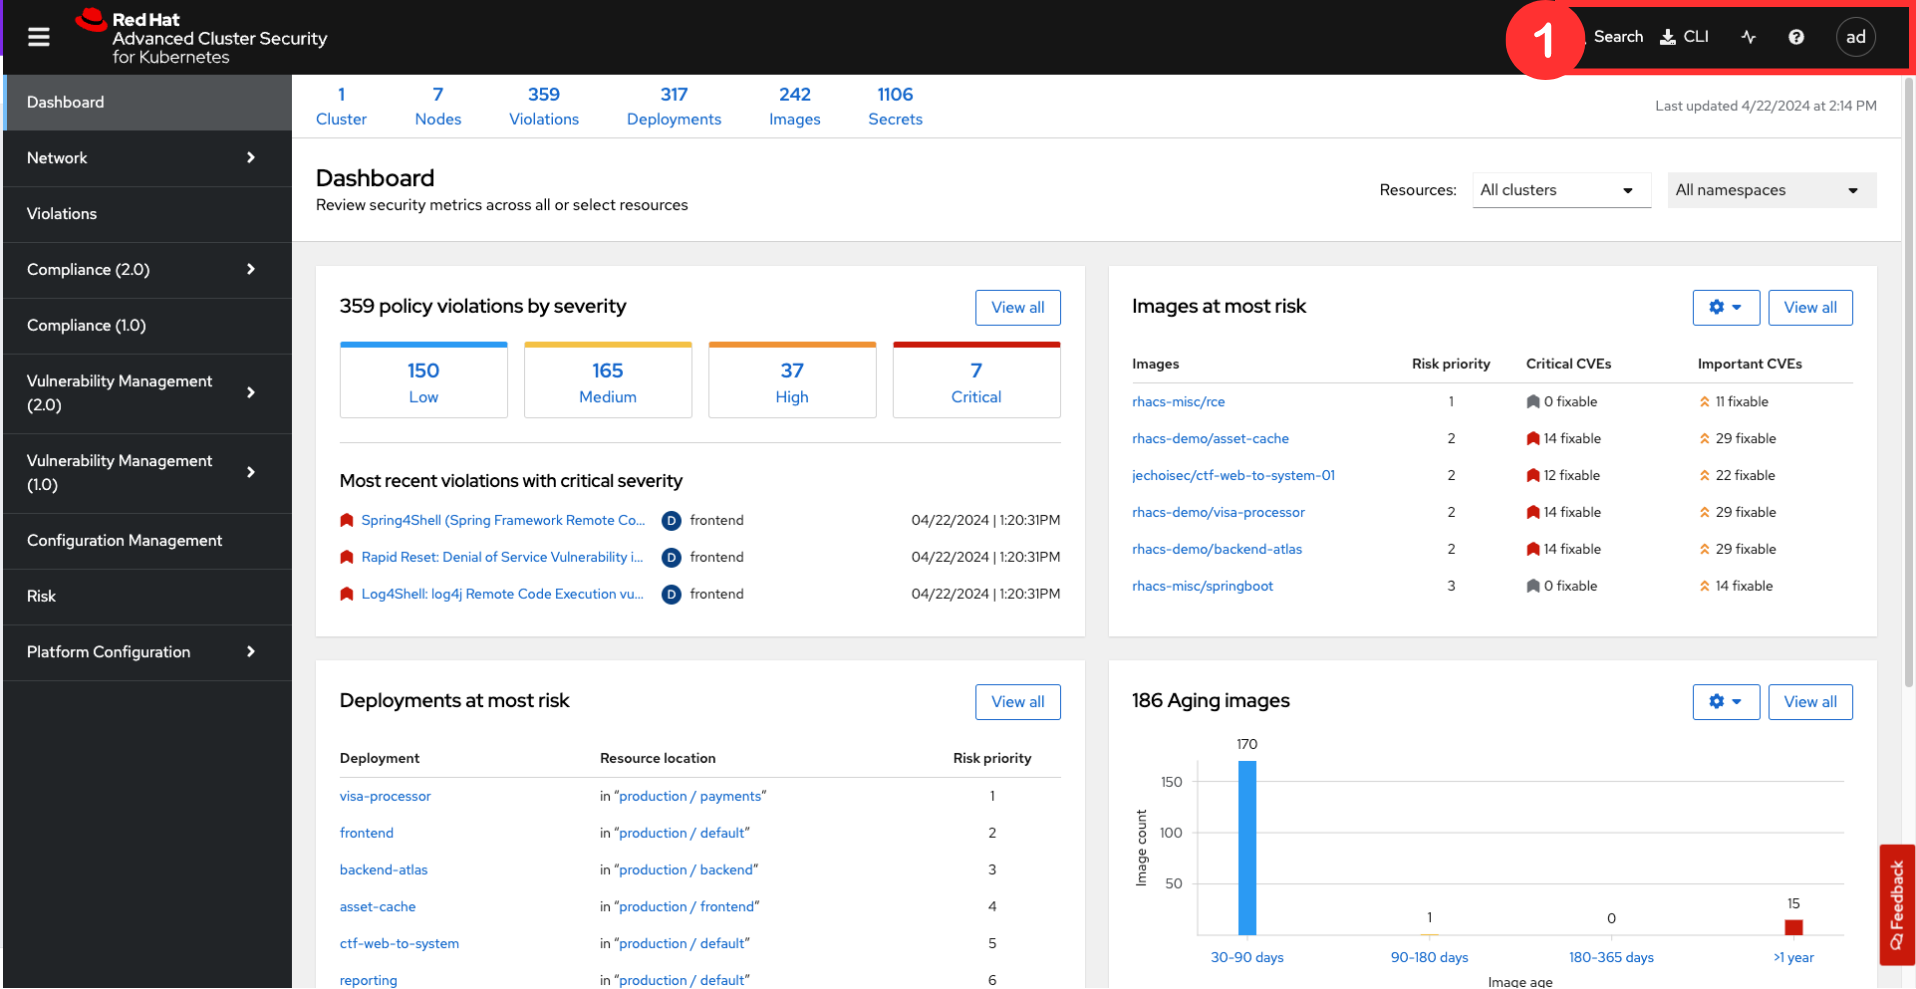
The top bar contains the following functionality:
-
Global search
-
Command-line tools
-
Cluster health
-
Documentation
-
API reference
-
Enable dark/light mode
-
Logged-in user account
Global Search
The ability to instantly find resources is essential to safeguard your cluster. Utilize the RHACS search feature to find relevant resources faster. For example, you can use it to find deployments exposed to a newly published CVE or all deployments with external network exposure.
A search query
A search query consists of two parts:
-
An attribute that identifies the resource type you want to search for.
-
A search term that finds the matching resource.
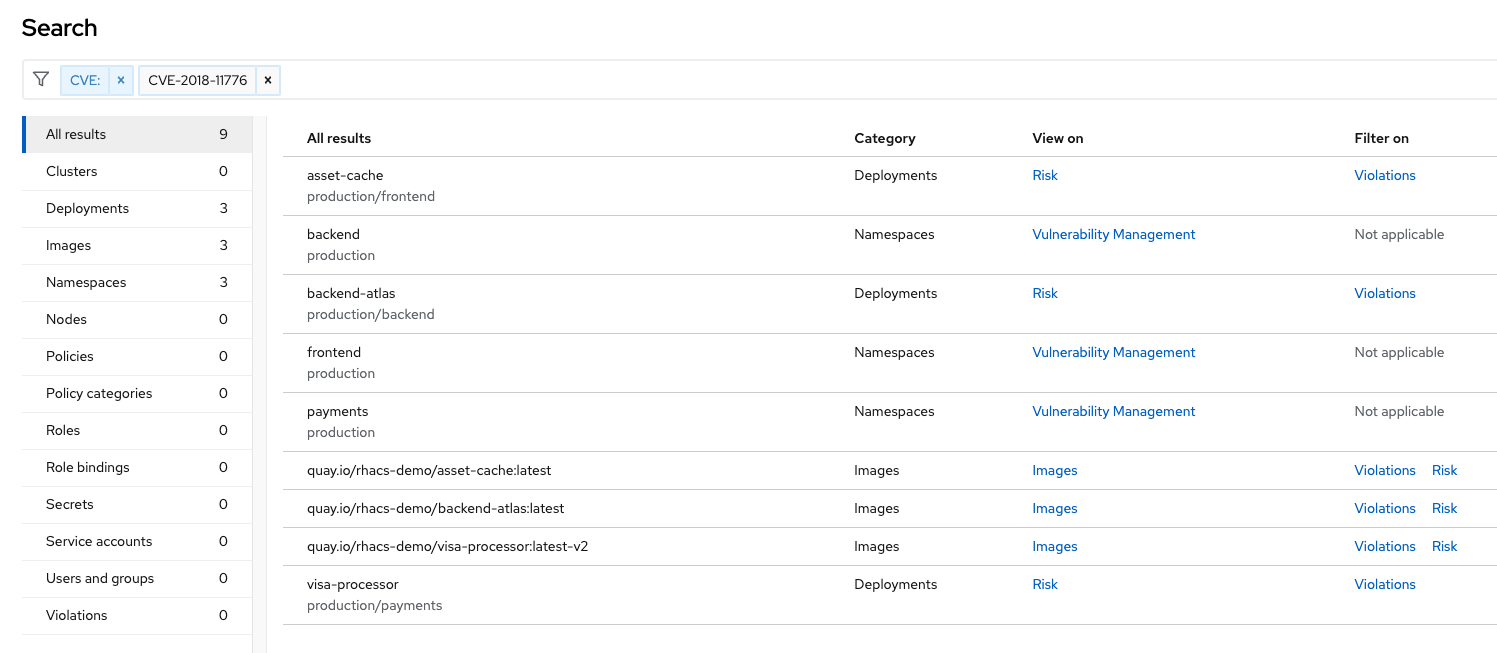
For example, to find all violations in the frontend deployment, the search query is select Deployment THEN frontend.
In this search query, Deployment is the attribute, and frontend is the search term.
| The search field in RHACS requires each attribute to be entered fully as a search term. Enter your first attribute, and hit the <tab> key to move along to the following attribute you would like to enter. Watch the video below for a demonstration. |
| RHACS maintains a library of searchable assets to help you search faster. They will appear in a drop-down list, and you can click on them to enter them as well. If a specific CVE or deployment cannot be found, please confirm the spelling of the asset name or that it is correctly deployed in the cluster. |
You can also search using REGEX-like capabilities. Add an r/ before the search term to find all possibilities. For example, if you search for Namespace:r/st.*x, the results include matches from namespace stackrox and stix.
Common Search Queries
Here are some common search queries you can try in the RHACS search bar if you’d like to test its functionality.
Query |
Example |
Purpose |
CVE:<CVE_number> |
CVE:CVE-2018-11776 |
Finding deployments that are affected by a specific CVE |
Privileged:<true_or_false> |
Privileged:true |
Finding privileged running deployments |
Exposure Level:<level> |
Exposure Level:External |
Finding deployments that have external network exposure |
| RHACS, like Kubernetes, works on a key:value system primarily due to its flexibility and power in organizing, selecting, and managing resources, but also because of the ability to set selectors and match objects based on a set of values (e.g., 'in', 'not in', 'exists', 'does not exist'). |
Local Page Filtering
You can use local page filtering from within all views in the RHACS portal. Local page filtering works similarly to the global search, but only relevant attributes are available. You can select the search bar to show all available attributes for a specific view.
For example, filtering in the violations window by the default namespace.
As you can see, the content is only relevant to the violations tab, but the search capabilities, including the use of r/, remain the same.
2. Navigation Menu
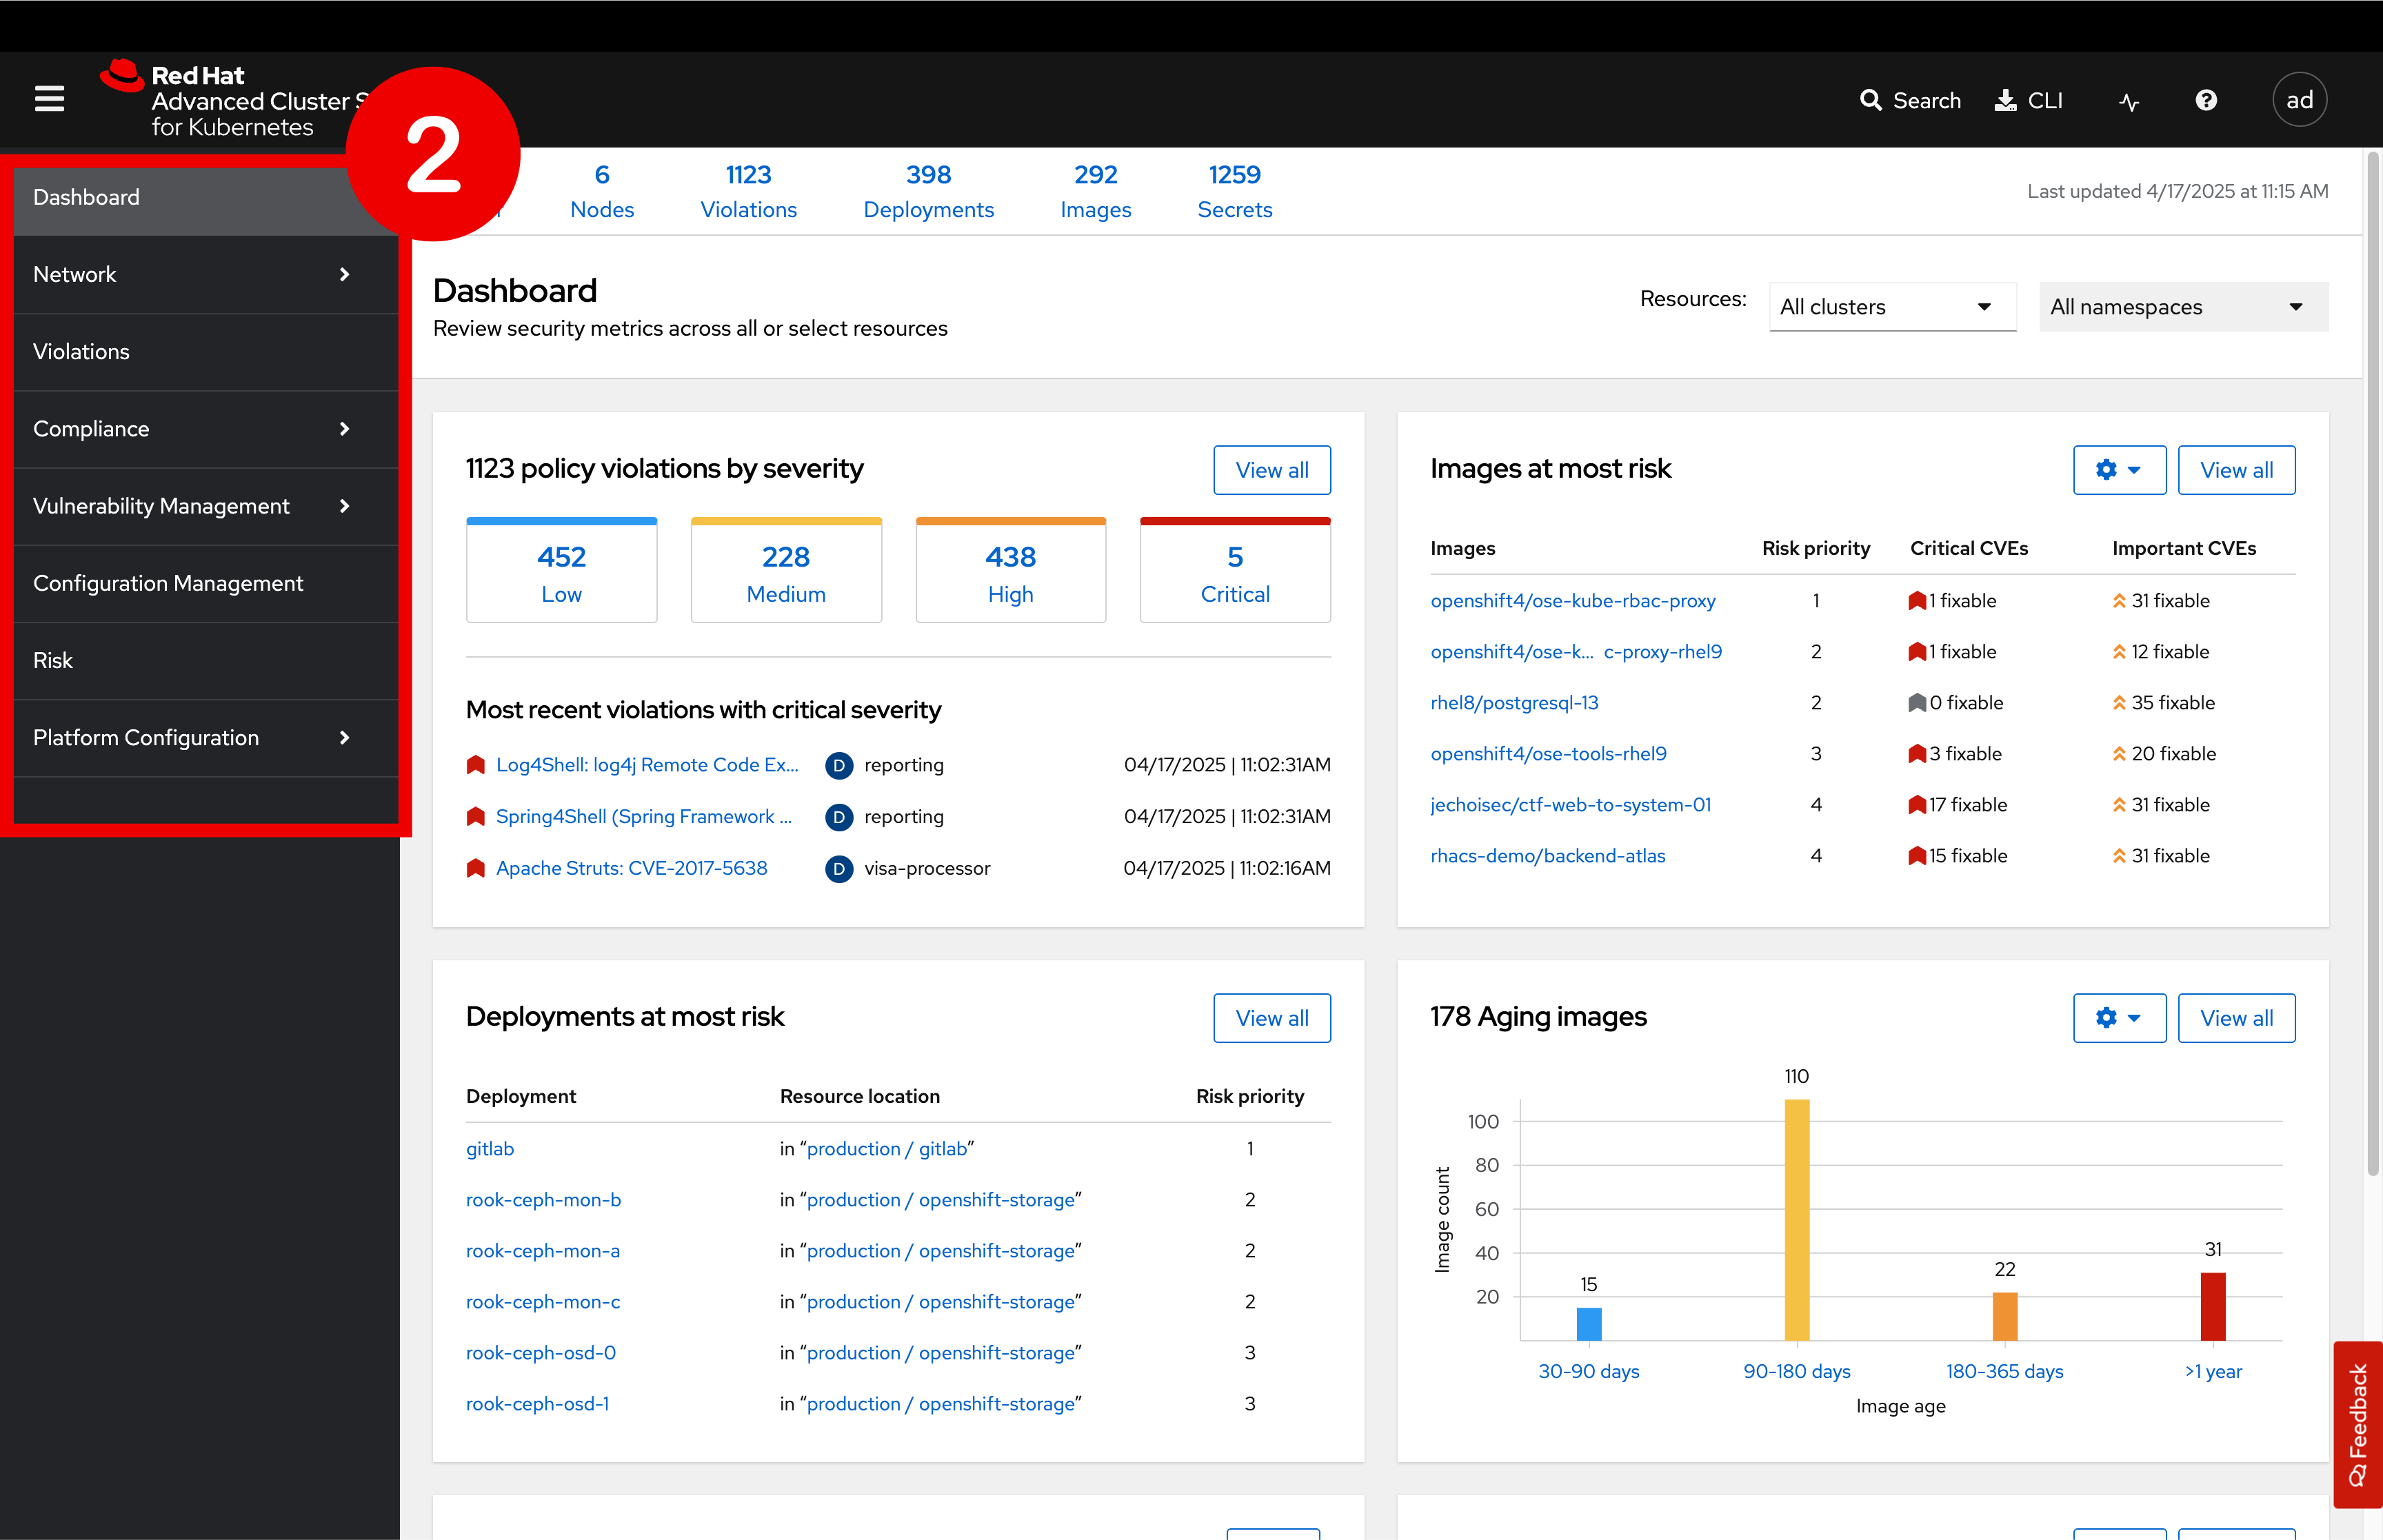
The left-hand navigation menu provides access to each of the security use cases, as well as product configuration to integrate RHACS with your existing tooling. The navigation menu has the following items:
-
Dashboard: Summary view of your environment
-
Network Graph: Real-time network flows and public ports that are available. Enables automated creation of Network Policies to implement network segmentation
-
Violations: Events that are in violation of the default and your defined security policies
-
Compliance: Our new compliance dashboard (self-titled NextGen Compliance) update is in progress. With plans to make compliance reporting even easier with tailored compliance profiles and reporting by application, namespace, and cluster.
-
Vulnerability Management: Over the past year, we’ve revamped our Vulnerability Management workflows, focusing on filtering important and critical issues. We’ve also introduced node, platform, and workload-specific vulnerability dashboards. This segmentation helps the operations team quickly identify where a vulnerability exists and determine which team to contact, making the process much more efficient.
-
Configuration Management: The configuration management tab enables you to identify potential misconfigurations that can lead to security issues
-
Risk: The Risk tab points out major risky applications by using configuration, runtime, and vulnerability data, helping you focus on the "high-risk" workloads.
-
Platform Configuration: RHACS configuration, policy management, and integration details, including:
-
Clusters
-
Policy Management
-
Collections
-
Integrations
-
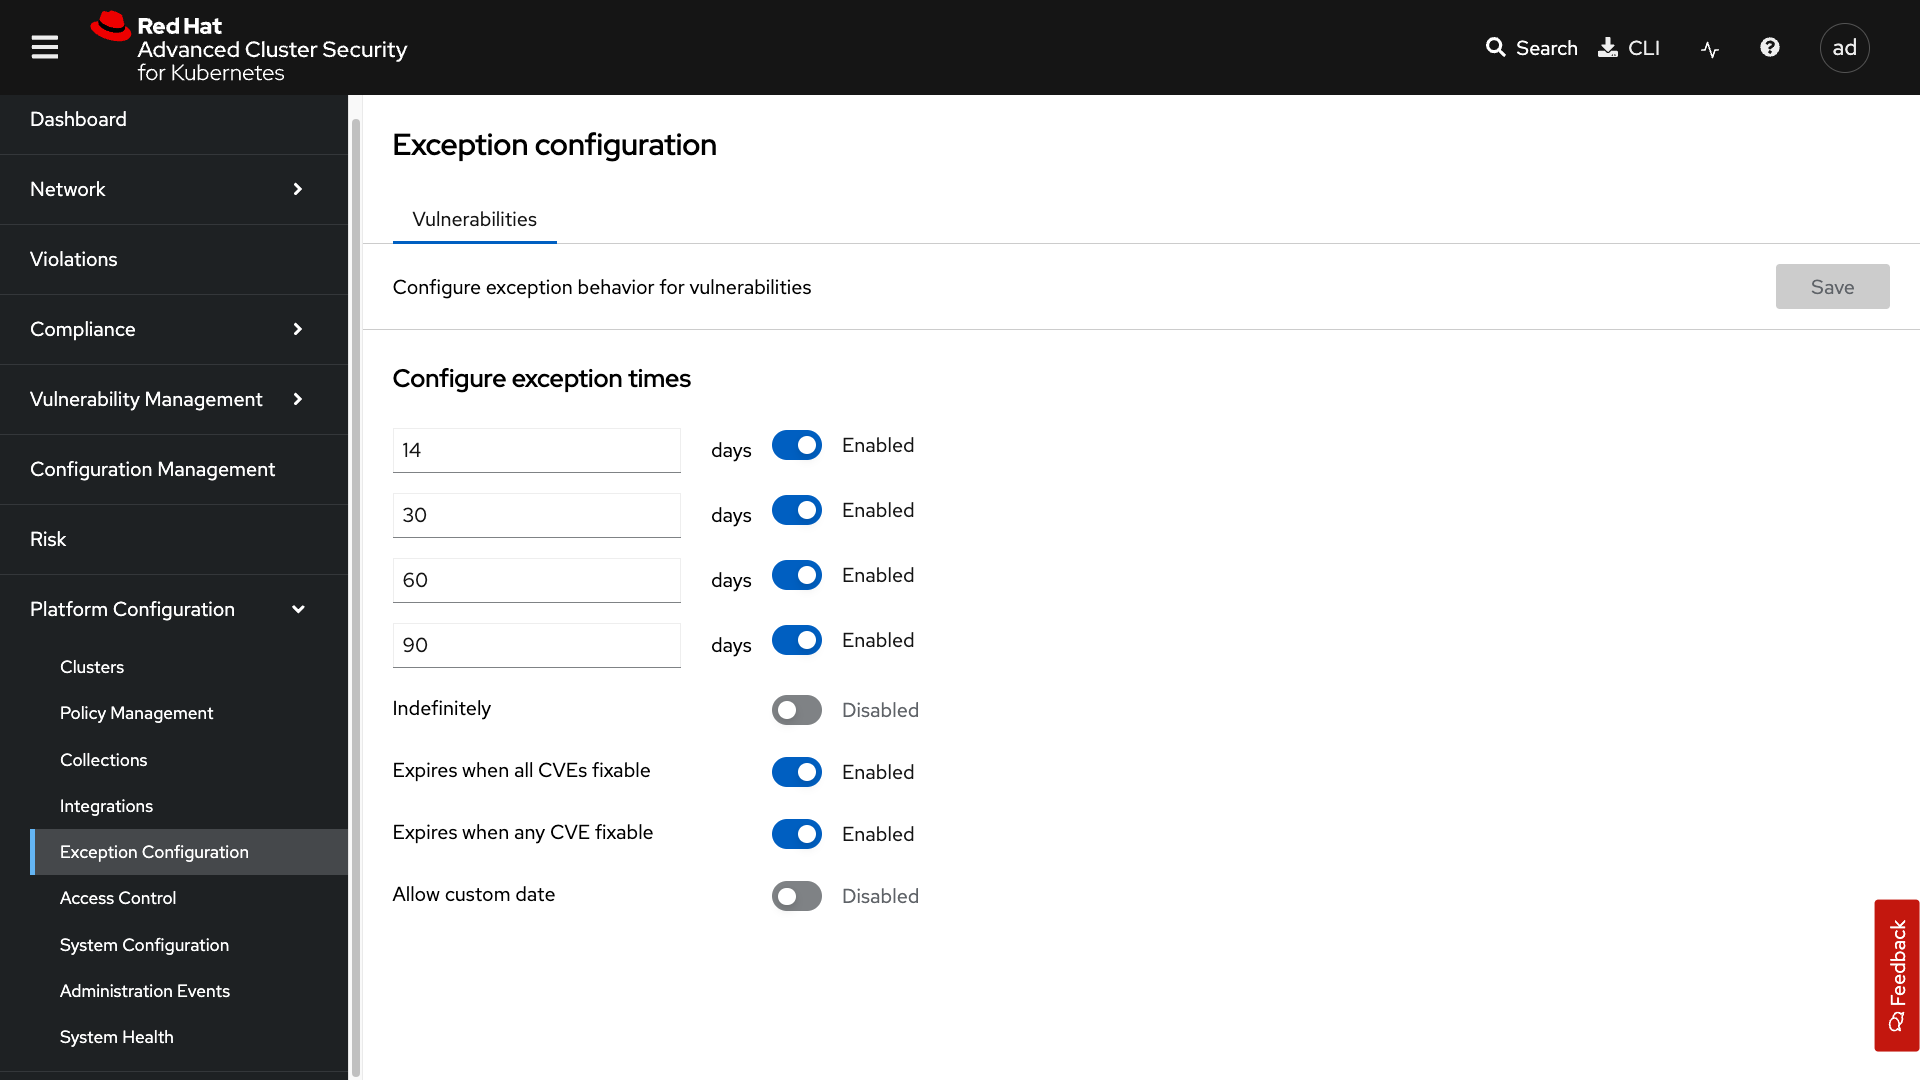
Exception Configuration
-
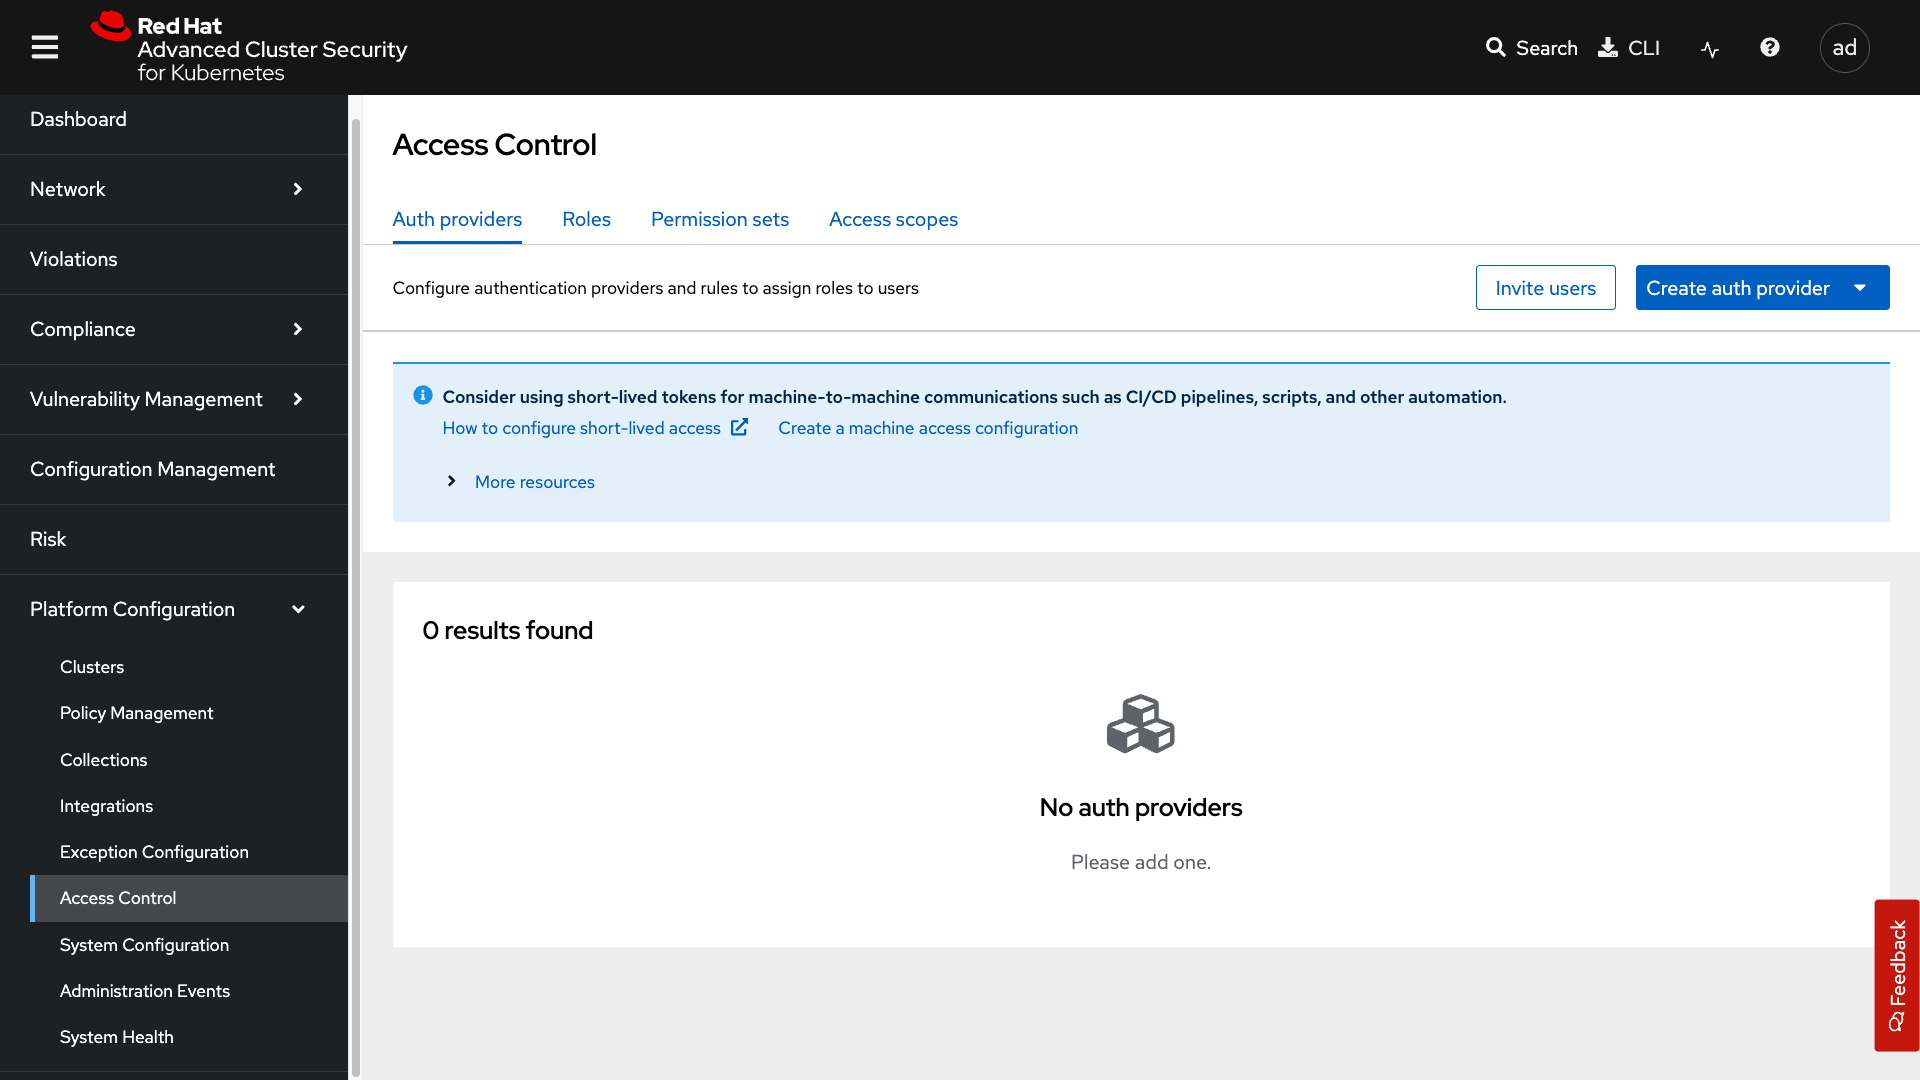
Access Control
-
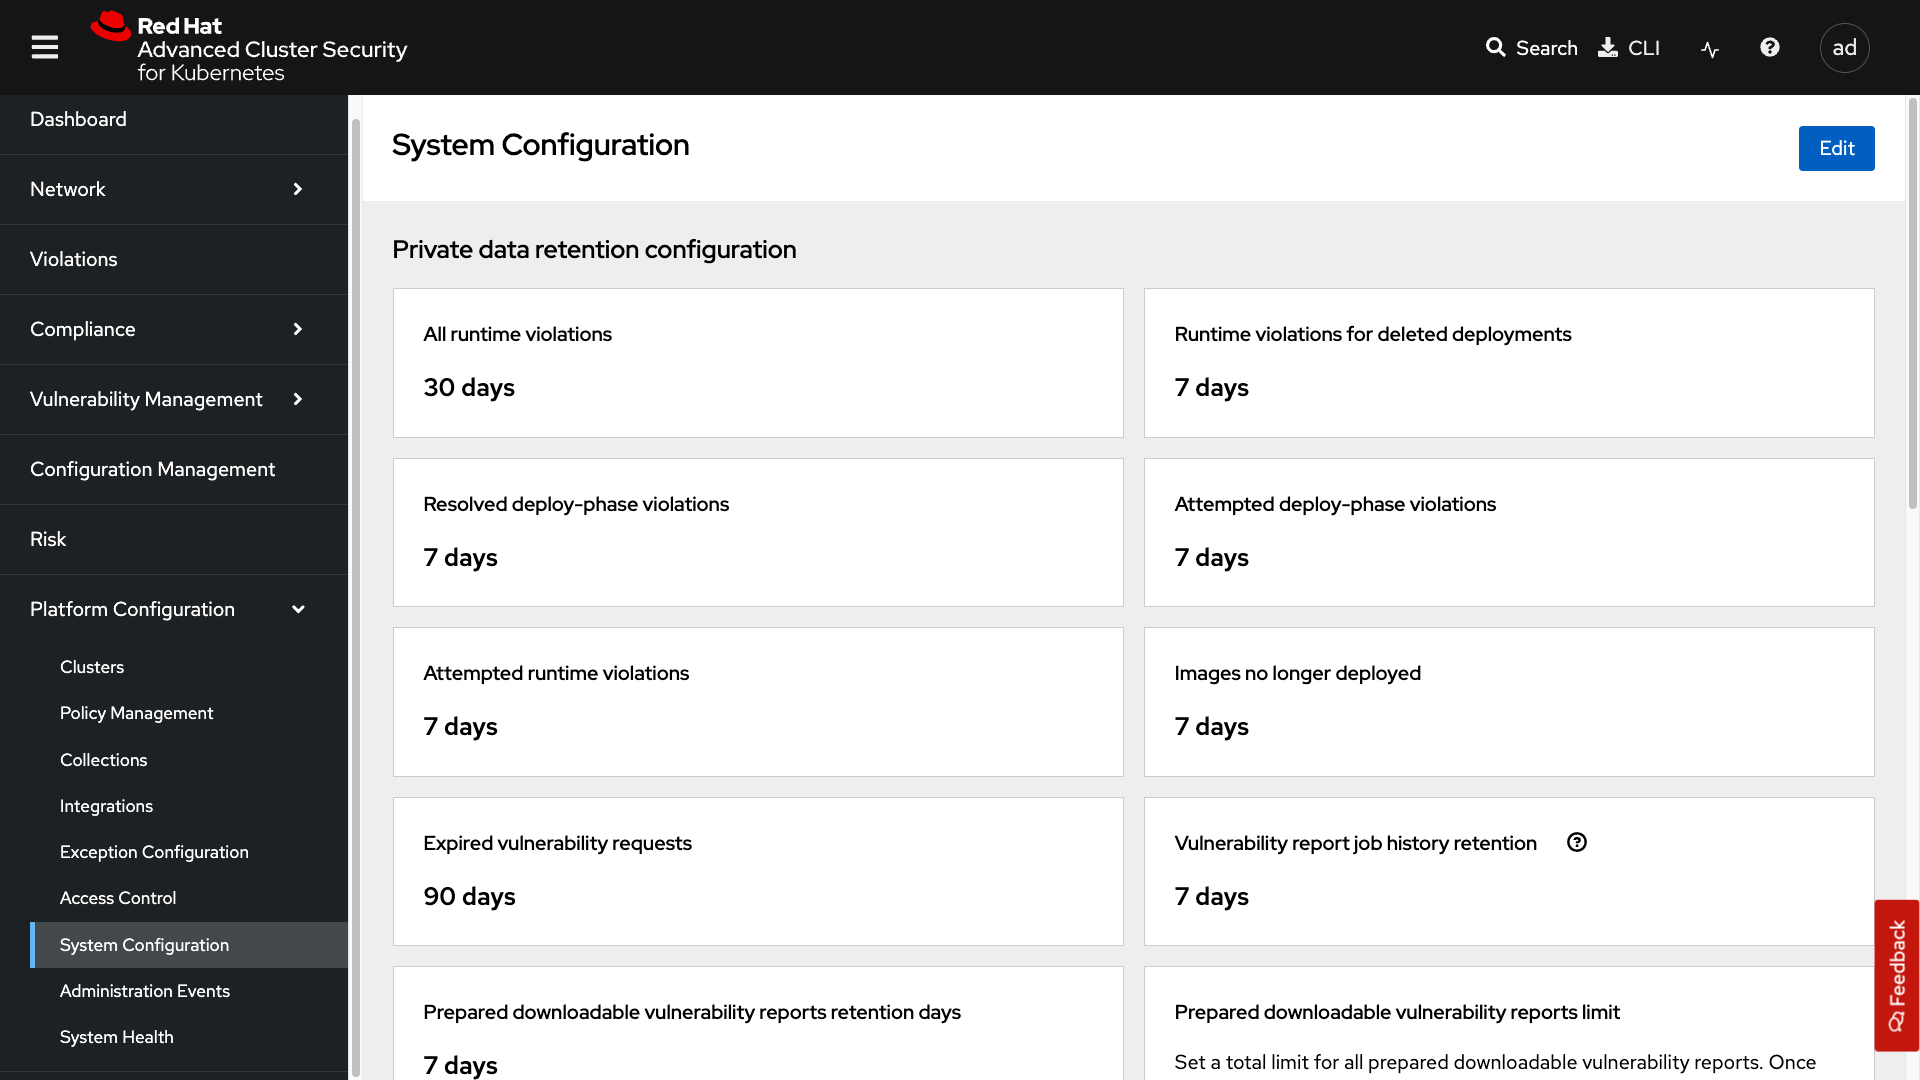
System Configuration
-
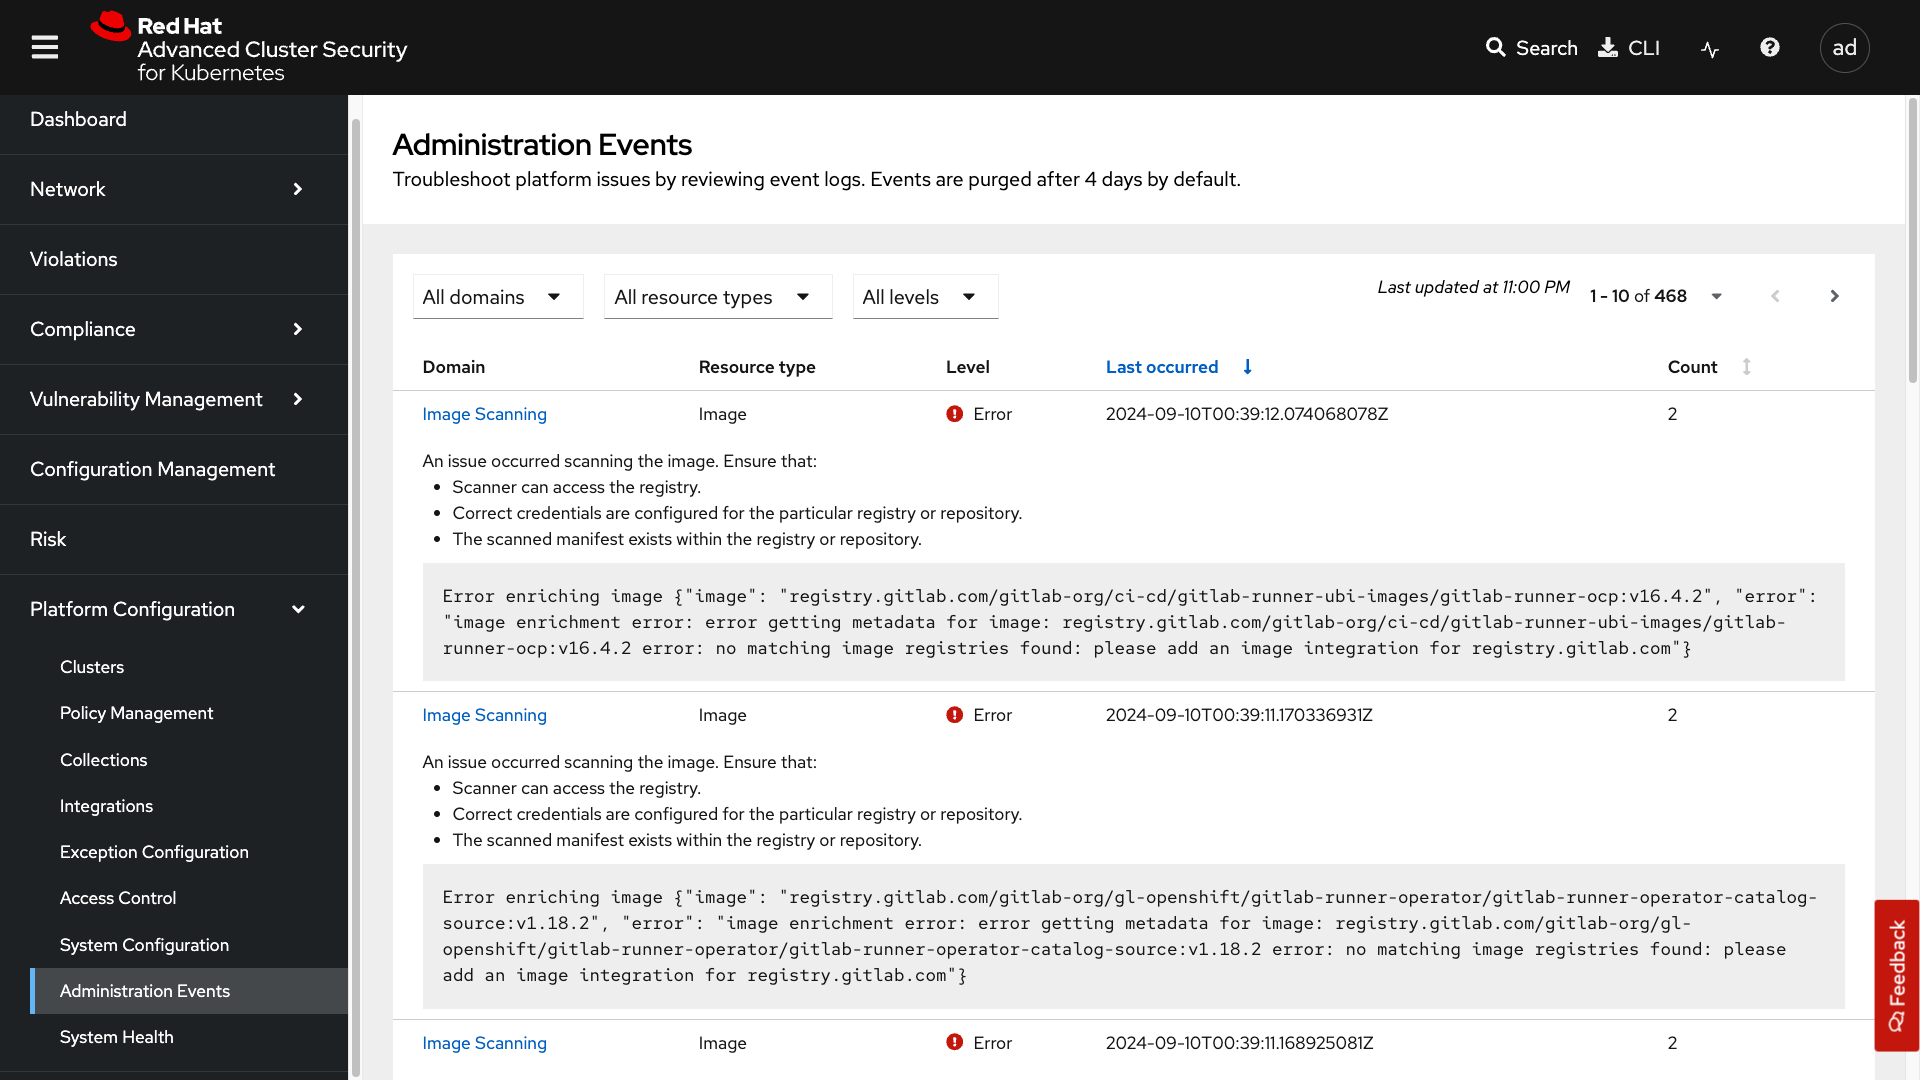
Administration Events
-
System Health
-
3. Dashboard
The Red Hat Advanced Cluster Security for Kubernetes (RHACS) Dashboard provides quick access to the data you need. It contains additional navigation shortcuts and actionable widgets that are easy to filter and customize so that you can focus on the data that matters most to you. You can view information about levels of risk in your environment, compliance status, policy violations, and common vulnerabilities and exposures (CVEs) in images.
The main dashboard is your place to look at the vulnerabilities, risk, compliance, and policy violations across your clusters and namespaces. This section addresses all of the functionality in the main dashboard to help you navigate it more effectively in the future.
The dashboard can be broken down into three main sections:
-
The status bar
-
The dashboard filter
-
The actionable widgets
1. The Status Bar
The status bar provides at-a-glance numerical counters for critical resources. The counters reflect what is visible with your current access scope, defined by the roles associated with your user profile.
These counters are clickable, providing fast access to the desired list view pages as follows:
Counter |
Destination |
Clusters |
Platform Configuration → Clusters |
Nodes |
Configuration Management → Applications & Infrastructure → Nodes |
Violations |
Violations Main Menu |
Deployments |
Configuration Management → Applications & Infrastructure → Deployments |
Images |
Vulnerability Management → Dashboard → Images |
Secrets |
Configuration Management → Applications & Infrastructure → Secrets |
2. The Dashboard Filter
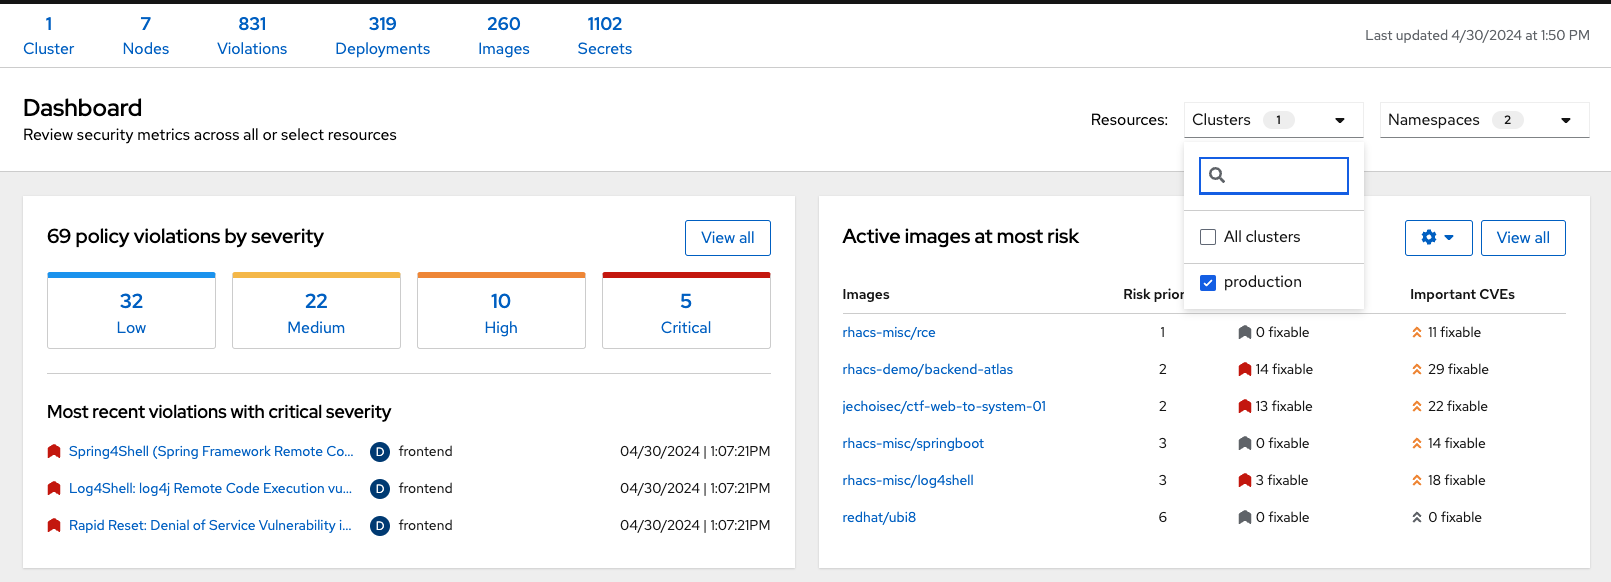
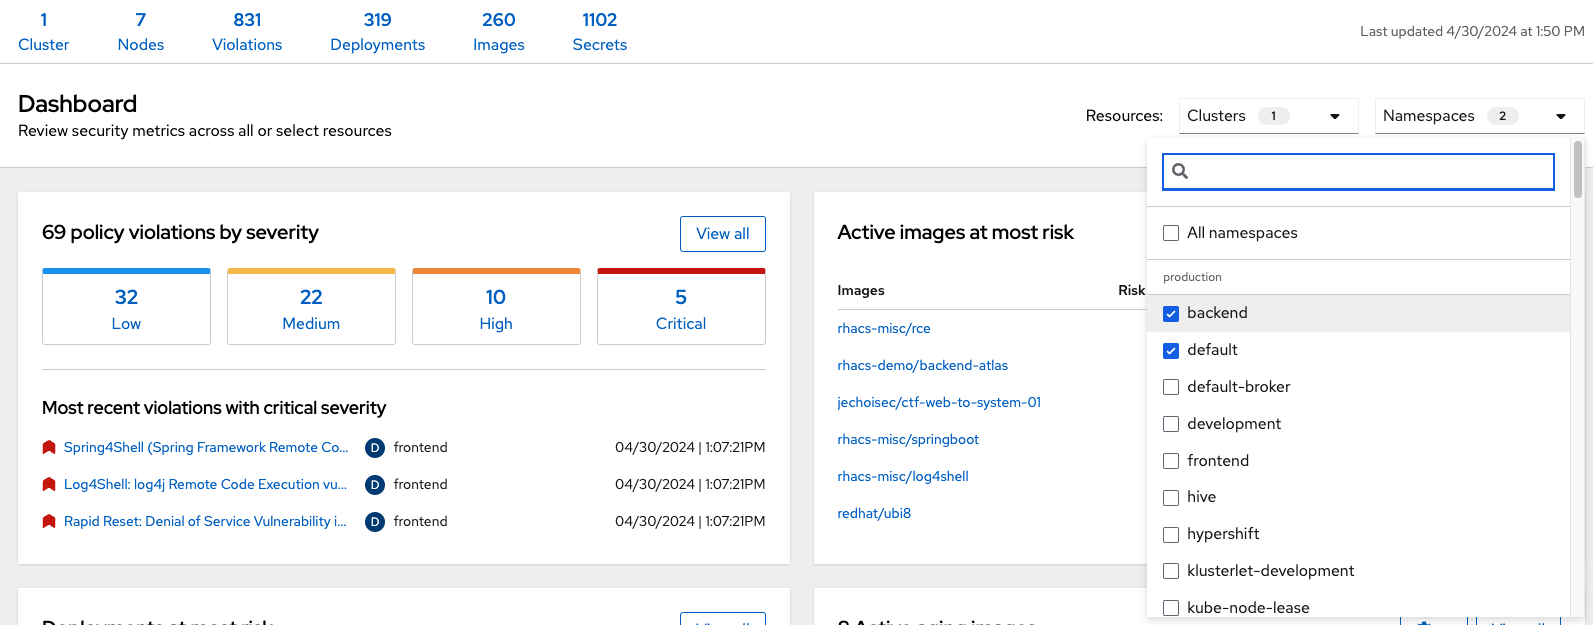
The dashboard includes a top-level filter that applies simultaneously to all widgets. You can select clusters and one or more namespaces within selected clusters. Any change to the filter is immediately reflected by all widgets, limiting the data they present to the selected scope.
| The dashboard filter does not affect the status bar, and when no clusters or namespaces are selected, the view automatically switches to All. |
3. Actionable Widgets
If you have time, adjust the dashboard filtering options and widgets to hone the filtering capabilities.
With these widgets, you can customize the information displayed on the dashboard by default in order to find the items that you consider most important to your deployments and your business’s security.
Navigating the Main Use Cases
We are going to work from the top down throughout the ACS dashboard to give you an overview of all of the use cases that ACS will cover, starting with the network UI.
Network Security
The network user interface contains two drop-downs: the Network Graph tab and the Listening Endpoints tab.
Click on the Network Graph tab
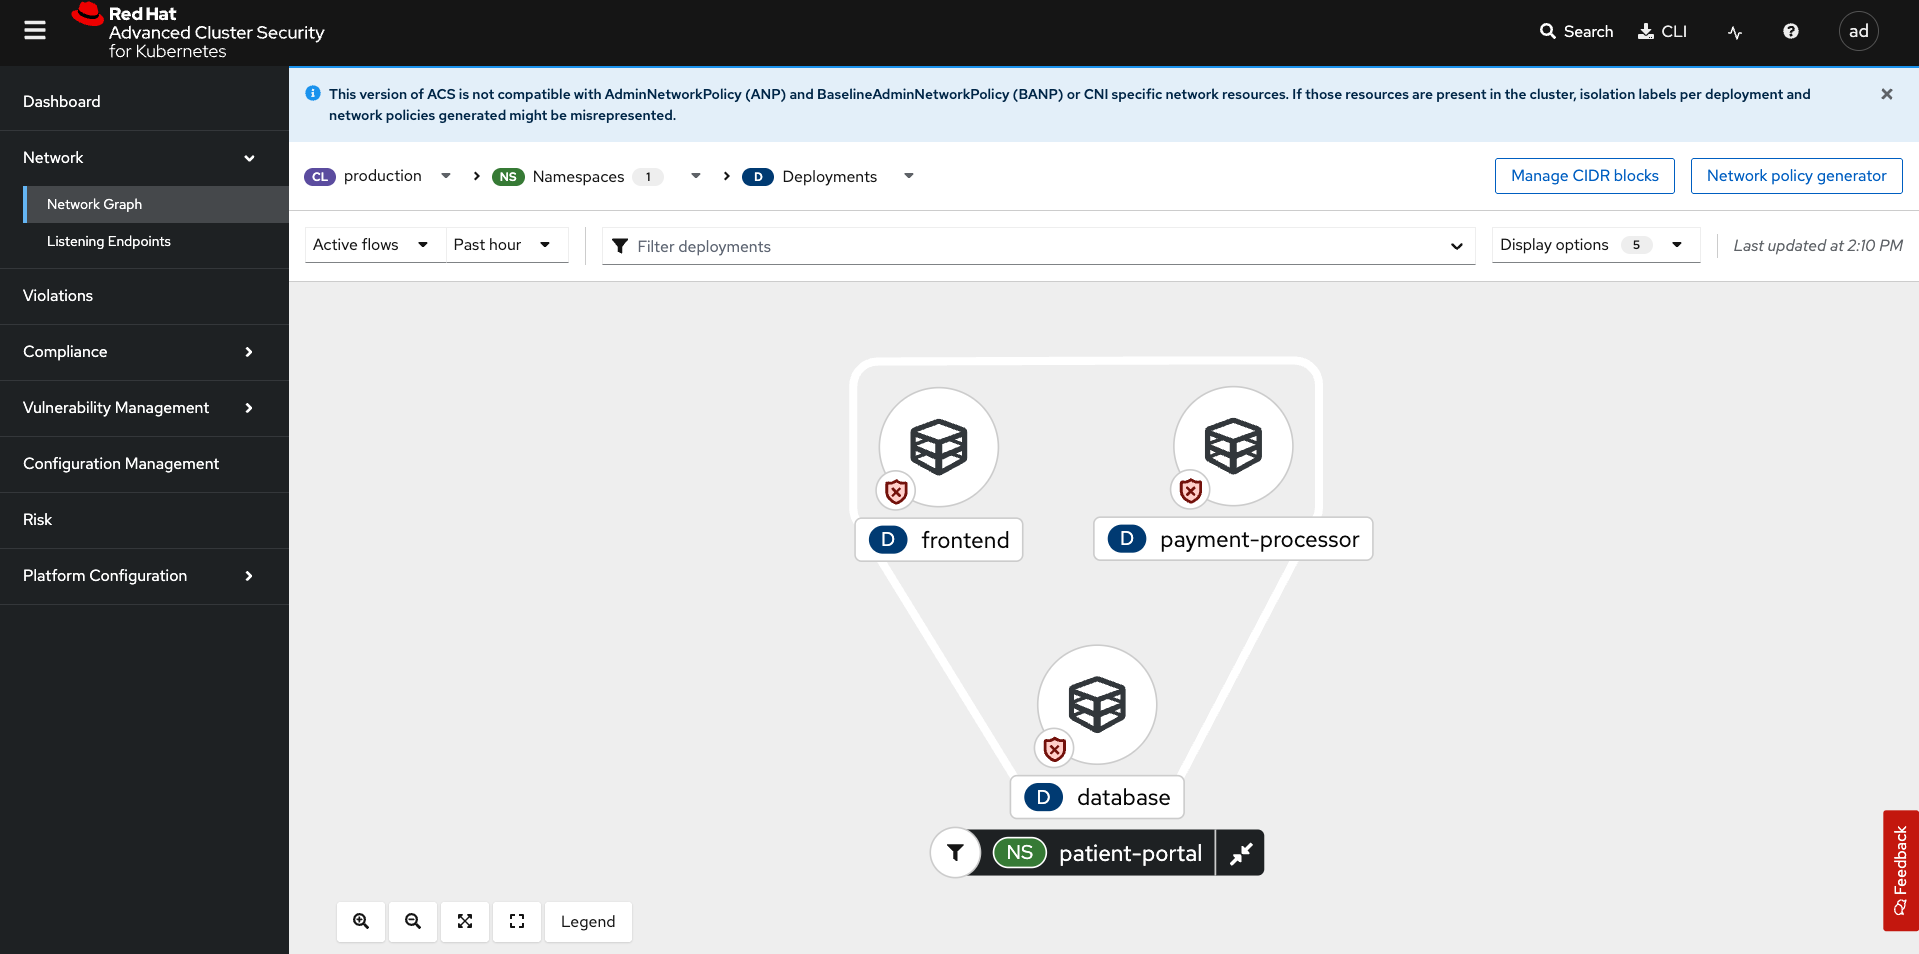
| You will see the following warning message: This version of ACS is not compatible with AdminNetworkPolicy (ANP) and BaselineAdminNetworkPolicy (BANP) or CNI-specific network resources. If those resources are present in the cluster, isolation labels per deployment and network policies generated might be misrepresented. RHACS does not support AdminNetworkPolicy (ANP) and BaselineAdminNetworkPolicy (BANP) or CNI-specific network resources. If those resources are present in the cluster, RHACS will not be able to show them in the Network Graph. |
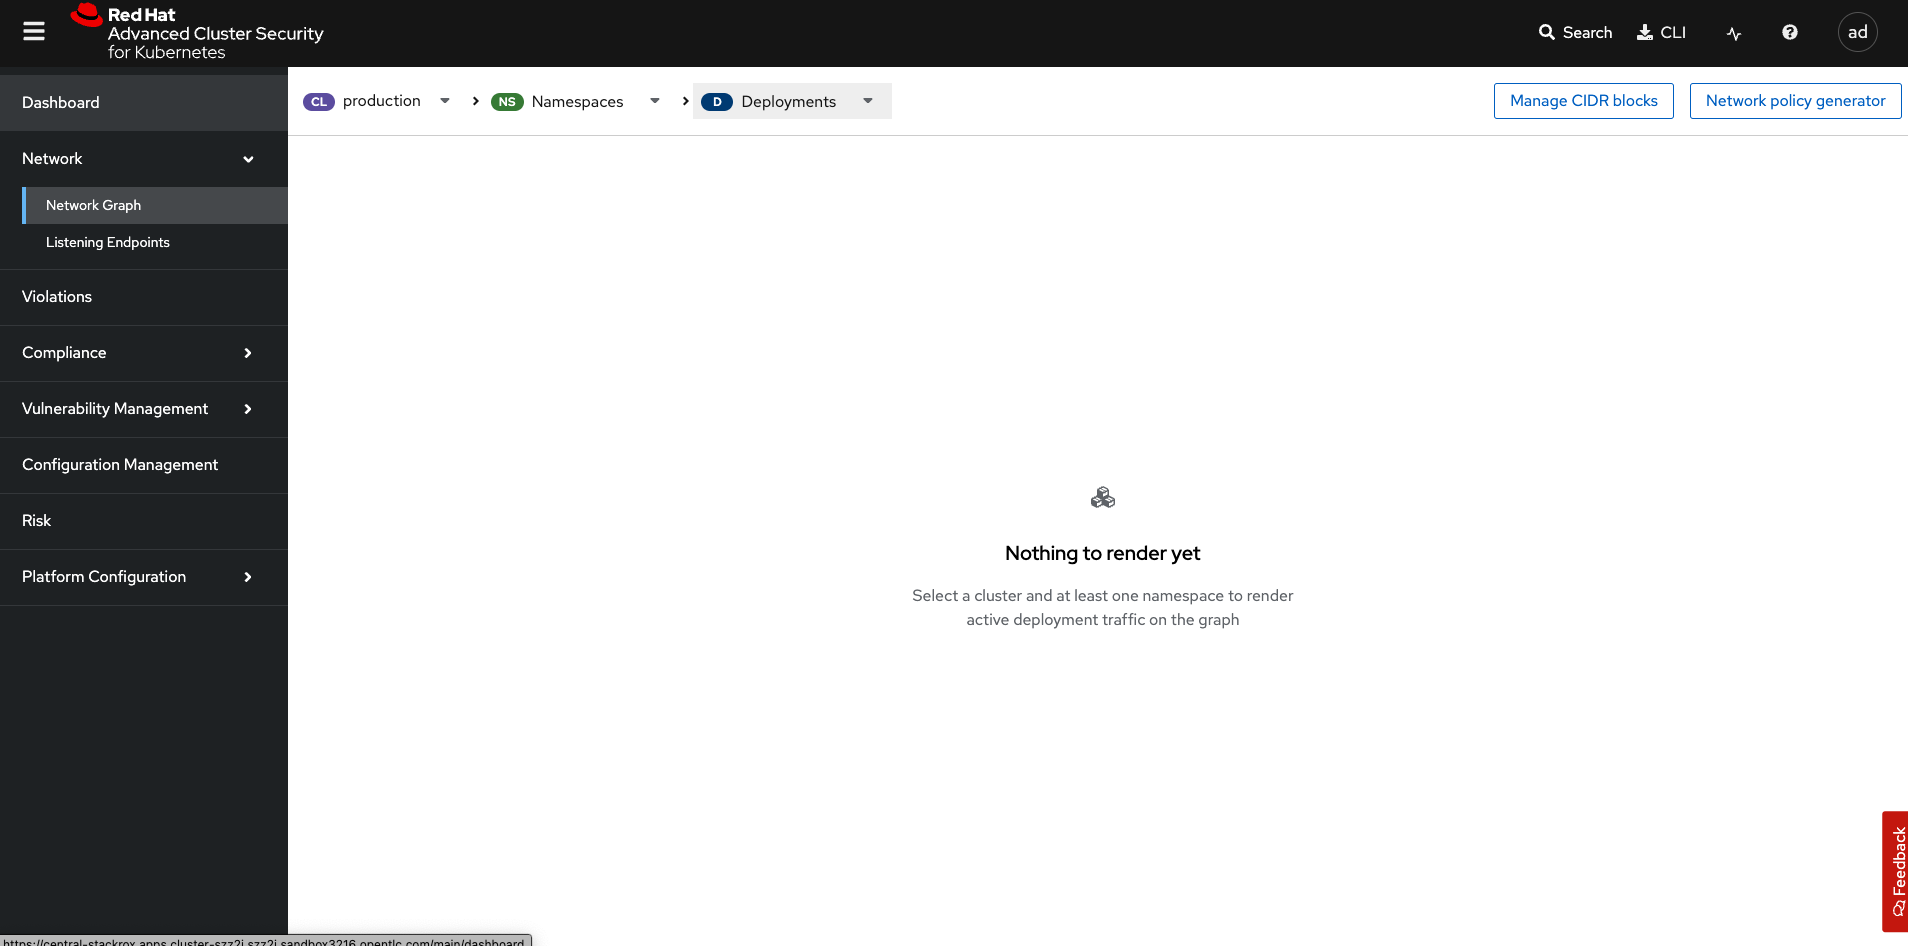
To see results, sort by Cluster → Namespace → Deployment. Try Production + patient-portal
The network graph tab allows you to visualize all the network connections in your cluster, look at baseline flows, simulate network policies, manage CIDR blocks, and more.
| With the externalIP feature enabled, you will see the externalIPs in the Network Graph. Since we are running this lab in AWS, you will see the external network flows into the cluster. |
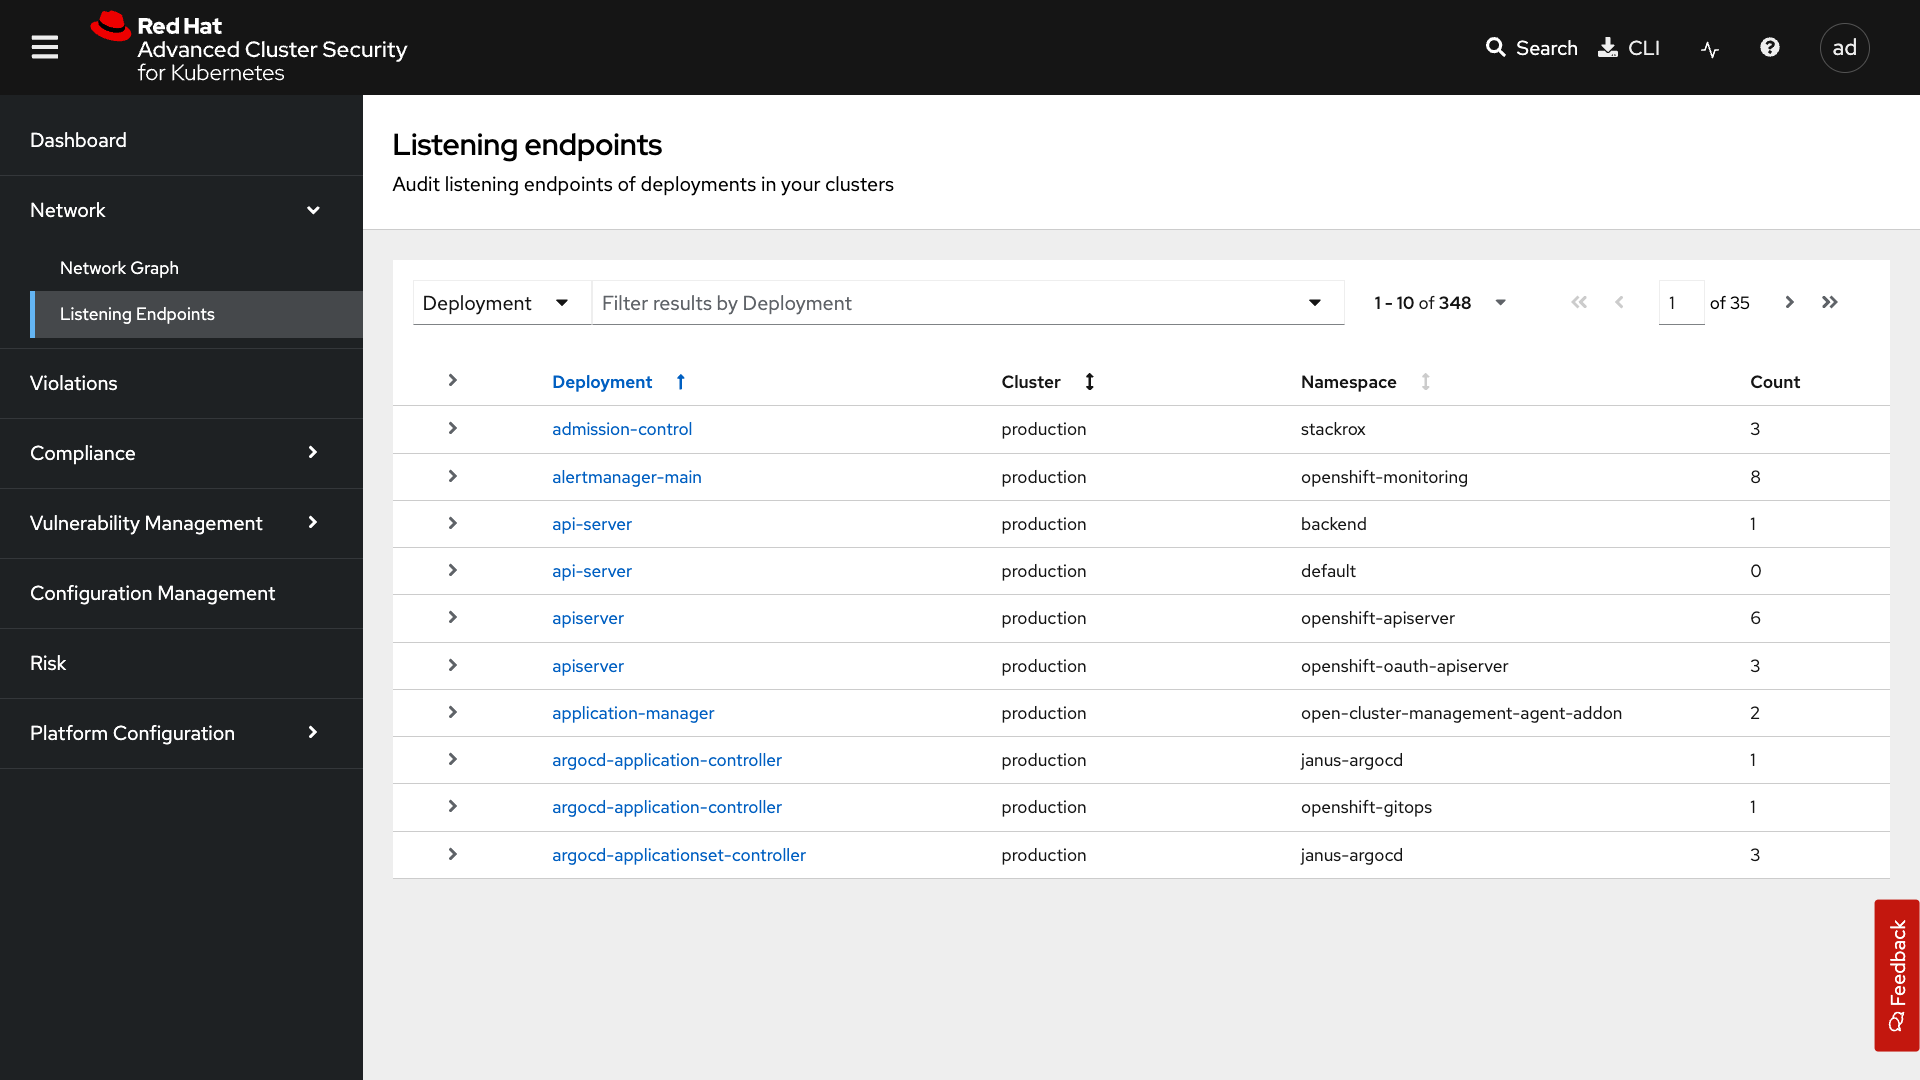
Click on the Listening Endpoints tab
With the Listening Endpoints tab, you can see all of the deployments across your clusters and audit for any reported listening endpoints. As you drill down through cluster, namespace, and into deployments, you will see the exact process ID, port, protocol, pod ID, container name, and whether they are exposed.
Violations
On to the violations tab.
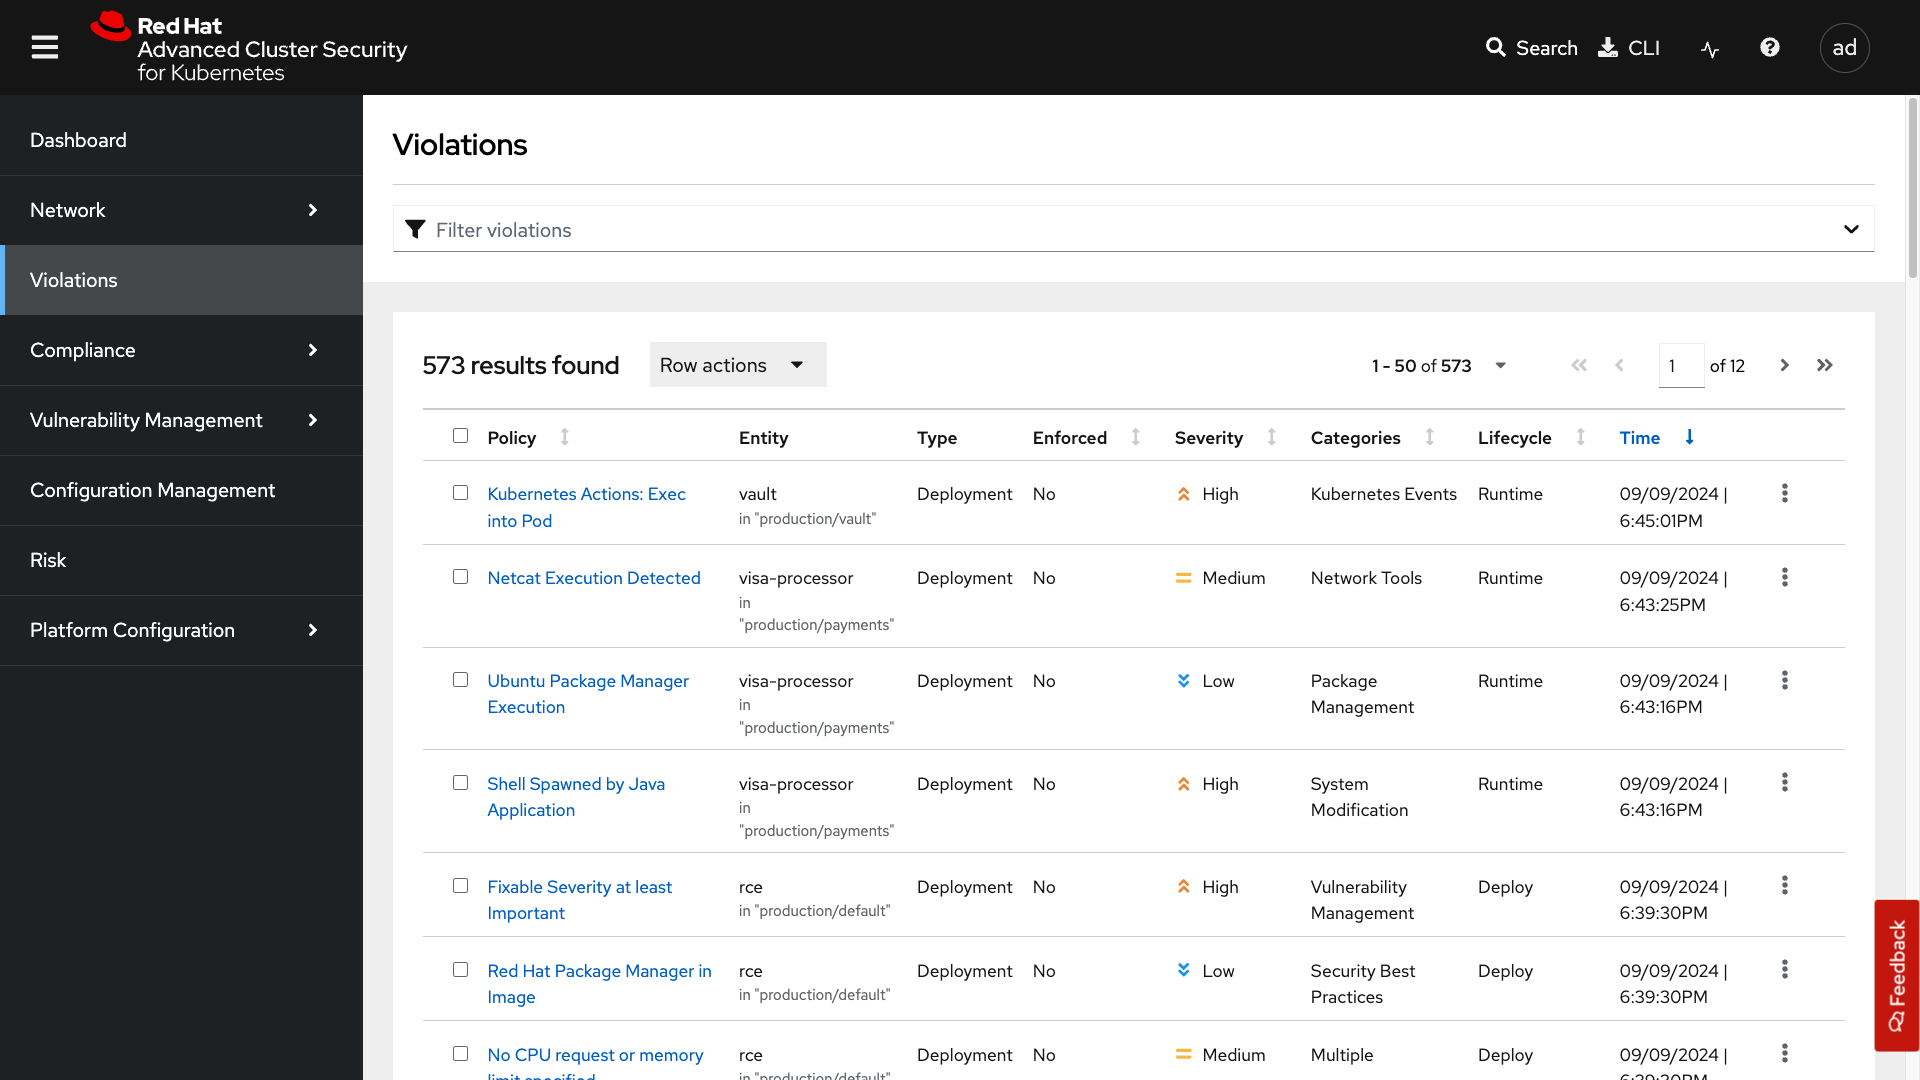
The violations tab is where you will manage all of your policy violations. The violations tab is excellent for managing policy violations in the workflow.
It contains:
-
The exact policy that was violated
-
The entity that violated the policy
-
The type
-
If it is enforced
-
The severity of that policy
-
The category
-
The lifecycle
-
And the time of the violation
Don’t worry, you’ll go through this policy violation workflow in later modules.
Compliance
Red Hat Advanced Cluster Security for Kubernetes supports OpenShift Container Platform configuration compliance standards through an integration with the OpenShift Container Platform Compliance Operator. In addition, it allows you to measure and report on configuration security best practices for OpenShift and supported Kubernetes platforms.
The OpenShift Compliance Operator allows OpenShift Container Platform administrators to define the desired compliance state of a cluster and provides an overview of gaps and ways to remediate any non-compliant policy. We will be installing and managing the compliance operator in later modules.
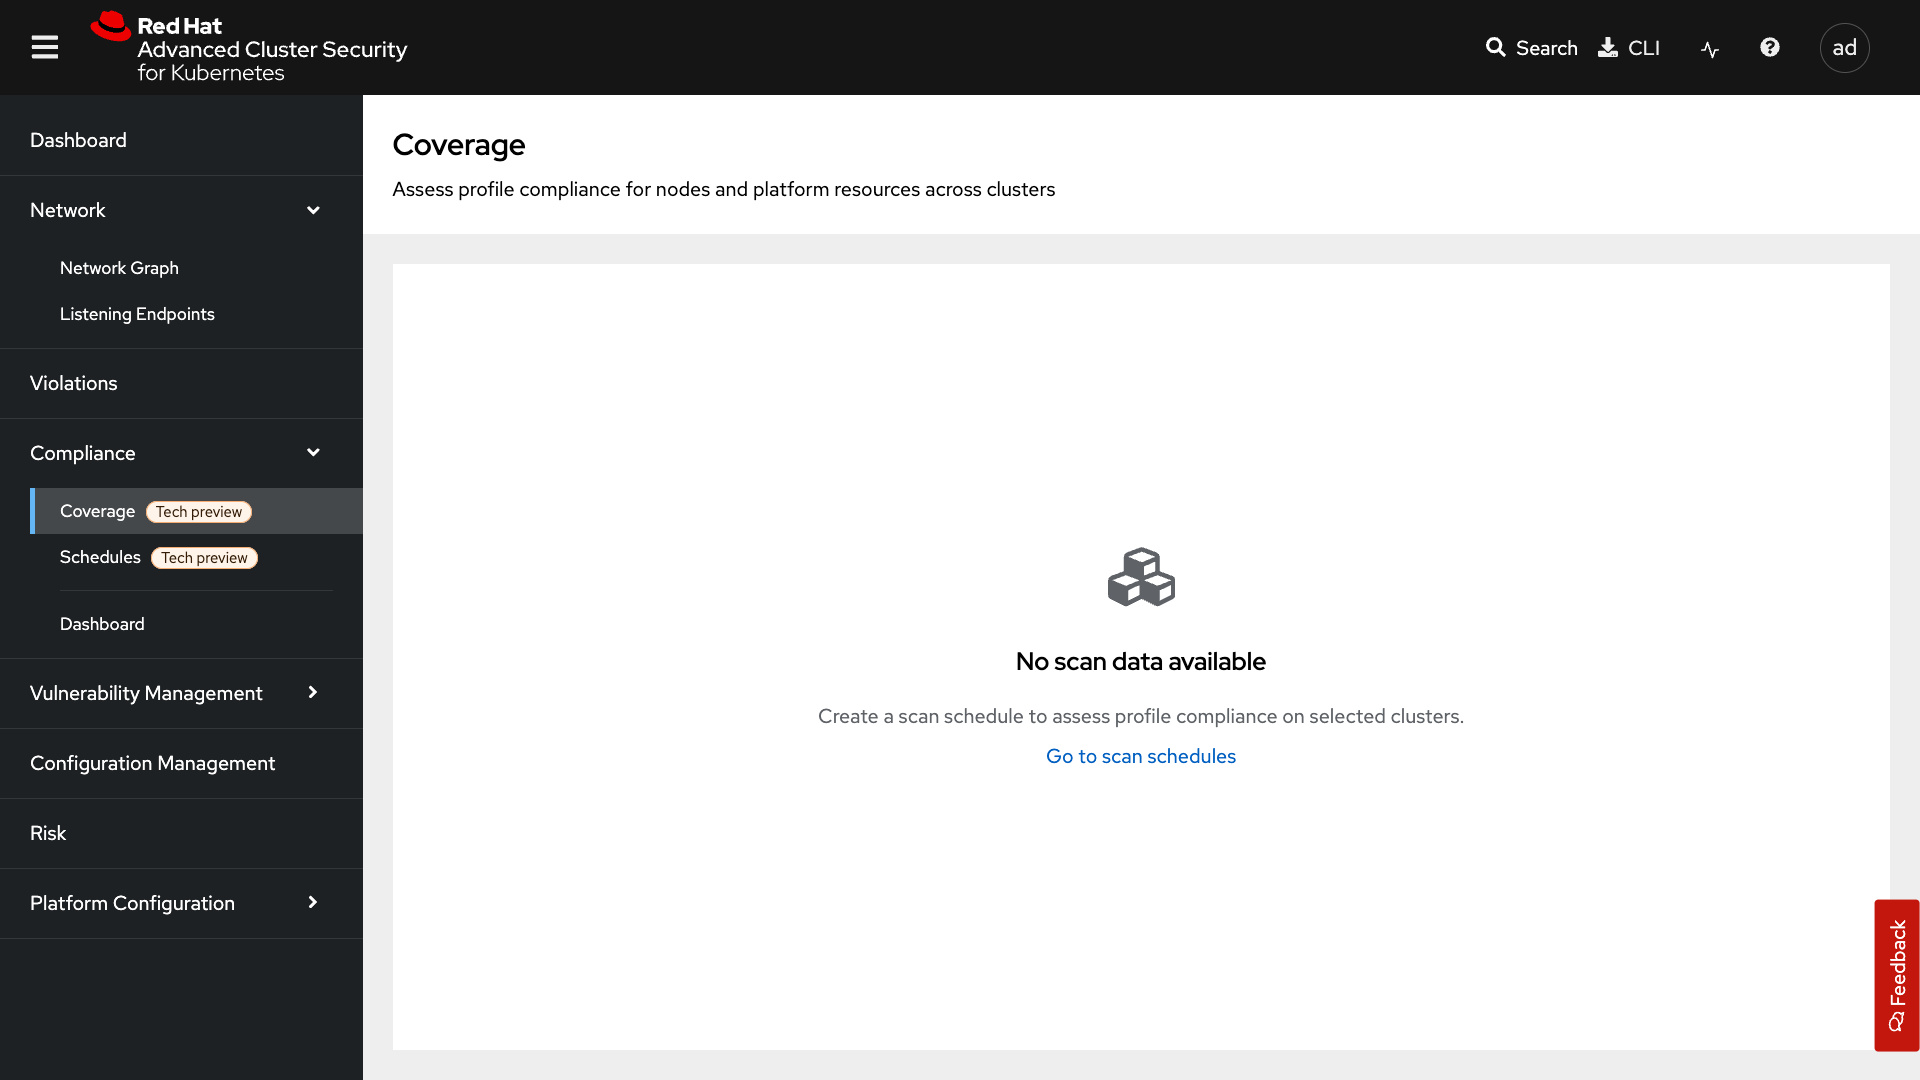
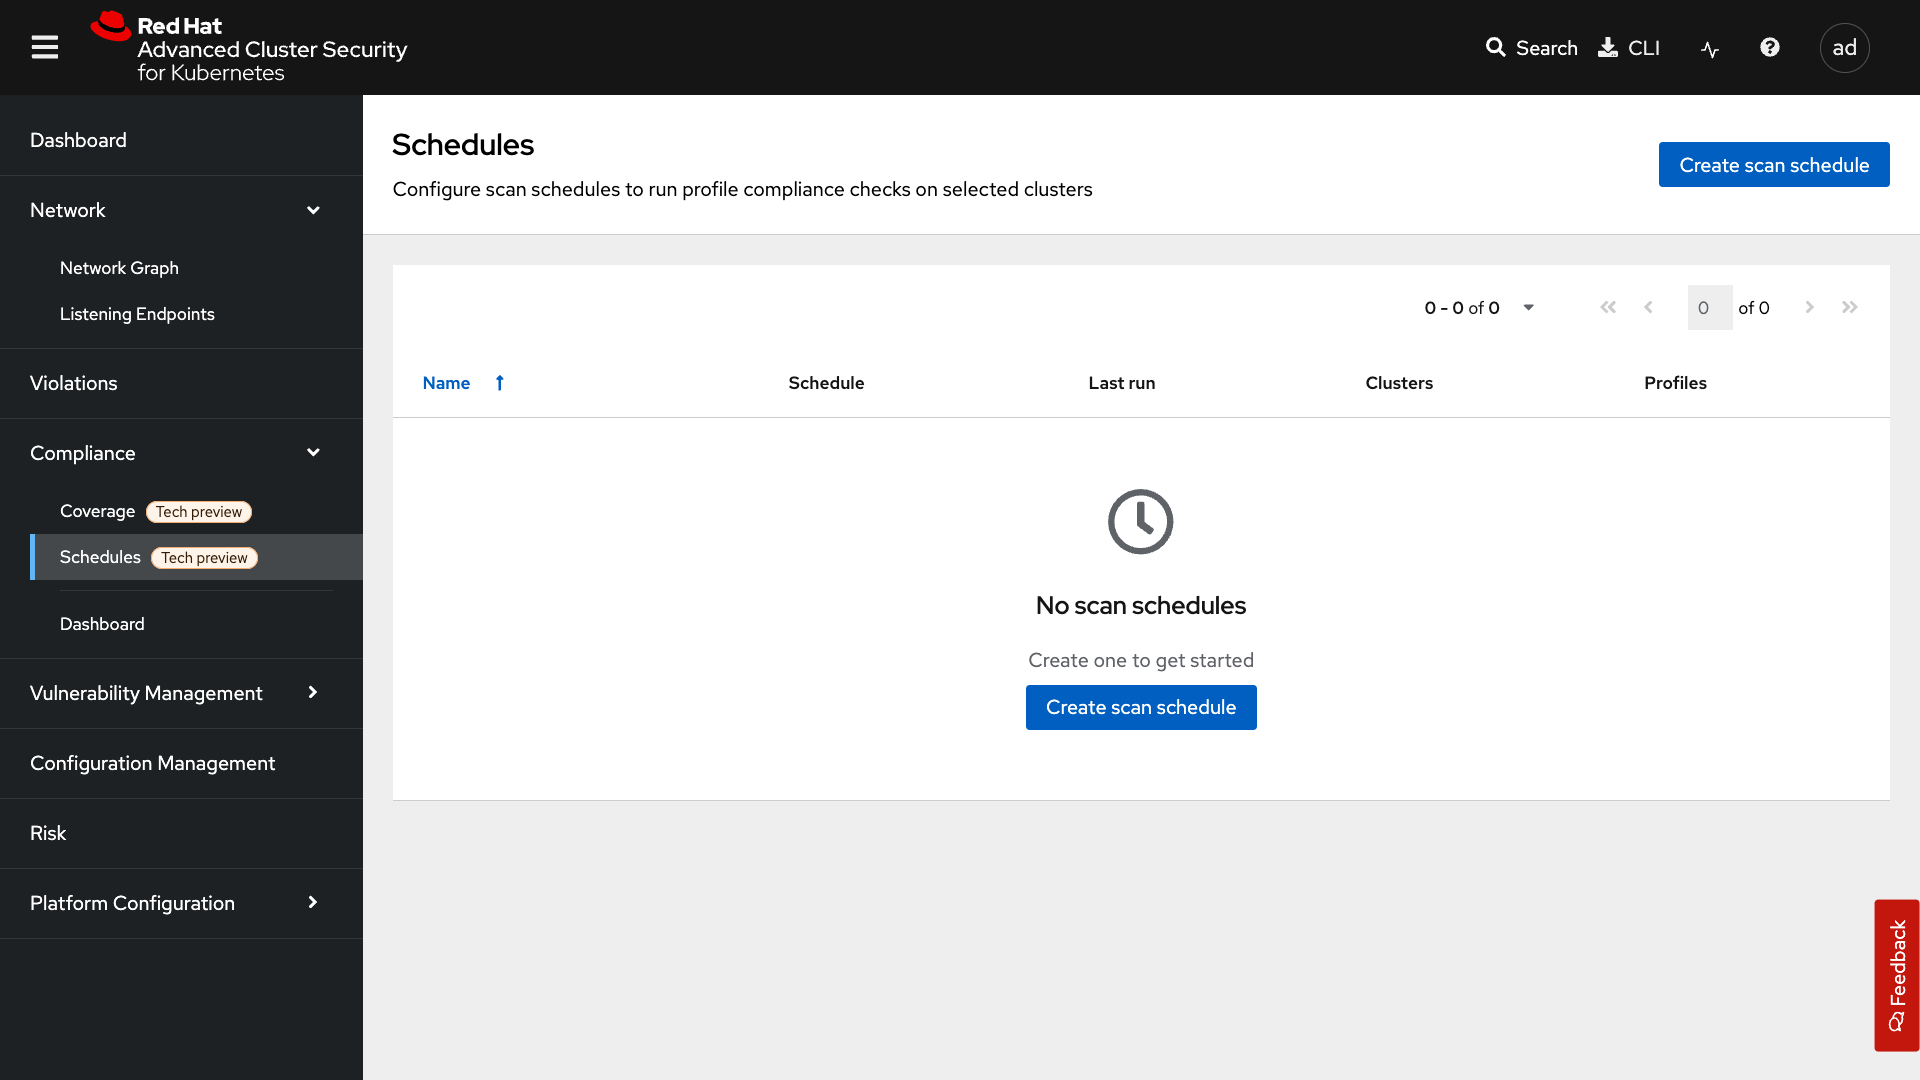
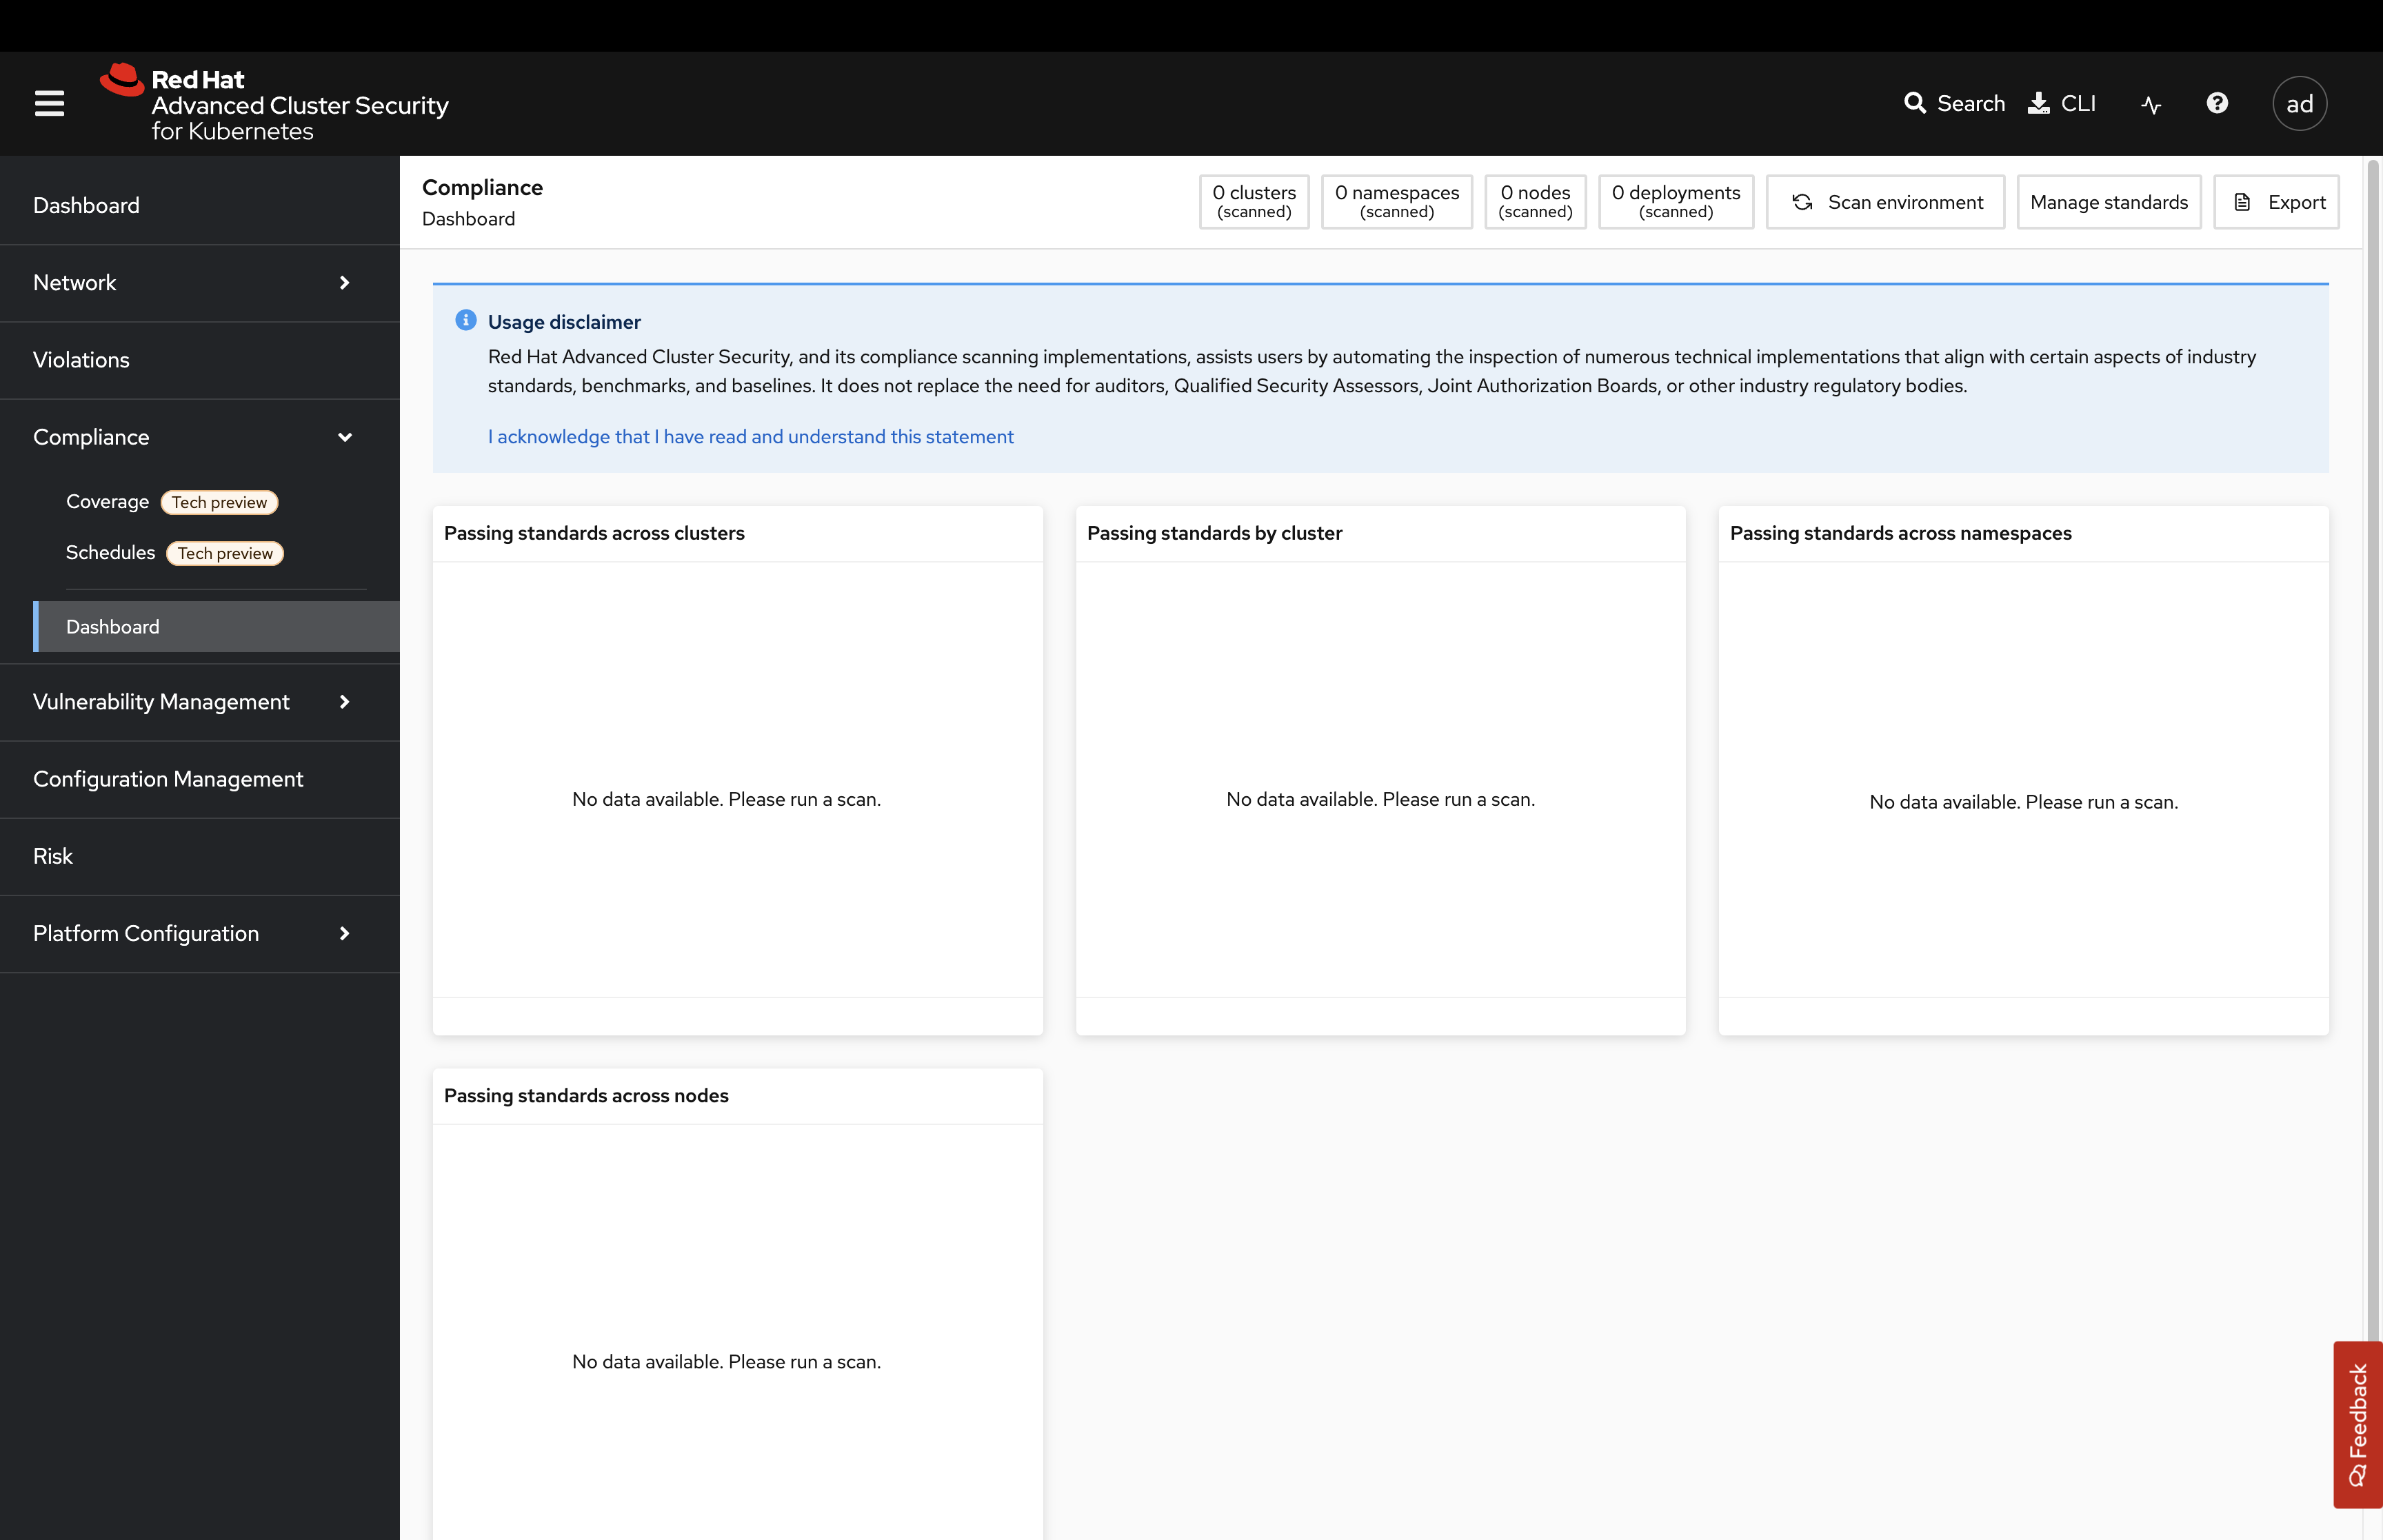
The Compliance dropdown has three tabs to choose from:
-
Coverage
-
Schedules
-
Dashboard
Coverage
The Coverage tab will contain all of your scanned clusters and workloads after the Compliance Operator is set up. You will go through this in the Compliance section later in the roadshow.
Schedules
Created scan schedules that report on the various CIS, PCI-DSS, and DISA-STIG compliance standards you wish to evaluate.
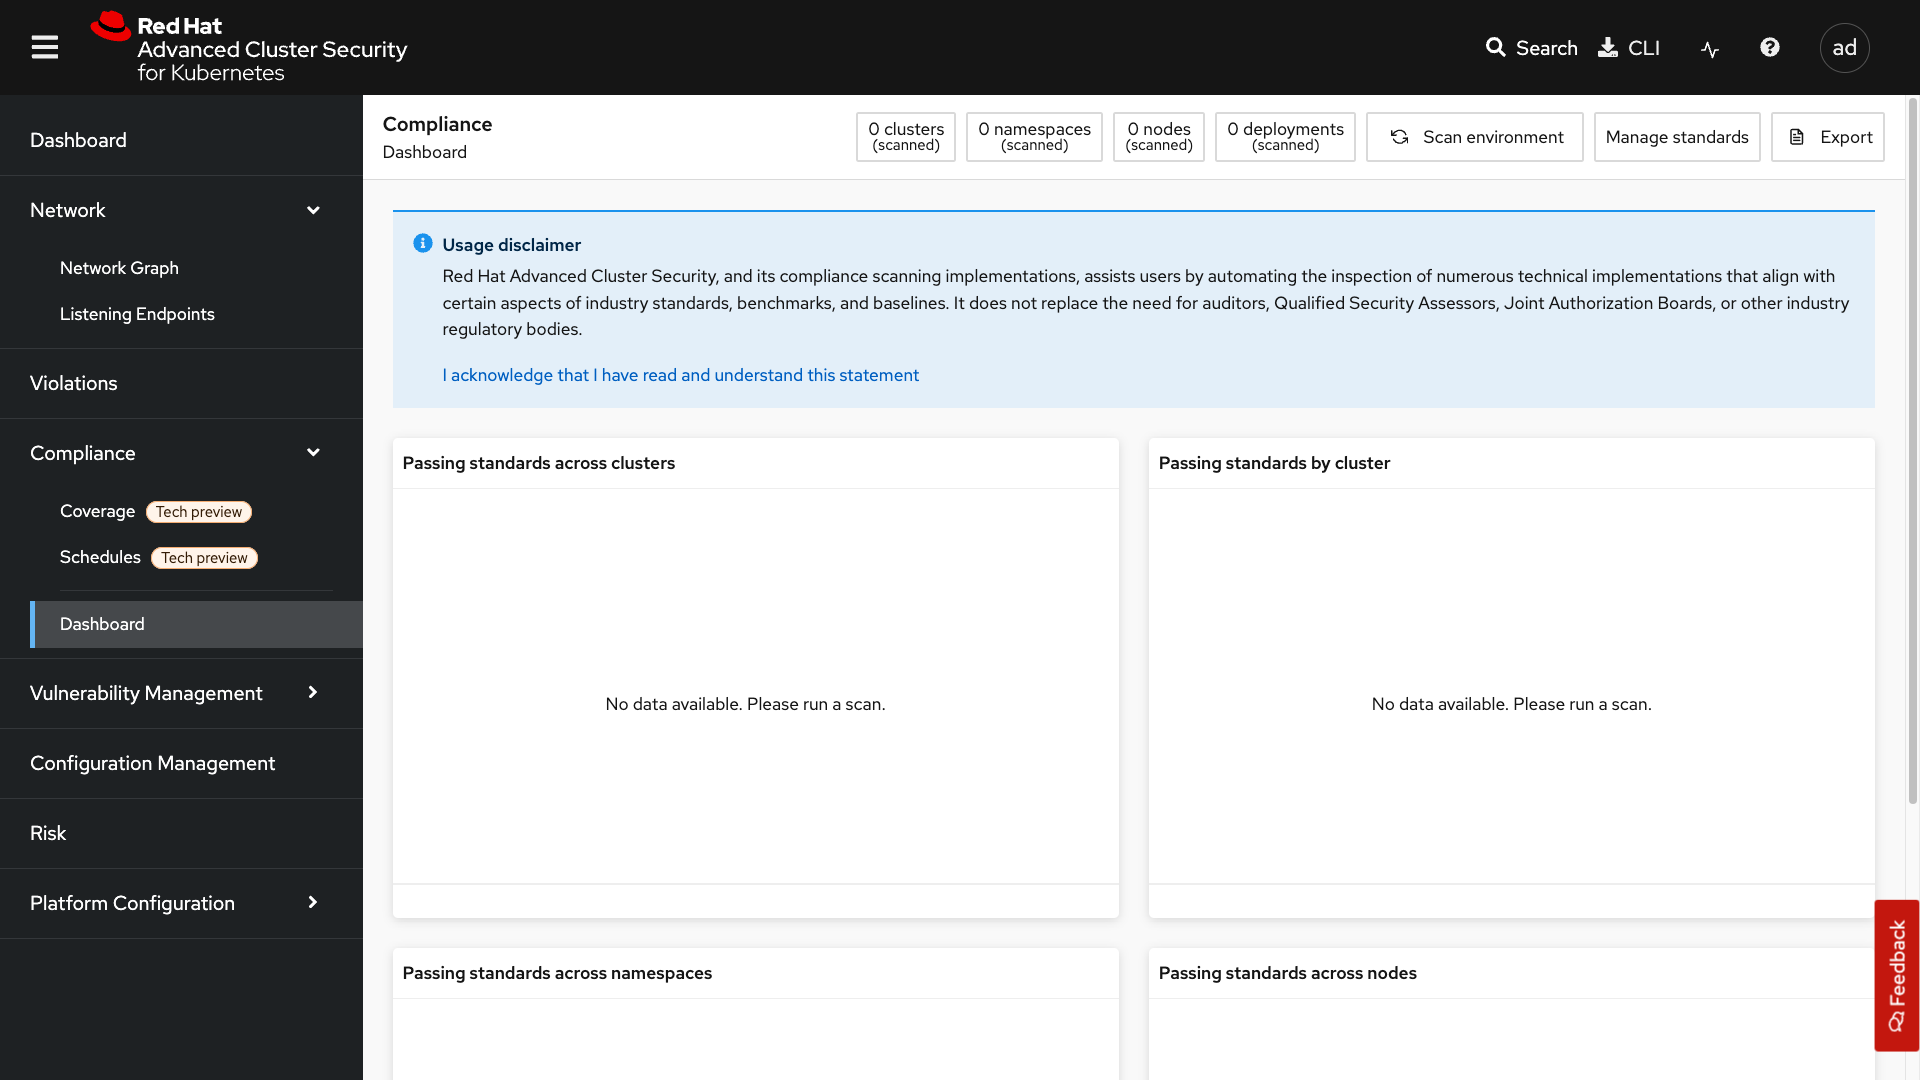
Compliance Dashboard (Previously Compliance 1.0)
The Compliance dashboard will be empty when you’re here for the first time. This is because you have not completed a scan yet. Let’s go ahead and schedule our first scan.
Click the Scan environment button in the top right of the page to kick off your first scan.
| Ensure you see the bar graphs fill up with data before moving. We will review these compliance results in a later module. |
We will dive deeper into this tab in later sections, but feel free to explore the compliance dashboard and its various graphs.
Vulnerability Management
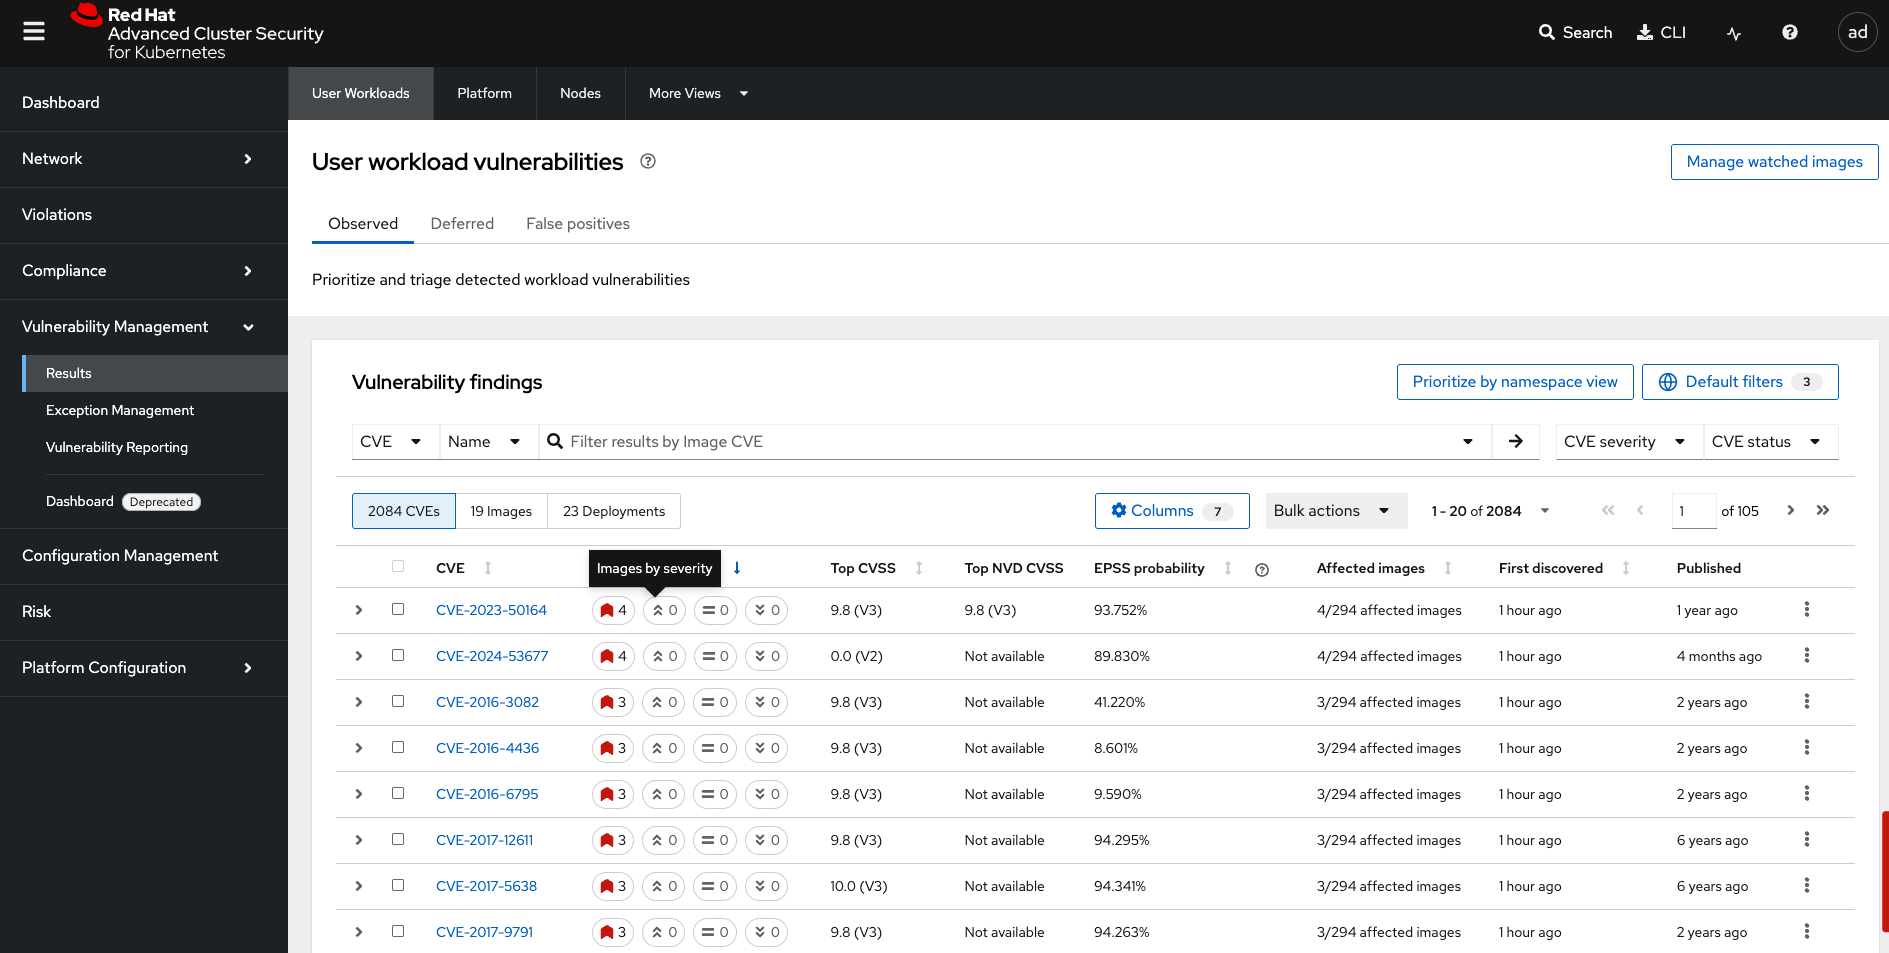
Next, we have the Vulnerability Management tab, which has been overhauled for greater visibility and efficient filtering.
The Vulnerability Management tab contains a lot of information, including:
-
Results
-
Exception Management
-
Vulnerability Reporting
-
Platform CVEs
-
Node CVEs
-
Dashboard (Deprecated)
Click on the results tab
Notice the tabs at the top that separate the User Workloads, Platform, Nodes, and More Views. These tabs help users navigate more effectively between their workloads, OpenShift platform vulnerabilities, and node vulnerabilities.
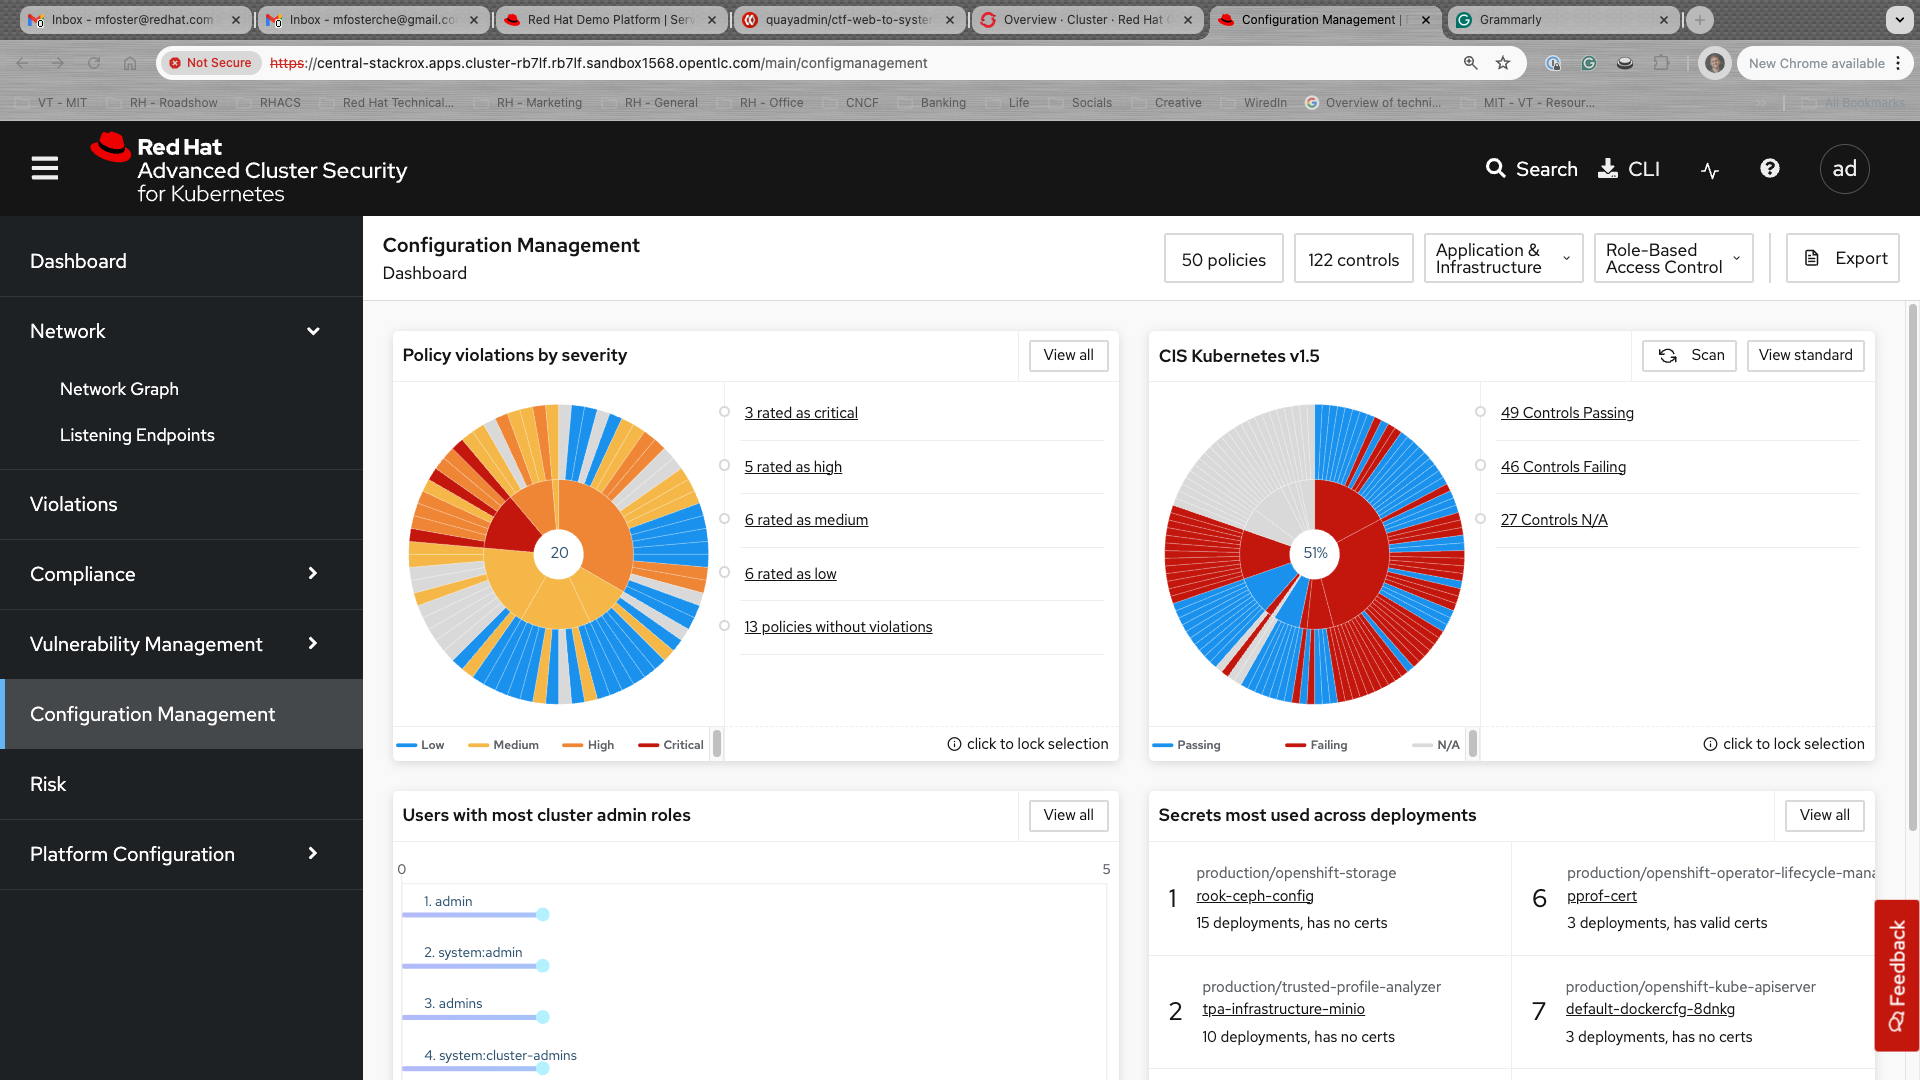
Configuration Management
The Configuration Management tab contains a lot of information about the security configuration across your OpenShift and Kubernetes clusters.
This information includes:
-
Policy violations by severity
-
Specific standards like the CIS Kubernetes 1.5 standard
-
Users with the most cluster admin roles
-
Secrets used across deployments
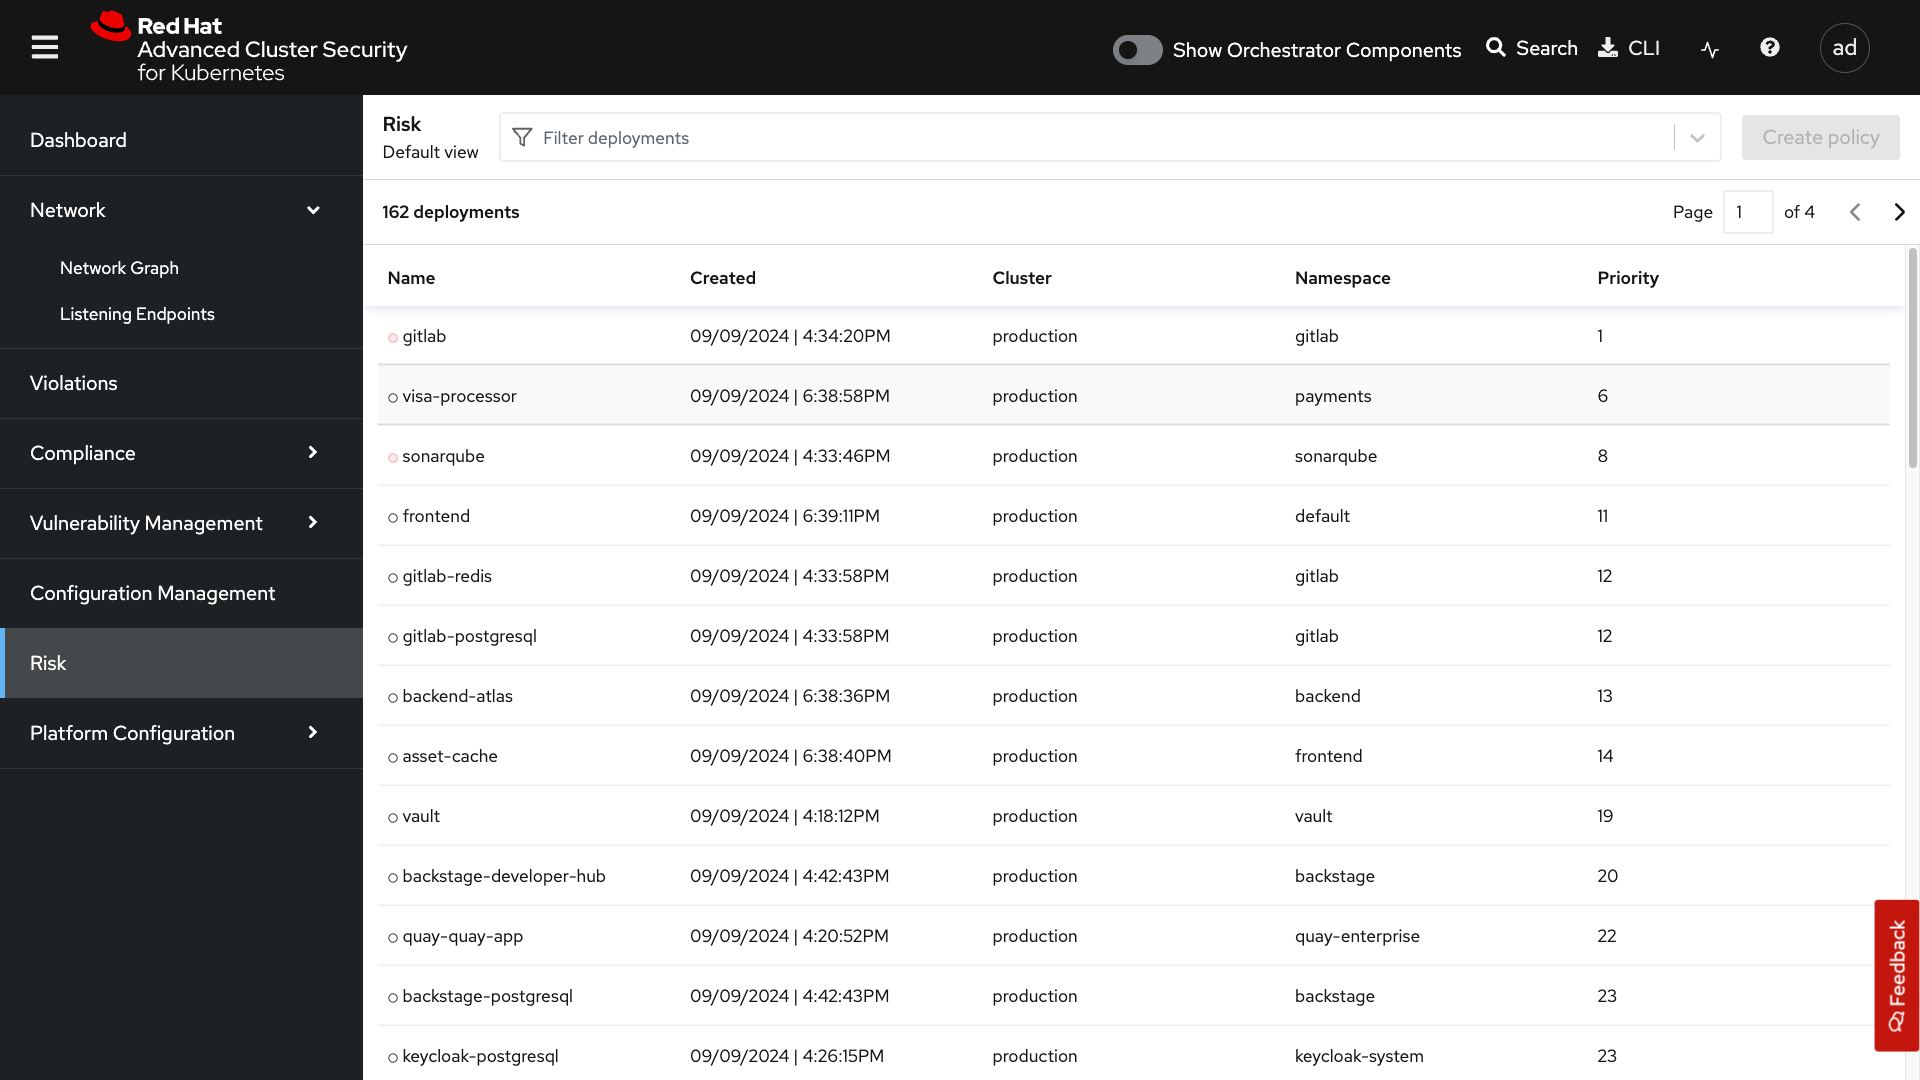
Risk
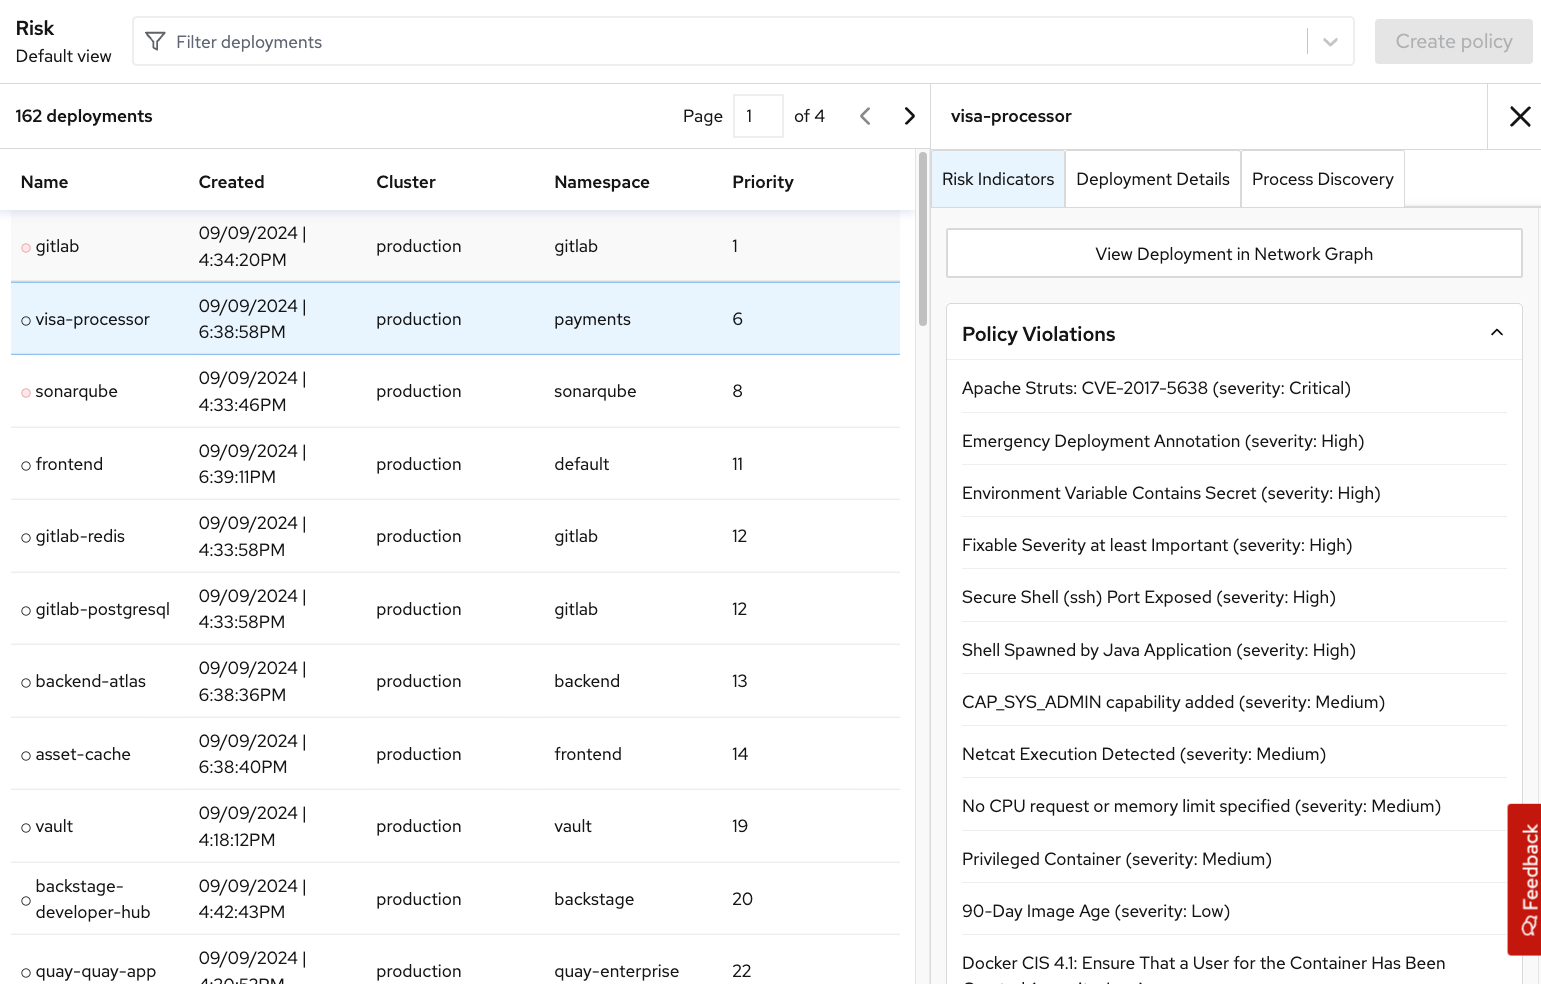
The Risk tab is a combination of security configuration management, network detection, runtime information, incident response, and vulnerability management all coming together so that users can gain greater context and prioritize security issues throughout OpenShift and Kubernetes clusters.
In this tab, you can review risk indicators, deployment details, and look at process discoveries such as runtime processes in a container. All of this information is designed to help you gain a greater understanding of the priority of specific workloads in your cluster, as security is not only vulnerability management.
Platform Configuration
RHACS configuration, policy management, and integration details, including:
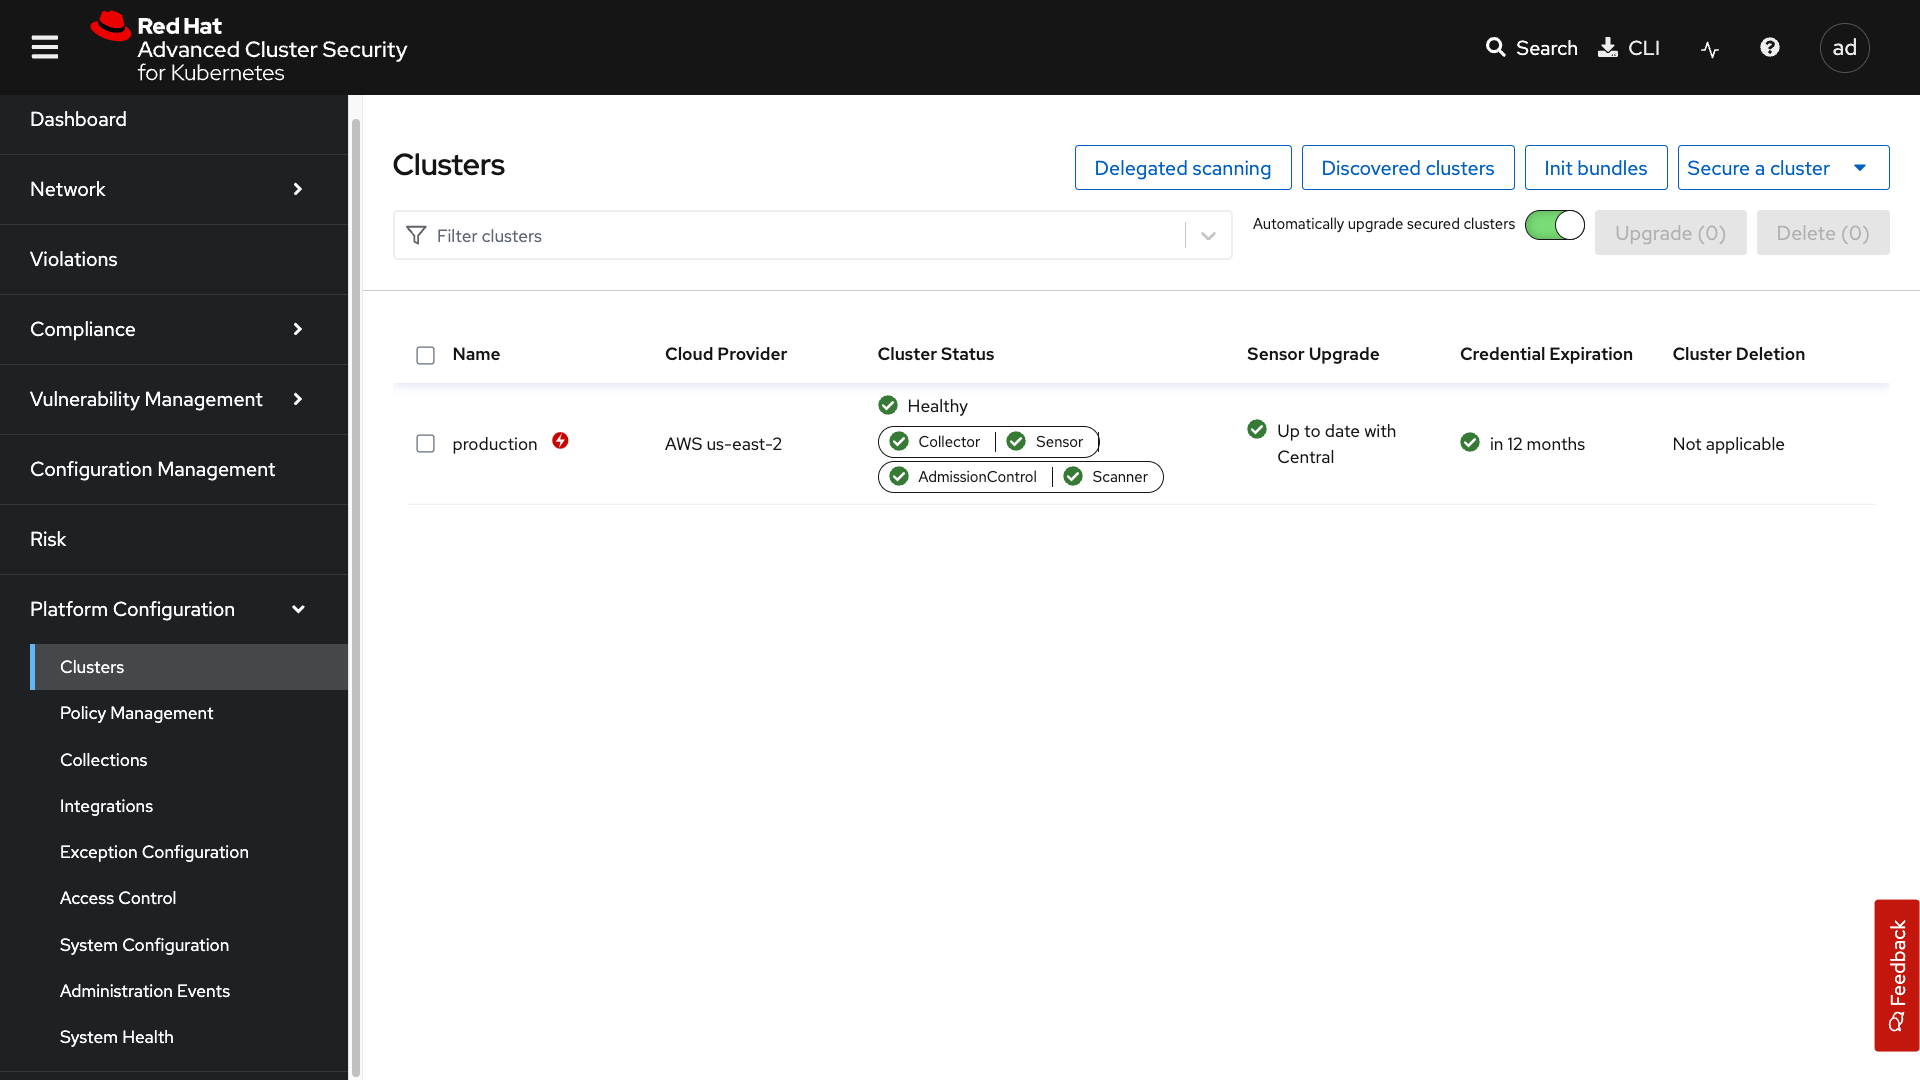
Clusters:
Where you can manage your clusters, check out cluster status, watch your credential expiration, manage delegated scanning, and onboard your clusters via init bundles.
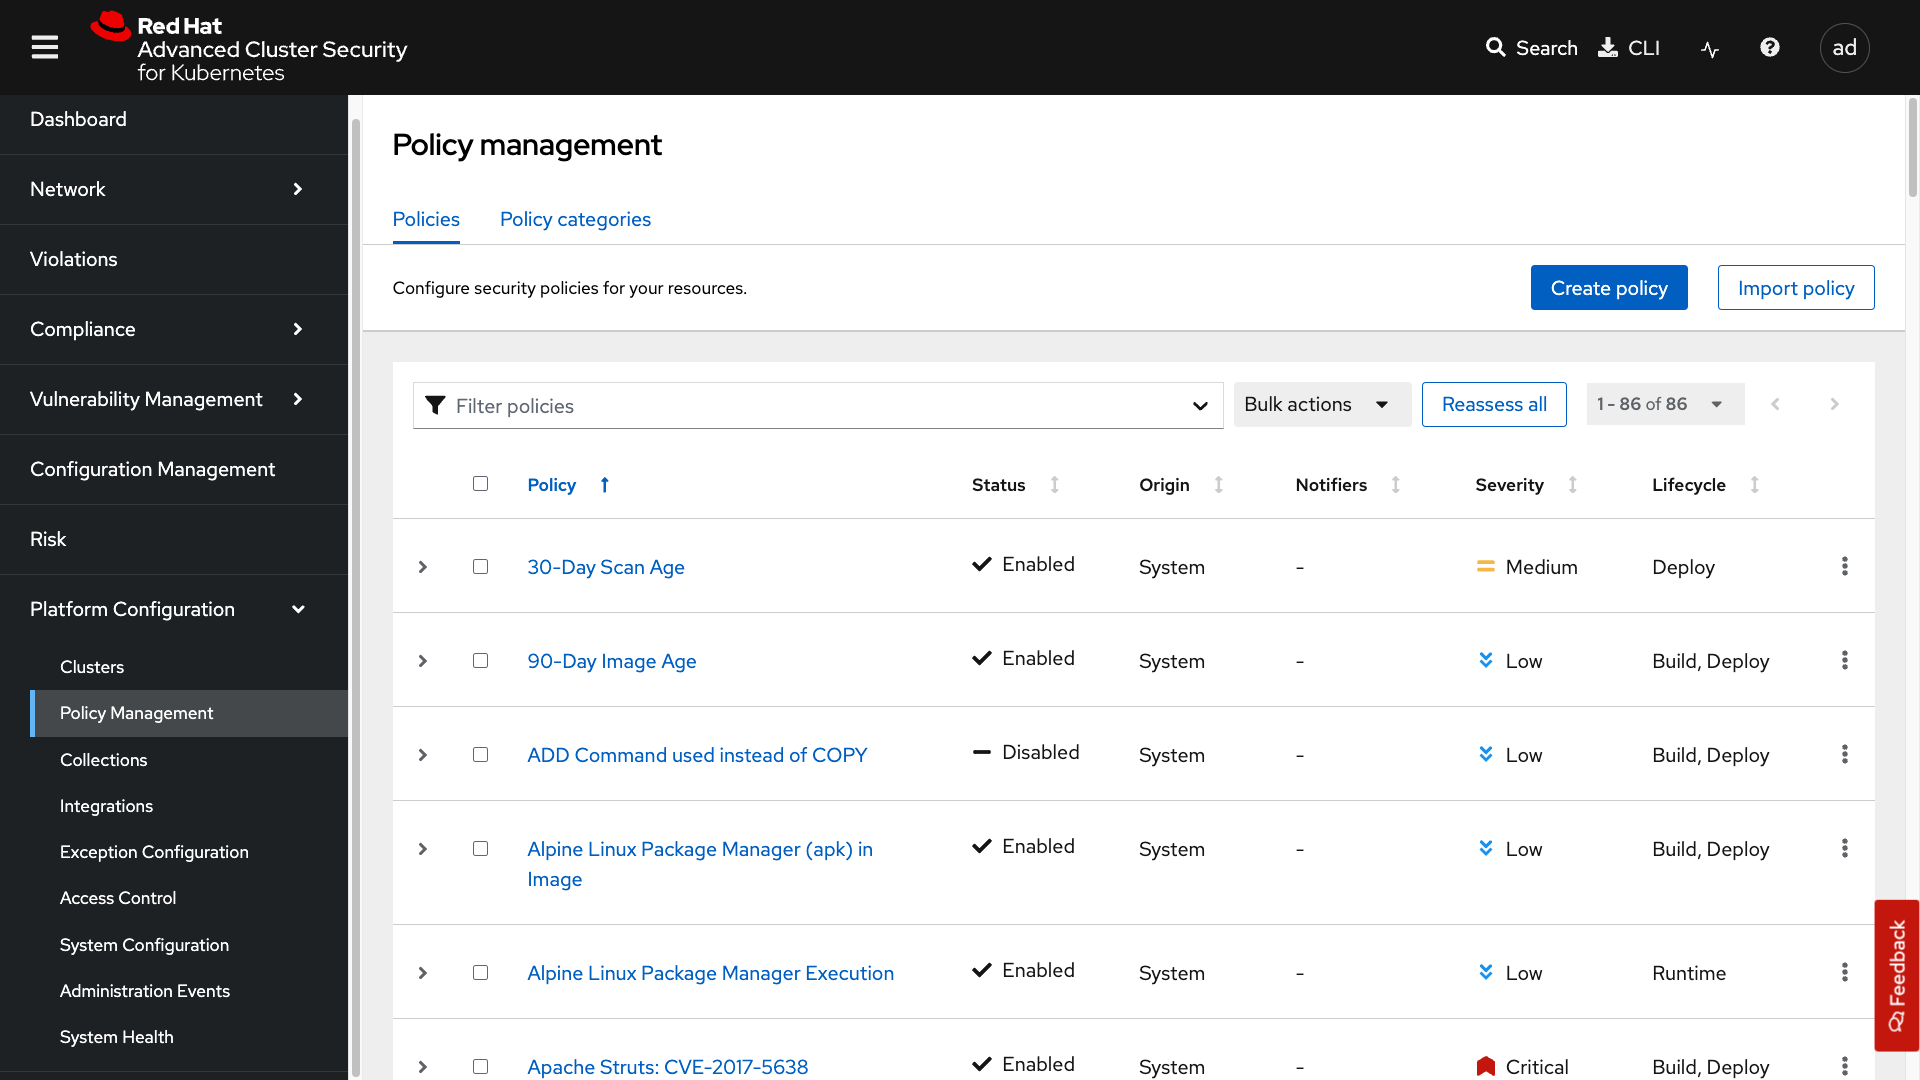
Policy Management
The policy management tab is where you manage well… all of your policies. Many default policies are built into ACS, but this is where you will clone, edit, and create all of your policies via the UI.
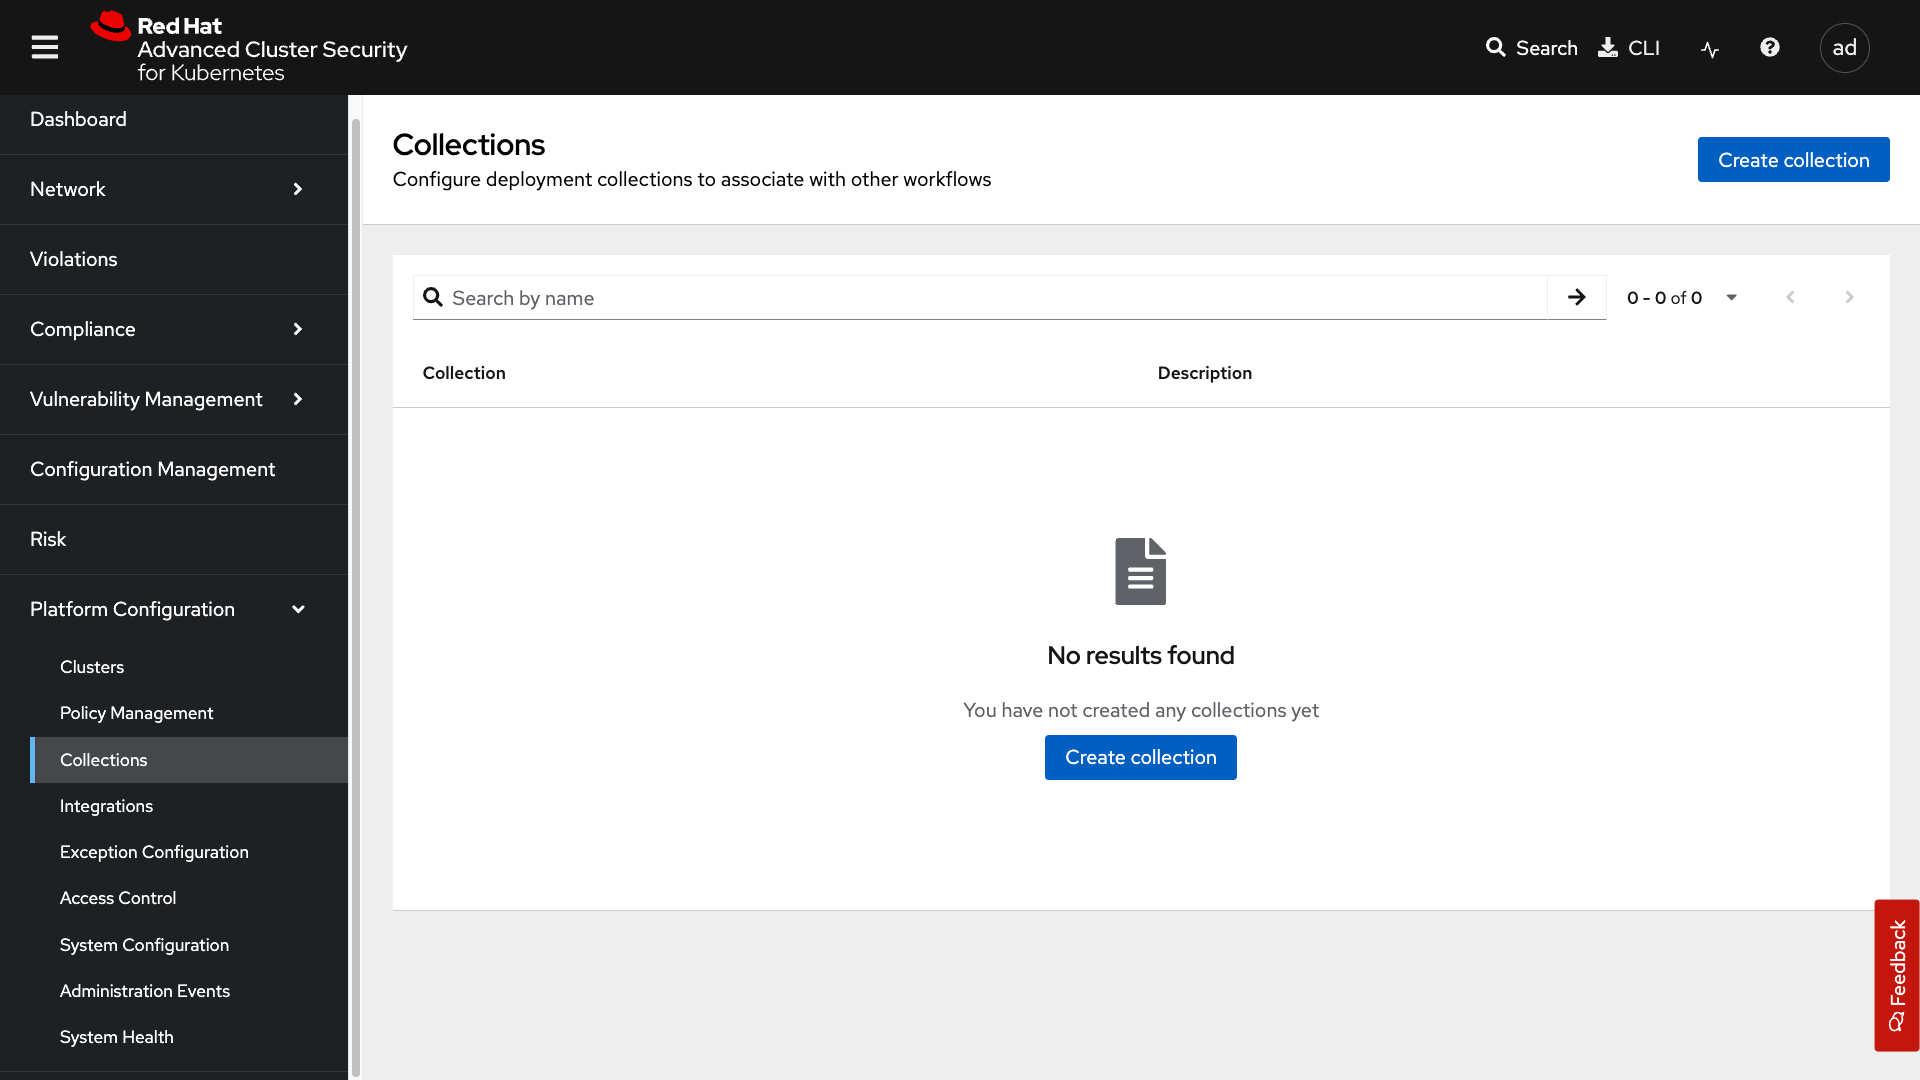
Collections
In the collections tab, you can configure deployment collections to associate with other workflows to create a collection and then apply a policy directly to that collection of containers/deployments/clusters. This workflow and this tab will help you scale and manage your policies across clusters, groups, regions, or whatever it is you’re seeking to apply specific policy, reporting, and compliance standards to.
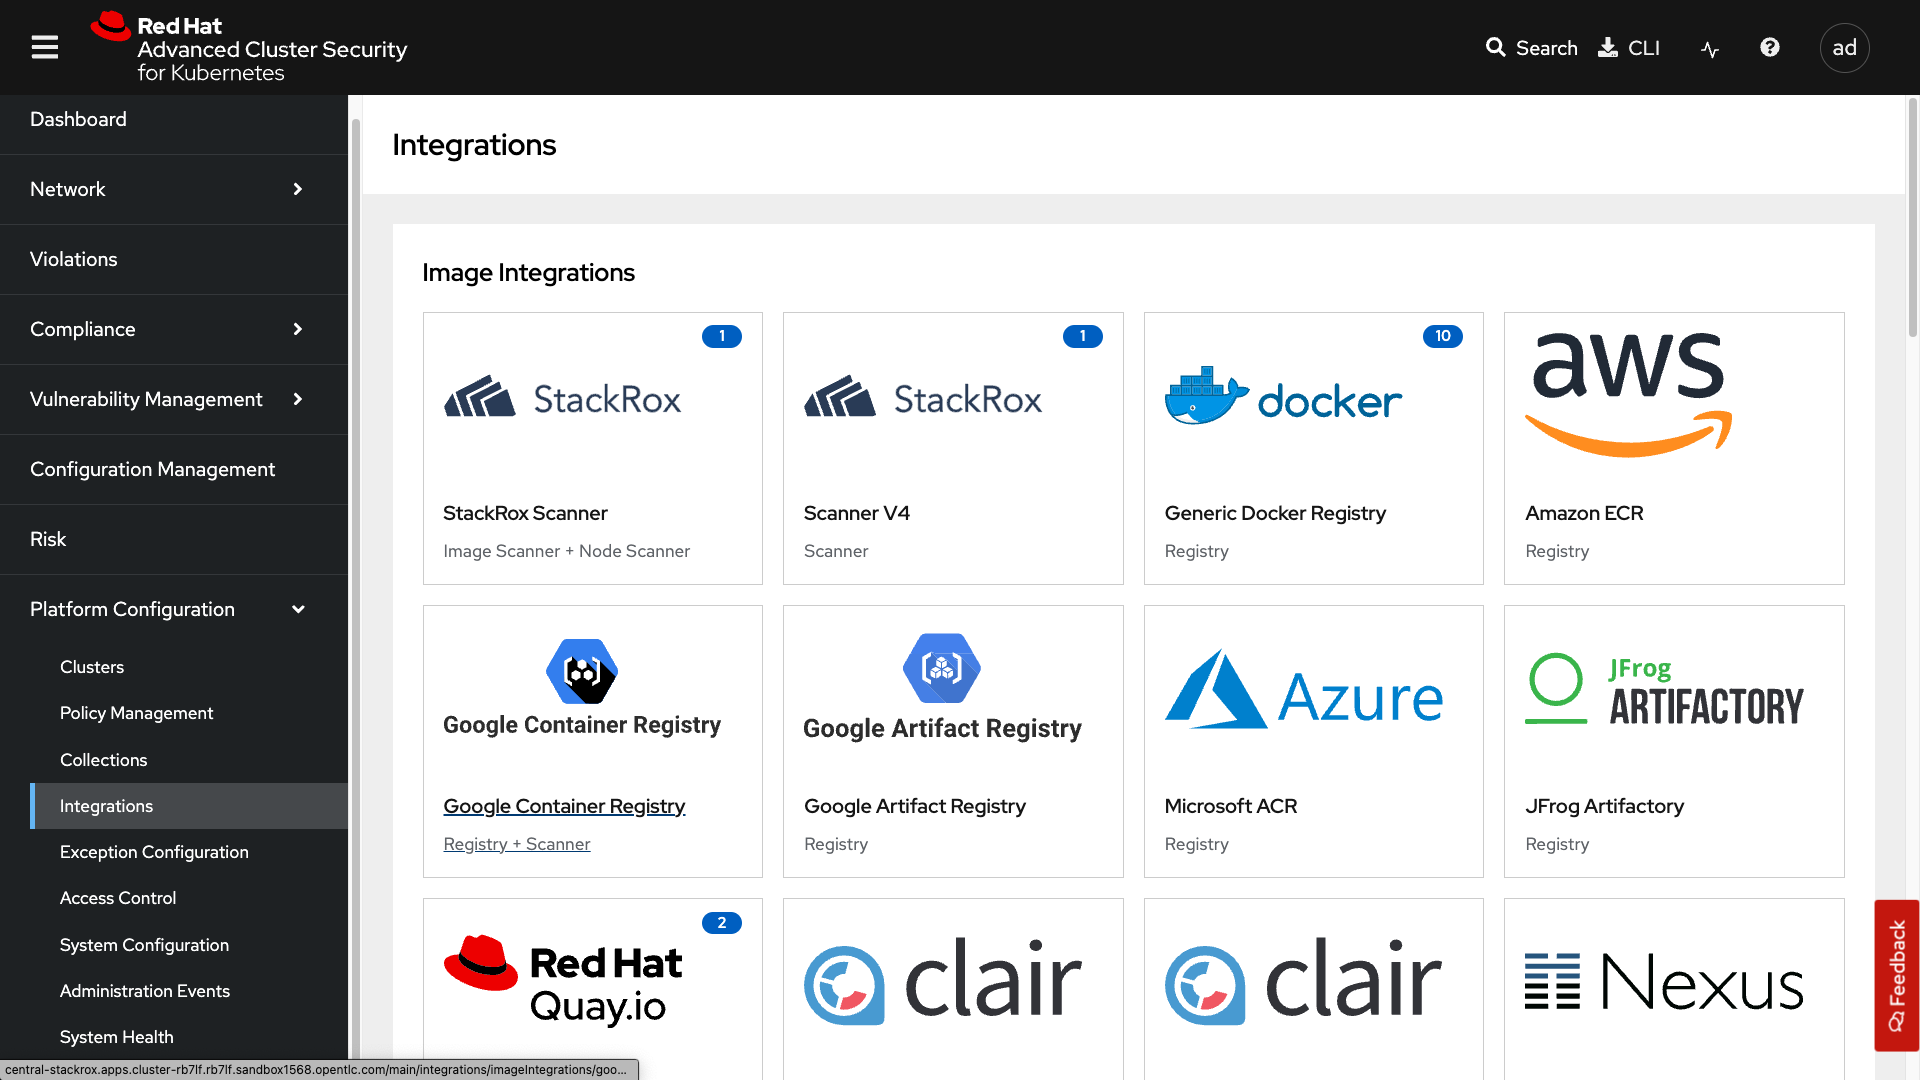
Integrations
The integration tab holds all of your options for: - Image integration - Signature integrations - Notifier integrations - Backup integrations - Cloud source integrations - And authentication tokens
Access Control
The access control tab is where you set up your authentication providers and the roles that you would like to have in ACS, along with permission sets and access scopes.
System Configuration
The system configuration tab manages things like private data retention, configuration, cluster deletion, public configuration, and all of these settings are editable.
Administration Events
The administration events tab is handy for troubleshooting platform issues by reviewing event logs. Now, these logs are purged after four days by default, but you can change that in the system configuration tab. We will have a whole section on the administration events later, but it is beneficial for diagnosing issues and looking into domains such as authentication, image scanning, integrations, and more.
Throw Up a Bat Signal!
Let us know you’re done by running the following command:
curl --insecure -X POST https://${ROX_CENTRAL_ADDRESS}/v1/policies \
-H "Authorization: Bearer ${ROX_API_TOKEN}" \
-H "Content-Type: application/json" \
-d '{
  "apiVersion": "rhacs.stackrox.io/v1",
  "kind": "Policy",
  "name": "finished-1-policy",
  "description": "",
  "rationale": "",
  "remediation": "",
  "disabled": true,
  "categories": [
    "Vulnerability Management"
  ],
  "lifecycleStages": ["BUILD"],
  "eventSource": "NOT_APPLICABLE",
  "exclusions": [],
  "scope": [],
  "severity": "LOW_SEVERITY",
  "enforcementActions": [],
  "notifiers": [],
  "policyVersion": "1.1",
  "policySections": [
    {
      "sectionName": "Rule 1",
      "policyGroups": [
        {
          "fieldName": "Image Tag",
          "booleanOperator": "OR",
          "negate": false,
          "values": [
            {
              "value": "done-1"
            }
          ]
        }
      ]
    }
  ],
  "mitreAttackVectors": [],
  "criteriaLocked": false,
  "mitreVectorsLocked": false,
  "isDefault": false,
  "source": "IMPERATIVE"
}'