Logging
OpenShift provides some convenient mechanisms for viewing application logs. First and foremost is the ability to examine a Pod's logs directly from the web console or via the command line.
Background: Container Logs
OpenShift expects containers to log all information to STDOUT. In this way, both regular and error information is
captured via standardized mechanisms. When exploring the Pod's logs
directly, you are essentially going through the container runtime to access the
container’s logs, through OpenShift’s API.
|
In some cases, applications may not have been designed to send all of their
information to |
Exercise: Examining Logs
Since you already deployed your application, you can examine its
logs. In the Topology view, click the parksmap entry and then the Resources tab. You should see a View Logs link next to the Pod entry.
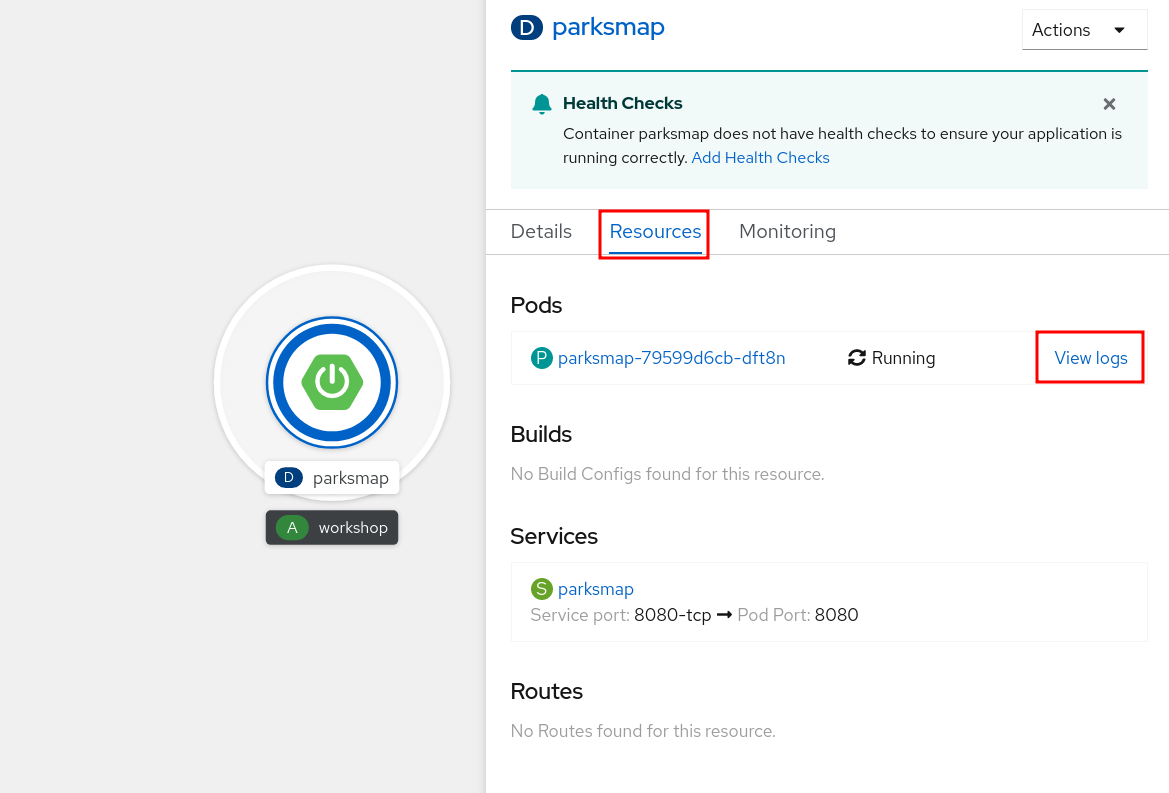
Click the View Logs link to view the Pod's logs:
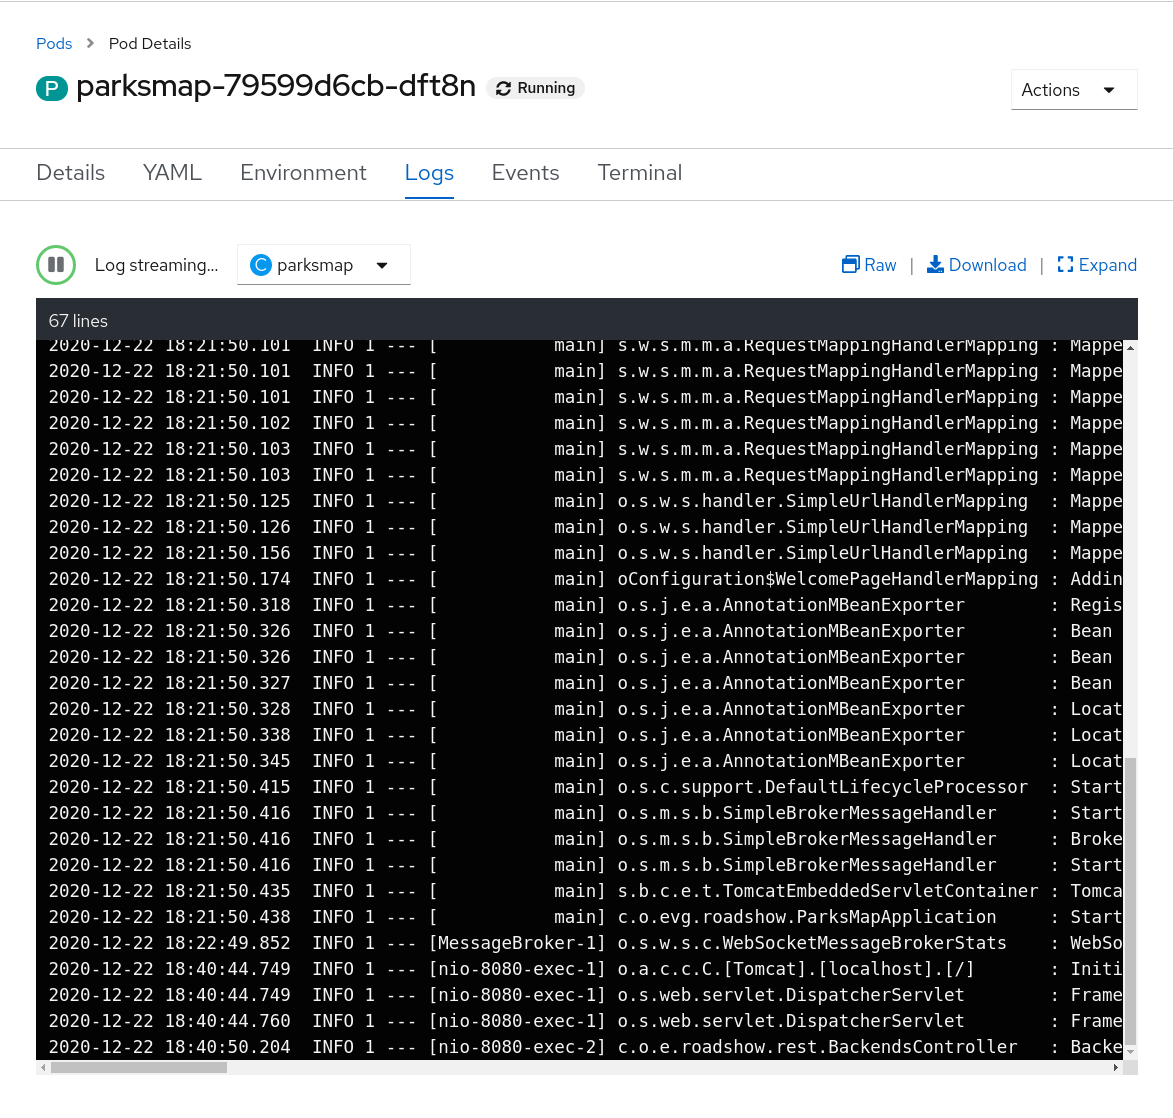
| If you notice some errors in the log, that’s okay. You’ll remedy those shortly. |
You also have the option of viewing logs from the command line. Use the oc logs command, and pass a label selector to view logs from all Pods that match the selector:
oc logs -l app=parksmapYou will see the application logs displayed:
2019-05-22 19:37:01.433  INFO 1 --- [           main] o.s.m.s.b.SimpleBrokerMessageHandler     : Started.
2019-05-22 19:37:01.465  INFO 1 --- [           main] s.b.c.e.t.TomcatEmbeddedServletContainer : Tomcat started on port(s): 8080 (http)
2019-05-22 19:37:01.468  INFO 1 --- [           main] c.o.evg.roadshow.ParksMapApplication     : Started ParksMapApplication in 3.97 seconds (JVM running
 for 4.418)
2019-05-22 19:38:00.762  INFO 1 --- [MessageBroker-1] o.s.w.s.c.WebSocketMessageBrokerStats    : WebSocketSession[0 current WS(0)-HttpStream(0)-HttpPoll(
0), 0 total, 0 closed abnormally (0 connect failure, 0 send limit, 0 transport error)], stompSubProtocol[processed CONNECT(0)-CONNECTED(0)-DISCONNECT(0)]
, stompBrokerRelay[null], inboundChannel[pool size = 0, active threads = 0, queued tasks = 0, completed tasks = 0], outboundChannel[pool size = 0, active
 threads = 0, queued tasks = 0, completed tasks = 0], sockJsScheduler[pool size = 1, active threads = 1, queued tasks = 0, completed tasks = 0]
2019-05-22 19:44:11.517  INFO 1 --- [nio-8080-exec-1] o.a.c.c.C.[Tomcat].[localhost].[/]       : Initializing Spring FrameworkServlet 'dispatcherServlet'
2019-05-22 19:44:11.517  INFO 1 --- [nio-8080-exec-1] o.s.web.servlet.DispatcherServlet        : FrameworkServlet 'dispatcherServlet': initialization sta
rted
2019-05-22 19:44:11.533  INFO 1 --- [nio-8080-exec-1] o.s.web.servlet.DispatcherServlet        : FrameworkServlet 'dispatcherServlet': initialization com
pleted in 16 ms
2019-05-22 19:44:13.395 INFO 1 --- [nio-8080-exec-2] c.o.e.roadshow.rest.BackendsController : Backends: getAll| If you scroll through the logs, you may notice an error that mentions a service account. What’s that? Don’t worry, you’ll learn about that shortly. |