2.3 Verifying the Mock API
With the mock API deployed, you will now send HTTP requests to two of its endpoints to confirm the service is reachable and returning data correctly. You will use the standalone Terminal provided in this workshop — accessible from the tabs on the right-hand side of this guide.
|
The mock API is exposed internally within the cluster via a Kubernetes |
Accessing the Terminal
-
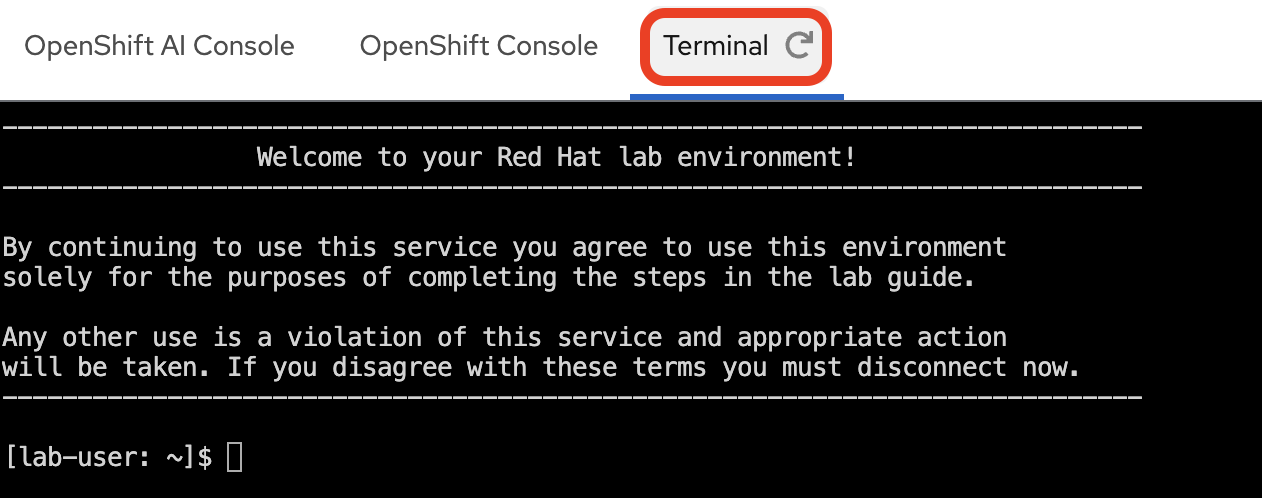
Select the Terminal tab at the top of the right-hand panel of this workshop guide.
-
If you have not already logged in during a previous section, log in to the OpenShift Container Platform cluster with your provided credentials:
oc login --insecure-skip-tls-verify=false -u userX -p openshift https://api.MYCLUSTER.com:6443"When prompted, answer
yto accept the insecure connection:The server uses a certificate signed by an unknown authority. You can bypass the certificate check, but any data you send to the server could be intercepted by others. Use insecure connections? (y/n): y WARNING: Using insecure TLS client config. Setting this option is not supported! Login successful. You have one project on this server: "user1" Using project "user1". Welcome! See 'oc help' to get started.You should see your project
userXwhich has been pre-created for you. If the active project is different, switch to it with:oc project userX
Testing the API Endpoints
You will probe two endpoints to validate the service:
| Endpoint | Path | Purpose |
|---|---|---|
Health check |
|
Confirms the API process is up and accepting connections |
Incident data |
|
Returns mock ITSM ticket records — the same data your pipeline will ingest |
Health Check
Run the following command in the Terminal to query the health endpoint. This uses oc exec to run curl inside the mock API pod itself.
oc exec deploy/mock-servicenow-api -n userX -- curl -s http://localhost:8080/api/v1/healthYou should see the following JSON response, confirming the API is up and running:
{"status":"UP"}|
If the command returns an error, the pod may still be initializing.
Wait 30 seconds and re-run the command, then verify the |
Fetching Incident Data
Query the incidents endpoint, filtering for closed tickets and limiting the response to two records.
The output is piped through jq to pretty-print the JSON structure.
oc exec deploy/mock-servicenow-api -n userX -- curl -s 'http://localhost:8080/api/v1/incidents?state=closed&limit=2' | jq
state=closed and limit=2 are query parameters accepted by the mock API. Your Kubeflow Pipeline will call this same endpoint — without the limit parameter — to retrieve all closed incidents for embedding and ingestion into Milvus.
|
The response should be a JSON object with a result array containing two incident records, along with pagination metadata.
{
  "result": [
    {
      "assignment_group": "Network Support",
      "caller_id": "abel.tuter@example.com",
      "category": "Hardware",
      "closed_at": "...",
      "cmdb_ci": "email-server-01",
      "description": "Users reported being unable to send or receive emails...",
      "number": "INC001001",
      "opened_at": "...",
      "priority": "1 - Critical",
      "resolution_code": "Solved (Workaround)",
      "resolution_notes": "The primary email server's main network interface card (NIC) failed...",
      "resolved_by": "network.admin",
      "short_description": "Email server unresponsive",
      "state": "Closed",
      "subcategory": "Server",
      "updated_by": "system.auto_close",
      "updated_on": "..."
    },
    {
      "assignment_group": "Hardware Support",
      "caller_id": "george.bailey@example.com",
      "category": "Hardware",
      "closed_at": "...",
      "cmdb_ci": "PRN-FIN-01",
      "description": "The finance department printer, PRN-FIN-01, has been experiencing frequent paper jams today...",
      "number": "INC001005",
      "opened_at": "...",
      "priority": "3 - Moderate",
      "resolution_code": "Solved (Hardware Replacement)",
      "resolution_notes": "Technician dispatched to inspect PRN-FIN-01...",
      "resolved_by": "tech.support",
      "short_description": "Printer 'PRN-FIN-01' jamming frequently",
      "state": "Closed",
      "subcategory": "Printer",
      "updated_by": "tech.support",
      "updated_on": "..."
    }
  ],
  "total_records": 4,
  "limit": 2,
  "offset": 0
}|
Notice the |
With both endpoints confirmed, the mock API is fully operational. You are now ready to deploy the Milvus vector database.
Summary
-
Hit the health and incidents endpoints via
oc execto validate the mock API -
Inspected the JSON response structure — each incident carries a description and resolution that the pipeline will embed as vectors
-
Confirmed the data source is serving all four closed incidents that will populate the Milvus collection