2.7 Monitoring the Pipeline Run
After starting the pipeline run in the previous step, you were automatically taken to the run’s real-time graph view. This interface is where you can monitor the progress of each component in your pipeline.
The Run Graph View
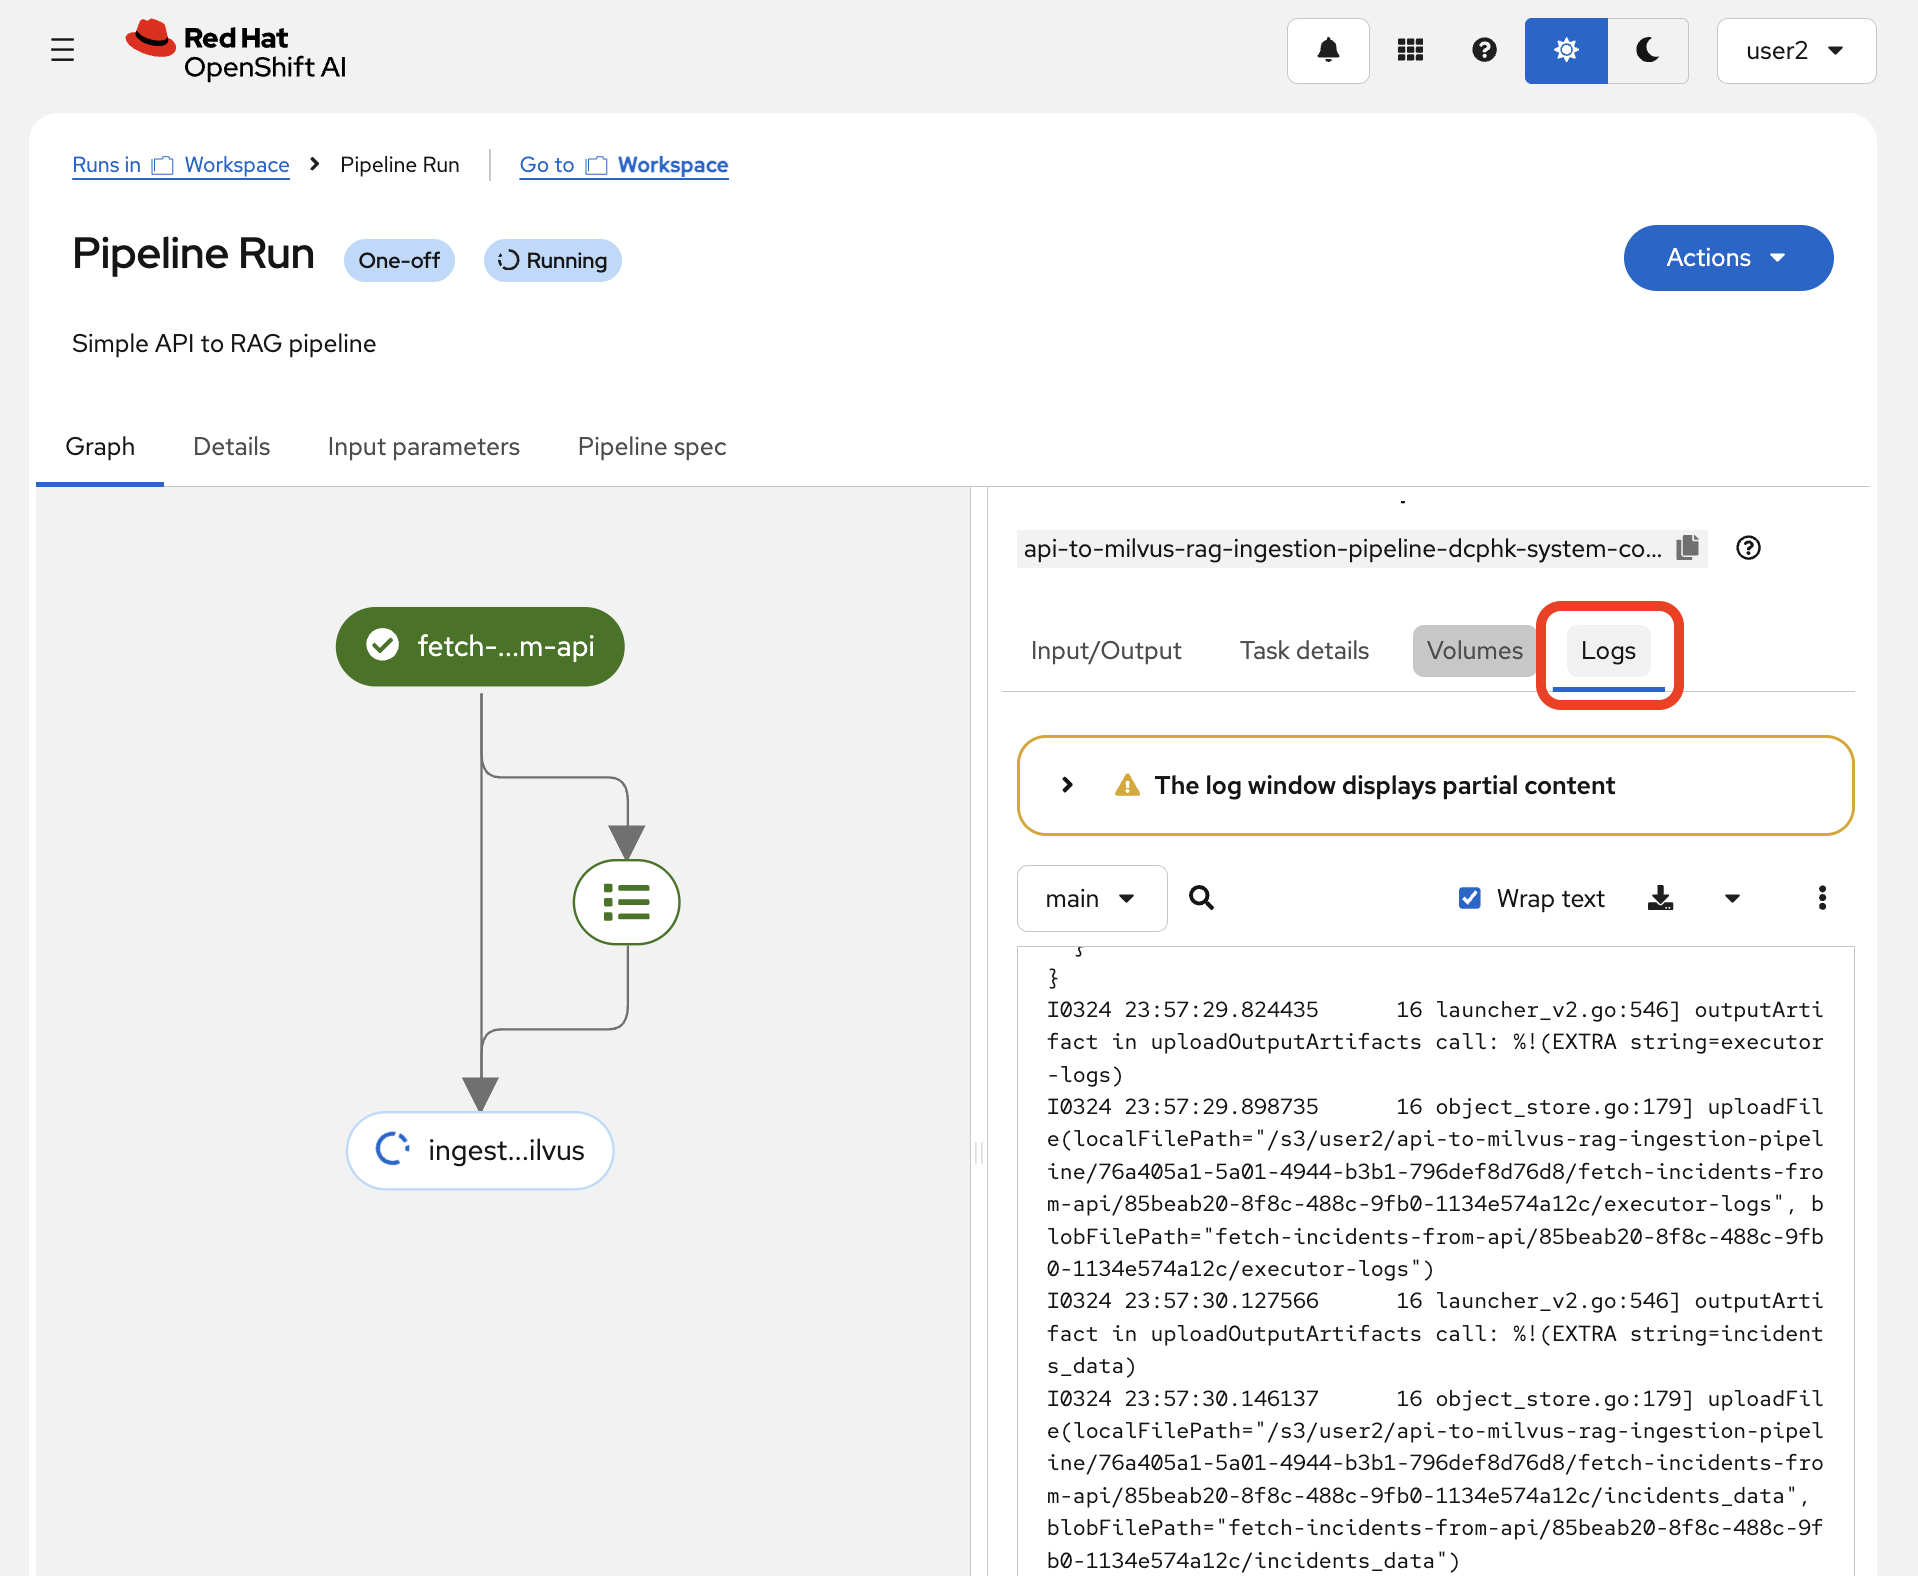
The graph provides a live visualization of your pipeline’s execution. Each box represents a component (a "task") in your pipeline.
-
Blue (Running): A component with a blue spinning icon is currently executing.
-
Green (Succeeded): A component with a green checkmark has completed successfully.
-
Red (Failed): If a component encounters an error, it will turn red with an exclamation mark.
Initially, you will see the fetch-data-from-api component in a running state.

Inspecting Component Logs
You can dive into each component to see its logs and details. This is essential for debugging and understanding what the pipeline is doing.
-
Click on the
fetch-data-from-apicomponent in the graph. A side panel will open. -
Select the Logs tab. Here you can see the standard output from the component’s container. You should see log lines indicating that it is connecting to the mock API and fetching the incident data.
-
After the first component succeeds, the graph will update, and the
ingest-incidents-to-milvuscomponent will begin running. -
Click on the
ingest-incidents-to-milvuscomponent and view its Logs tab. You will see output indicating that it is:-
Connecting to the Milvus database.
-
Loading the sentence-transformer model to generate embeddings.
-
Inserting the incident data and their vector embeddings into the Milvus collection.

-
Verifying Successful Completion
The entire pipeline run should take a few minutes to complete. Once finished, both components in the graph will have green checkmarks, and the overall status of the run will be Succeeded.

Now that the data has been successfully processed and loaded into our vector database, we are ready to test the RAG system by querying it from a notebook.
Summary
-
Monitored the two-component pipeline graph in real time:
fetch-data-from-apicompleted, theningest-incidents-to-milvusran to completion -
Inspected per-component container logs to confirm the API returned data and the embeddings were inserted into Milvus
-
The vector database is now populated — five incident resolutions are stored as embeddings and ready for similarity search