Application Management Basics
Getting Started
Module Overview
Duration: 40 minutes
Format: Hands-on
Audience: Platform Engineers, Operations Teams
In this module, you’ll deploy an application, expose it to the outside world, scale it for capacity, see how OpenShift self-heals when things fail, and configure health checks. This is the core ops workflow for managing workloads on OpenShift.
Learning Objectives
By the end of this module, you will be able to:
-
Deploy an application from a container image
-
Expose it via a Route with TLS
-
Scale horizontally and observe the behaviour
-
Understand OpenShift self-healing (pod recreation)
-
Configure liveness and readiness probes
-
Use PodDisruptionBudgets to protect availability during maintenance
Deploy & Inspect
Deploy an Application
Create a project and deploy a web server:
oc new-project app-managementNow deploy the WeatherNow application using the OpenShift Console. WeatherNow is a simple httpd-based container used as a test workload throughout the ops track.
-
In the top-right corner of the console, click the + (Add) button and select Container images:
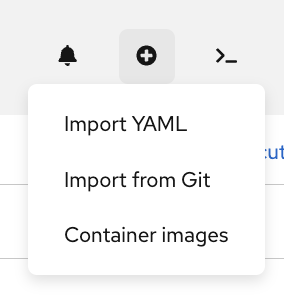
-
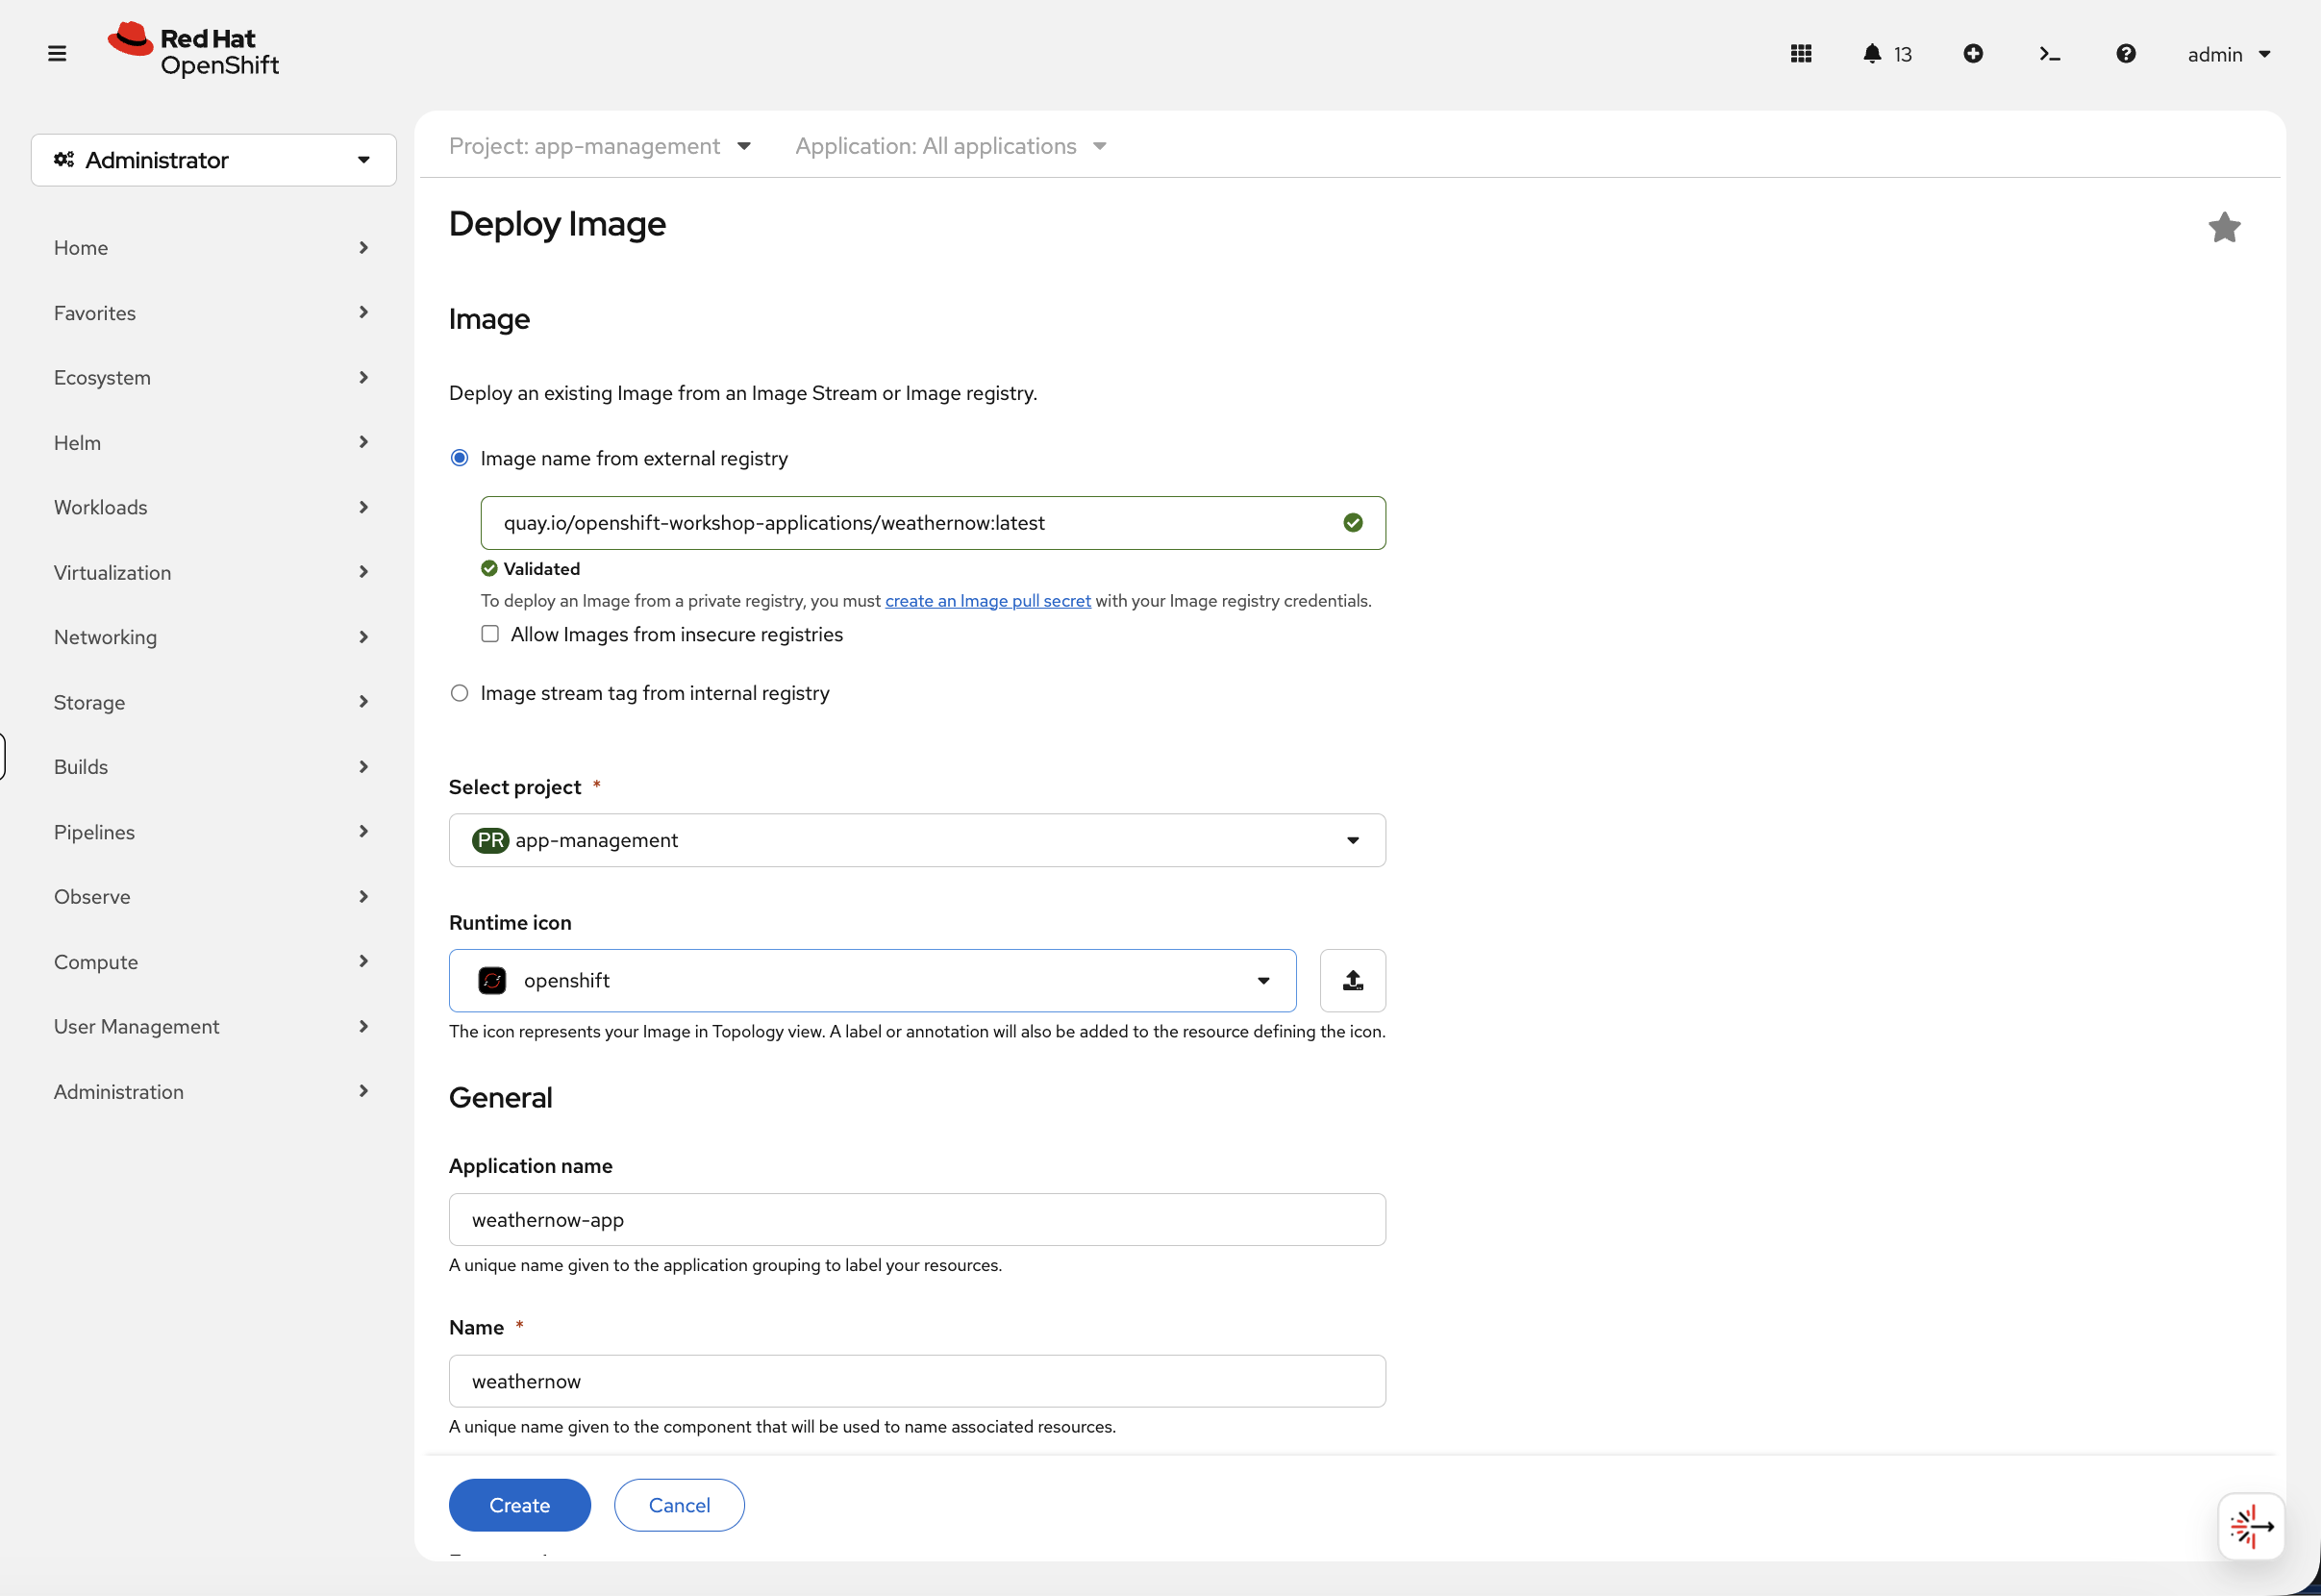
In the Deploy Image form:
-
Select Image name from external registry and enter:
quay.io/openshift-workshop-applications/weathernow:latest -
Wait for the image to show Validated
-
Ensure Select project is set to
app-management -
Set the Name to
weathernow -
Scroll down and uncheck the Create a route checkbox. OpenShift can create a route for you automatically, but we want to do it ourselves so you understand how routing works.

-
Click Create
-
This creates two resources:
-
Deployment - defines what container to run and how many replicas
-
Service - internal load balancer that routes traffic to the pods
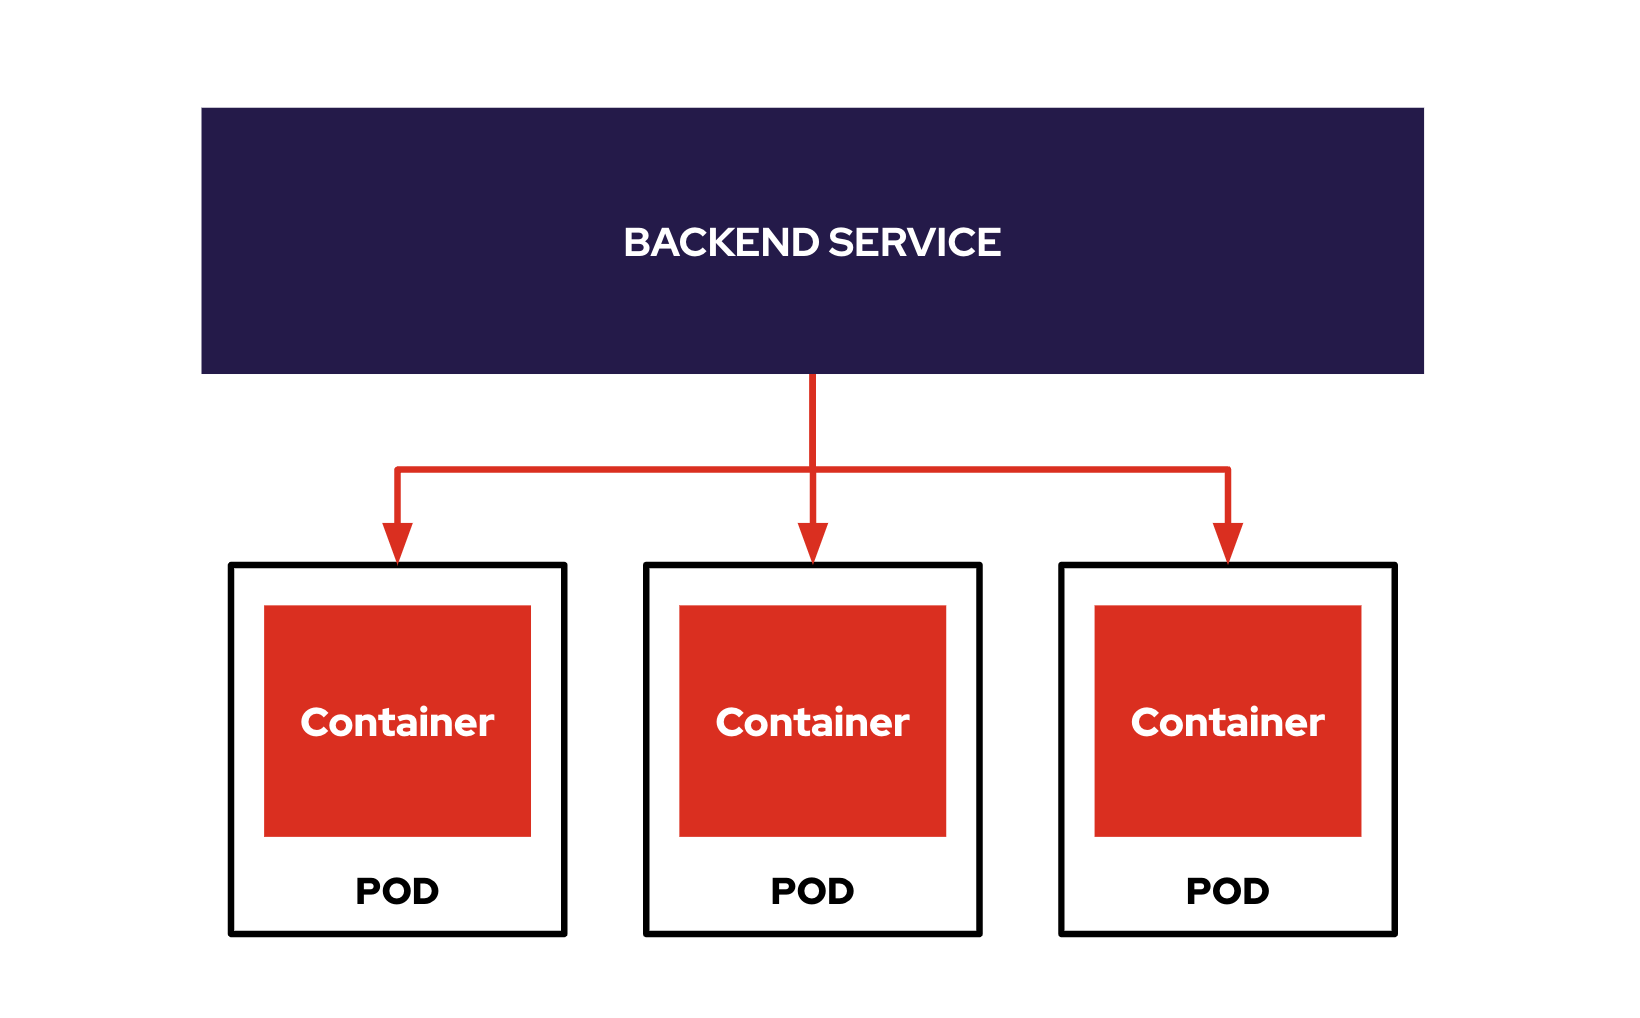
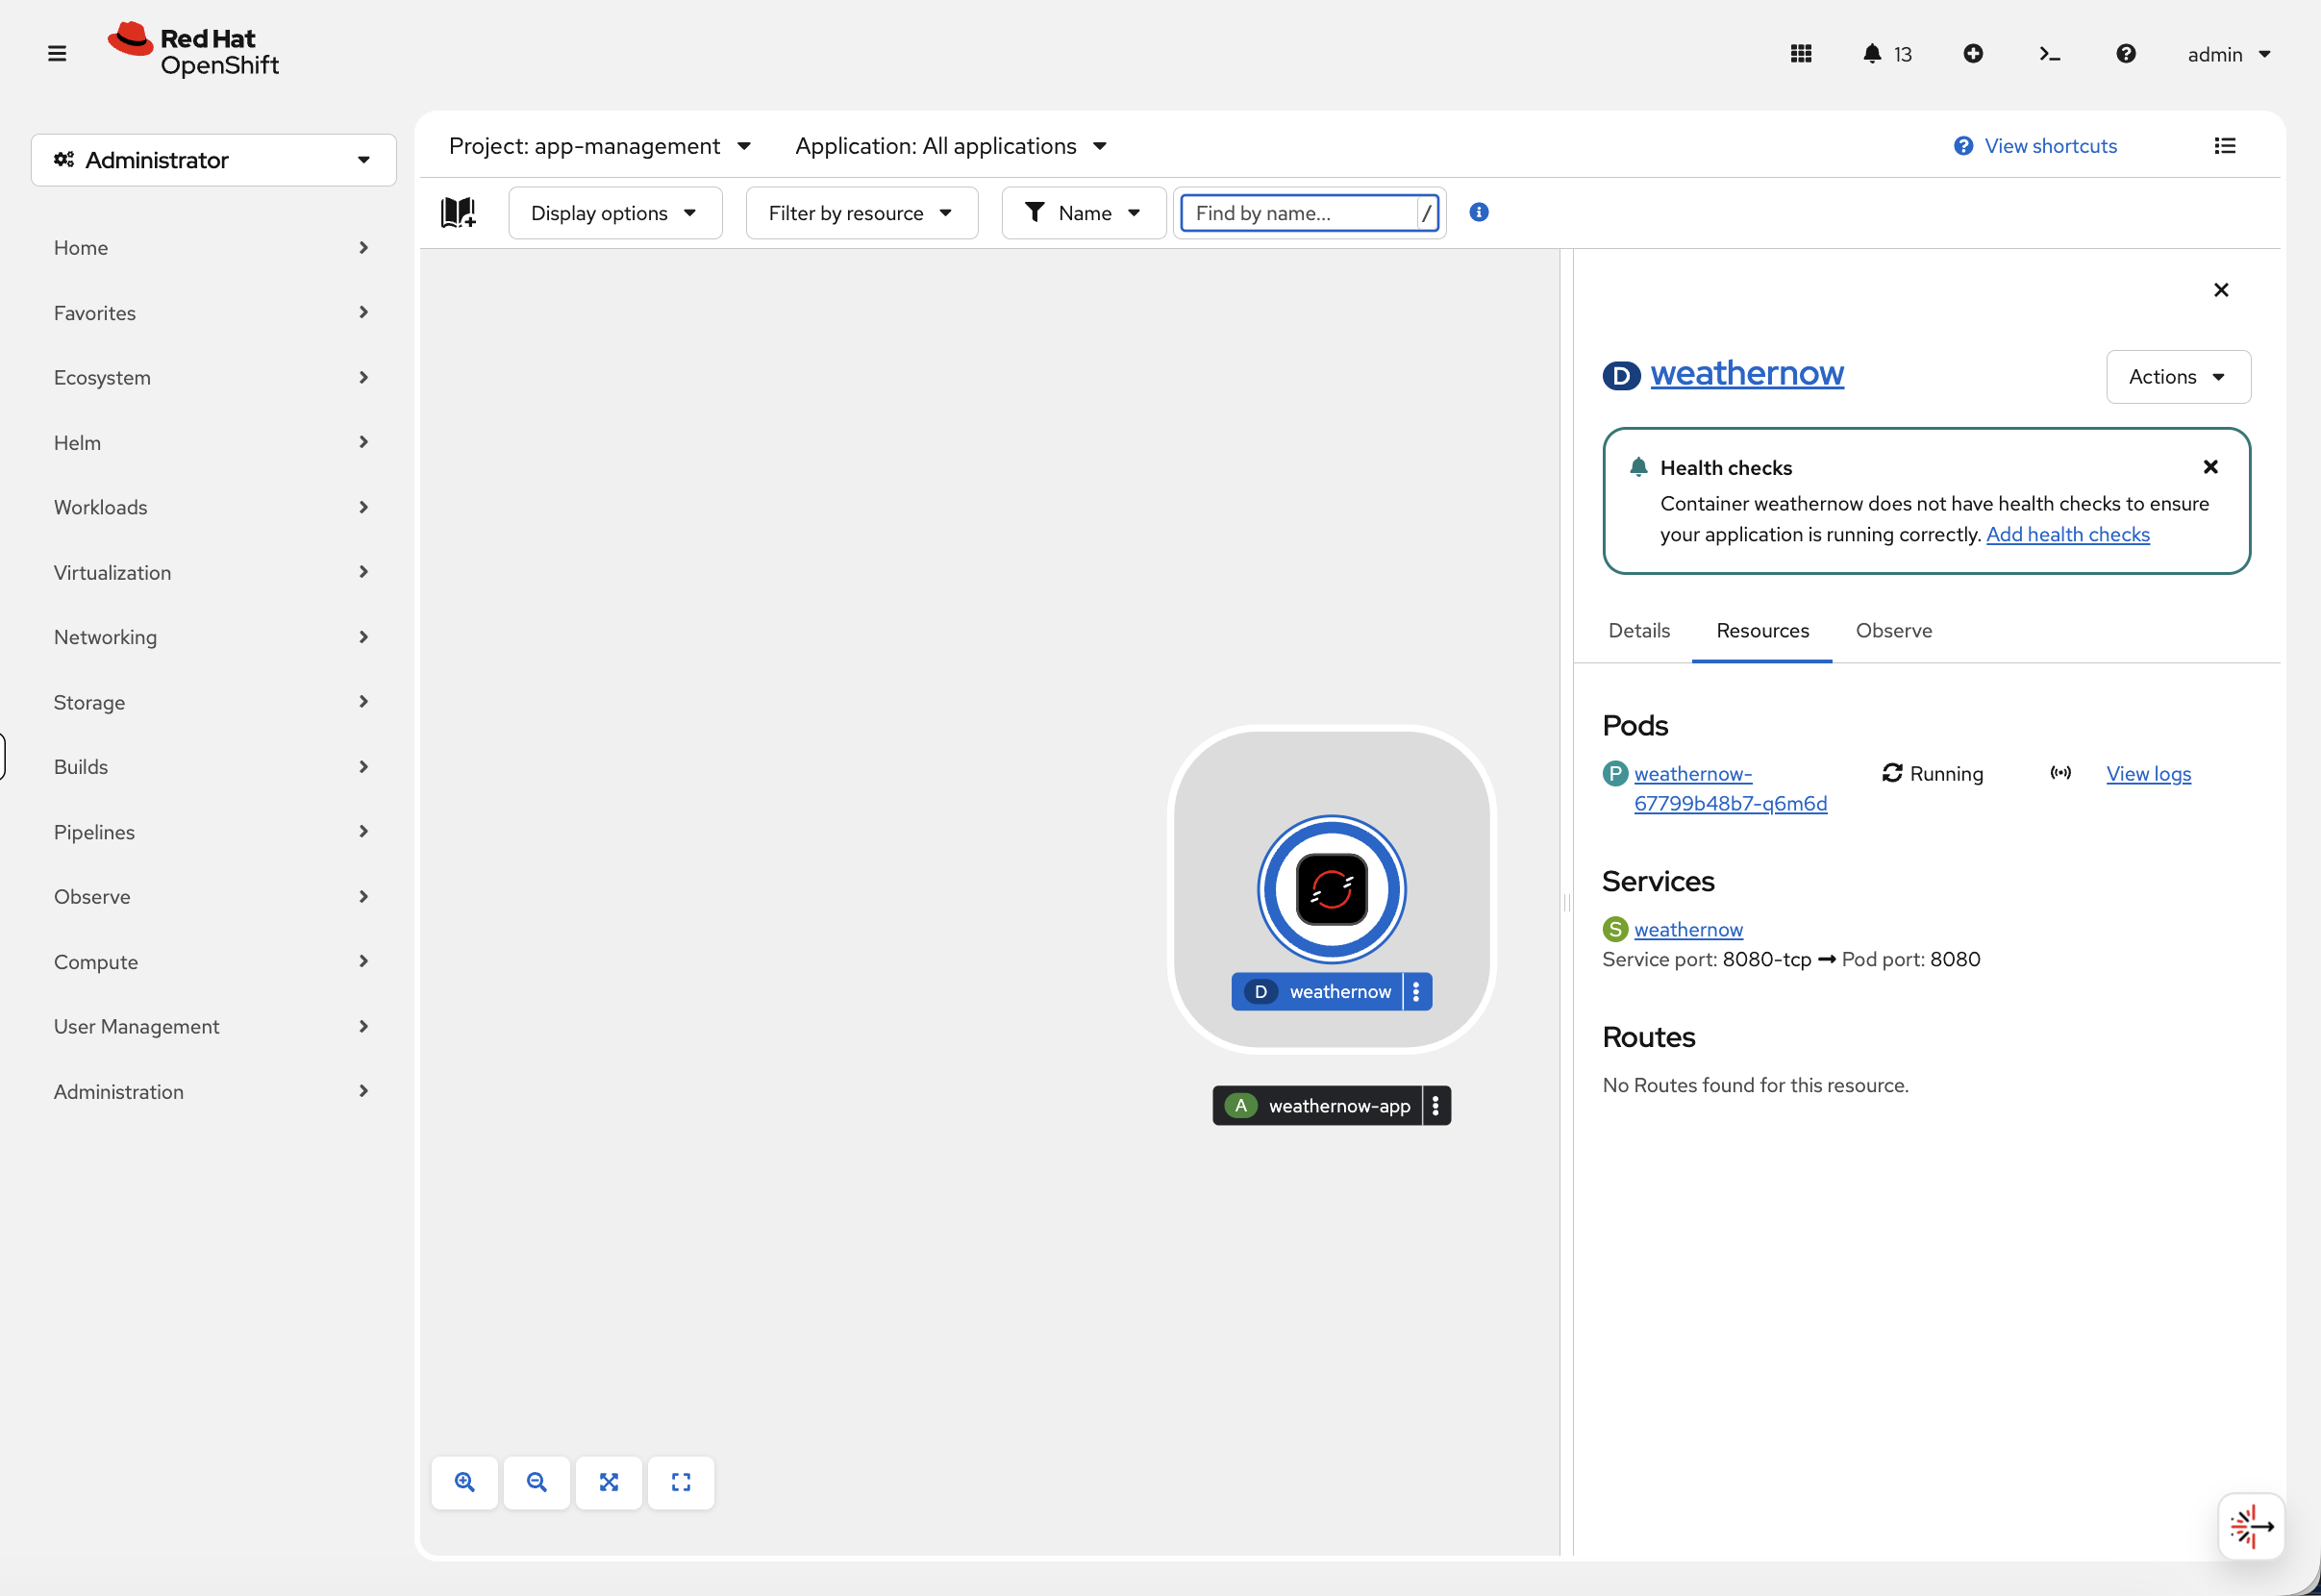
You’ll be taken to the Topology view. Notice the pod is running and the service is created, but under Routes it says "No Routes found for this resource" - the application isn’t accessible from outside the cluster yet.
Now switch to the terminal to see the same information via CLI:
oc get pods -n app-managementYou should see one pod in Running status - the same pod you just saw in the Topology view.
Inspect Your Application
Before moving on, get familiar with the two most important diagnostic commands. These work on any pod in any namespace. The console’s pod detail view (click any pod name) shows the same information across the Details, Events, and Logs tabs - the console log viewer supports real-time streaming, text search, and downloading.
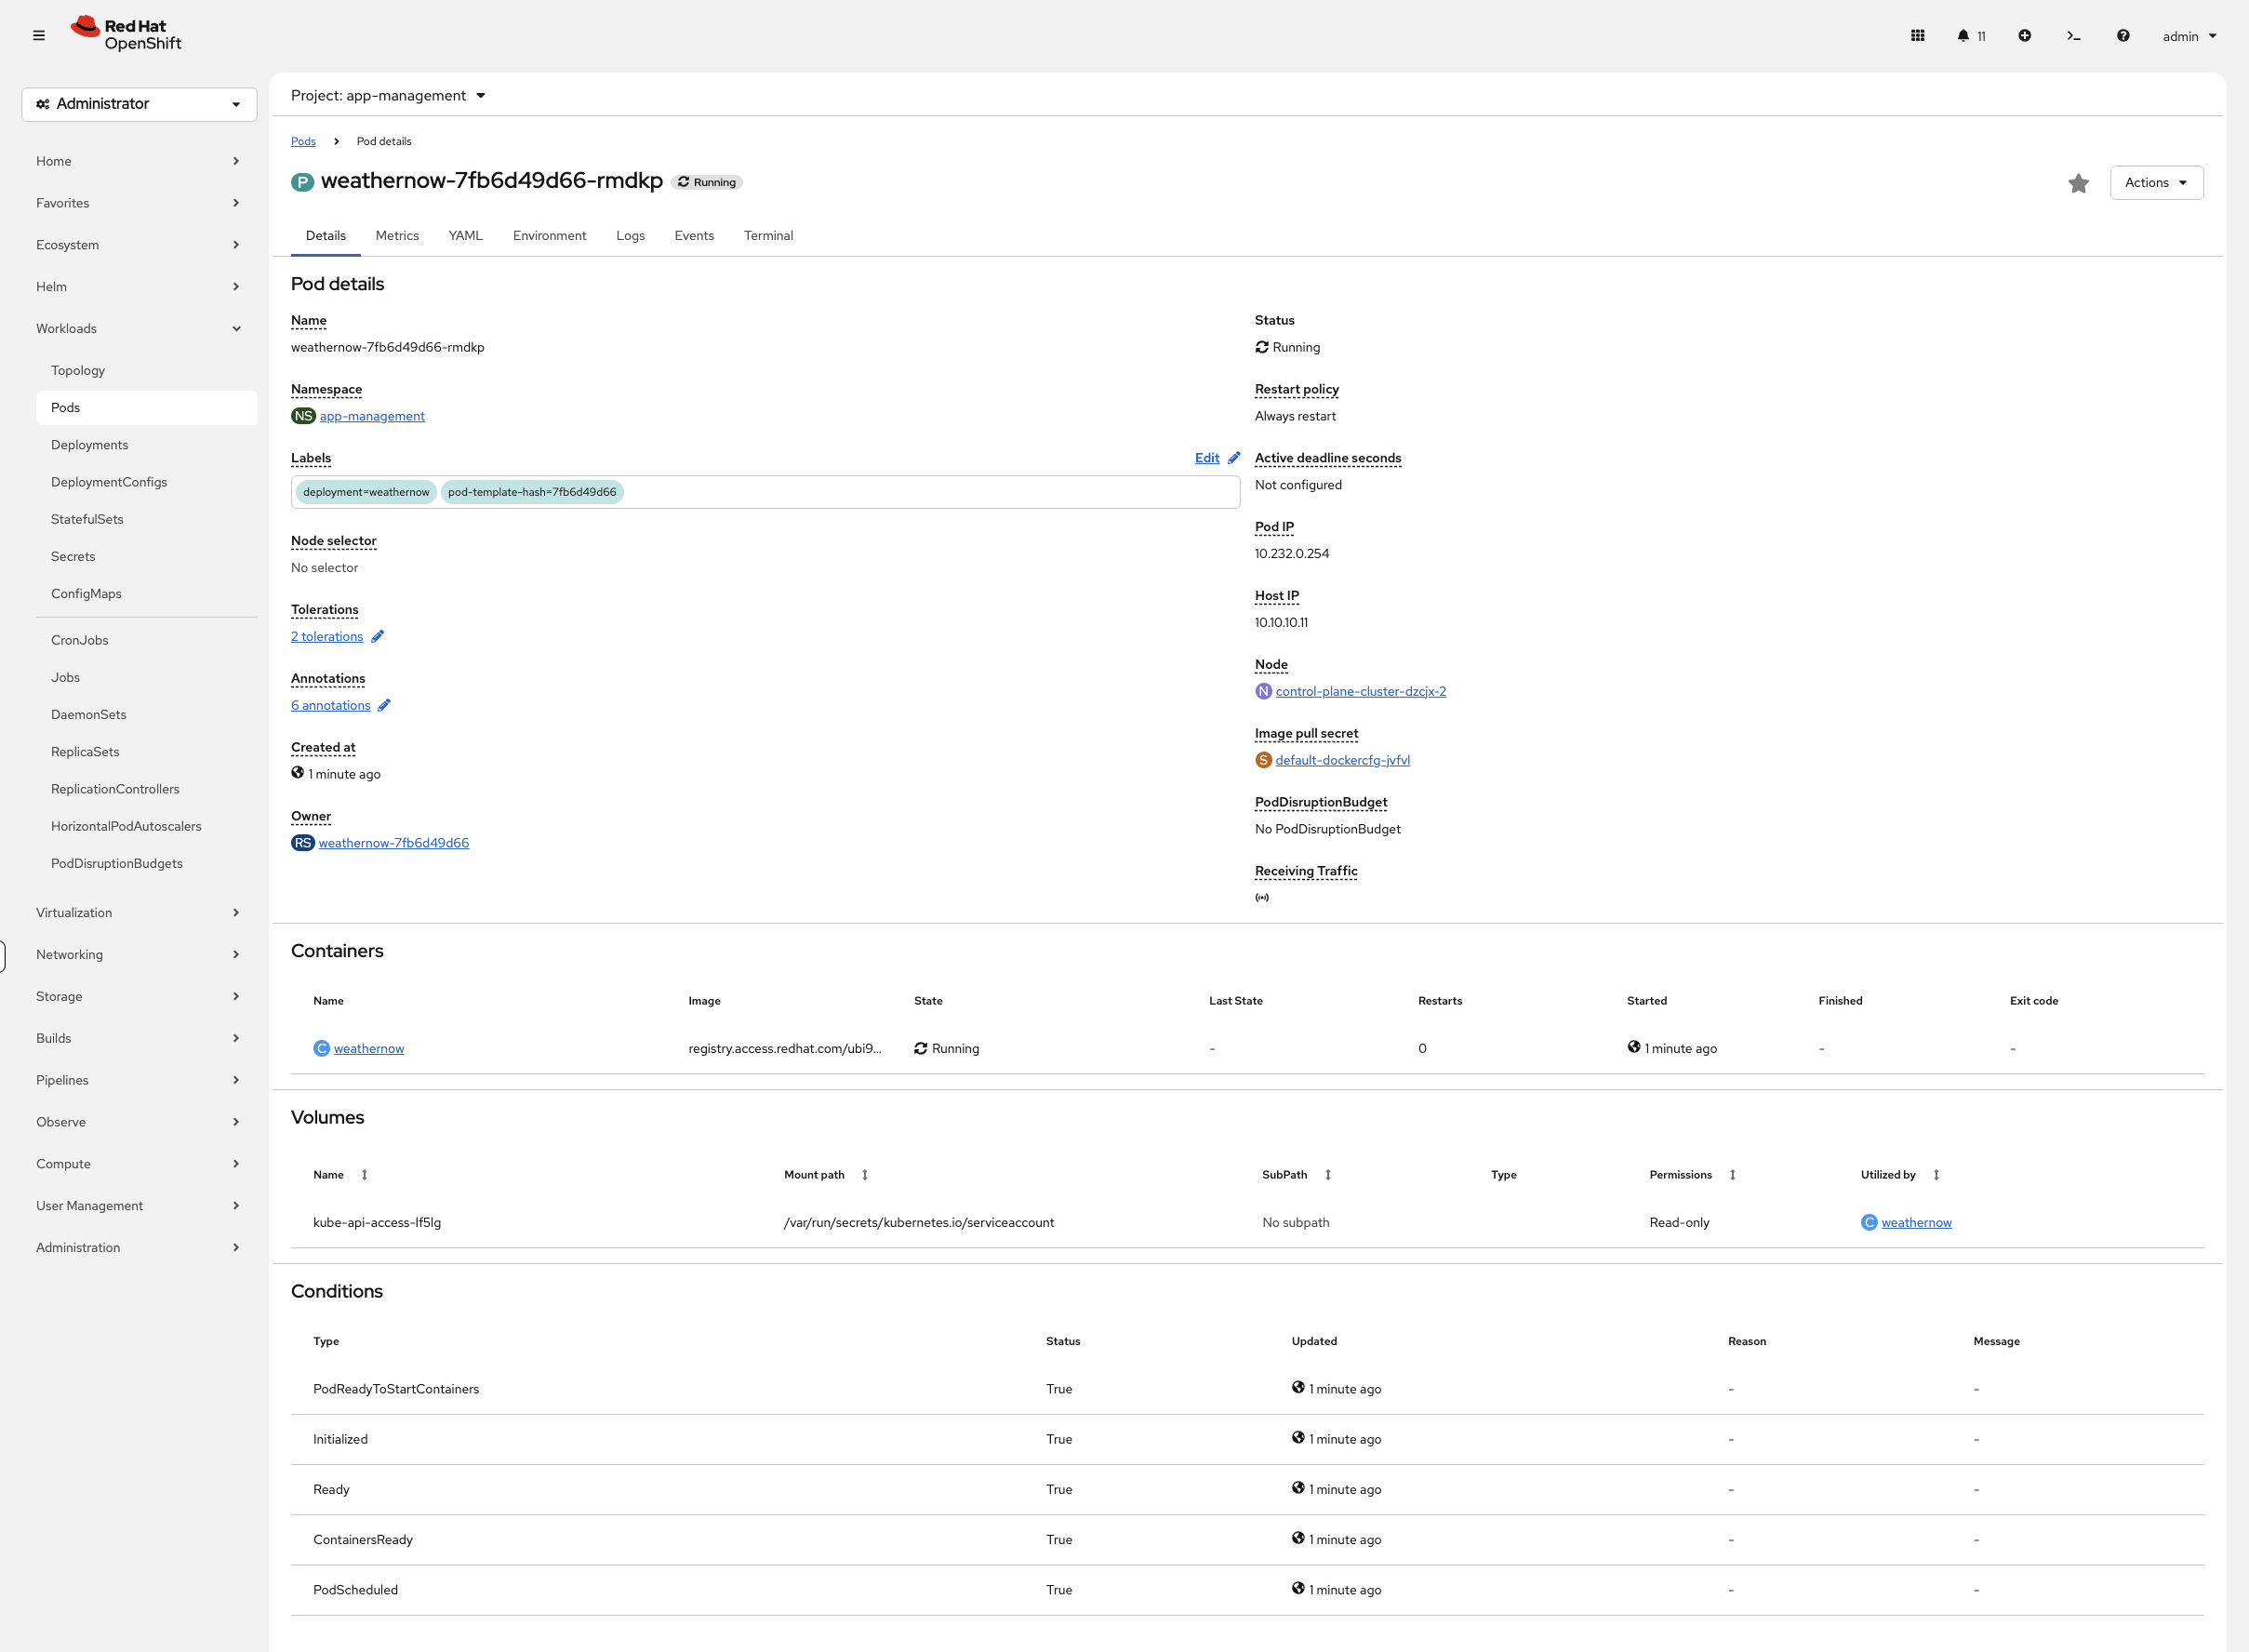
Get detailed information about a pod - events, node placement, container status:
oc describe pod $(oc get pods -n app-management -o jsonpath='{.items[0].metadata.name}') -n app-management | tail -15The Events section at the bottom shows exactly what happened: image pulled, container created, pod scheduled to a specific node.
Check the container’s logs:
oc logs $(oc get pods -n app-management -o jsonpath='{.items[0].metadata.name}') -n app-management | head -5If the container were crashing, the logs would tell you why. Use --previous to see logs from the last crash.
Check the service:
oc get svc -n app-managementThe service has a ClusterIP - this is only reachable from inside the cluster. To expose it externally, we need a Route.
You can also see this in the console at Networking > Services (project: app-management) - click weathernow to see the service details, endpoints, and backing pods.
|
Expose & Scale
Create a Route
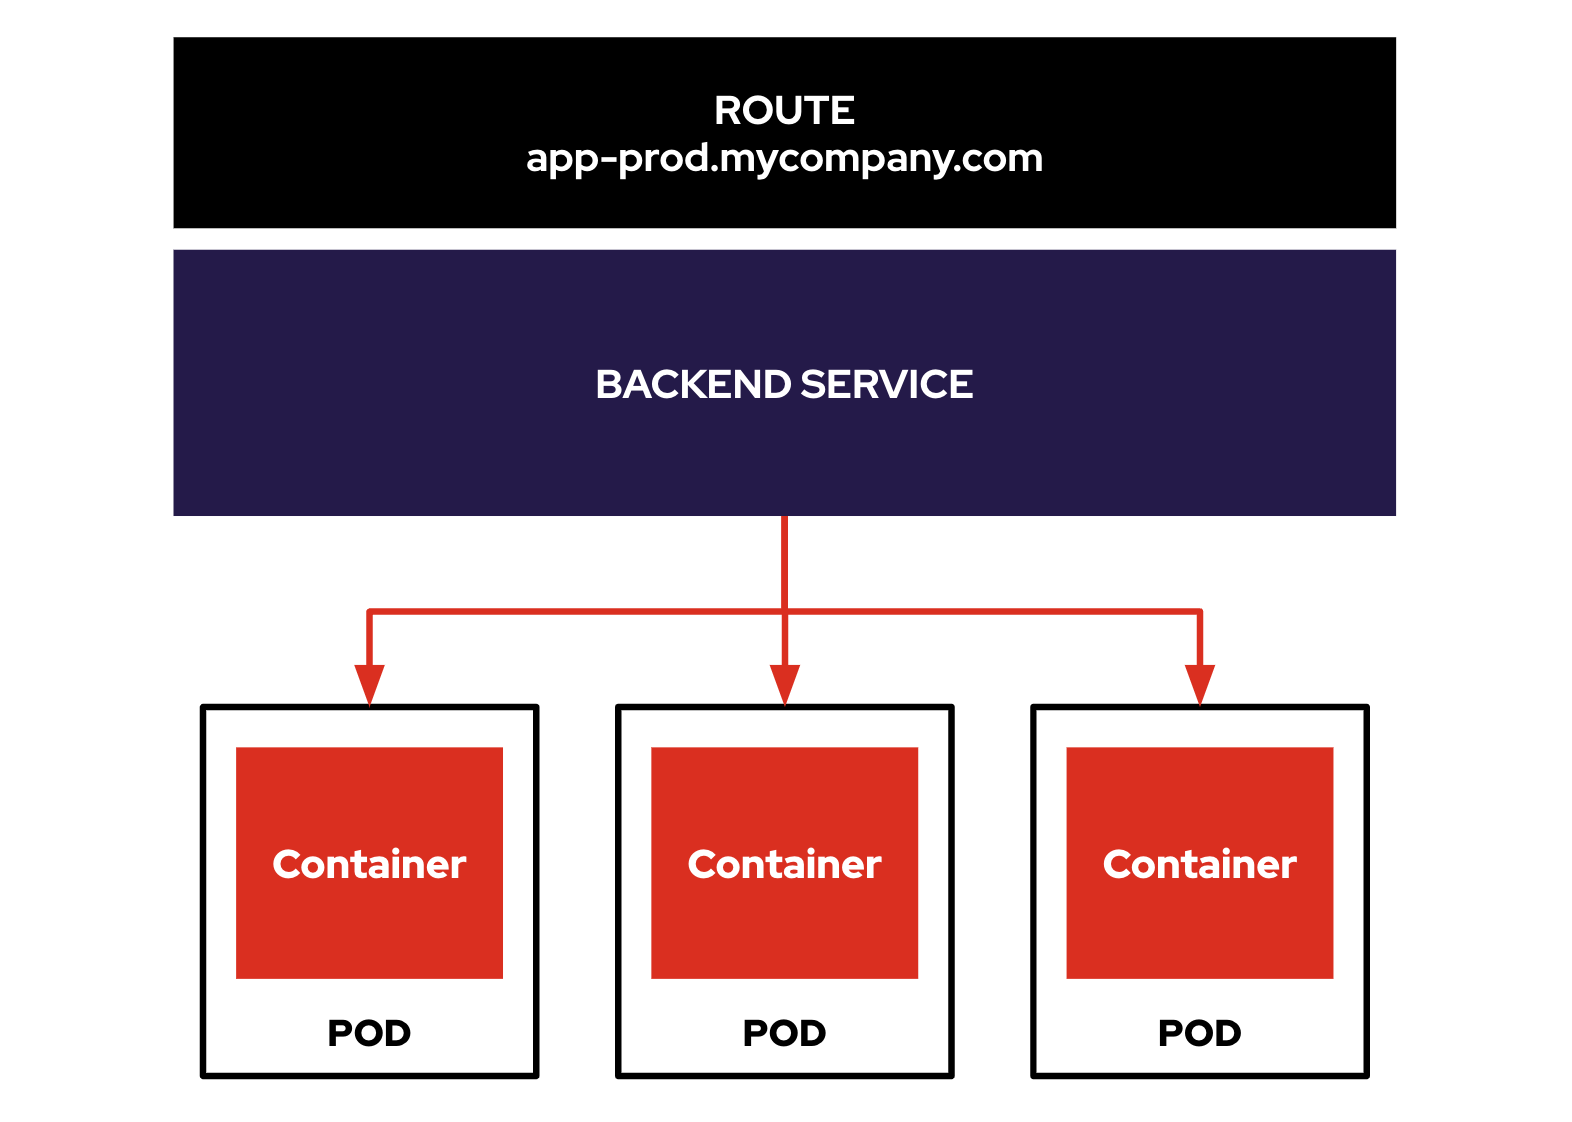
A Route connects an external URL to your service through the OpenShift router (HAProxy-based ingress controller).
oc create route edge weathernow --service=weathernowThe edge termination means TLS is handled by the router - traffic is encrypted between the user and the router, then plain HTTP to the pod.
Check the route:
oc get route weathernow -n app-managementNow go back to the Topology view in the console. You’ll see the route icon has appeared on the application:
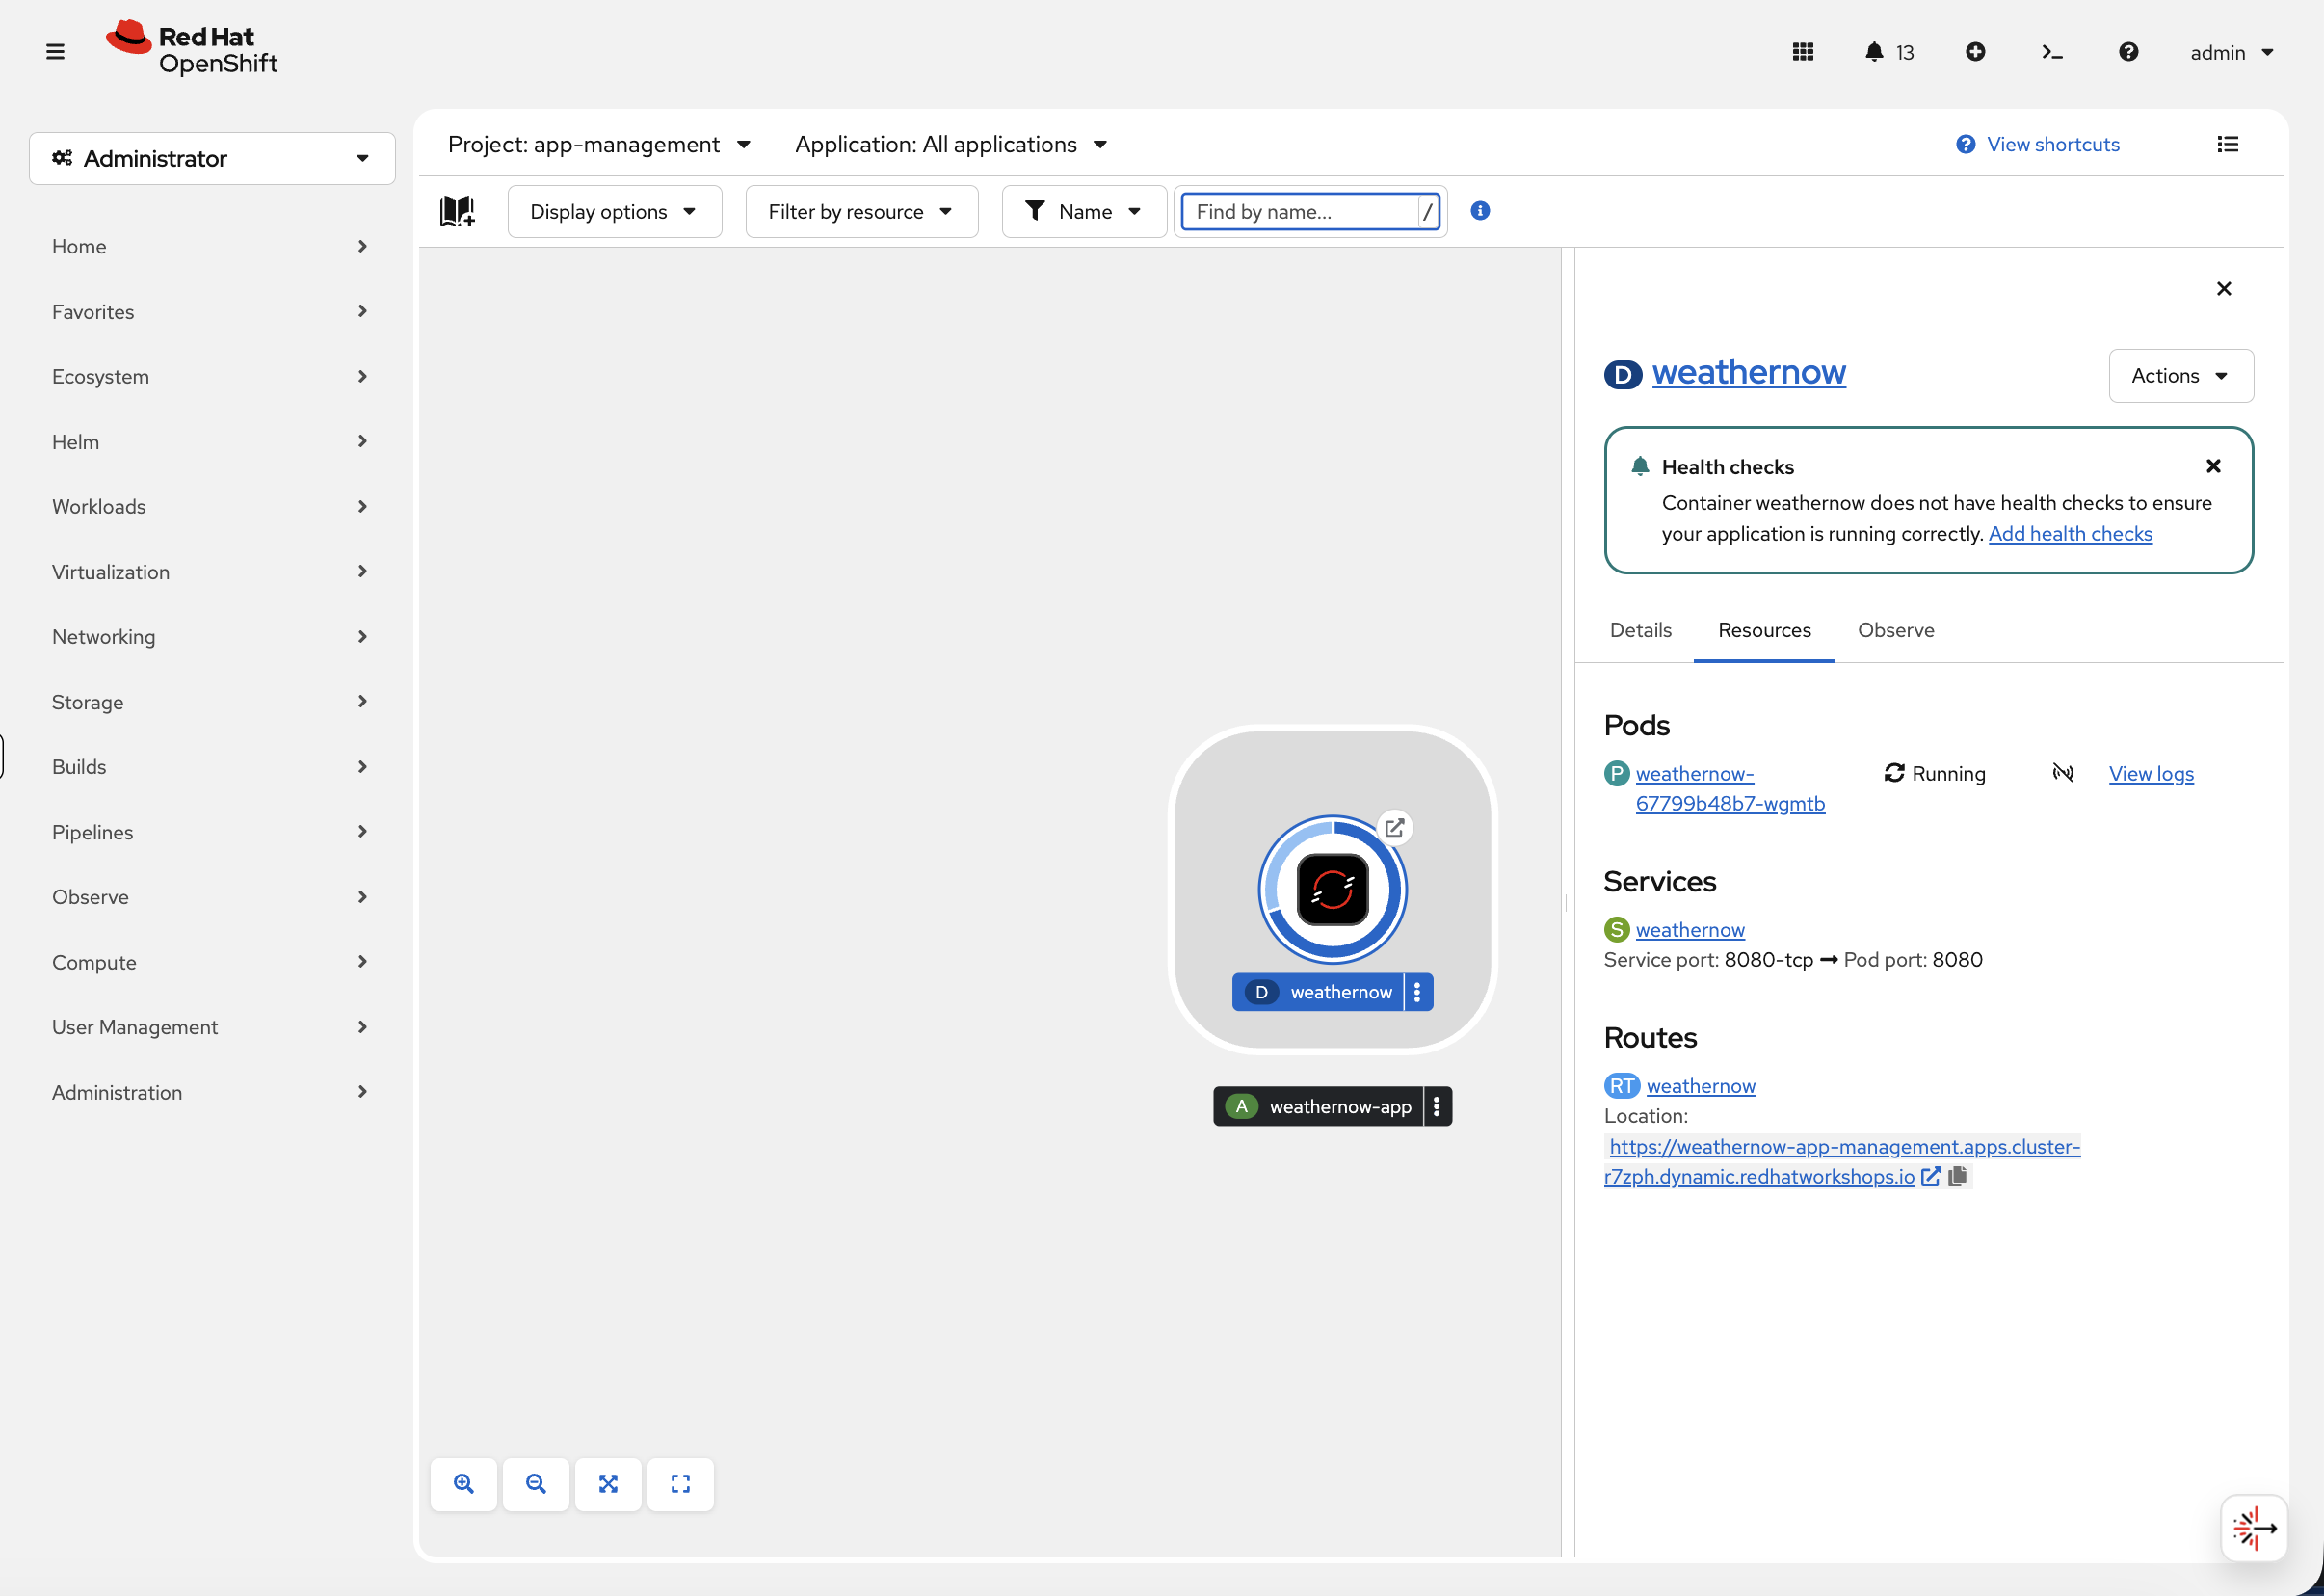
Click the route URL to open the WeatherNow app in your browser:
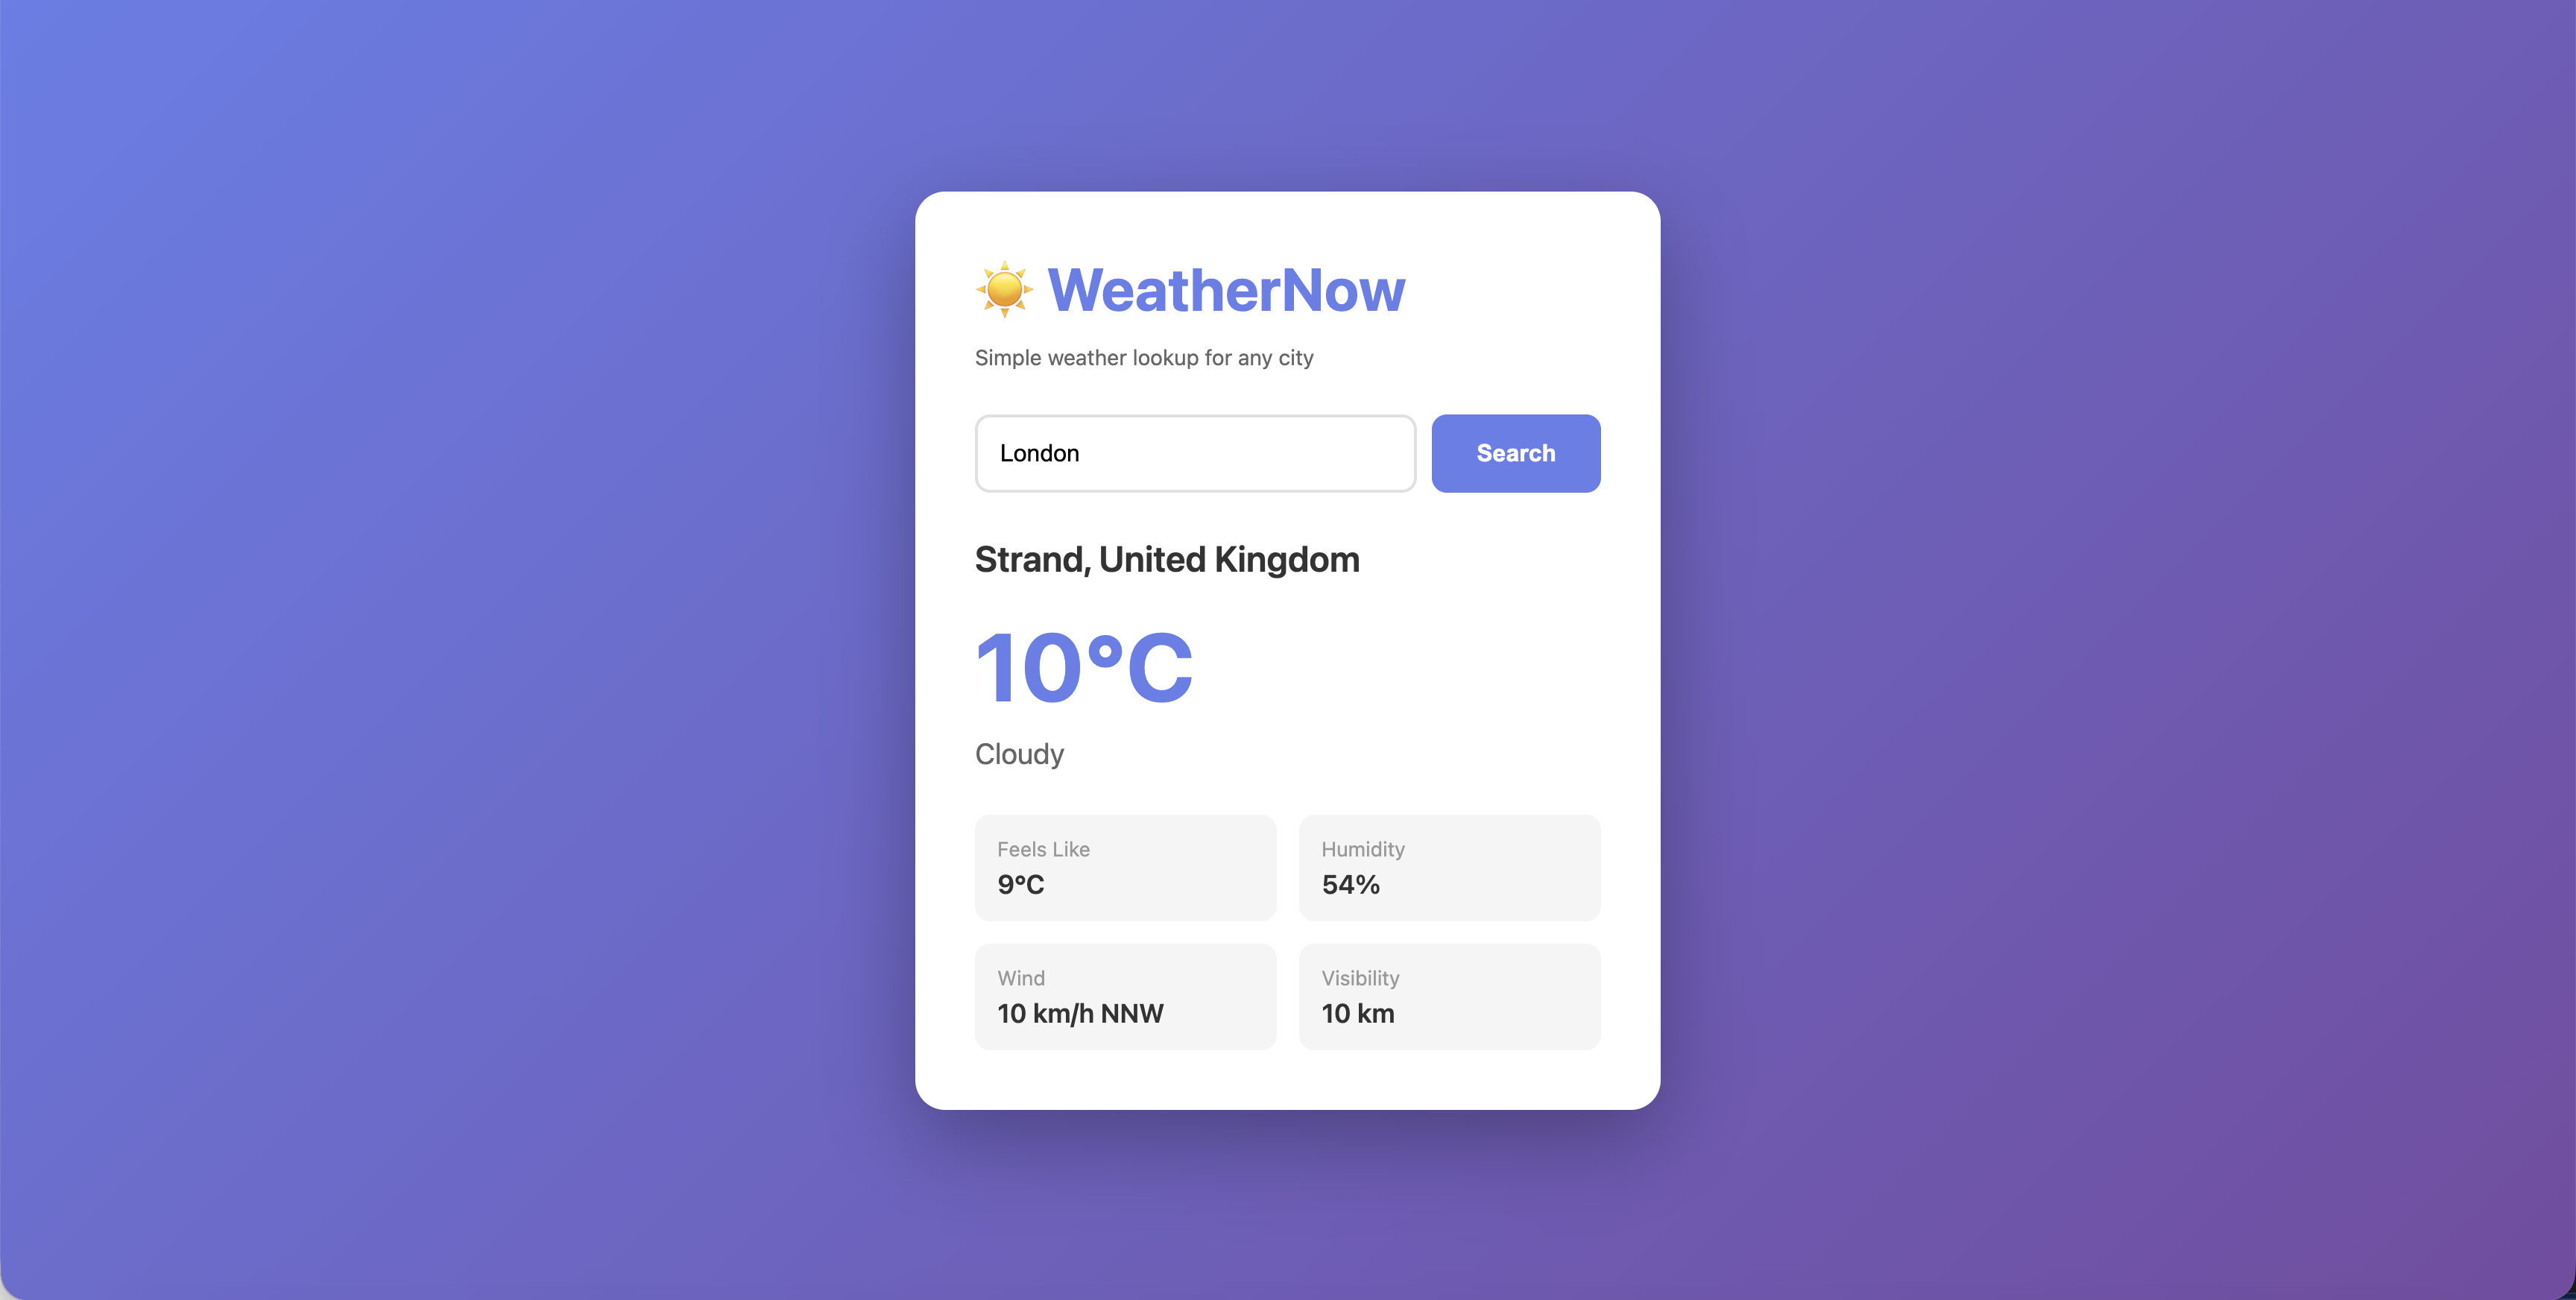
Your application is now accessible from outside the cluster.
Scale the Application
One pod isn’t enough for production. Scale to 3 replicas:
oc scale deployment weathernow --replicas=3Now switch to the OCP Console tab: Workloads → Pods (project: app-management). Watch the new pods appear in real-time with status transitions (Pending → ContainerCreating → Running).
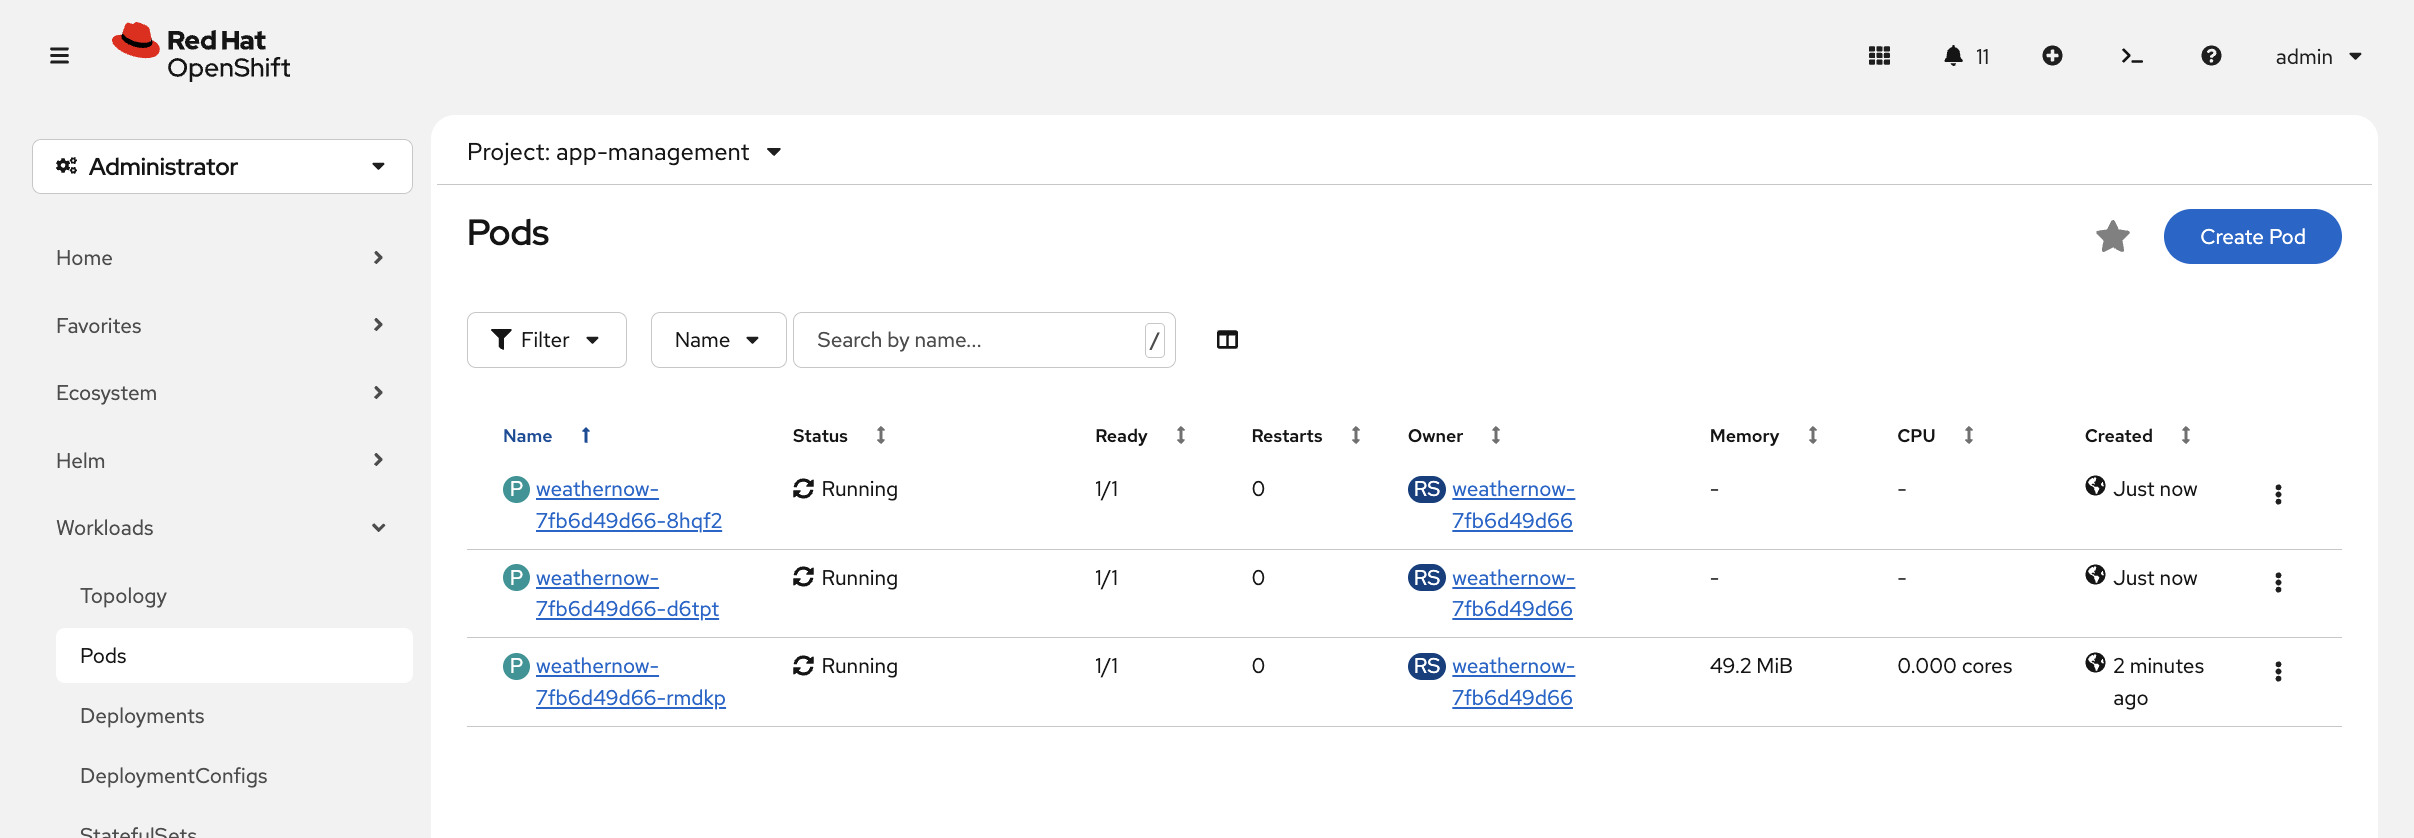
You can also verify via CLI:
oc get pods -n app-managementYou should see 3 pods, all Running. The service automatically load balances across all of them - no configuration needed. The service uses label selectors to find pods:
oc get endpointslice -l kubernetes.io/service-name=weathernow -n app-managementEach pod’s IP is listed as an endpoint. When a new pod starts, it’s automatically added. When a pod dies, it’s removed.
Resilience
Self-Healing
When a pod dies, OpenShift automatically replaces it. Let’s see this in action.
First, delete a pod:
oc delete pod $(oc get pods -n app-management -o jsonpath='{.items[0].metadata.name}') -n app-management --wait=falseNow immediately check the pods to see the self-healing in action:
oc get pods -n app-managementYou should see one pod Terminating and a new one in ContainerCreating or Running. Run it again after a few seconds:
sleep 5 && oc get pods -n app-managementThe total is back to 3 replicas - all Running. The replacement happened in seconds with no manual intervention.
You can also watch this in the OCP Console at Workloads → Pods (project: app-management). The console shows pod status transitions in real-time with colour-coded indicators.
|
The Deployment controller detected that the actual state (2 pods) didn’t match the desired state (3 pods) and created a replacement. This happens in seconds, with no manual intervention.
Application Probes
How does OpenShift know if your application is actually healthy? Without probes, a pod shows Running even if the app inside has hung, crashed its listener, or is returning errors to every request. Probes fix that.
-
Readiness probe - "Can this pod handle traffic?" If it fails, the pod is removed from the service endpoints. No requests get sent to it.
-
Liveness probe - "Is this pod still alive?" If it fails, OpenShift restarts the container.
Break It On Purpose
Let’s see what happens when probes fail. Add a readiness probe pointing at the wrong port - port 9999, where nothing is listening:
oc patch deployment weathernow -n app-management --type=json -p='[
  {"op":"add","path":"/spec/template/spec/containers/0/readinessProbe","value":{
    "tcpSocket":{"port":9999},
    "initialDelaySeconds":5,
    "periodSeconds":5
  }}
]'| The patch triggers a new rollout. If you see pod status streaming in the terminal, press Ctrl+C to get your prompt back. |
Watch the rollout - this is expected to fail. The new pods will never become ready because the probe is pointing at the wrong port:
oc rollout status deployment/weathernow -n app-management --timeout=30s || trueYou should see error: timed out waiting for the condition after 30 seconds. That’s the correct outcome - the rollout stalled because the readiness probe is failing. If it’s still running, press Ctrl+C to exit and continue.
Check the pods:
oc get pods -n app-managementYou should see pods showing 0/1 Running - the container is running, but the readiness probe is failing so OpenShift won’t send traffic to them. In the OCP Console, go to Workloads → Pods (project: app-management):
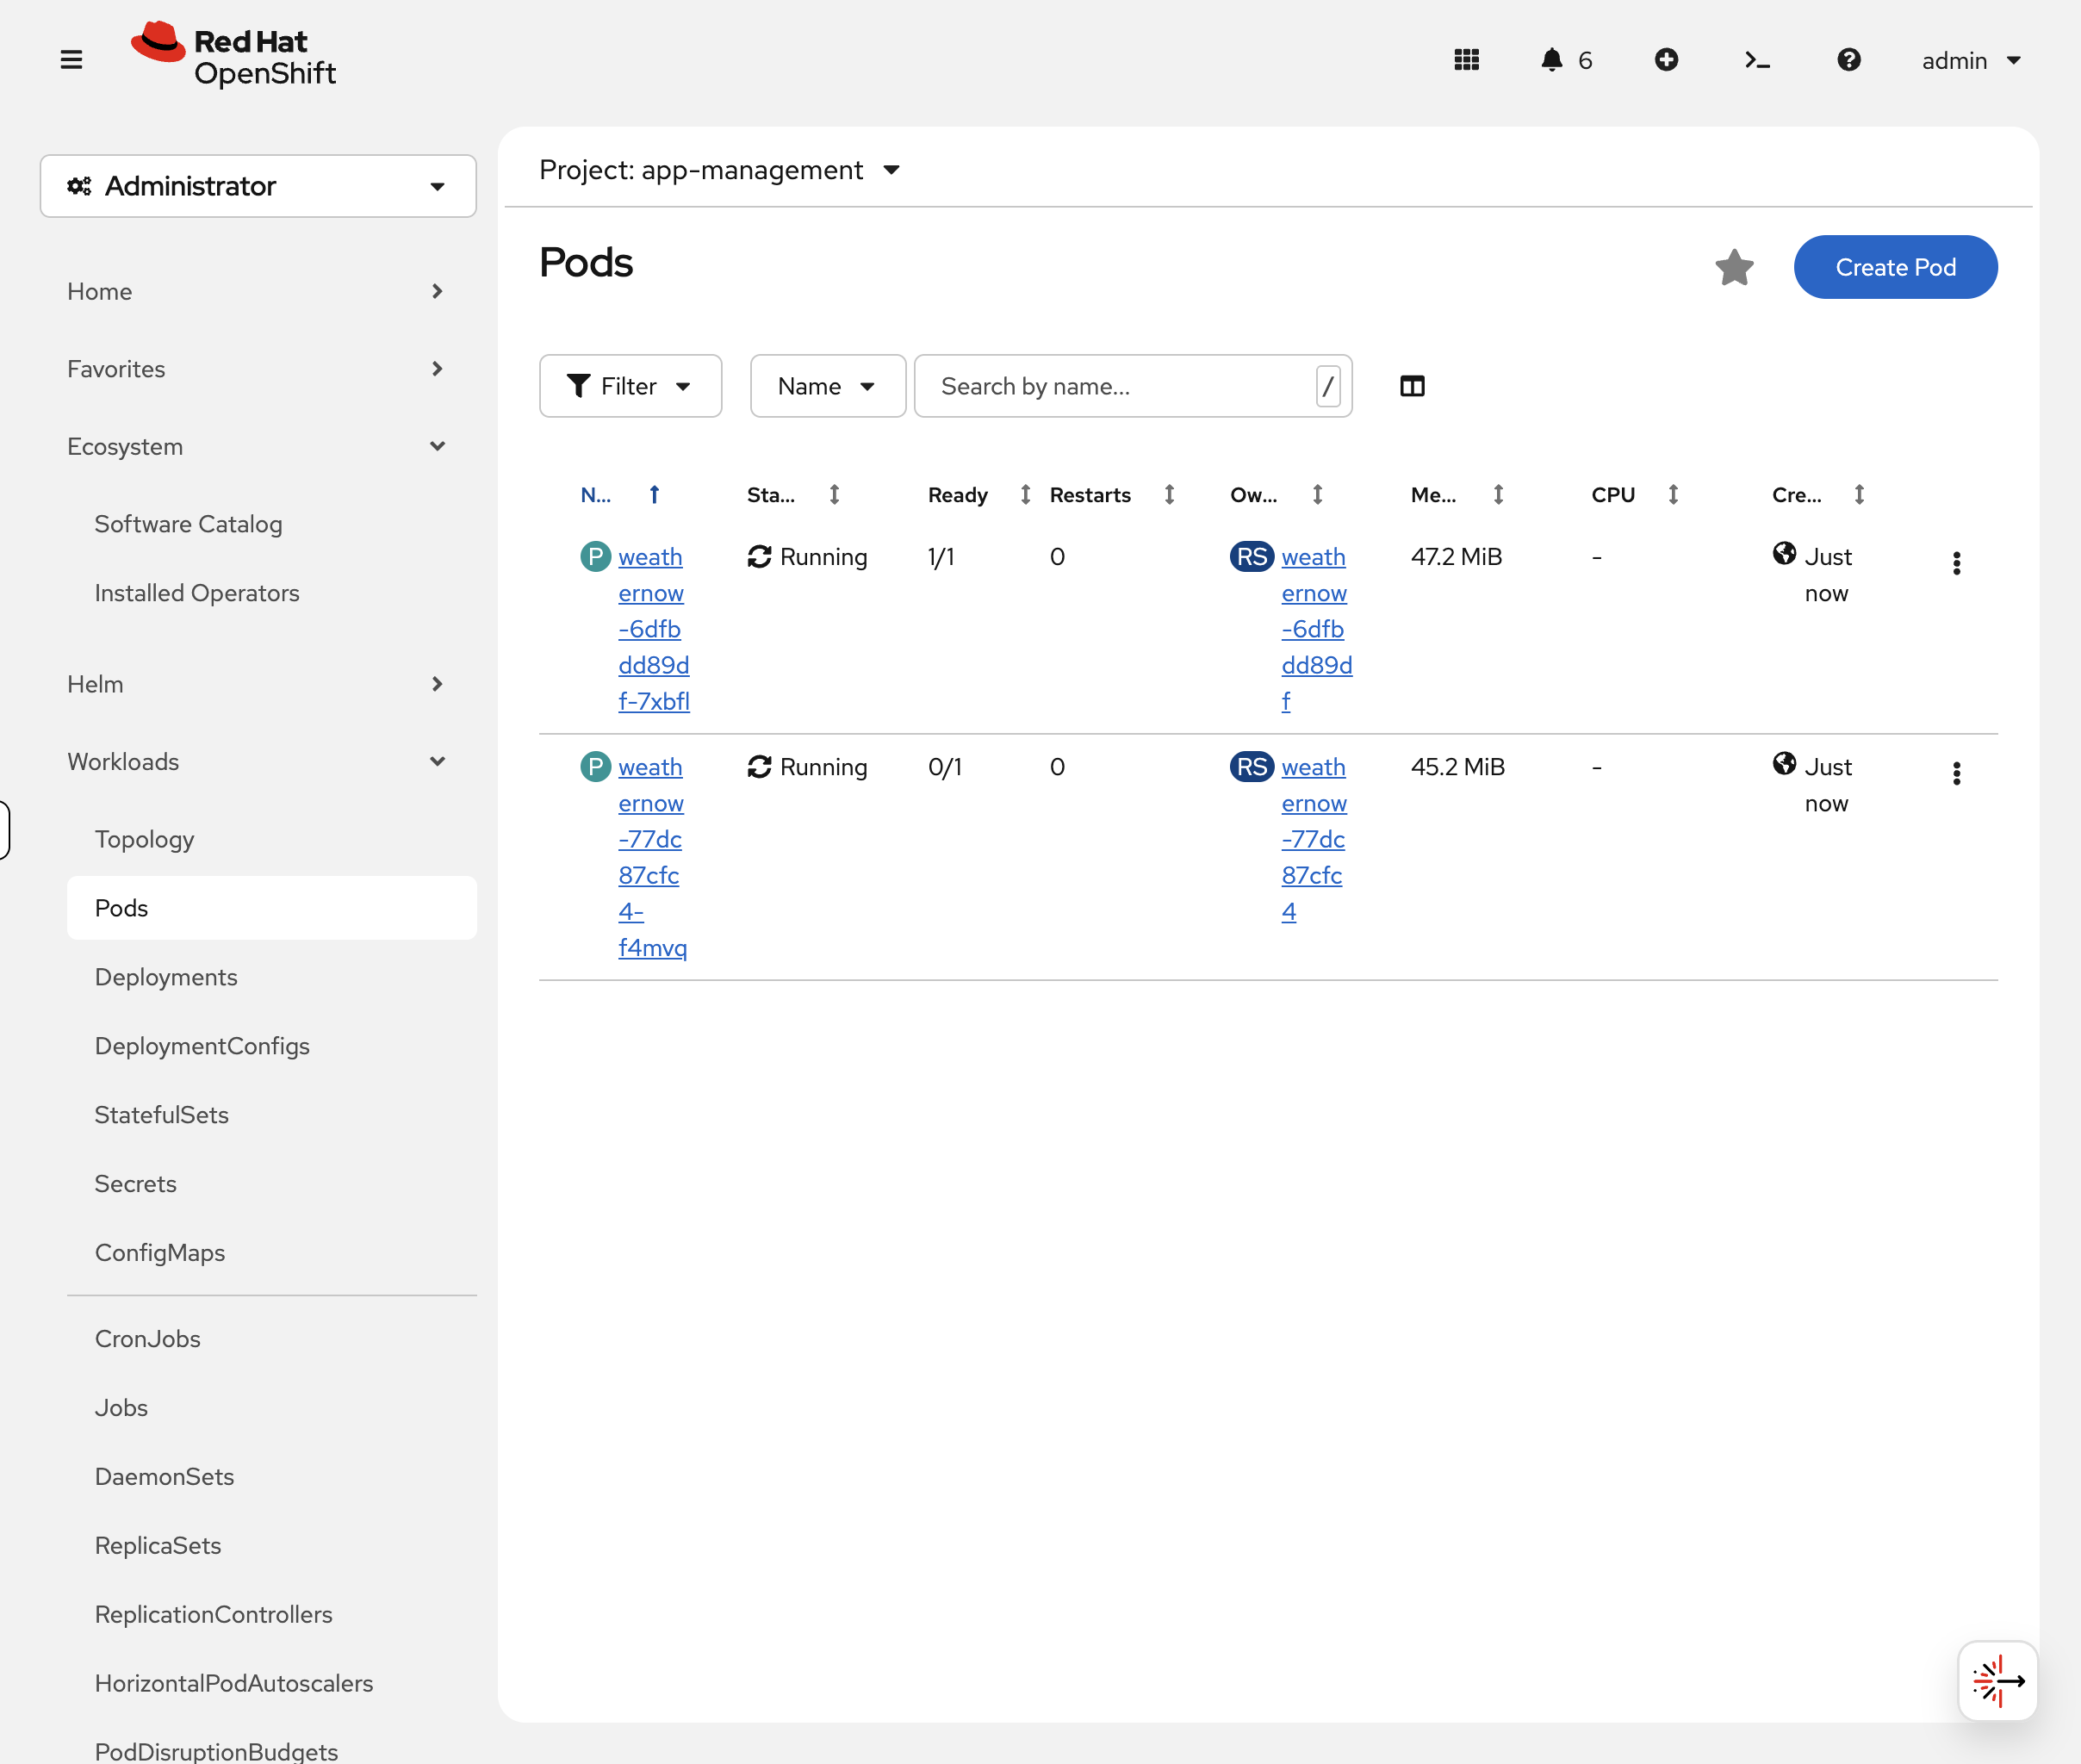
Click the 0/1 pod, then the Events tab. You’ll see repeated Readiness probe failed: dial tcp … connect: connection refused messages:
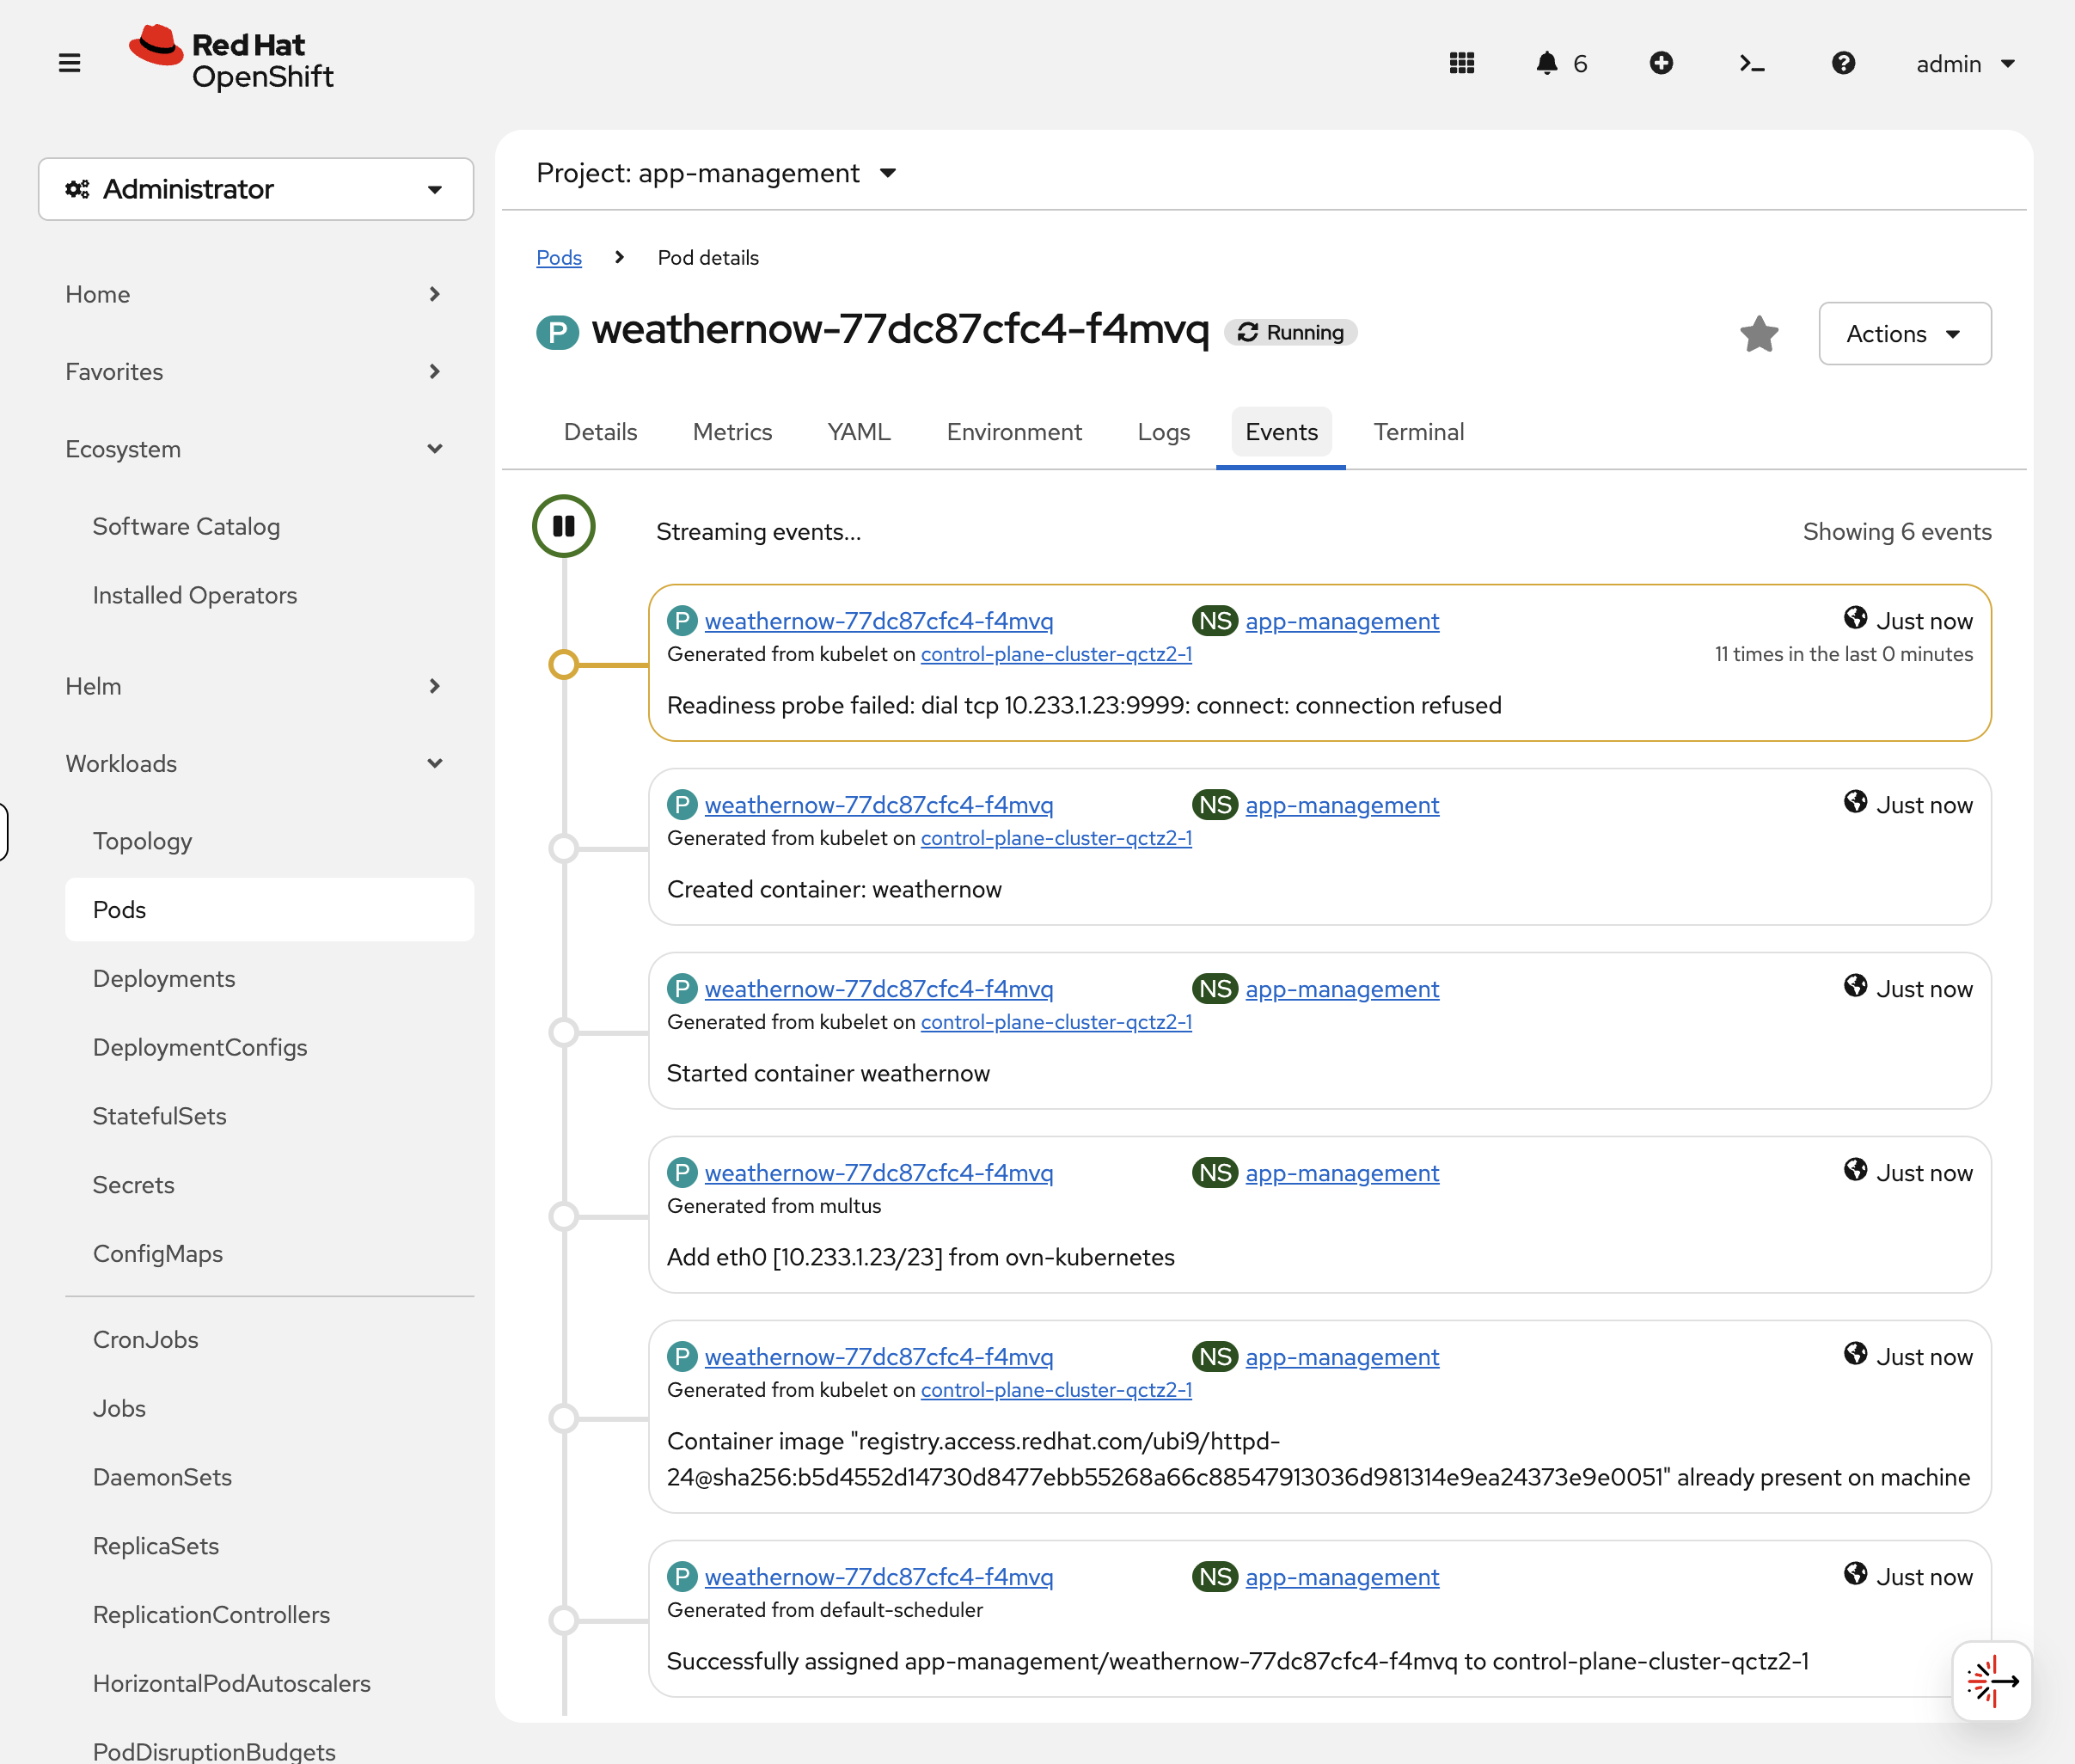
Check via CLI too:
oc describe pod -l deployment=weathernow -n app-management | grep -A2 "Readiness"The pod is alive but not ready. No traffic reaches it. This is exactly what happens in production when an app’s health endpoint goes down - OpenShift protects users from broken pods automatically.
Fix the Probe
Now fix it - point the readiness probe at port 8080 where httpd is actually listening, and add a liveness probe too:
oc patch deployment weathernow -n app-management --type=json -p='[
  {"op":"replace","path":"/spec/template/spec/containers/0/readinessProbe","value":{
    "tcpSocket":{"port":8080},
    "initialDelaySeconds":5,
    "periodSeconds":10
  }},
  {"op":"add","path":"/spec/template/spec/containers/0/livenessProbe","value":{
    "tcpSocket":{"port":8080},
    "initialDelaySeconds":15,
    "periodSeconds":20
  }}
]'| The patch triggers a new rollout. If you see pod status streaming in the terminal, press Ctrl+C to get your prompt back. |
Probes support multiple types: httpGet (checks an HTTP endpoint), tcpSocket (checks if a port is listening), and exec (runs a command inside the container). Use whichever matches your app - httpGet to a /healthz endpoint is most common for web services.
|
Wait for the rollout to complete:
oc rollout status deployment/weathernow -n app-management --timeout=60s
Once you see deployment "weathernow" successfully rolled out or Completed, press Ctrl+C to exit and continue.
|
oc get pods -n app-managementAll pods now show 1/1 Running - probes pass, traffic flows. You just diagnosed and fixed a readiness probe failure, which is one of the most common issues in production OpenShift clusters.
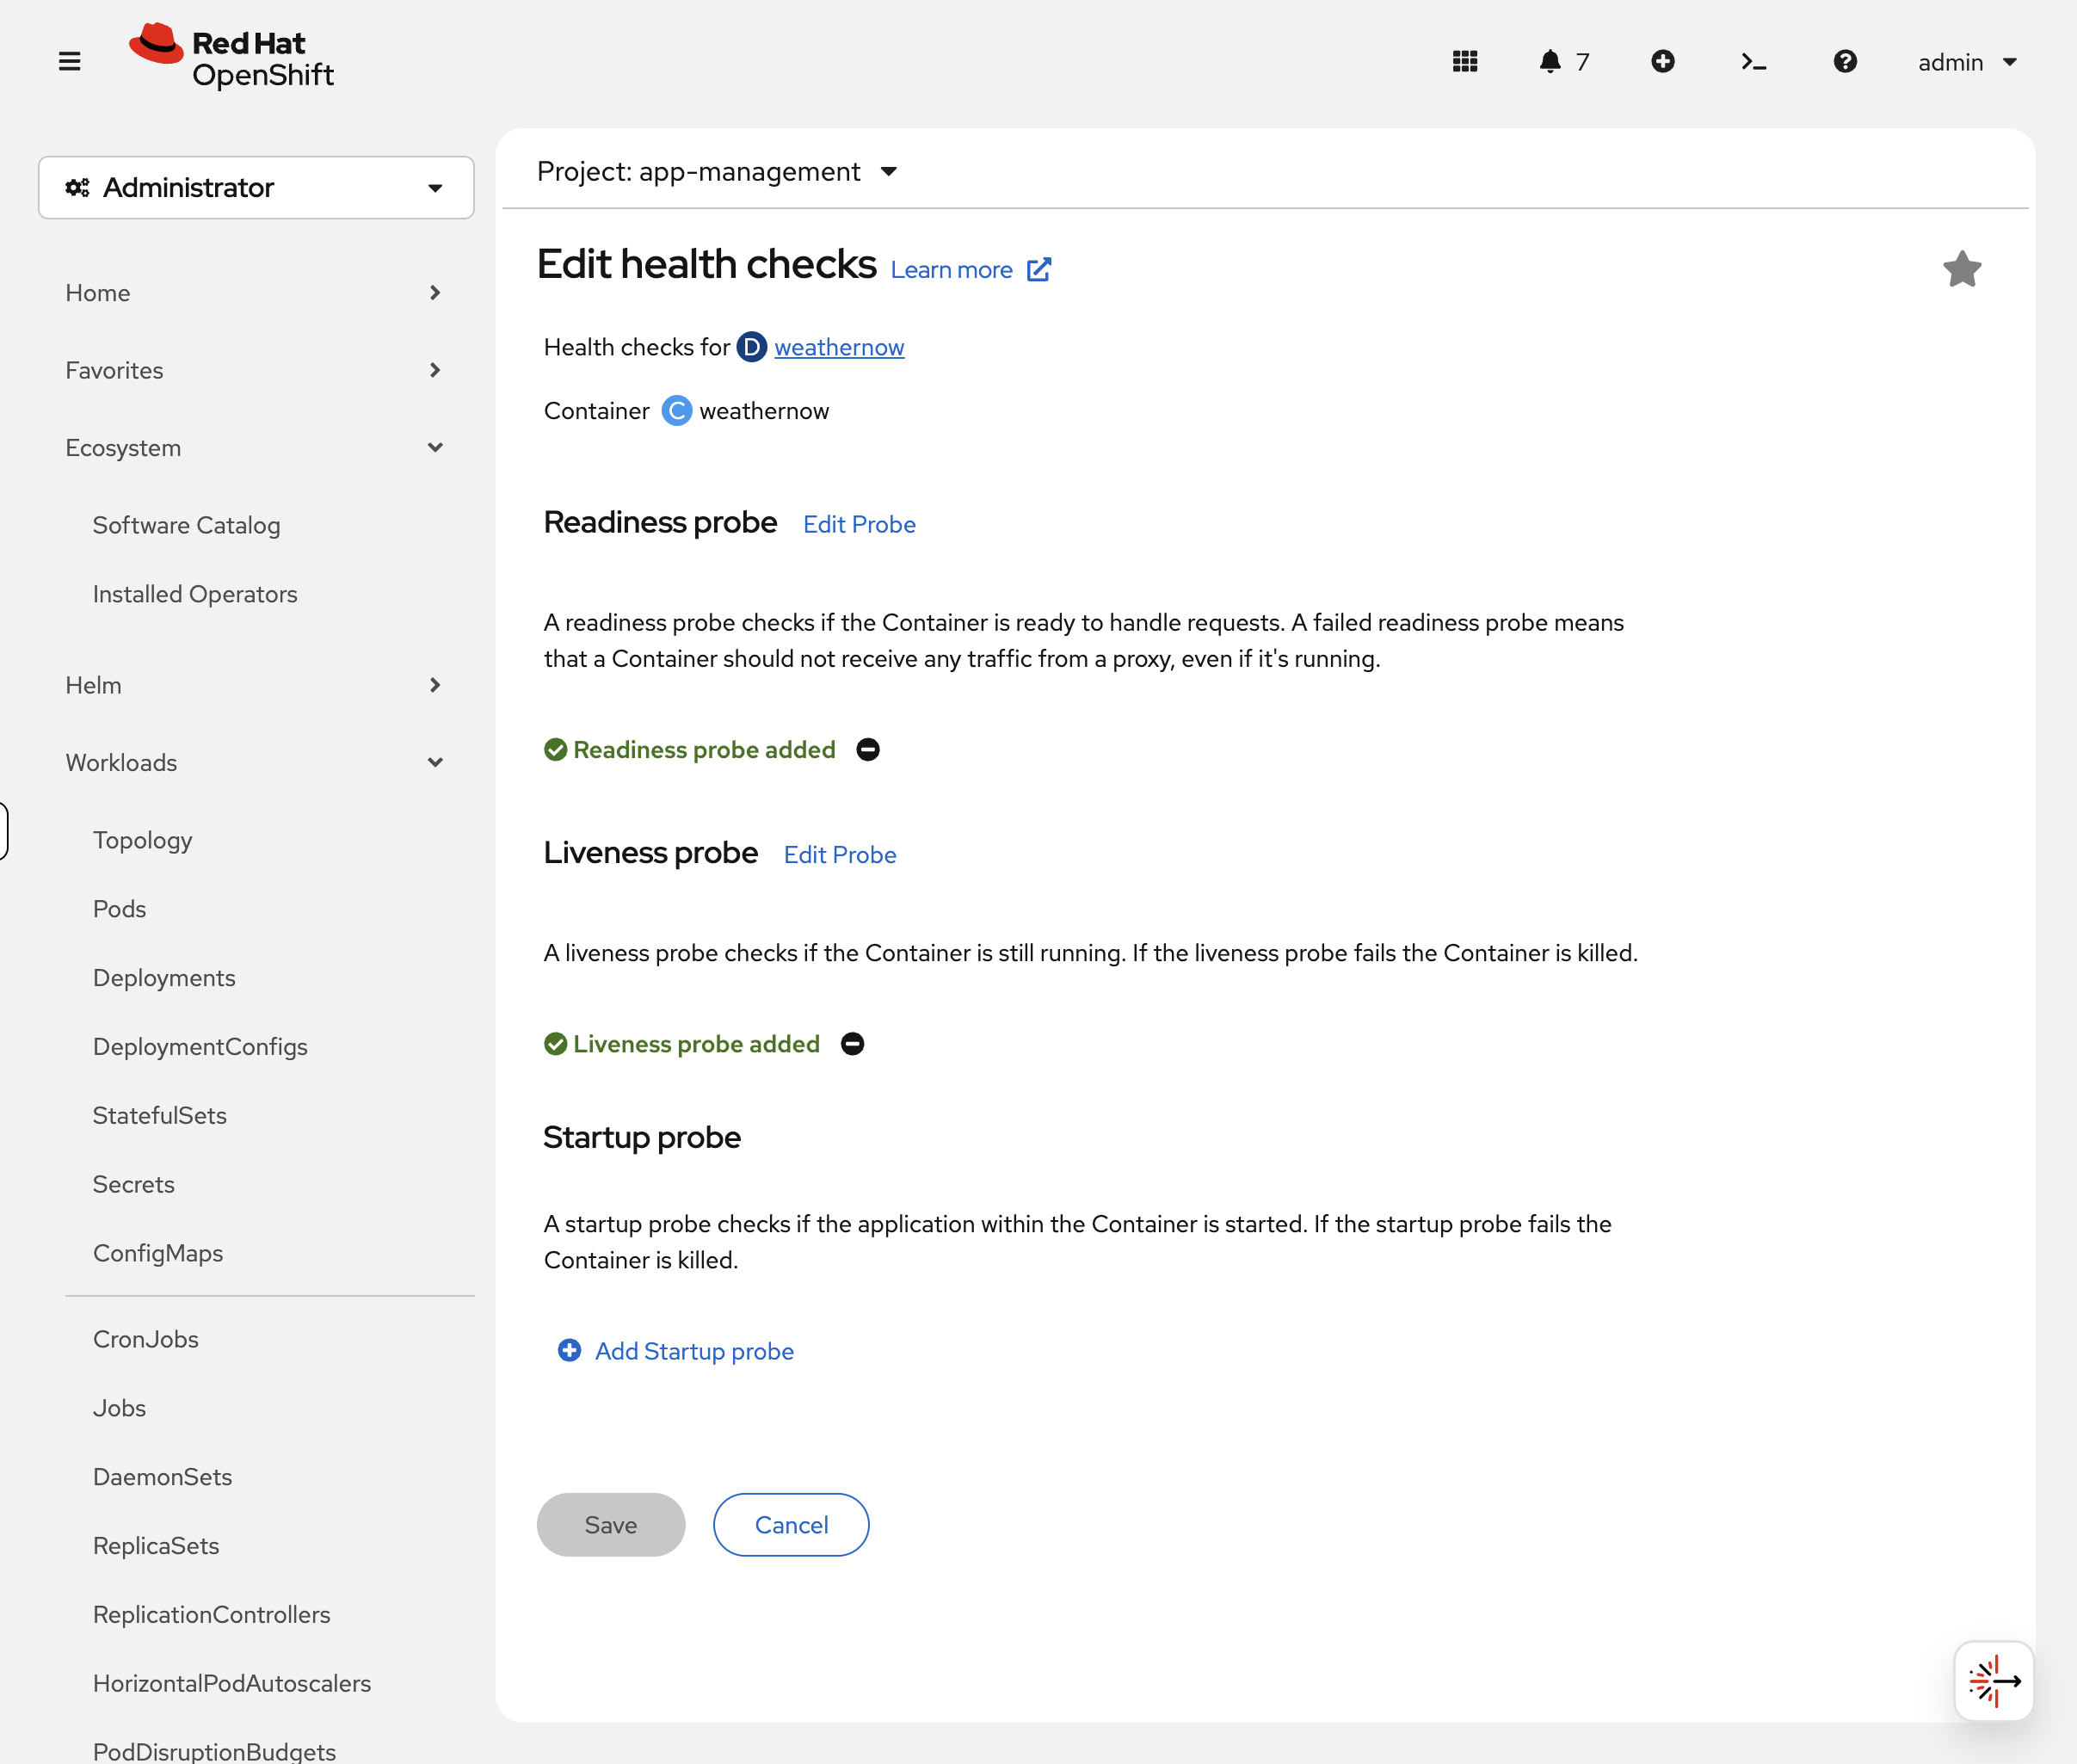
In the OCP Console, navigate to Workloads → Deployments, click the three-dot menu on the weathernow deployment, and select Edit Health Checks:
|
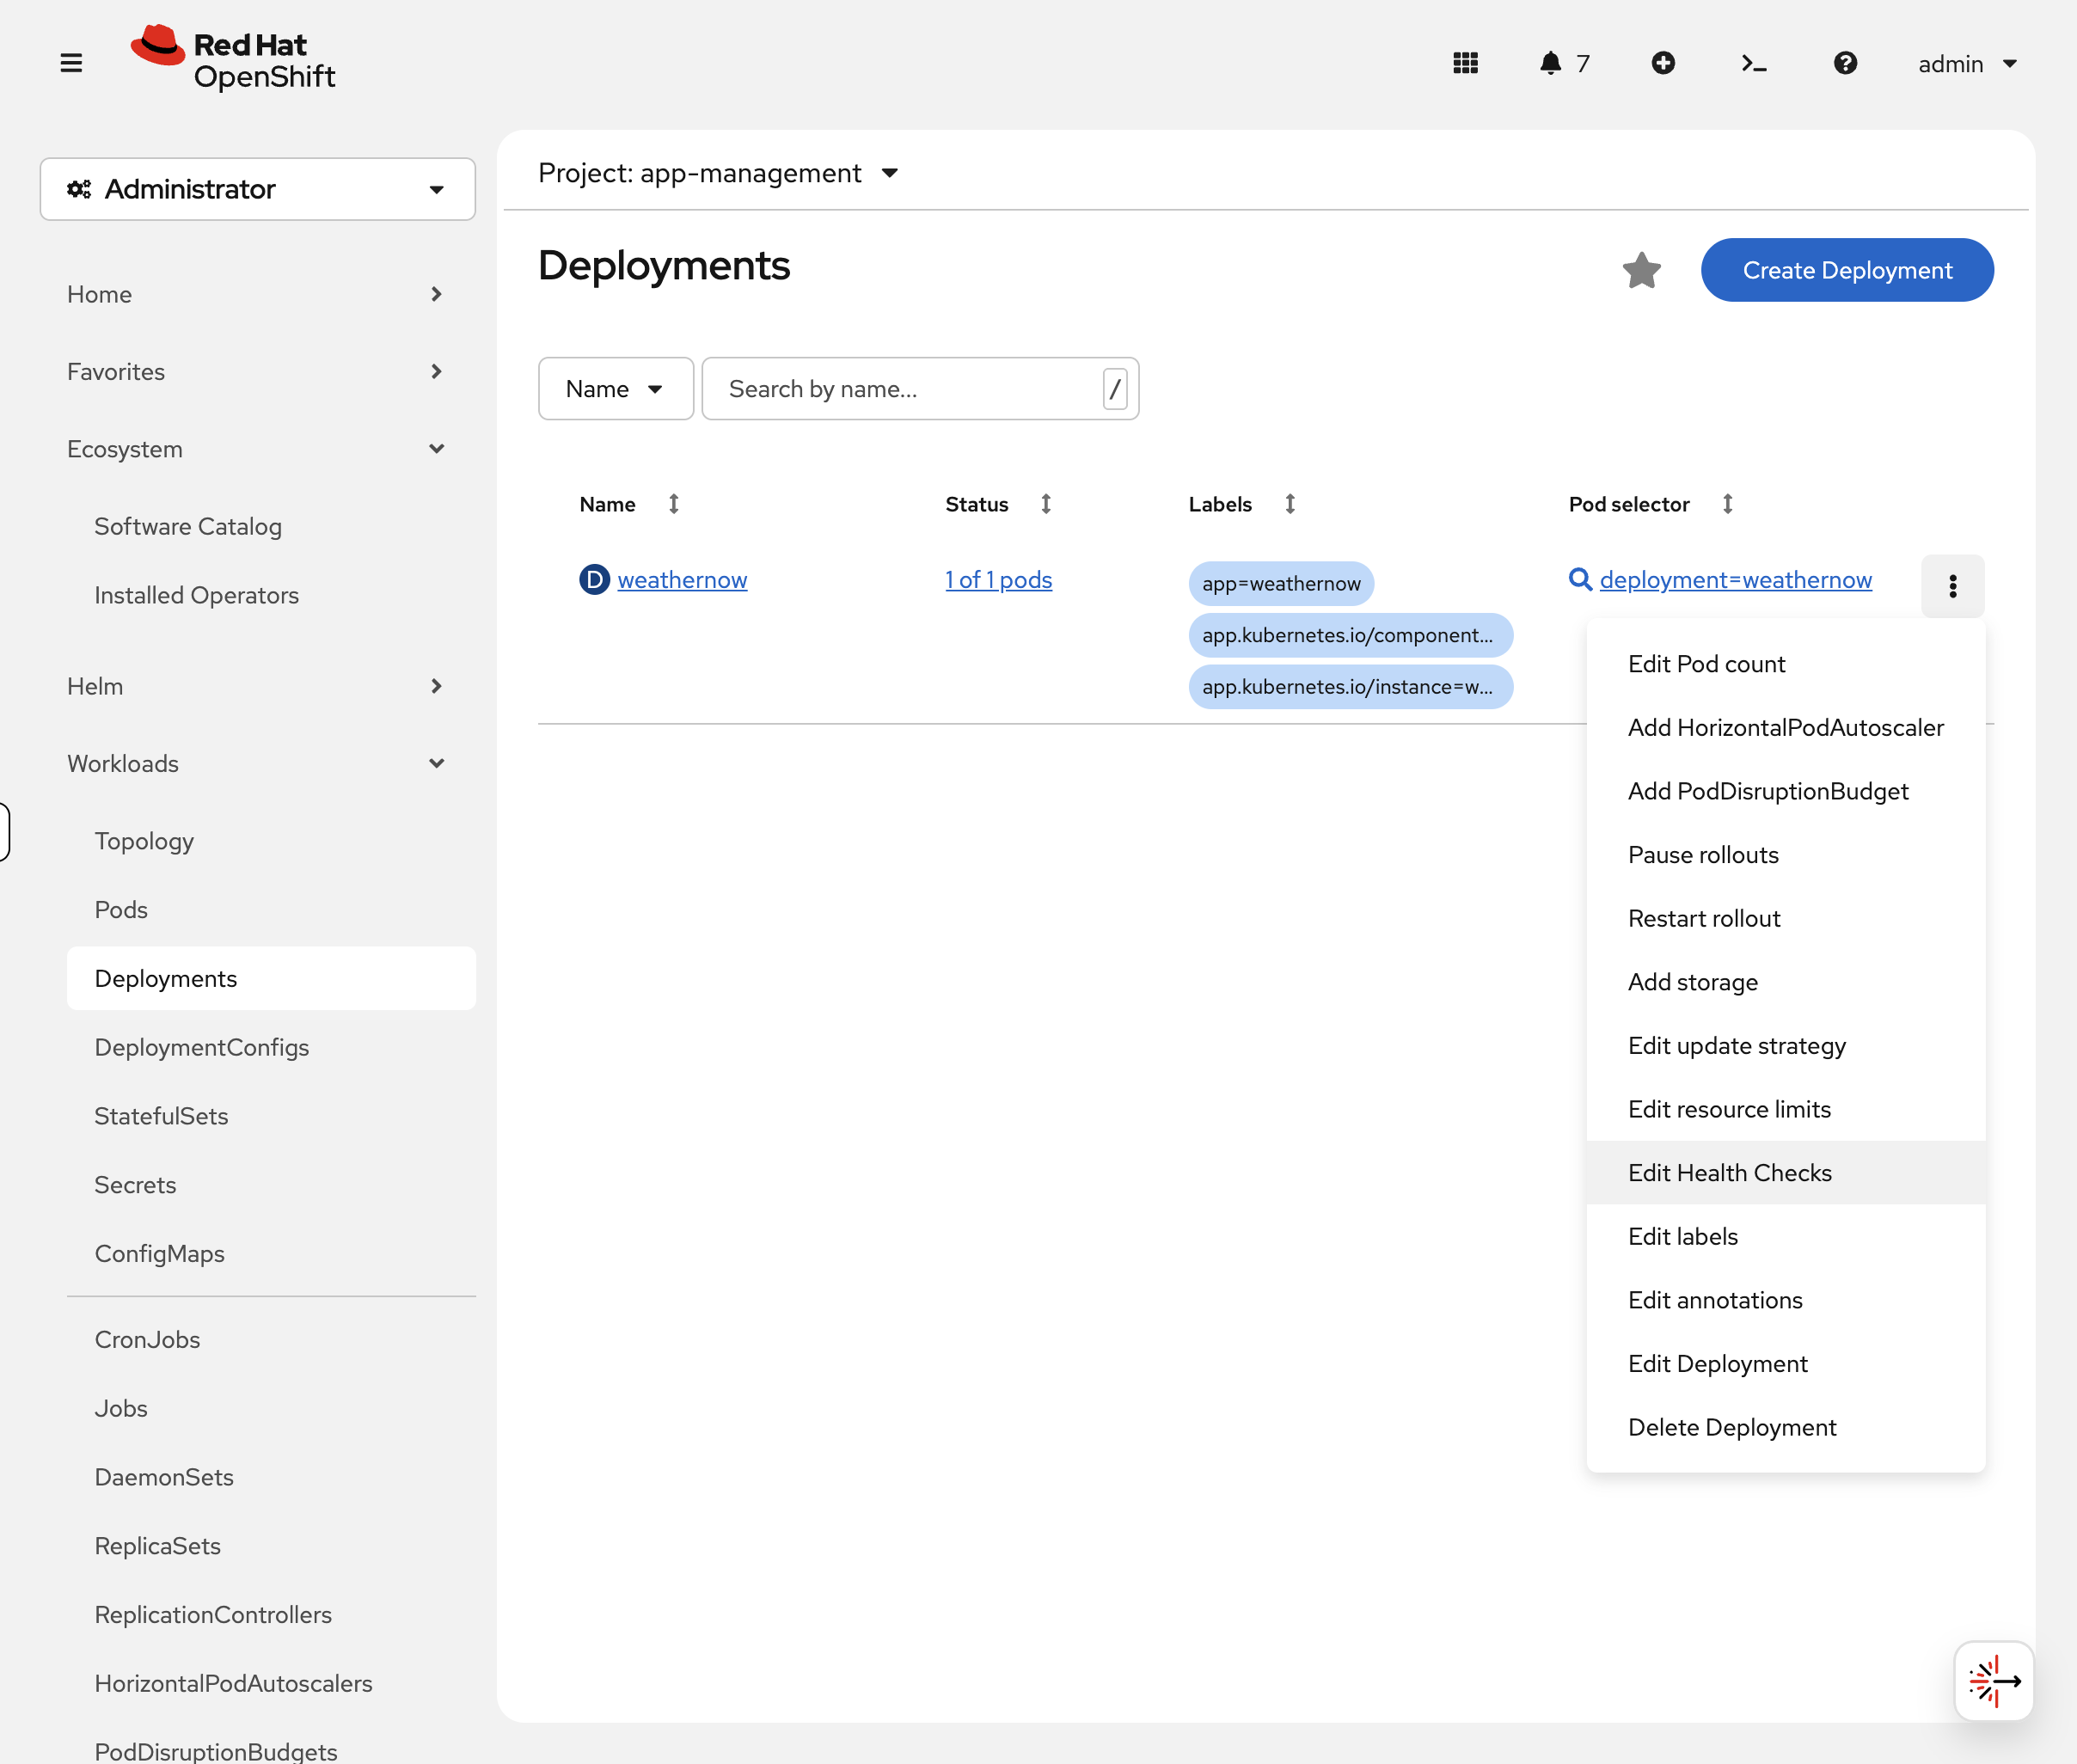
The form visually shows the difference between liveness, readiness, and startup probes - and lets you configure them without writing JSON patches:
Rollback a Bad Deployment
Someone just pushed a bad image update. How do you undo it?
Simulate a bad deploy by changing the image:
oc set image deployment/weathernow weathernow=registry.access.redhat.com/ubi9/nginx-124 -n app-management| If you see pod status streaming in the terminal, press Ctrl+C to get your prompt back. |
Check the rollout history - OpenShift tracks every change:
oc rollout history deployment/weathernow -n app-managementYou’ll see multiple revisions. Each time you change the deployment, a new revision is created.
You can also see this visually in the console. Navigate to Workloads → Deployments → weathernow and click the ReplicaSets tab:
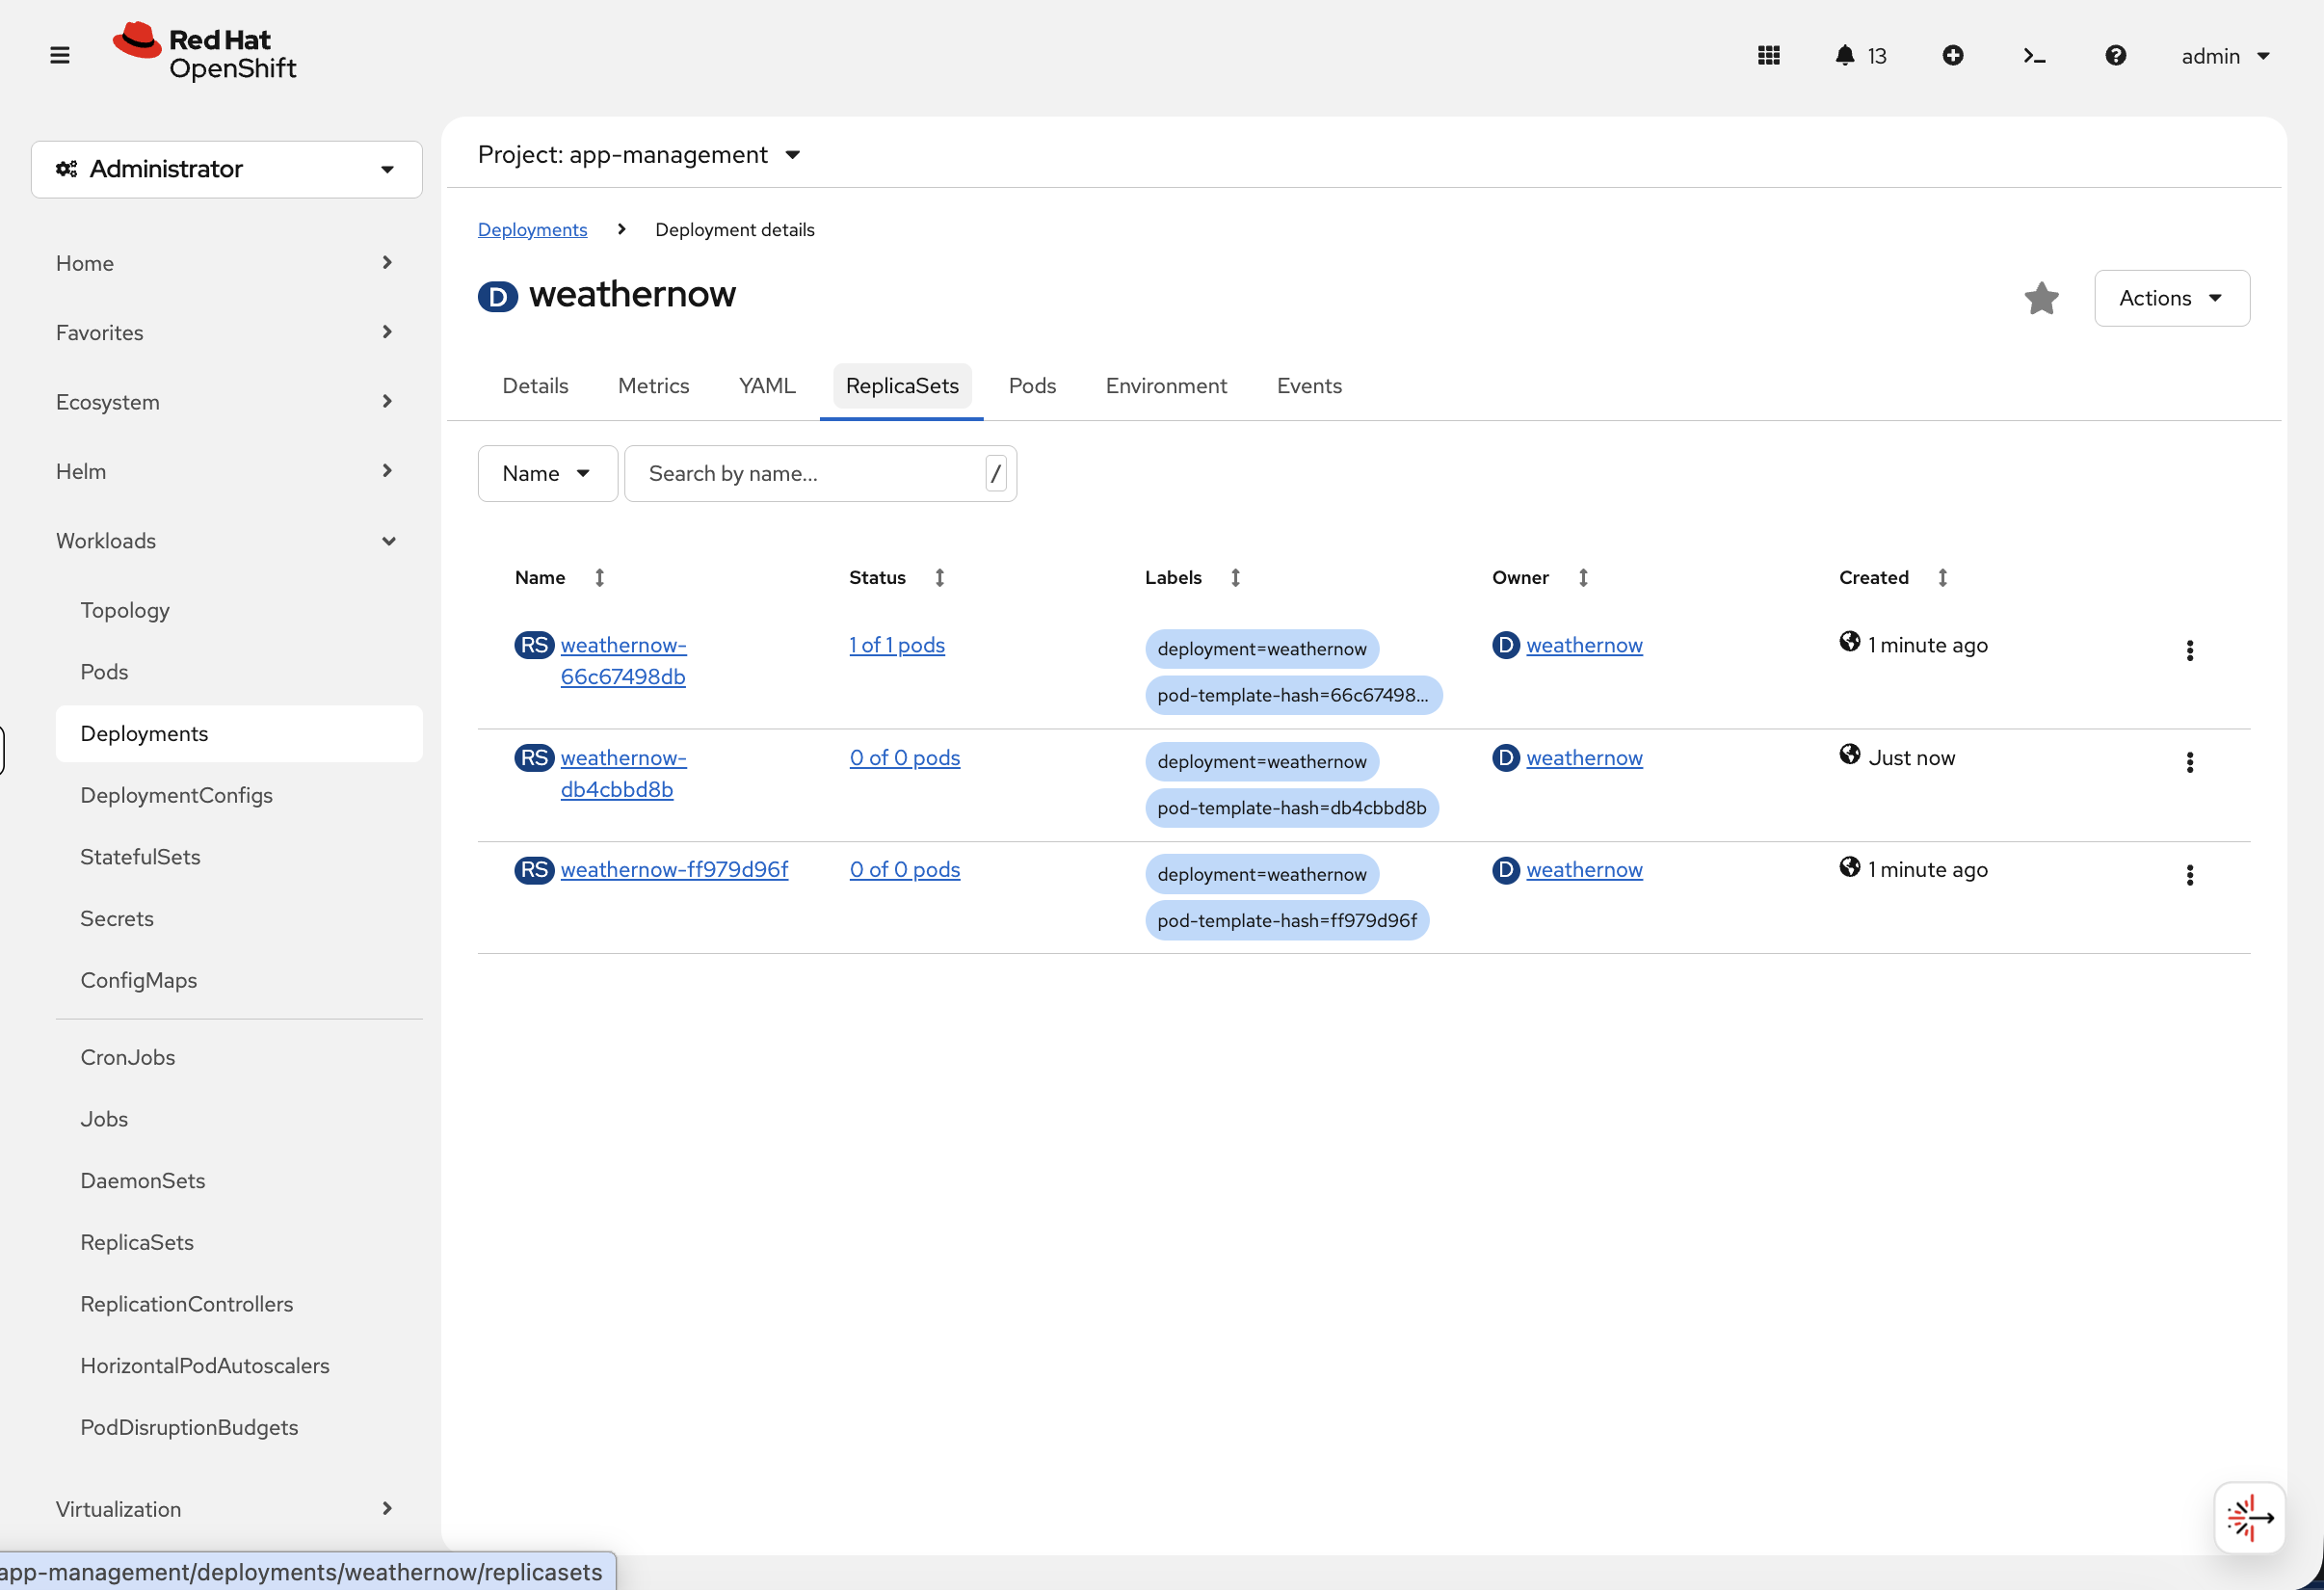
Each ReplicaSet represents a revision. The active one shows 1 of 1 pods while previous revisions are scaled to 0 of 0 pods - OpenShift keeps them so it can roll back instantly.
Roll back to the previous working version:
oc rollout undo deployment/weathernow -n app-management| If you see pod status streaming in the terminal, press Ctrl+C to get your prompt back. |
Verify the original image is restored:
oc get deployment weathernow -n app-management -o jsonpath='{.spec.template.spec.containers[0].image}'You should see the original WeatherNow image (shown as a digest since OpenShift resolves image tags via the ImageStream):
quay.io/openshift-workshop-applications/weathernow@sha256:362b6db3...
oc rollout status deployment/weathernow -n app-management --timeout=60s| This may take a minute to complete. Only press Ctrl+C if it has been running for more than 5 minutes. |
The deployment is back to the working version. In production, oc rollout undo is often the fastest way to recover from a bad release - faster than fixing the code and redeploying.
Pod Disruption Budgets
A PodDisruptionBudget (PDB) tells OpenShift: "always keep at least N pods running, even during maintenance." When you drain a node for an upgrade or repair, the eviction API checks PDBs before removing pods. If evicting a pod would drop below the minimum, the drain blocks until it’s safe.
This matters to you because a misconfigured PDB is the #1 cause of stalled cluster upgrades - the upgrade process drains nodes one at a time, and a single bad PDB can block the entire upgrade indefinitely.
Create a PDB
Your weathernow deployment is running 3 replicas. Create a PDB that requires at least 2 pods to stay available at all times:
cat <<'EOF' | oc apply -f -
apiVersion: policy/v1
kind: PodDisruptionBudget
metadata:
  name: weathernow
  namespace: app-management
spec:
  minAvailable: 2
  selector:
    matchLabels:
      app: weathernow
EOF
Check the PDB:
oc get pdb weathernow -n app-managementYou should see:
NAME         MIN AVAILABLE   MAX UNAVAILABLE   ALLOWED DISRUPTIONS   AGE
weathernow   2               N/A               1                     5s
ALLOWED DISRUPTIONS: 1 means one pod can be safely evicted right now (3 running - 2 minimum = 1 spare).
See the PDB in Action
Delete a pod and watch the PDB counter:
oc delete pod $(oc get pods -n app-management -l app=weathernow -o jsonpath='{.items[0].metadata.name}') -n app-managementoc get pdb weathernow -n app-managementALLOWED DISRUPTIONS briefly drops to 0 while the replacement starts. Wait a few seconds and check again:
sleep 10 && oc get pdb weathernow -n app-managementBack to 1 - the replacement pod is ready and the budget has room again.
Break It: Block a Node Drain
Now simulate the most common PDB problem in production - setting minAvailable equal to the replica count. This means every single pod must be running at all times, which sounds safe but makes maintenance impossible.
oc patch pdb weathernow -n app-management --type=merge -p '{"spec":{"minAvailable":3}}'oc get pdb weathernow -n app-managementALLOWED DISRUPTIONS: 0 - no pod can be evicted. Now try to drain the node, simulating what happens during a cluster upgrade:
NODE=$(oc get pod -n app-management -l app=weathernow -o jsonpath='{.items[0].spec.nodeName}')
echo "Draining node: $NODE"
oc adm drain $NODE --pod-selector=app=weathernow --delete-emptydir-data --ignore-daemonsets --timeout=10s 2>&1 || true
echo "---"
echo "Uncordoning node..."
oc adm uncordon $NODE
The drain fails:
Cannot evict pod as it would violate the pod's disruption budget.
This is exactly what blocks cluster upgrades. The OpenShift upgrade controller tries to drain each node, hits this PDB, and waits forever. The command automatically uncordons the node at the end so scheduling is restored.
Fix the PDB
Set minAvailable back to 2 - this allows one pod at a time to be evicted during maintenance:
oc patch pdb weathernow -n app-management --type=merge -p '{"spec":{"minAvailable":2}}'oc get pdb weathernow -n app-managementALLOWED DISRUPTIONS: 1 - node drains will work again.
Takeaway: When a cluster upgrade stalls, run oc get pdb -A and look for ALLOWED DISRUPTIONS: 0. If minAvailable equals the replica count, lower it or switch to maxUnavailable: 1. A PDB that blocks all evictions doesn’t protect your app - it blocks your entire cluster from being maintained.
Cleanup & Summary
Summary
You completed the core application lifecycle on OpenShift:
-
Deploy -
oc new-appcreates deployment + service in one command -
Inspect -
oc describe podandoc logsfor diagnostics -
Expose -
oc create route edgeadds TLS-terminated external access -
Scale -
oc scaleadjusts replicas, service auto-balances -
Self-heal - delete a pod, OpenShift replaces it in seconds
-
Health checks - probes ensure only healthy pods receive traffic
-
Rollback -
oc rollout undoreverts a bad deployment instantly -
PDB -
minAvailableprotects availability during drains; misconfigured PDBs block upgrades
Key commands:
oc new-app --name=myapp --image=myimage       # Deploy
oc describe pod <pod-name>                     # Inspect
oc logs <pod-name>                             # Check logs
oc create route edge myapp --service=myapp     # Expose with TLS
oc scale deployment myapp --replicas=N         # Scale
oc rollout undo deployment/myapp               # Rollback
oc get pdb -A                                  # Check disruption budgets
Cleanup
If the Ingress & Load Balancing module is part of your workshop, skip this cleanup - it reuses the weathernow application in the app-management namespace.
|
oc delete namespace app-management --ignore-not-found
echo "Cleanup complete"| This waits for the namespace to be fully deleted before returning. This ensures the next module can recreate it cleanly. |