Performance Tuning
Getting Started
Module Overview
Duration: 30 minutes
Audience: Platform Engineers, SRE, Operations Teams
The Challenge: Your applications are experiencing performance issues - pods crashing from resource exhaustion, slow response times under load, and unclear capacity planning.
In this module: You’ll diagnose and fix real performance problems using OpenShift’s autoscaling and monitoring tools.
Part 1: The Over-Provisioned Application
A developer deployed an application requesting 2Gi of memory "just to be safe." But is that actually needed?
Deploy the App
oc new-project performance-demooc apply -f https://raw.githubusercontent.com/rhpds/openshift-days-ops-showroom/main/support/memory-hog.yamlWait for it to run:
oc get pods -wPress Ctrl+C when the pod shows Running.
Check What Resources Were Requested
oc get deployment memory-hog -o jsonpath='{.spec.template.spec.containers[0].resources}' | jq .The app requested 2Gi memory and 500m CPU. That’s a lot of cluster capacity reserved for one pod.
Check What It Actually Uses
If you were logged in as a different user in a previous module, log back in as admin. Console: Username {openshift_cluster_admin_username} / Password {openshift_cluster_admin_password}
|
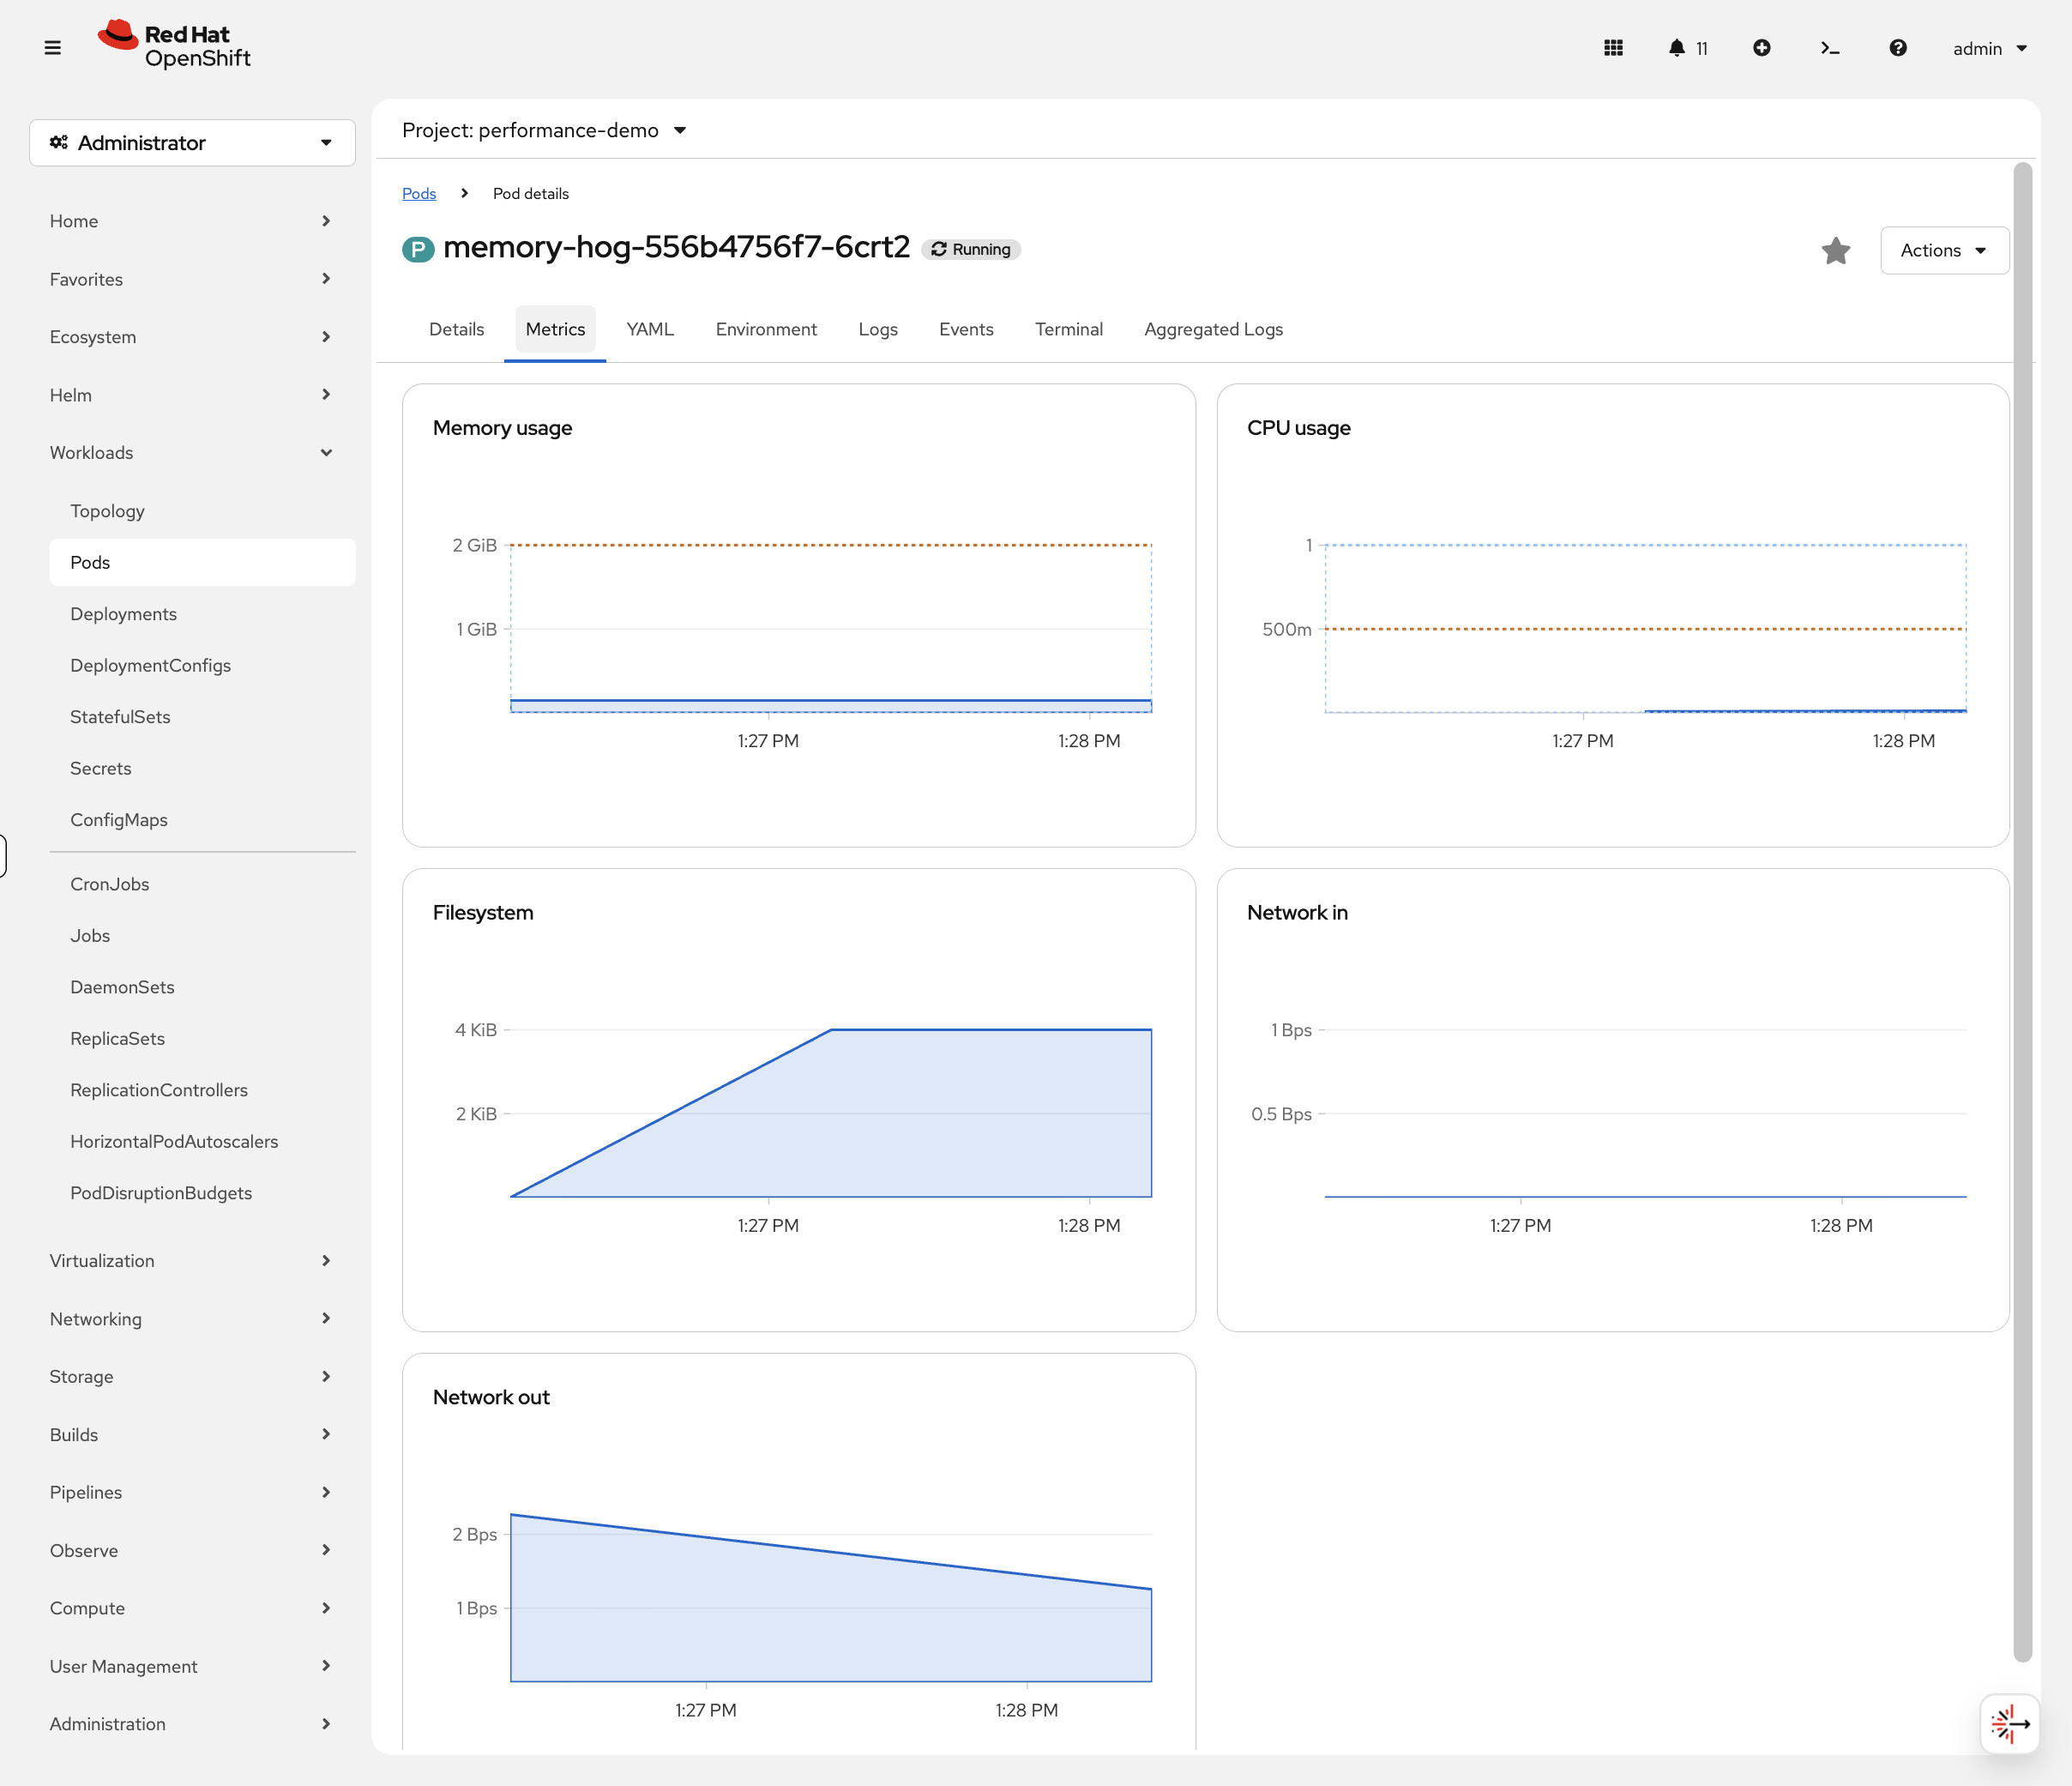
Wait for metrics to become available (~60 seconds after pod starts). While you wait, switch to the OCP Console tab and navigate to Workloads → Pods (project: performance-demo). Click the pod name and look at the Metrics tab - you can watch memory usage populate in real-time. CPU will be near zero since this app barely uses any.
echo "Waiting 60s for metrics to populate..."
sleep 60
oc adm top pod -l app=memory-hog
The app is using far less memory than the 2Gi it reserved — the exact number will vary but it’s typically well under 200Mi. That’s over 1.8Gi of wasted capacity that other pods can’t use!
Part 2: Right-Size with VPA
The Vertical Pod Autoscaler analyzes actual usage and recommends correct resource values.
Install VPA (if needed)
Check if VPA is installed:
oc get pods -n openshift-vertical-pod-autoscalerIf not installed:
oc apply -f https://raw.githubusercontent.com/rhpds/openshift-days-ops-showroom/main/support/vpa-operator.yamlWait for the operator (~1 minute):
echo "Waiting for VPA operator..."
ELAPSED=0
until oc get csv -n openshift-vertical-pod-autoscaler 2>/dev/null | grep -q Succeeded; do
  sleep 10; ELAPSED=$((ELAPSED+10))
  [ $ELAPSED -ge 180 ] && echo "ERROR: Timed out - check 'oc get csv -n openshift-vertical-pod-autoscaler'" && break
done
echo "Waiting for VPA CRD to register..."
until oc get crd verticalpodautoscalers.autoscaling.k8s.io 2>/dev/null; do
  sleep 5; ELAPSED=$((ELAPSED+5))
  [ $ELAPSED -ge 240 ] && echo "ERROR: Timed out waiting for CRD" && break
done
echo "VPA operator ready"
Get VPA Recommendations
Create a VPA resource targeting the memory-hog deployment. We’re using updateMode: "Off" - this means VPA will only recommend values, it won’t change your pods. In production, you’d start with Off to validate recommendations, then switch to Auto to let VPA resize pods automatically during restarts.
oc apply -f https://raw.githubusercontent.com/rhpds/openshift-days-ops-showroom/main/support/vpa-memory-hog.yamlWait for VPA to analyze the pod and produce a recommendation:
echo "Waiting for VPA recommendation..."
ELAPSED=0
until oc get vpa memory-hog-vpa -o jsonpath='{.status.recommendation}' 2>/dev/null | grep -q containerRecommendations; do
  sleep 10; ELAPSED=$((ELAPSED+10))
  [ $ELAPSED -ge 120 ] && echo "ERROR: Timed out - VPA may need more time, try running this block again" && break
done
oc get vpa memory-hog-vpa
You should see output like:
NAME             MODE   CPU   MEM       PROVIDED   AGE
memory-hog-vpa   Off    35m   262144k   True       2m
View the detailed recommendation:
oc get vpa memory-hog-vpa -o jsonpath='{.status.recommendation.containerRecommendations[0]}' | jq .You should see output similar to:
{
  "containerName": "memory-hog",
  "lowerBound": { "cpu": "25m", "memory": "262144k" },
  "target": { "cpu": "35m", "memory": "262144k" },
  "uncappedTarget": { "cpu": "35m", "memory": "262144k" },
  "upperBound": { "cpu": "500m", "memory": "512Mi" }
}
VPA recommends ~256Mi memory instead of the 2Gi requested. That’s based on actual observed usage - not guesswork.
Apply the Right-Sized Resources
oc patch deployment memory-hog --type=json -p='[
  {"op": "replace", "path": "/spec/template/spec/containers/0/resources/requests/memory", "value": "256Mi"},
  {"op": "replace", "path": "/spec/template/spec/containers/0/resources/limits/memory", "value": "512Mi"},
  {"op": "replace", "path": "/spec/template/spec/containers/0/resources/requests/cpu", "value": "50m"},
  {"op": "replace", "path": "/spec/template/spec/containers/0/resources/limits/cpu", "value": "200m"}
]'
Verify the Savings
oc get deployment memory-hog -o jsonpath='{.spec.template.spec.containers[0].resources}' | jq .Result: You just freed up 1.75Gi of memory and 450m of CPU that other workloads can now use. Multiply this across hundreds of pods and you’ve potentially saved significant cluster costs.
Part 3: Handle Variable Load with HPA
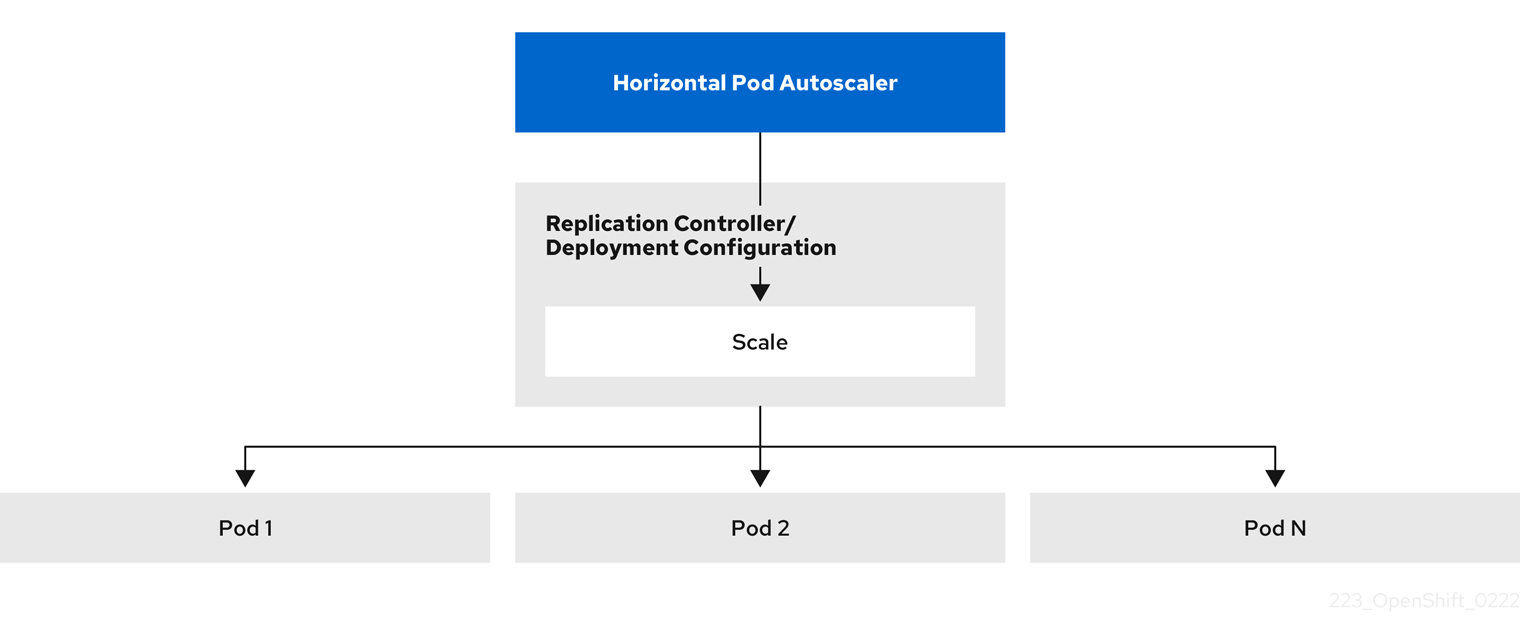
Now let’s deploy an application that needs to scale horizontally based on traffic.
Deploy a Scalable Application
oc apply -f https://raw.githubusercontent.com/rhpds/openshift-days-ops-showroom/main/support/demo-app.yamlWait for it to be ready:
oc rollout status deployment/demo-app --timeout=120sCreate an HPA
Configure automatic scaling when CPU exceeds 50%. Why 50%? Lower targets mean pods scale sooner (more responsive, higher cost). Higher targets pack pods tighter (saves resources, slower reaction). 50% is a common starting point - tune it based on your app’s latency requirements.
oc autoscale deployment demo-app --min=1 --max=5 --cpu-percent=50Check the HPA:
oc get hpa demo-appYou should see:
NAME       REFERENCE             TARGETS              MINPODS   MAXPODS   REPLICAS   AGE
demo-app   Deployment/demo-app   cpu: <unknown>/50%   1         5         1          10s
The <unknown> target is normal - it takes about a minute for the metrics server to start reporting CPU usage for the new pod.
You can view the HPA in the console at Workloads > HorizontalPodAutoscalers (project: performance-demo) - it shows current vs target CPU percentage and the current replica count in real-time.
|
Generate Load
Open a second terminal or run this in the background:
oc run load-generator --image=registry.access.redhat.com/ubi9/ubi-minimal --restart=Never -- /bin/sh -c "while true; do curl -s -o /dev/null http://demo-app:8080; done"Watch the Autoscaling
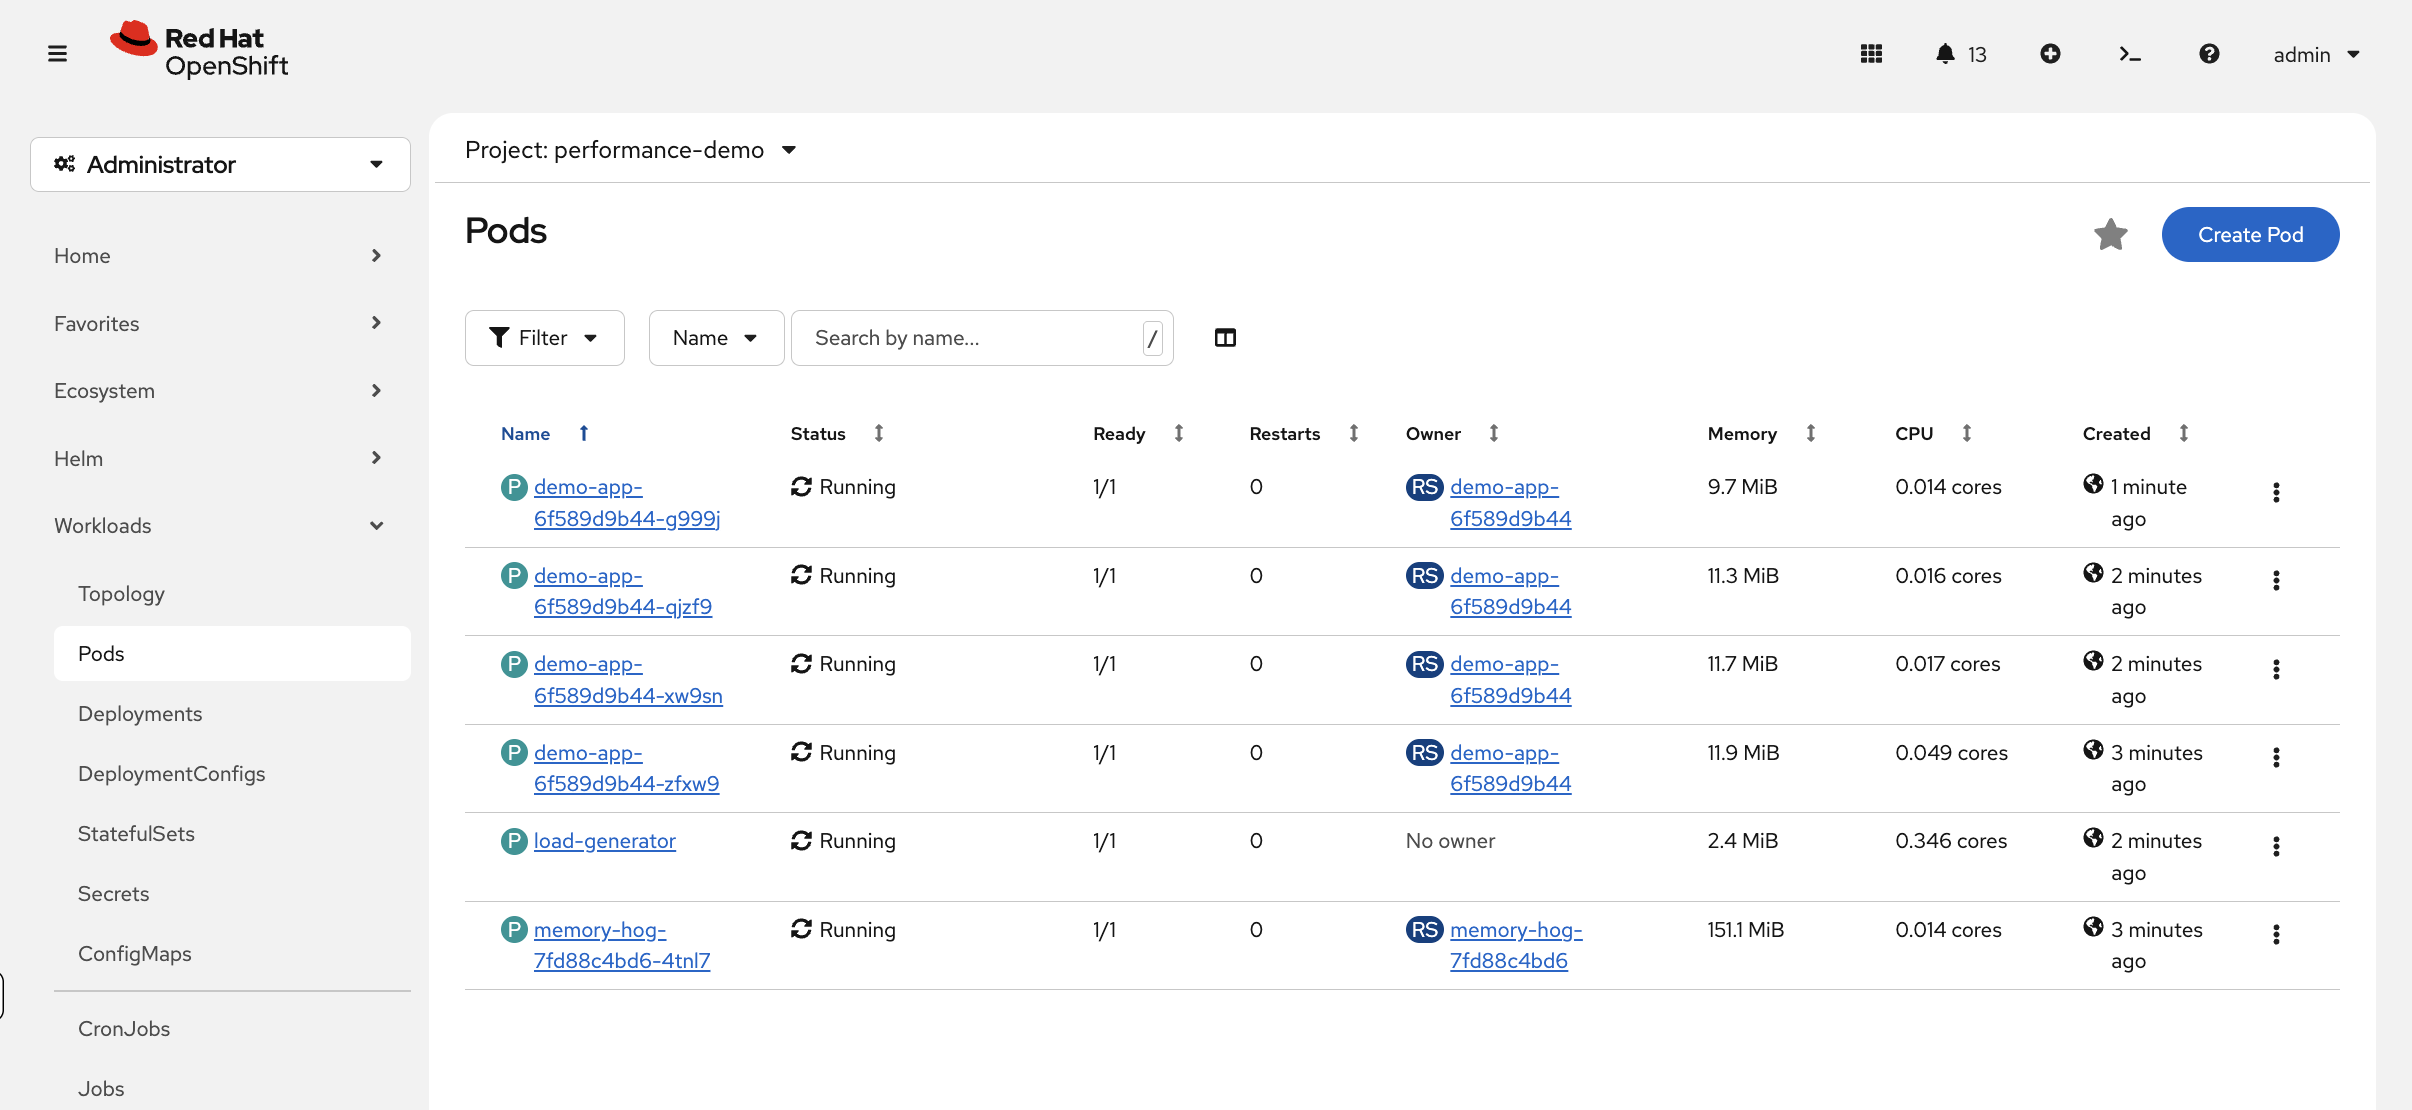
While the load generator runs, navigate to Workloads → Pods (project: performance-demo) in the console and watch new pods appear as the HPA scales up — this is the autoscaler in action.
Then navigate to Observe → Dashboards, select Kubernetes / Compute Resources / Namespace (Pods) and choose project performance-demo. You’ll see the load distributed across multiple pods in the CPU Quota table — each demo-app pod using ~40-50% CPU, with the load-generator pod consuming the most. The CPU Utilisation (from requests) percentage at the top will be well over 100% because total usage exceeds what was originally requested for a single pod.
You can also watch via CLI:
oc get hpa demo-app -wWatch the REPLICAS column and TARGETS column. The HPA may have already scaled up by the time you run this — if you see 2-4 replicas and CPU near 50%, the autoscaler has already responded. Press Ctrl+C to continue.
Verify pods scaled:
oc get pods -l app=demo-appPart 4: Make a Capacity Decision
You’ve right-sized one app with VPA and auto-scaled another with HPA. Now look at the bigger picture:
oc adm top nodesLook at the memory percentages across your nodes. In the OCP Console, navigate to Observe → Dashboards and select Kubernetes / Compute Resources / Namespace (Pods), then choose project performance-demo:
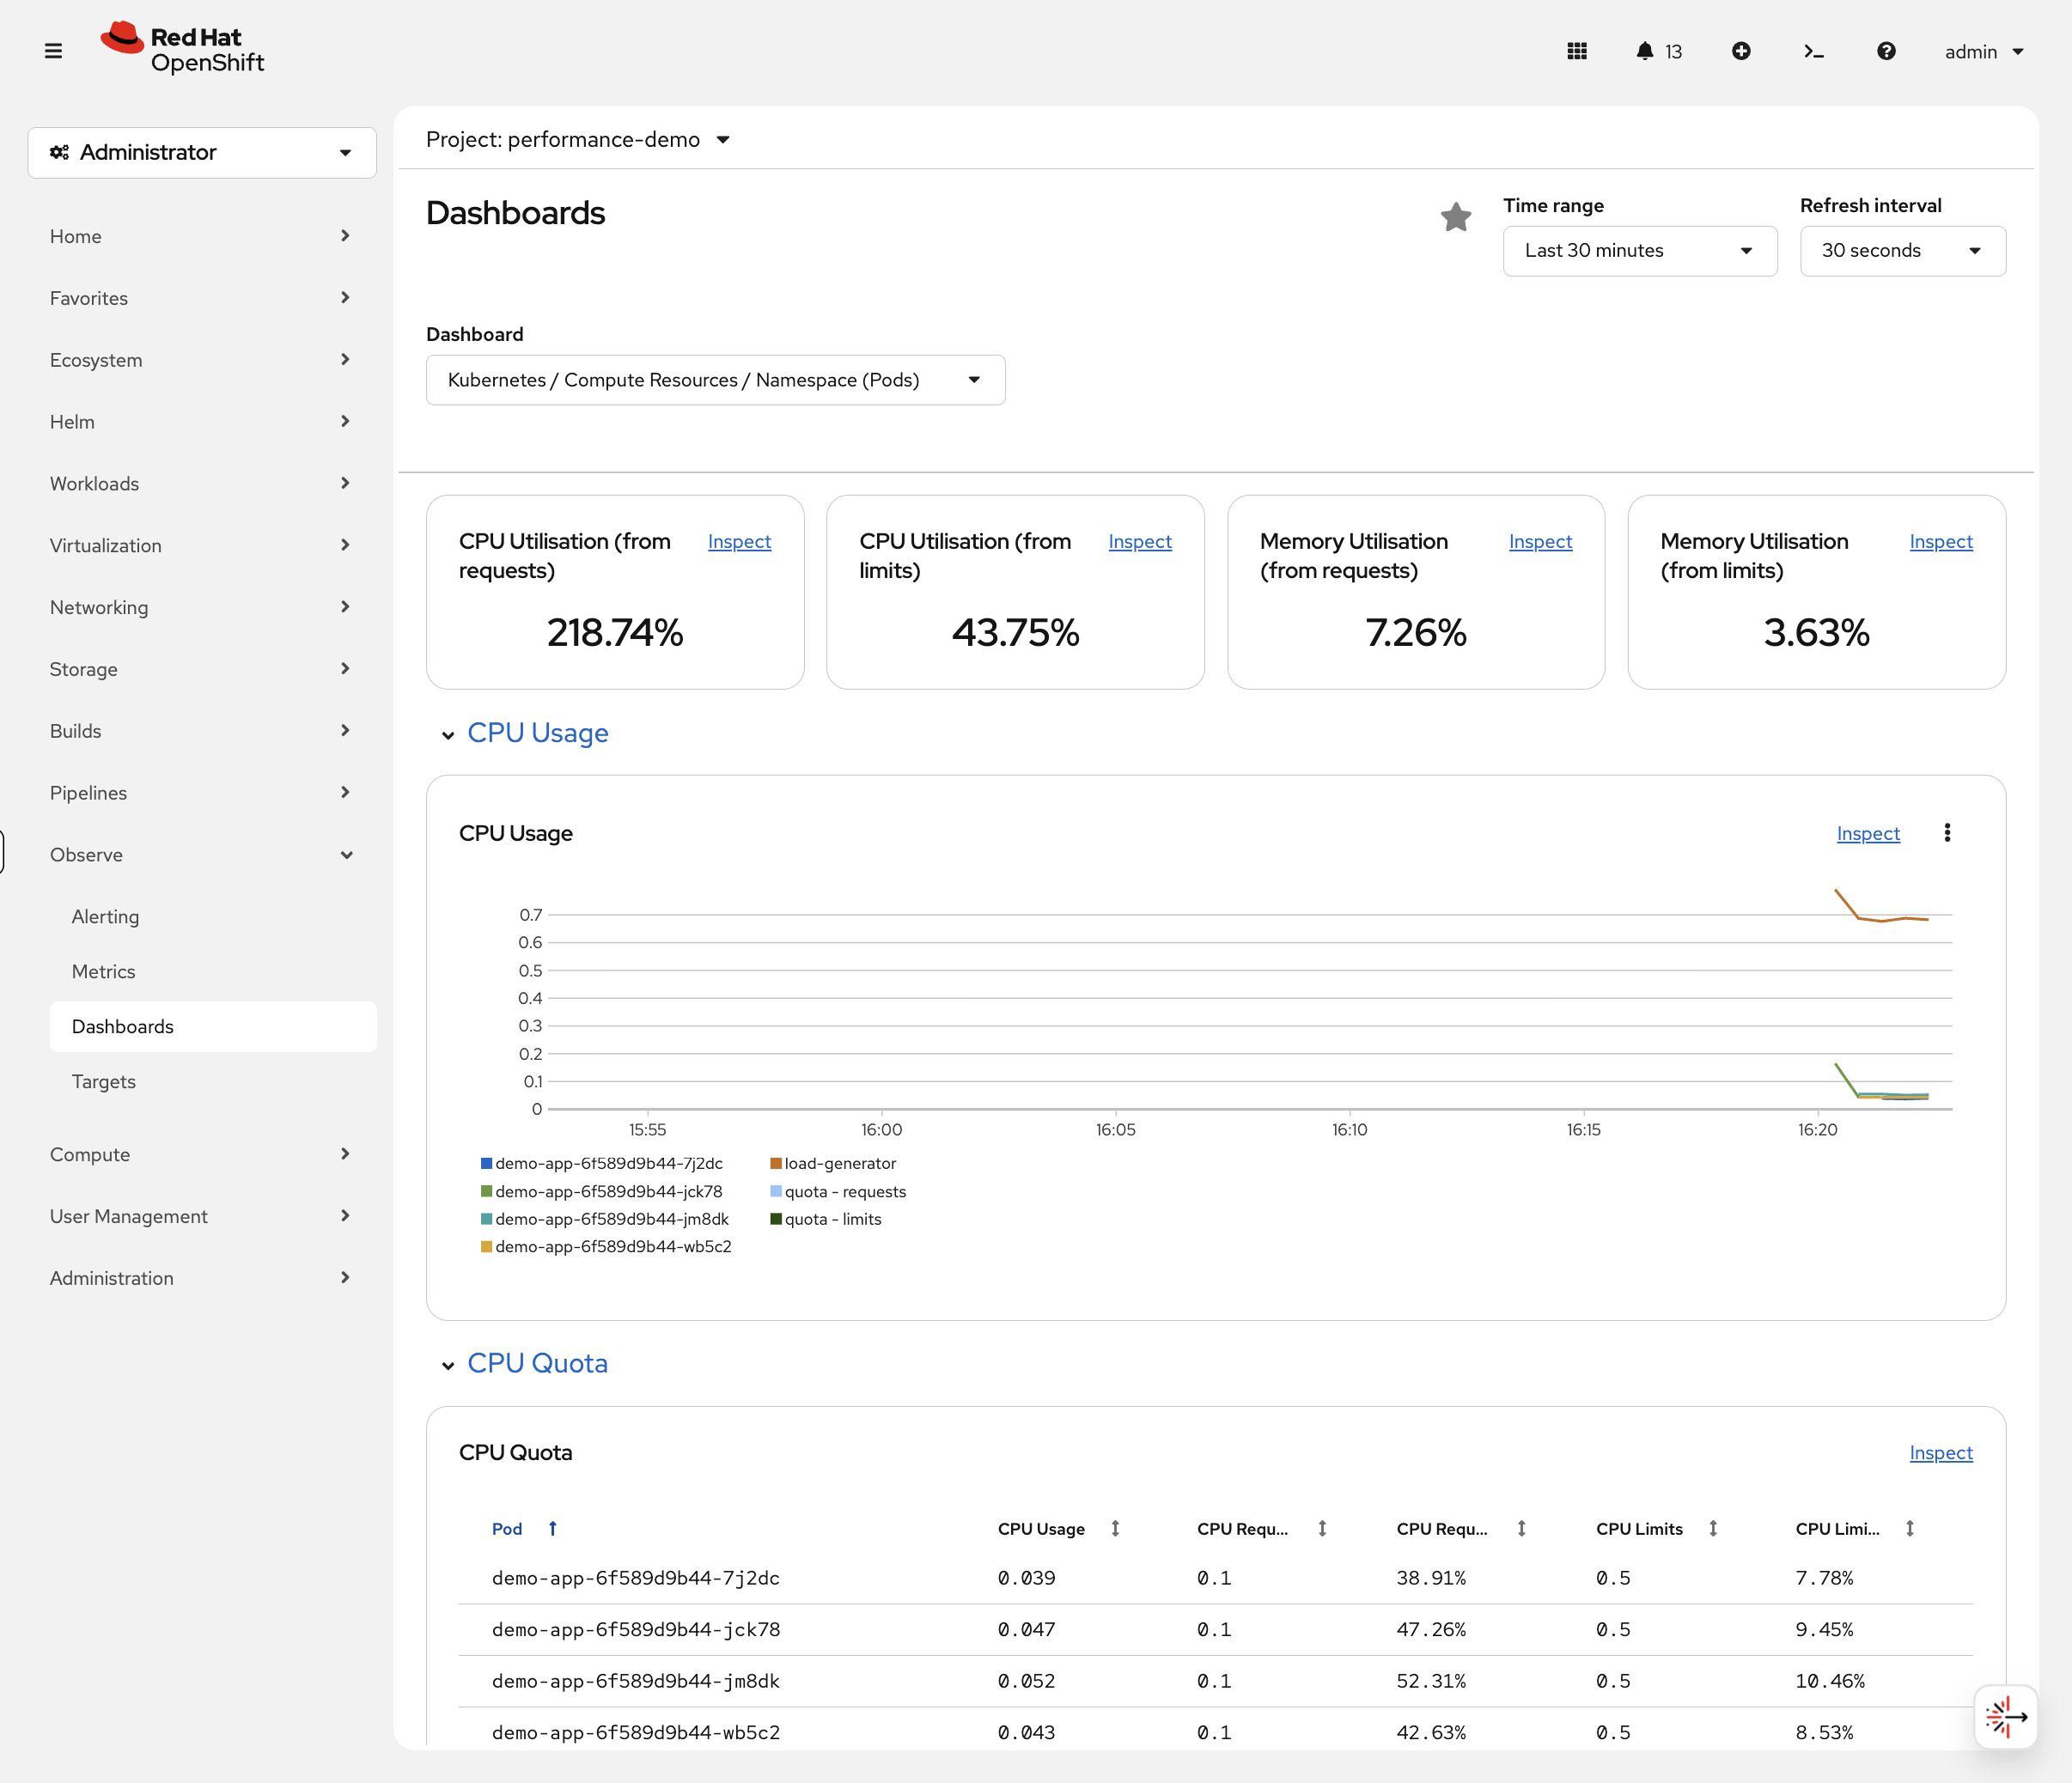
The graphs show how your HPA scaling event looked over time. The CPU Utilisation (from requests) at the top shows the namespace total — all pods combined are using ~200% of their total CPU requests because the load generator is consuming significantly more than it requested. The CPU Quota table below shows each individual pod’s actual usage vs its requests and limits — you can see the demo-app pods each sitting at ~40-55% CPU after HPA distributed the load across 4 replicas.
This is how you’d answer the question in a capacity review: "Do we need more nodes, or are our apps just over-provisioned?" In many clusters, VPA alone frees enough capacity to avoid buying more infrastructure.
Cleanup & Takeaways
oc delete project performance-demoKey Takeaways
| Tool | When to Use |
|---|---|
VPA |
Right-size resources based on actual usage (use |
HPA |
Scale pods horizontally for variable load (set 50-70% CPU target) |
oc adm top |
Quick check of current resource consumption |
Observe → Dashboards |
Historical trends and capacity planning |
The pattern: Don’t guess resources → Use VPA to measure → Apply recommendations → Use HPA for load variation