Developer Hub - Portal Operations
Duration: 30 minutes
Format: Guided exploration + Hands-on
The Problem
How many times a week does someone message you: "Is my app running?" or "Can you create me a namespace?"
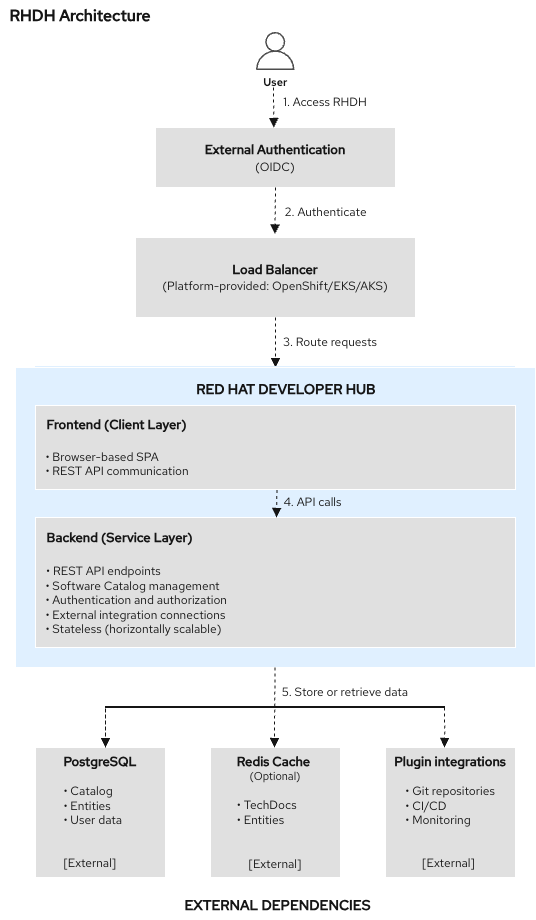
Red Hat Developer Hub (RHDH) is a developer portal based on Backstage. Your platform engineering team has deployed it for this organization, and it’s already in use by multiple teams. As an ops admin, you need to understand what it does, what developers see when they use it, and how the pieces fit together so you can support it.
RHDH gives your organization:
-
Software Catalog - a single place where every service, API, and library is registered. Developers find what exists, who owns it, and what state it’s in - without asking you.
-
Software Templates - self-service workflows that provision namespaces and resources using patterns the platform team defines. Developers get what they need without filing a ticket.
-
Plugins - connect the catalog to live systems (Kubernetes, ArgoCD, Tekton, etc.) so developers see real-time status without needing cluster access.
In this module you’ll explore a live Developer Hub that multiple teams are already using, see what developers see, watch a self-service template in action, and wire up a new service - the kind of task that lands on your desk when a team onboards.
Explore the Developer Portal
Step 1: Access Developer Hub
Click the Developer Hub tab at the top of Showroom. You’ll see the login page - select Guest and click Enter.
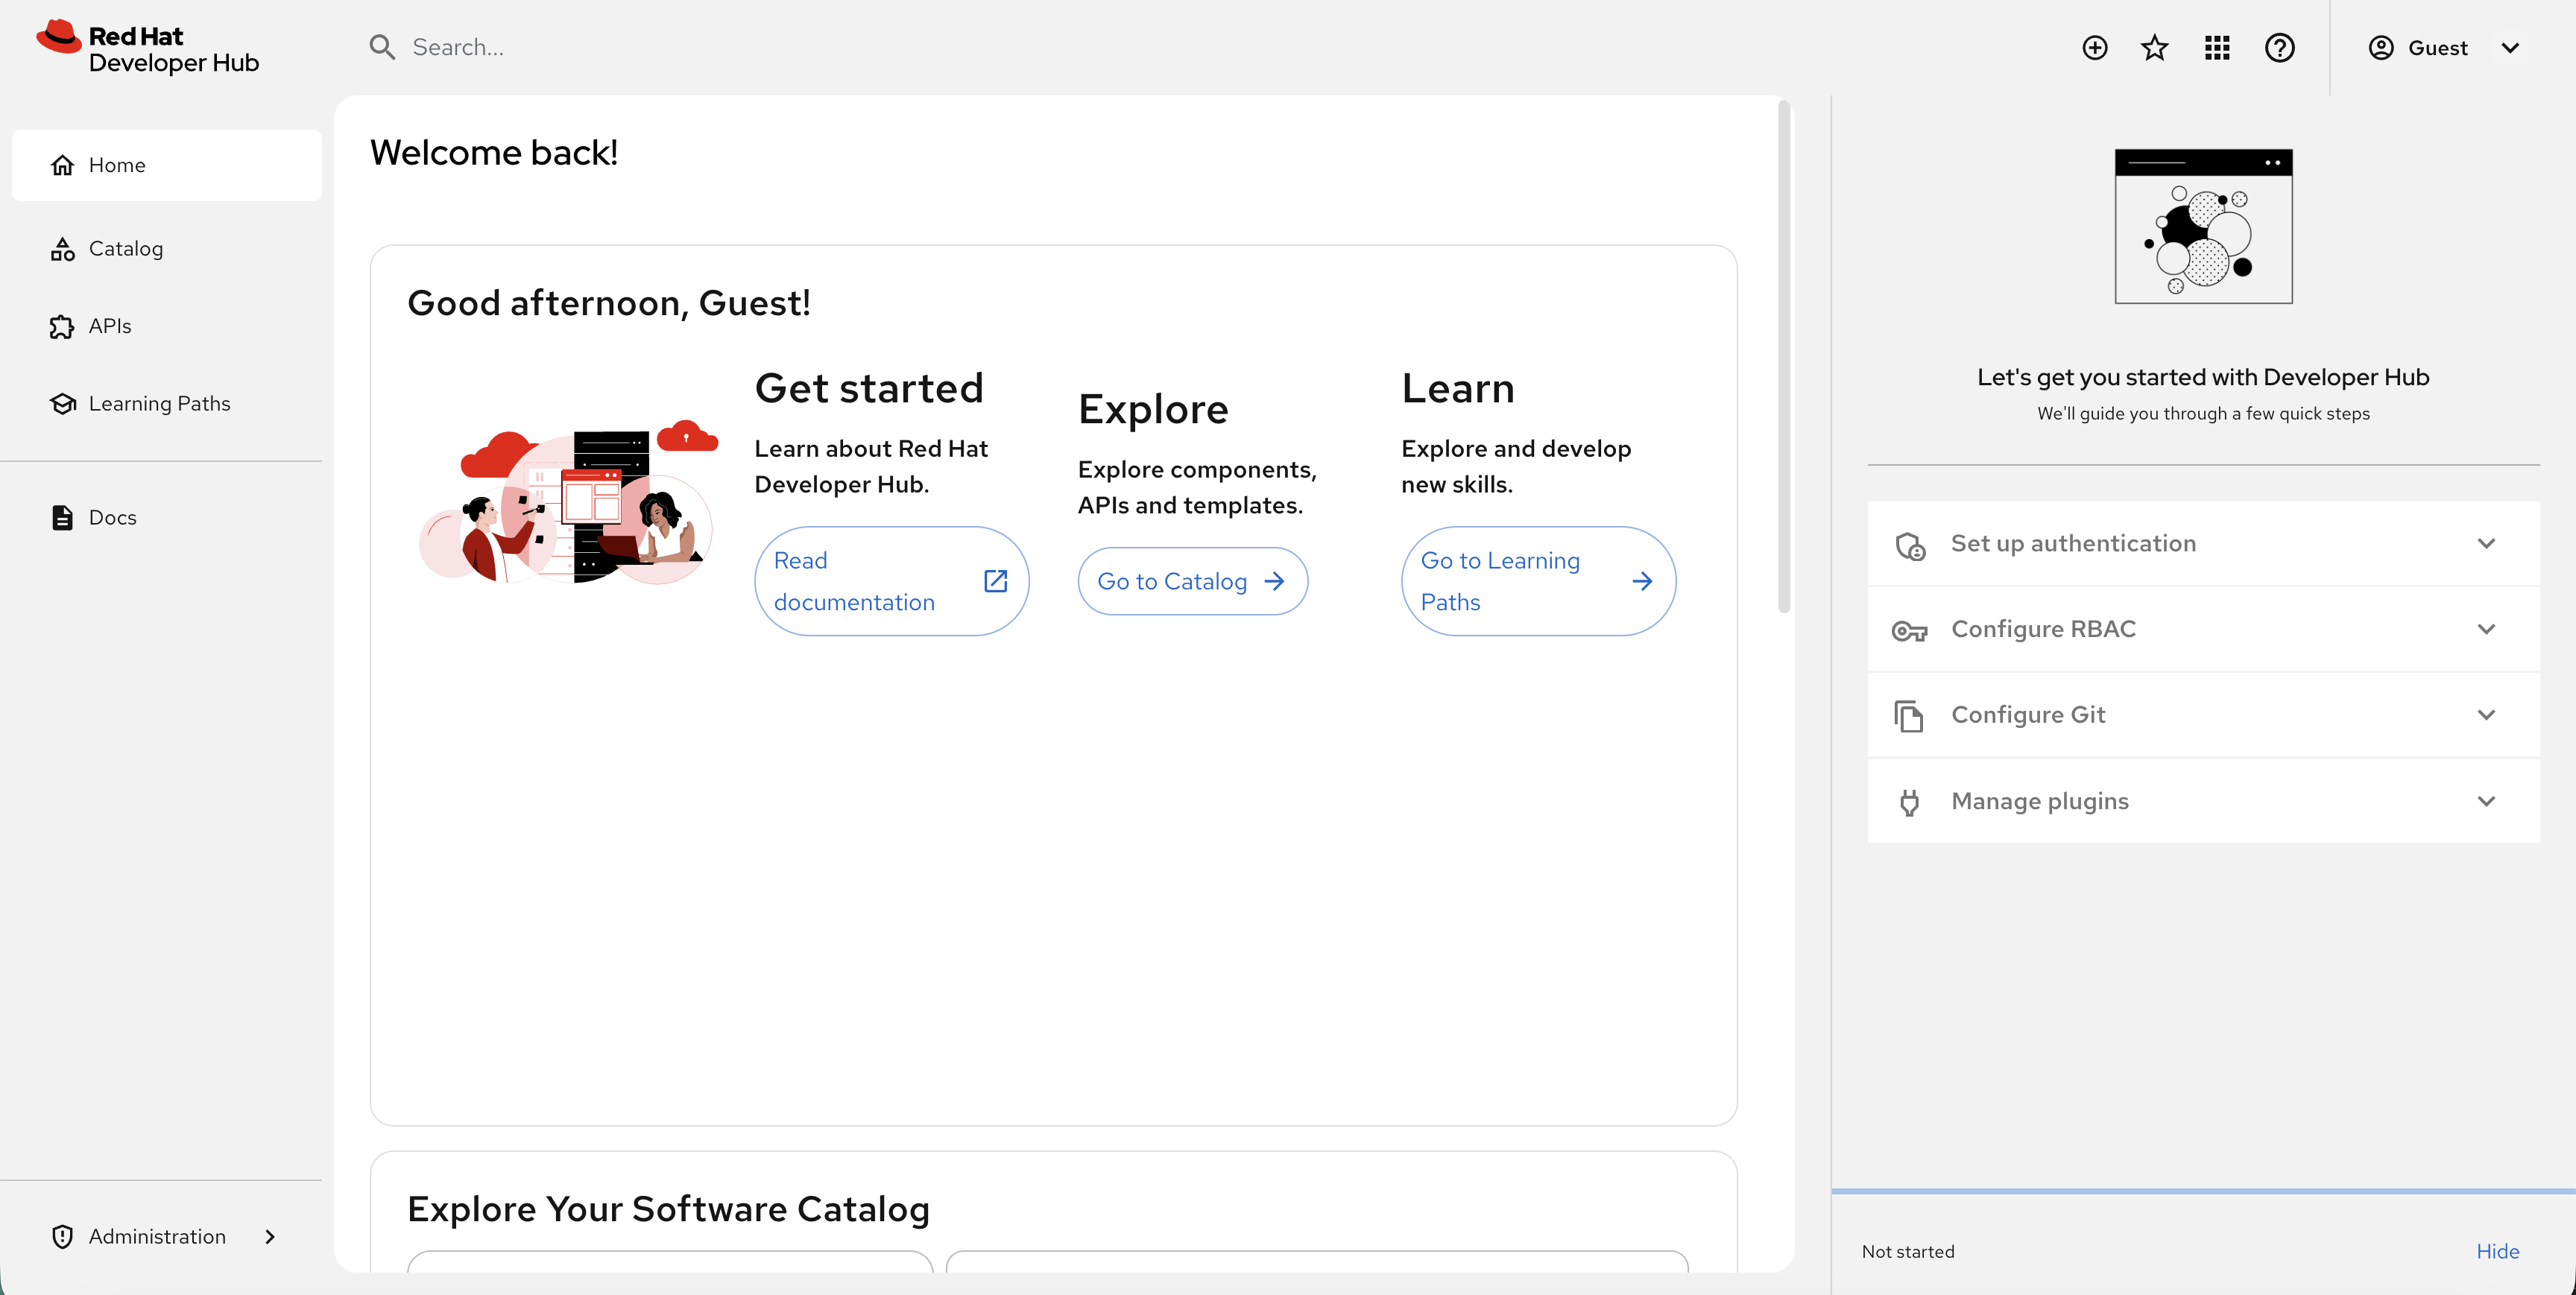
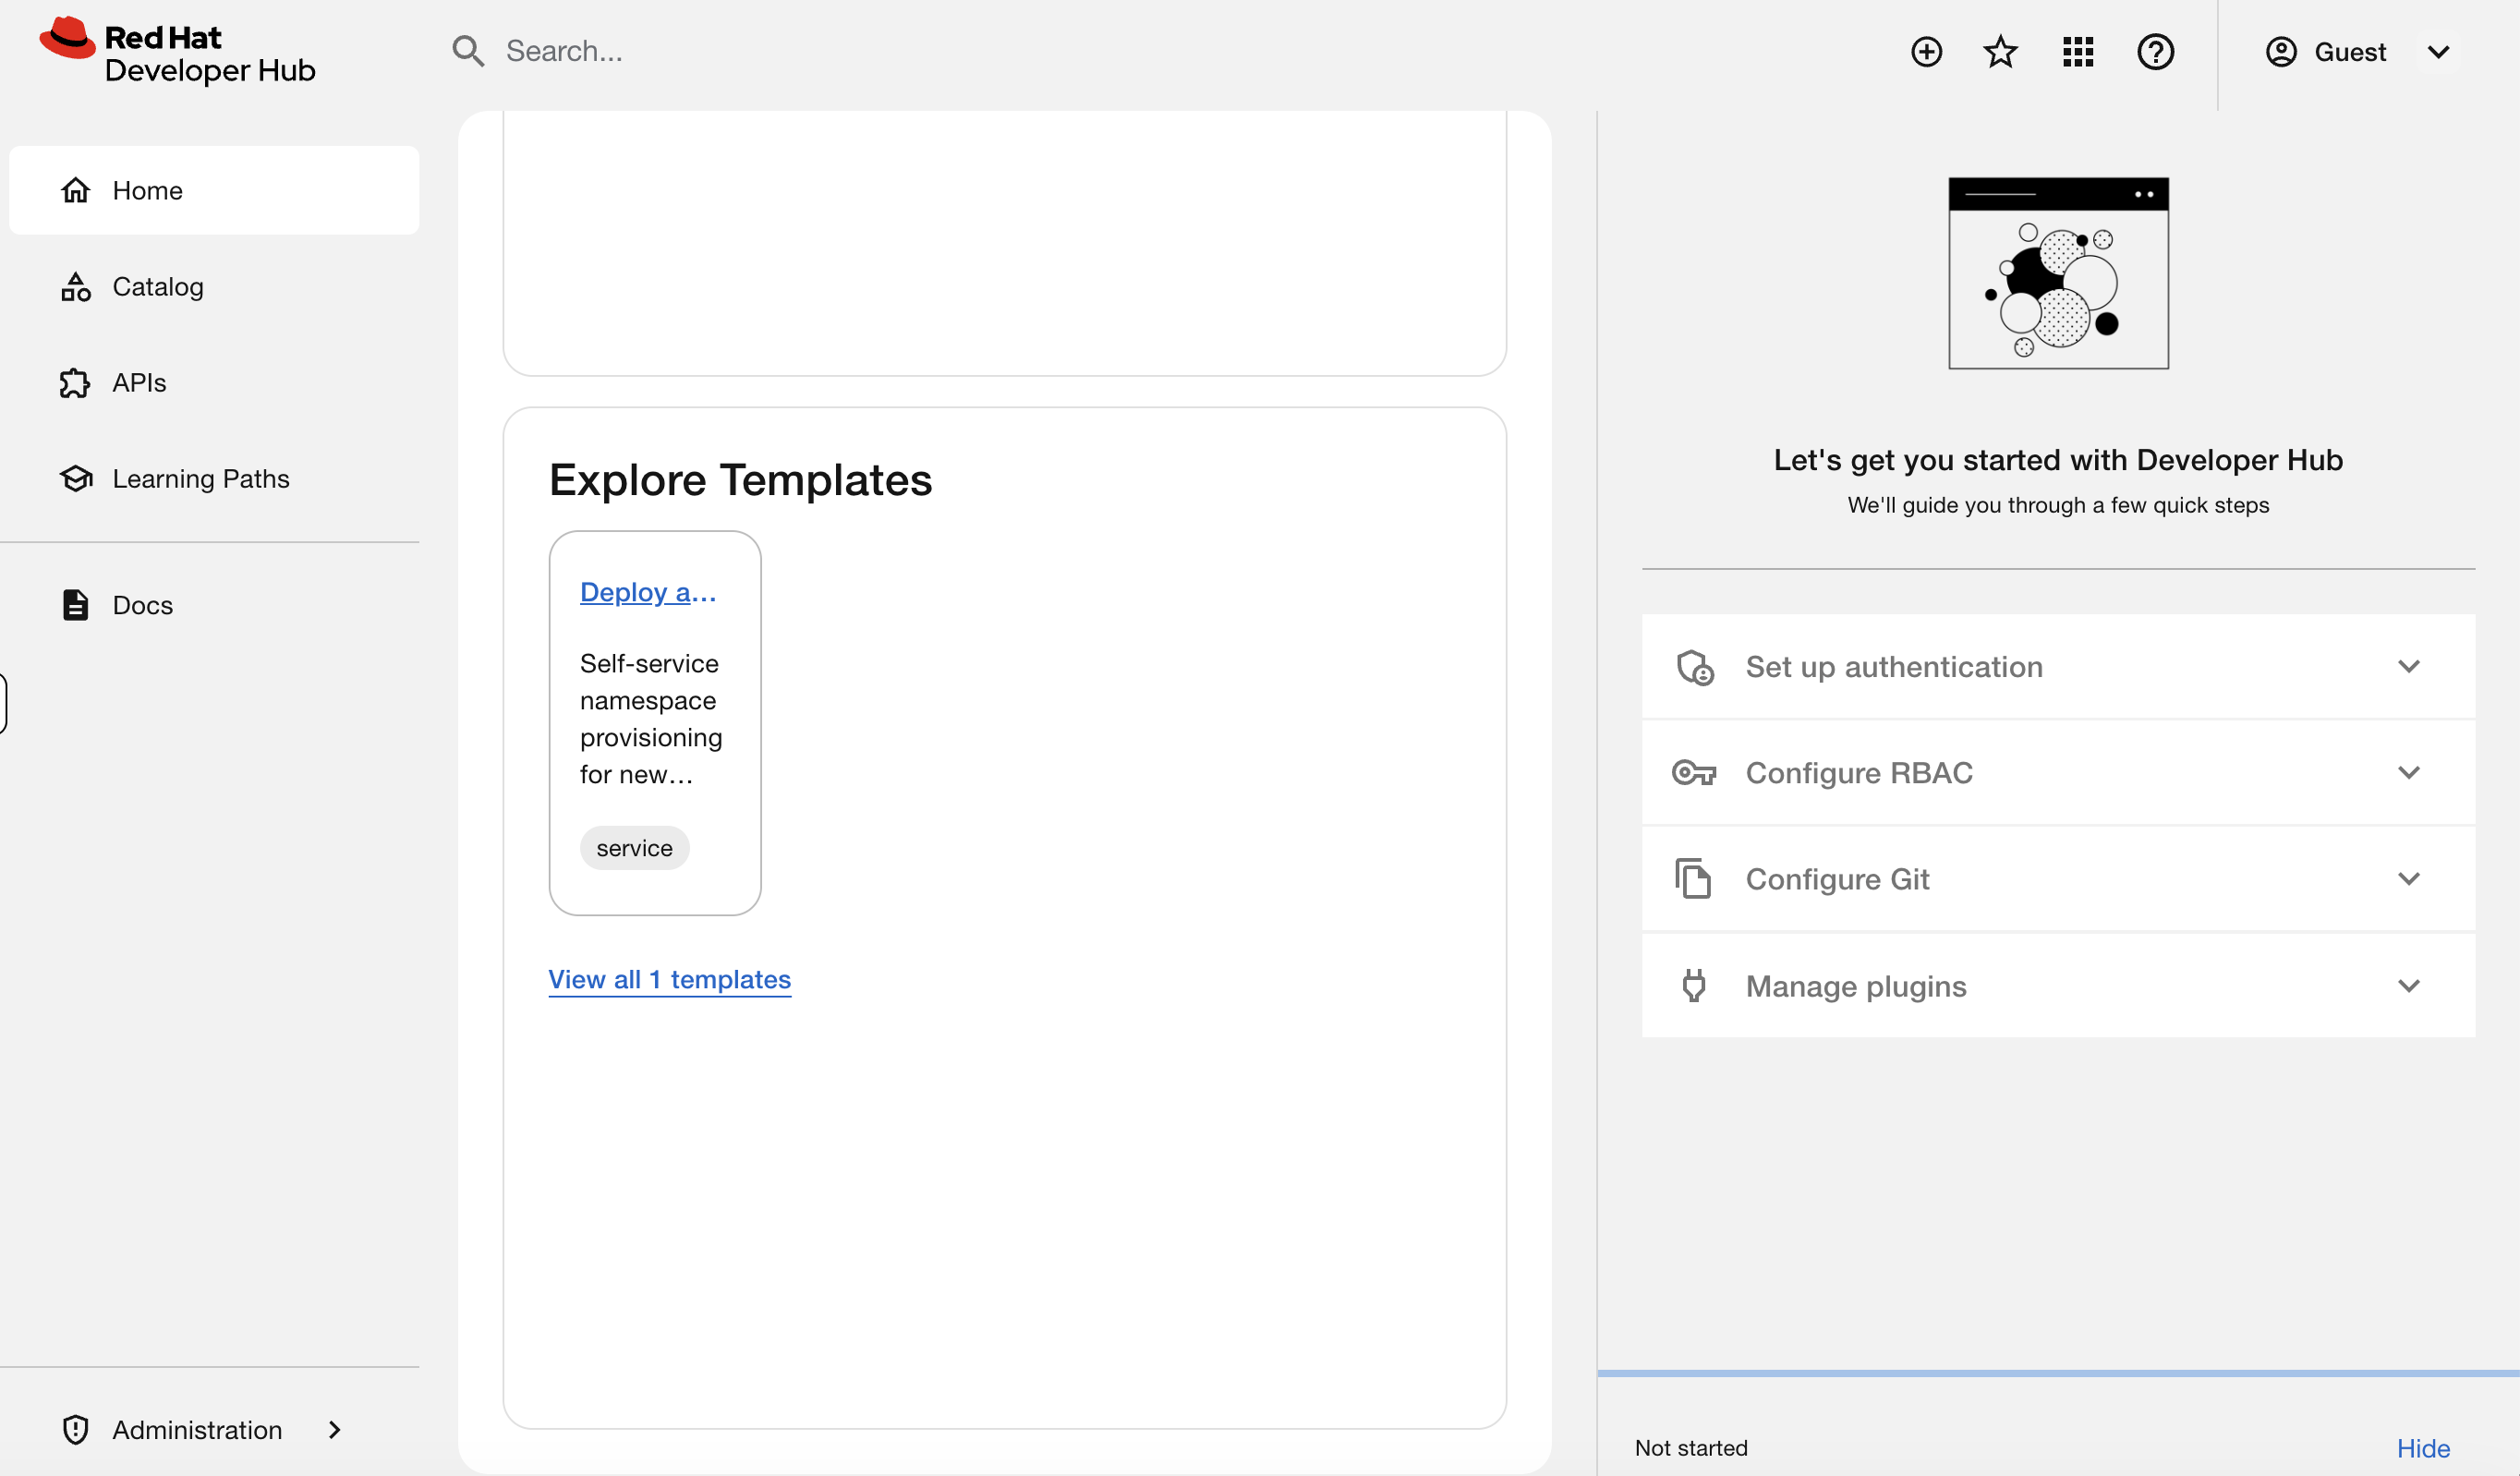
| You may see a "Let’s get you started with Developer Hub" panel on the right side with steps like "Set up authentication" and "Configure RBAC". This is a setup wizard aimed at platform engineers - click Hide at the bottom of that panel to dismiss it. |
Step 2: Browse the Software Catalog
Click Catalog in the left navigation. You’ll see services registered by several teams across your organization:
| Service | Description | Team | Status |
|---|---|---|---|
|
Weather microservices (5 deployments) |
ops-team |
Production |
|
Payment processing (3 deployments) |
payments-team |
Production |
|
Inventory tracking (3 deployments) |
inventory-team |
Production |
|
Centralized alerts |
platform-team |
Production |
|
Order tracking (not yet deployed) |
inventory-team |
Development |
|
OADP-protected application |
ops-team |
Production |
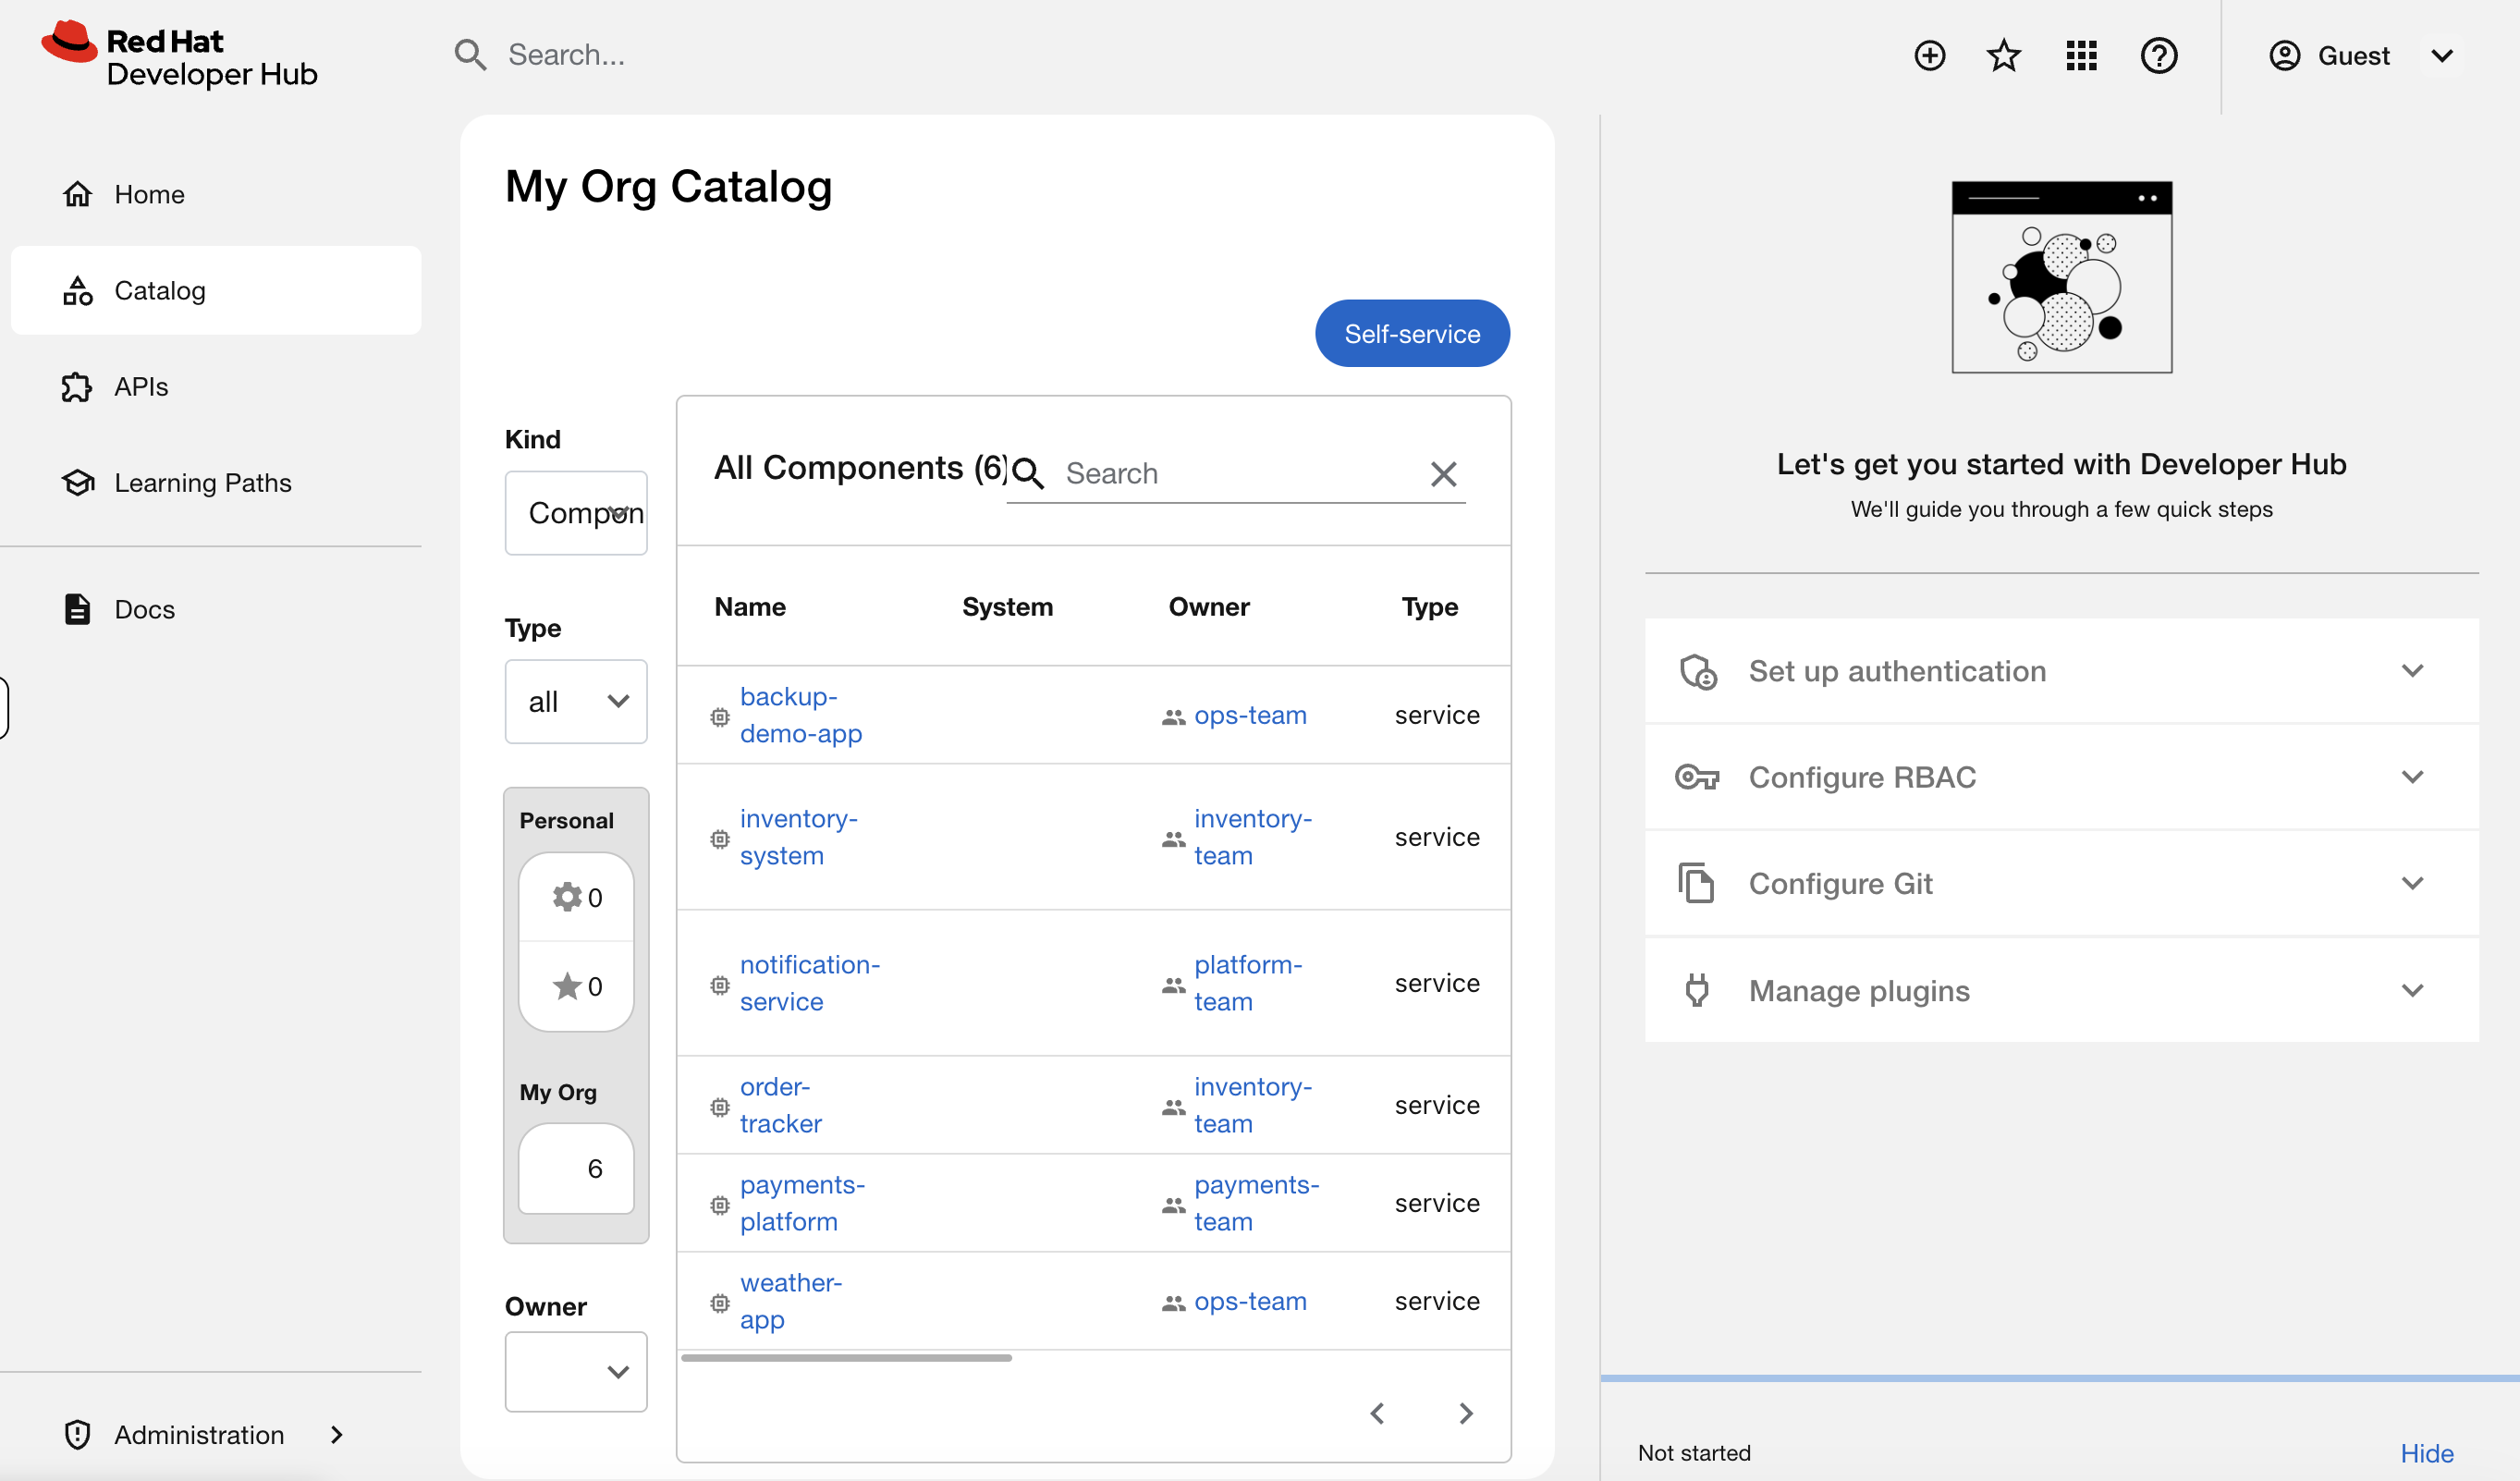
This is what replaces the "who owns this workload?" question. Every service has an owner, a lifecycle stage, and metadata connecting it to the cluster. When a team leaves or a service is deprecated, it’s visible here instead of becoming an orphaned mystery workload.
Step 3: Use the Catalog as an Ops Tool
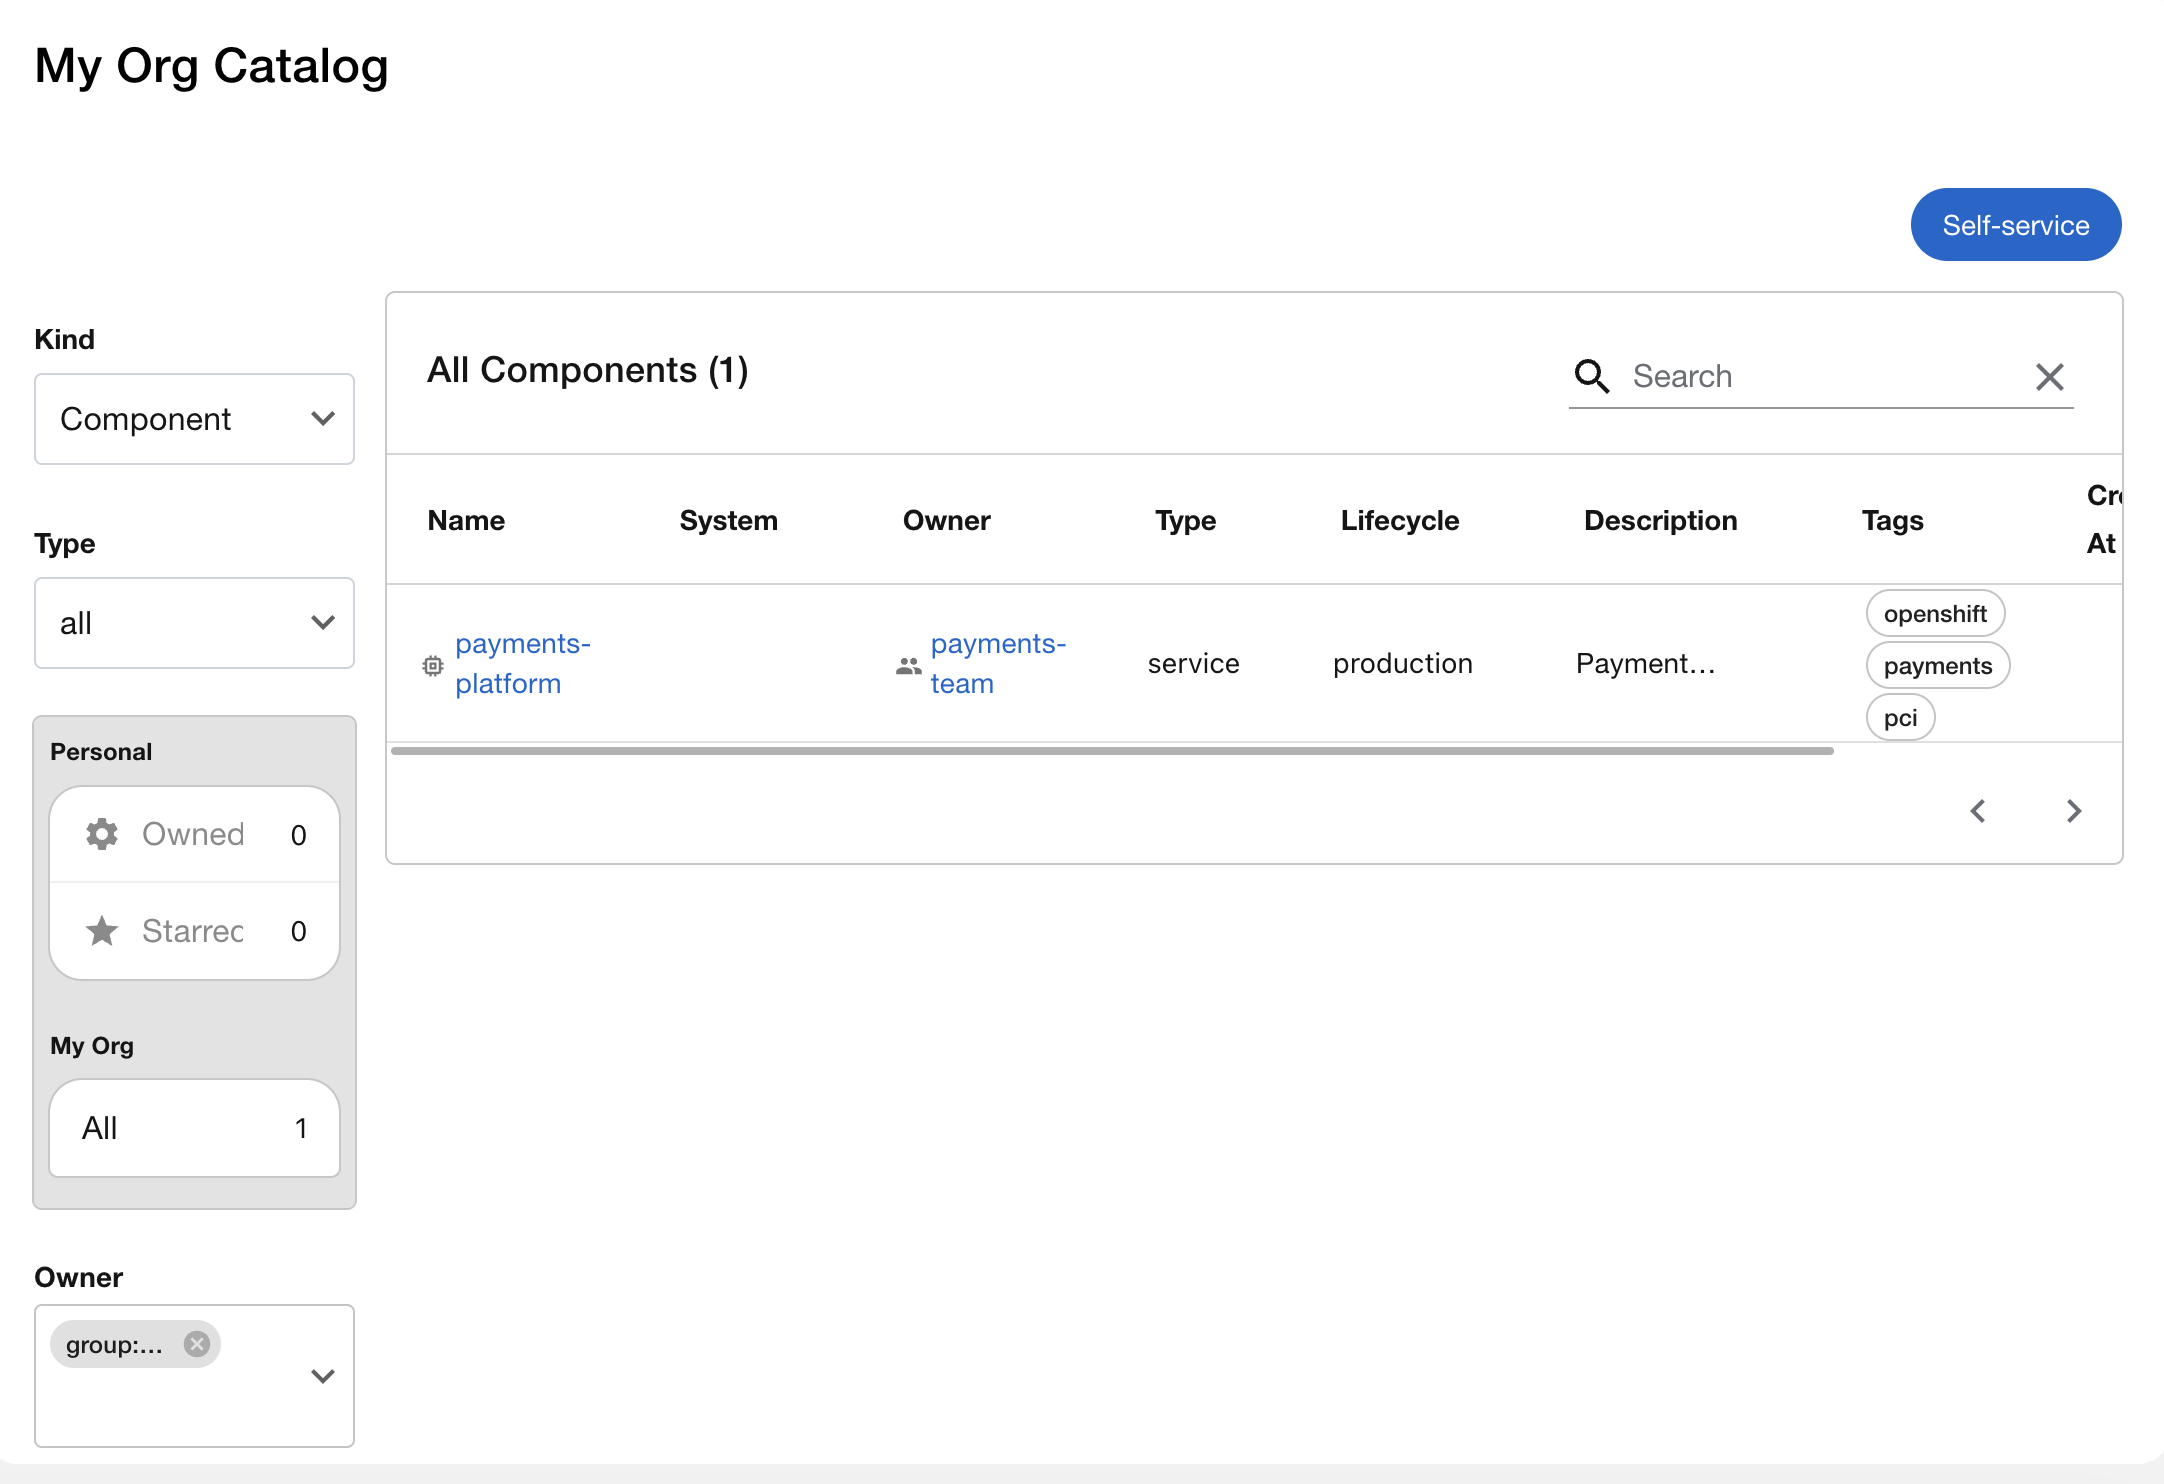
The catalog isn’t just a list - it’s a searchable, filterable inventory. Try using the filters on the left sidebar. If you don’t see the filter options, click the filter icon or expand your browser window wider.
-
Owner dropdown - select
payments-team. The catalog narrows to just their service. "The security team needs a list of everything the payments team runs." Done in two clicks.
-
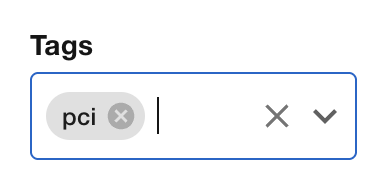
Clear the owner filter, then try Tags - search for
pci. You’ll findpayments-platformtagged for PCI compliance. "Which services fall under PCI audit scope?" One filter.
-
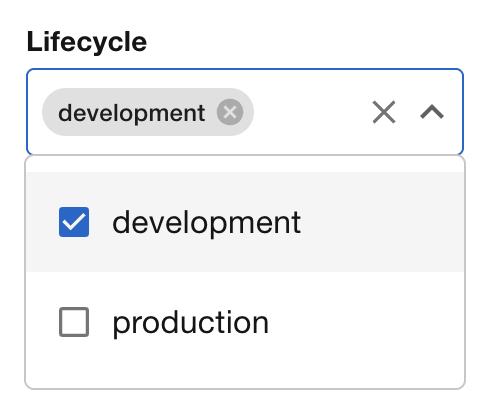
Try Lifecycle - filter for
development. You’ll seeorder-tracker- the only service not yet in production.
In a real organization with hundreds of services, these filters are how you answer questions that used to require searching through namespaces, Slack threads, or tribal knowledge.
Step 4: See Live Kubernetes Data
Clear any filters and click on payments-platform in the catalog. You’ll see the component overview page with owner, lifecycle, and tags.
Now click the Kubernetes tab.
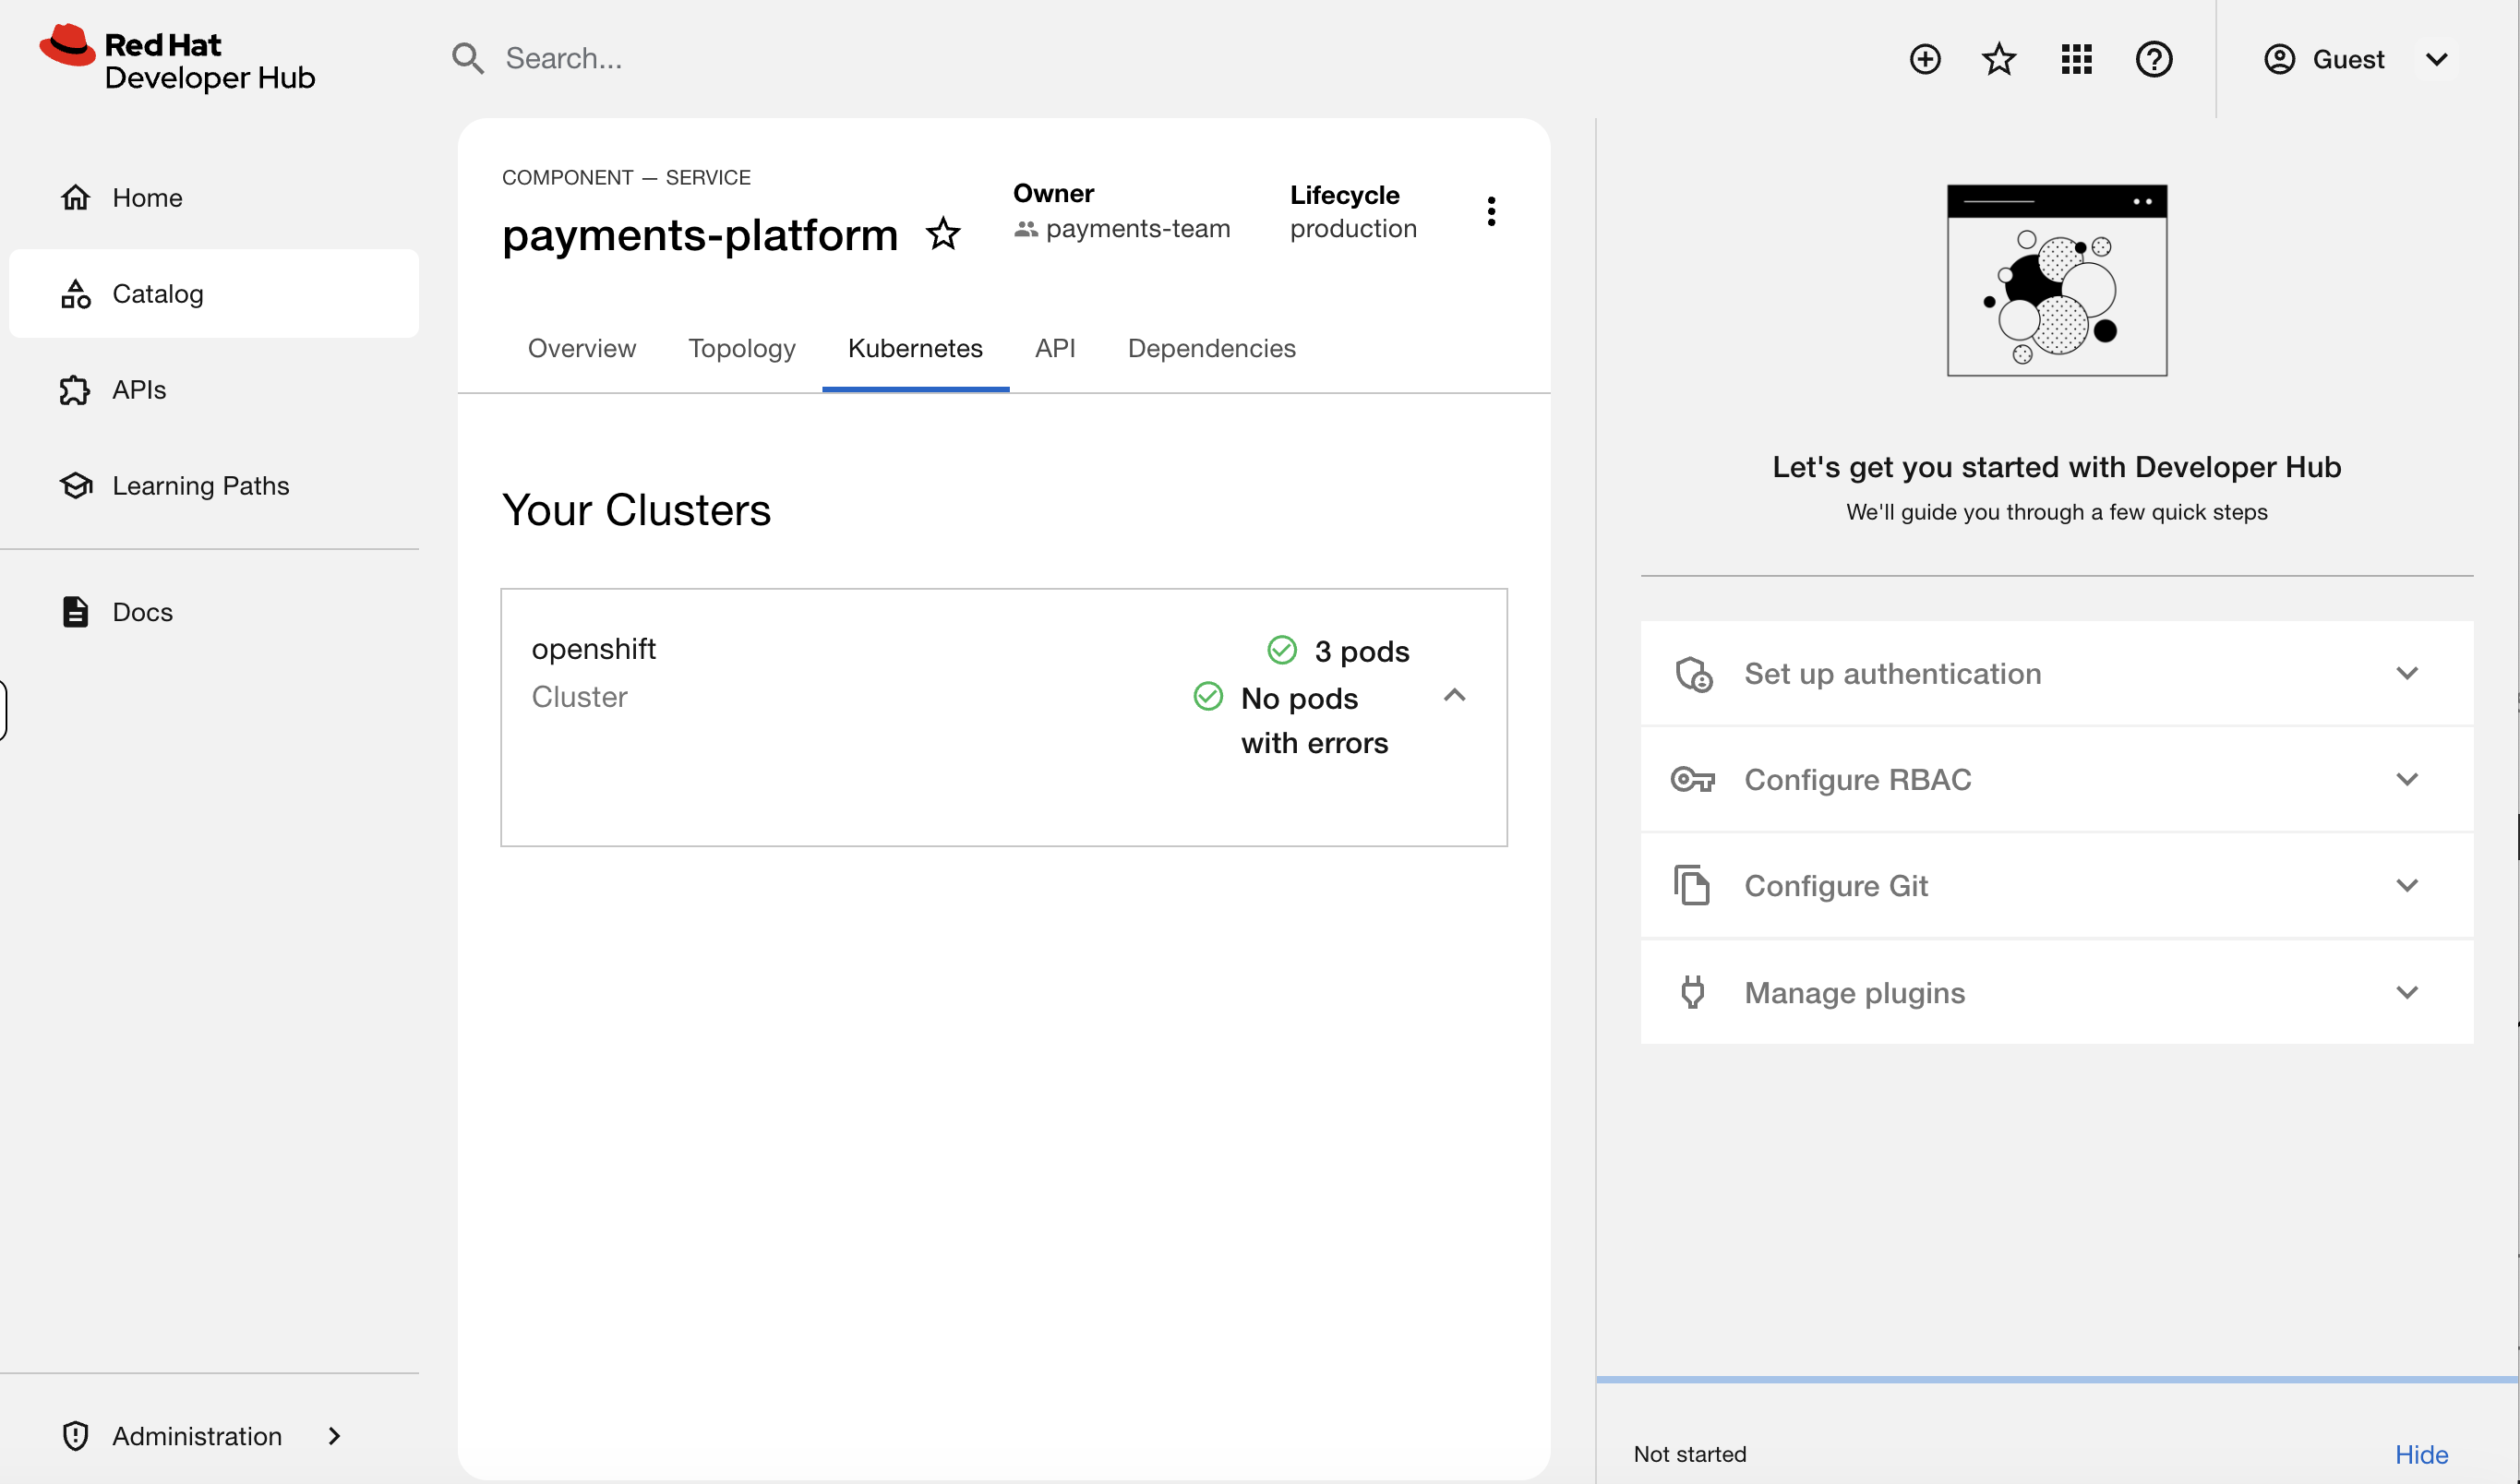
You should see 3 pods running - payments-api, payments-processor, and payments-gateway - with their status, restarts, and age. This data is live from the cluster.
This is the key. A developer clicks their service in the catalog and sees exactly what’s running - pod count, restart history, resource usage - without oc access, without opening a ticket, without messaging you. You didn’t have to do anything for this to work. The platform team configured it once, and every service with the right labels gets this for free.
Try clicking on weather-app and then the Kubernetes tab - you’ll see all 5 weather microservice pods.
Step 5: See What Errors Look Like
Now click on inventory-system in the catalog and check its Kubernetes tab.
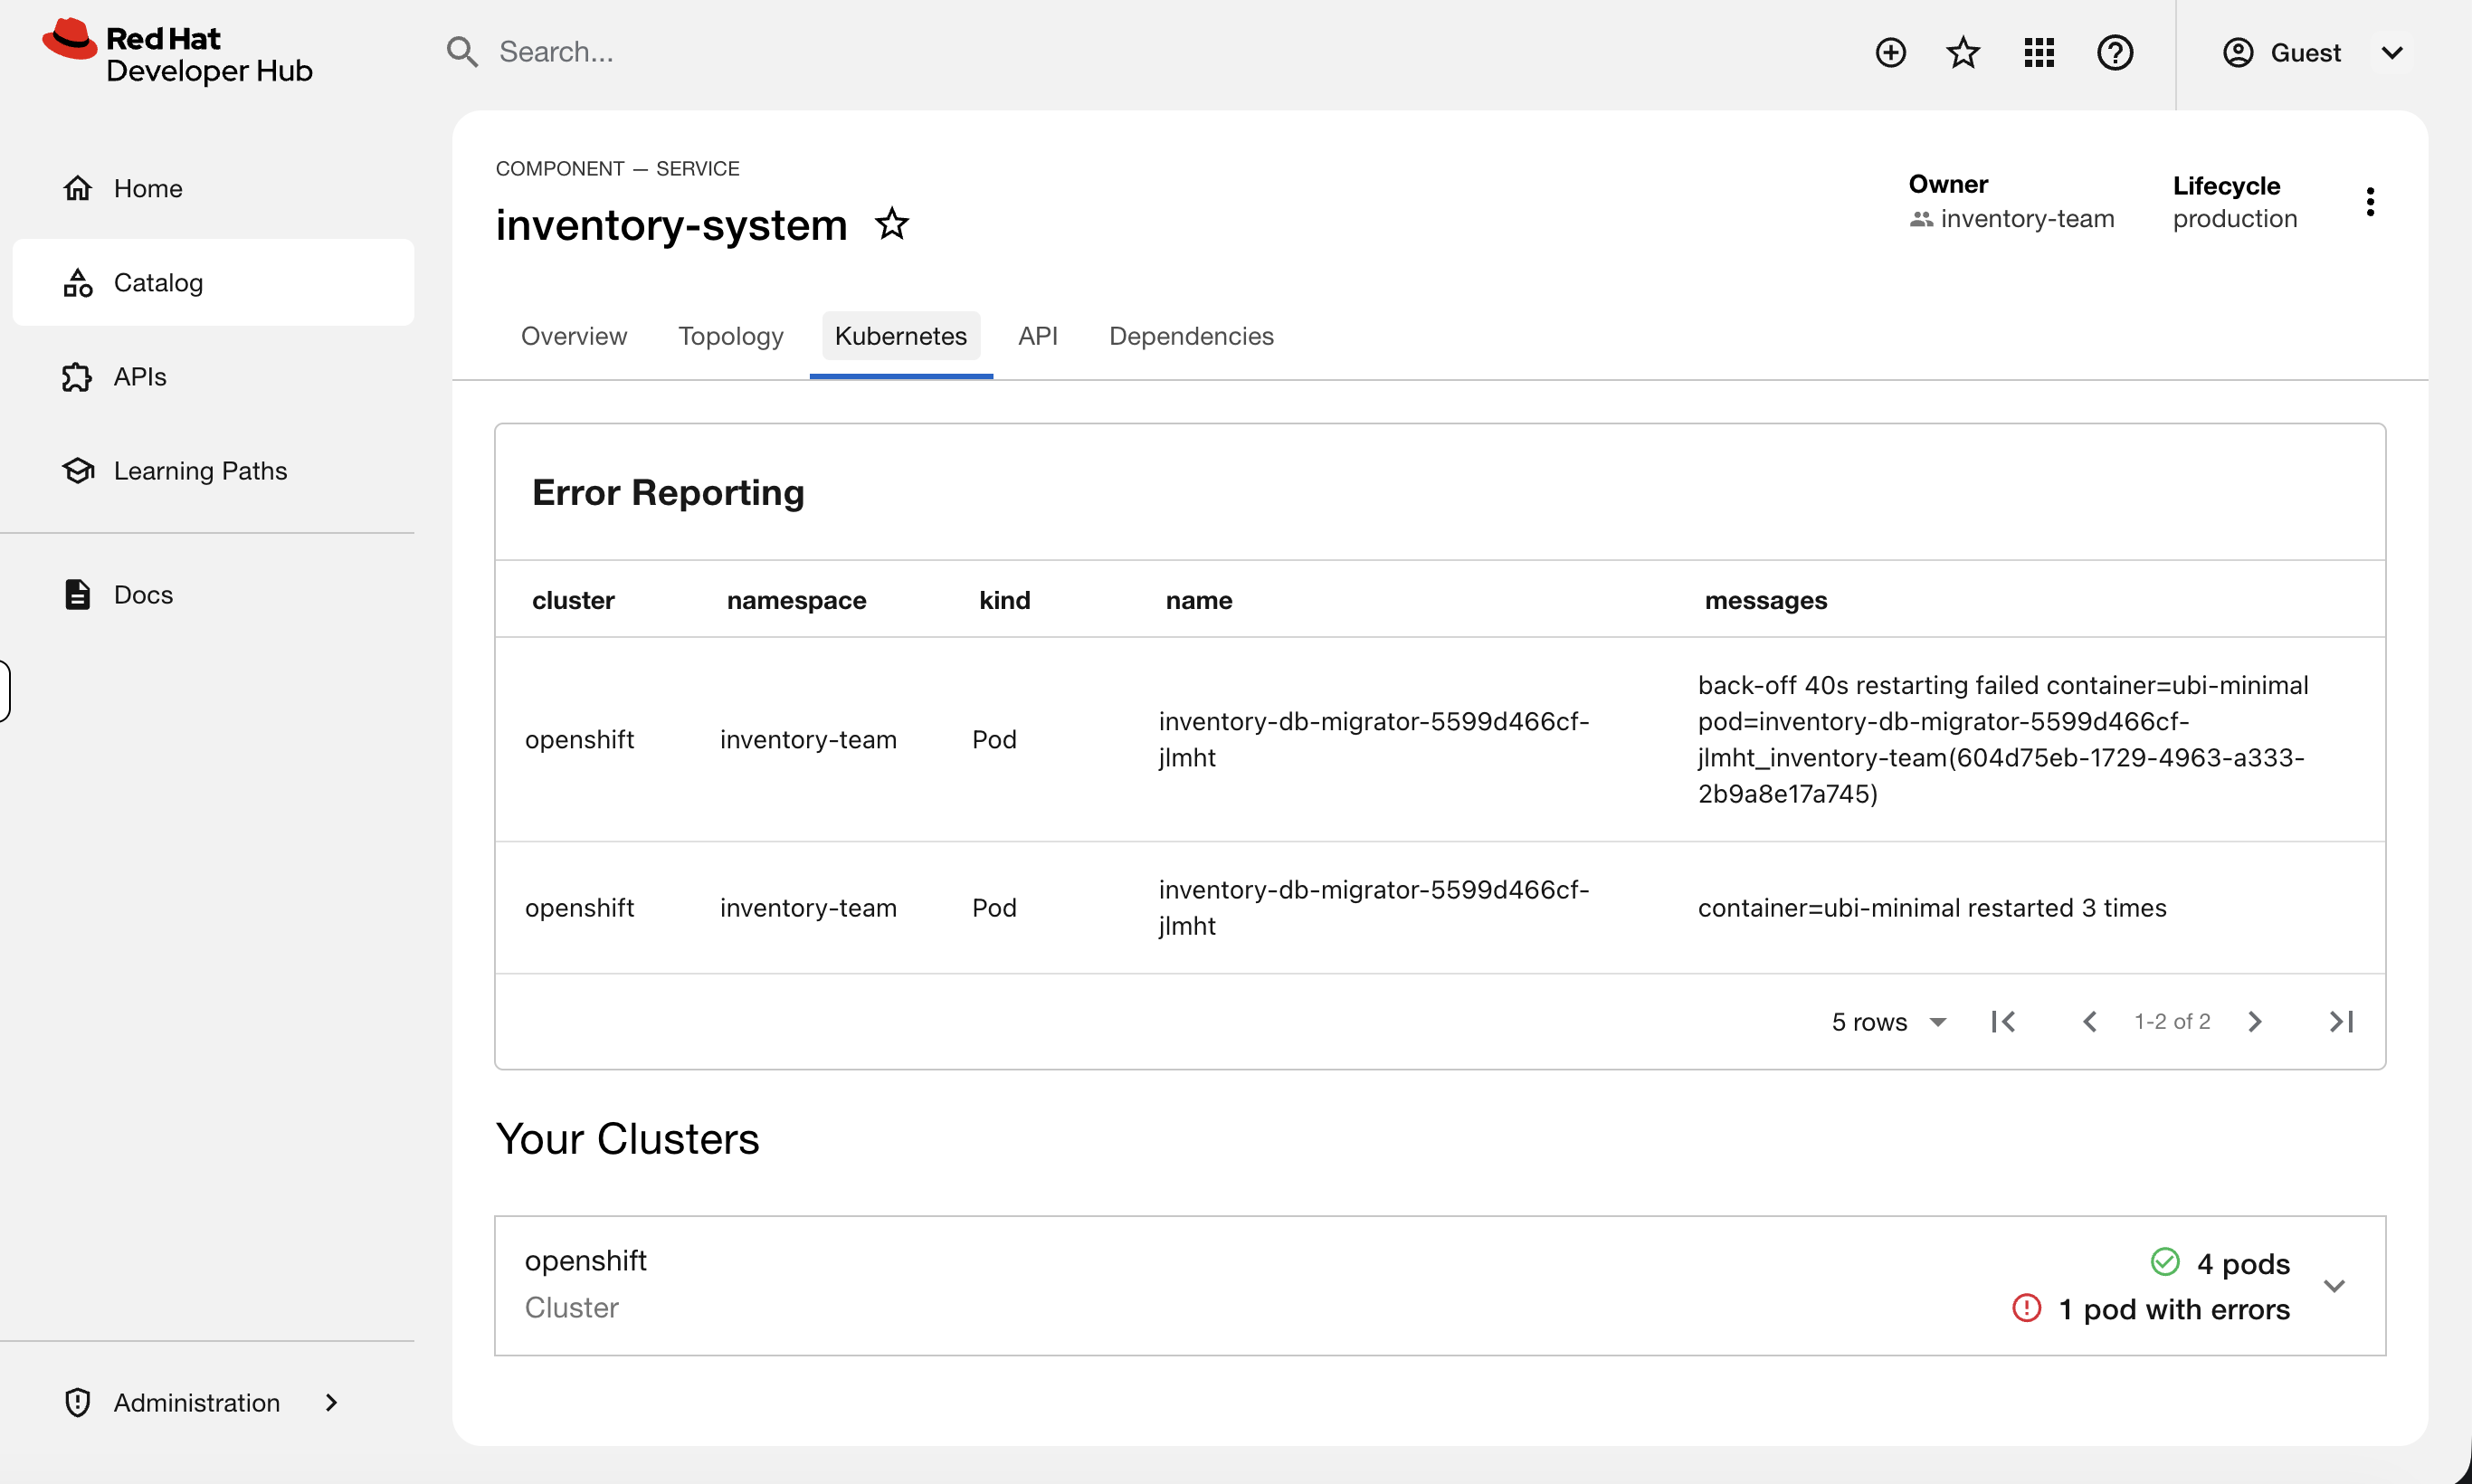
You’ll see an Error Reporting section at the top - the inventory-db-migrator pod is in CrashLoopBackOff. The error messages are right there: restart count, failure reason.
This is what a developer sees when something is broken - and what they’d show you in a ticket. Instead of "my app is broken, can you look?" they can tell you "inventory-db-migrator is crashlooping with a database connection error." That’s a much better starting point for troubleshooting.
Now click on order-tracker. Notice the Kubernetes tab shows nothing - this service is registered in the catalog but hasn’t been deployed yet.
You’ll fix that later in this module.
Understand How It Works
You’ve seen what RHDH looks like. Now figure out how it’s wired together - when something breaks, these are the pieces you’ll need to check.
Step 6: Check RHDH in the OpenShift Console
Switch to the OCP Console tab. Make sure the Administrator perspective is selected, then go to Workloads → Pods and select the backstage project from the dropdown.
You’ll see two pods:
-
backstage-developer-hub- the main application -
backstage-psql-developer-hub- PostgreSQL database storing catalog data and template history
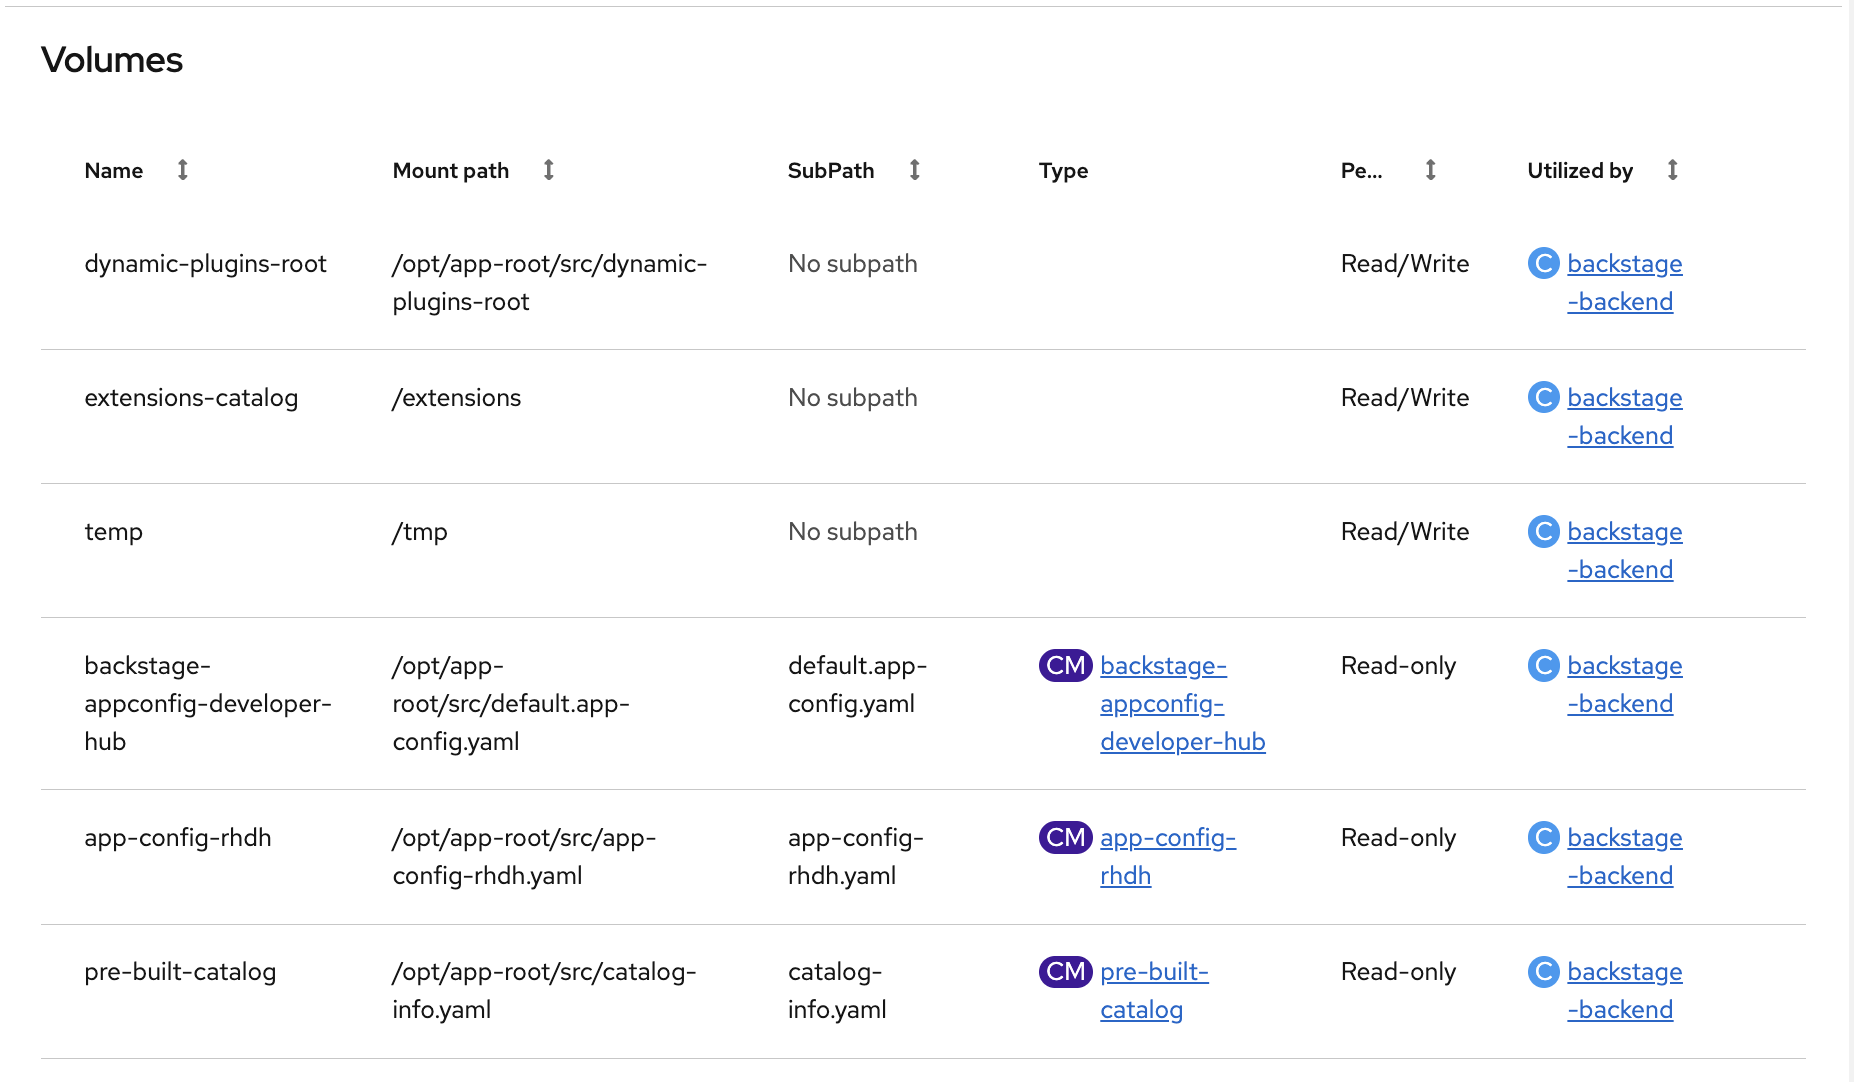
Click on the backstage-developer-hub pod (it will have a random suffix like backstage-developer-hub-fcdd8d5df-2qf4b) and look at the Details tab. Scroll down to the Volumes section - you’ll see the ConfigMaps mounted into the pod: app-config-rhdh (application config), pre-built-catalog (catalog entries and template), and backstage-appconfig-developer-hub (default config).
Step 7: Trace the Configuration
Back in the terminal, let’s trace how RHDH is configured. Start with the Backstage Custom Resource - this is the single source of truth for the deployment:
oc get backstage developer-hub -n backstage -o yaml | grep -A5 "dynamicPlugins\|extraEnvs\|extraFiles\|appConfig"This shows you four key configuration points:
-
appConfig→ the ConfigMapapp-config-rhdhcontaining the RHDH application config (auth, cluster connection, catalog locations) -
dynamicPluginsConfigMapName→ the ConfigMapdynamic-plugins-rhdhthat controls which plugins are enabled -
extraEnvs→ the Secretrhdh-kubernetes-plugin-tokeninjected as an environment variable (the service account token RHDH uses to talk to the cluster) -
extraFiles→ the ConfigMappre-built-catalogmounted as a file (the catalog entries and software template)
What plugins are enabled? Check the dynamic plugins ConfigMap:
oc get configmap dynamic-plugins-rhdh -n backstage -o jsonpath='{.data.dynamic-plugins\.yaml}' | grep -A1 "package:"You should see the Kubernetes backend and frontend plugins (show pod data), Topology plugin (visual map), and scaffolder modules (power the software templates). The quickstart plugin is disabled - that’s the setup wizard we don’t need.
How does RHDH authenticate to the cluster? Check the app-config:
oc get configmap app-config-rhdh -n backstage -o jsonpath='{.data.app-config-rhdh\.yaml}' | grep -A2 "authProvider\|serviceAccountToken"It uses authProvider: serviceAccount with a token stored in ${K8S_PLUGIN_SA_TOKEN} (from the Secret we saw above). Check what permissions that service account has:
oc get clusterrolebindings -o custom-columns='BINDING:.metadata.name,ROLE:.roleRef.name' | grep rhdh-The two that matter are rhdh-cluster-reader (can view pods across the cluster) and rhdh-scaffolder-binding (can create namespaces for templates). Ignore the rhdh-operator lines - those are the operator’s own permissions. This is least-privilege: RHDH can read cluster state and create namespaces, but nothing more.
Step 8: Understand the Label Contract
The Kubernetes plugin discovers pods by matching labels. This is the contract between the catalog and the cluster:
-
The catalog entry has an annotation:
backstage.io/kubernetes-id: weather-app -
The deployments have a matching label:
backstage.io/kubernetes-id: weather-app -
The plugin finds all pods with that label and displays them
Verify this on the weather app:
oc get deployments -n ops-track-demo -o custom-columns='NAME:.metadata.name,BACKSTAGE-ID:.spec.template.metadata.labels.backstage\.io/kubernetes-id'The weather microservice deployments should show weather-app as their backstage ID. You may see weather-db with <none> - that’s the debugging exercise pod from Module 05, which isn’t part of the catalog. Any deployment with a wrong or missing label won’t appear in the Kubernetes tab. You’ll see exactly this during the troubleshooting section.
Watch Self-Service in Action
One of the biggest values of RHDH for an ops team is that it handles requests you used to get as tickets. Let’s see a software template in action.
Step 9: Use the Software Template
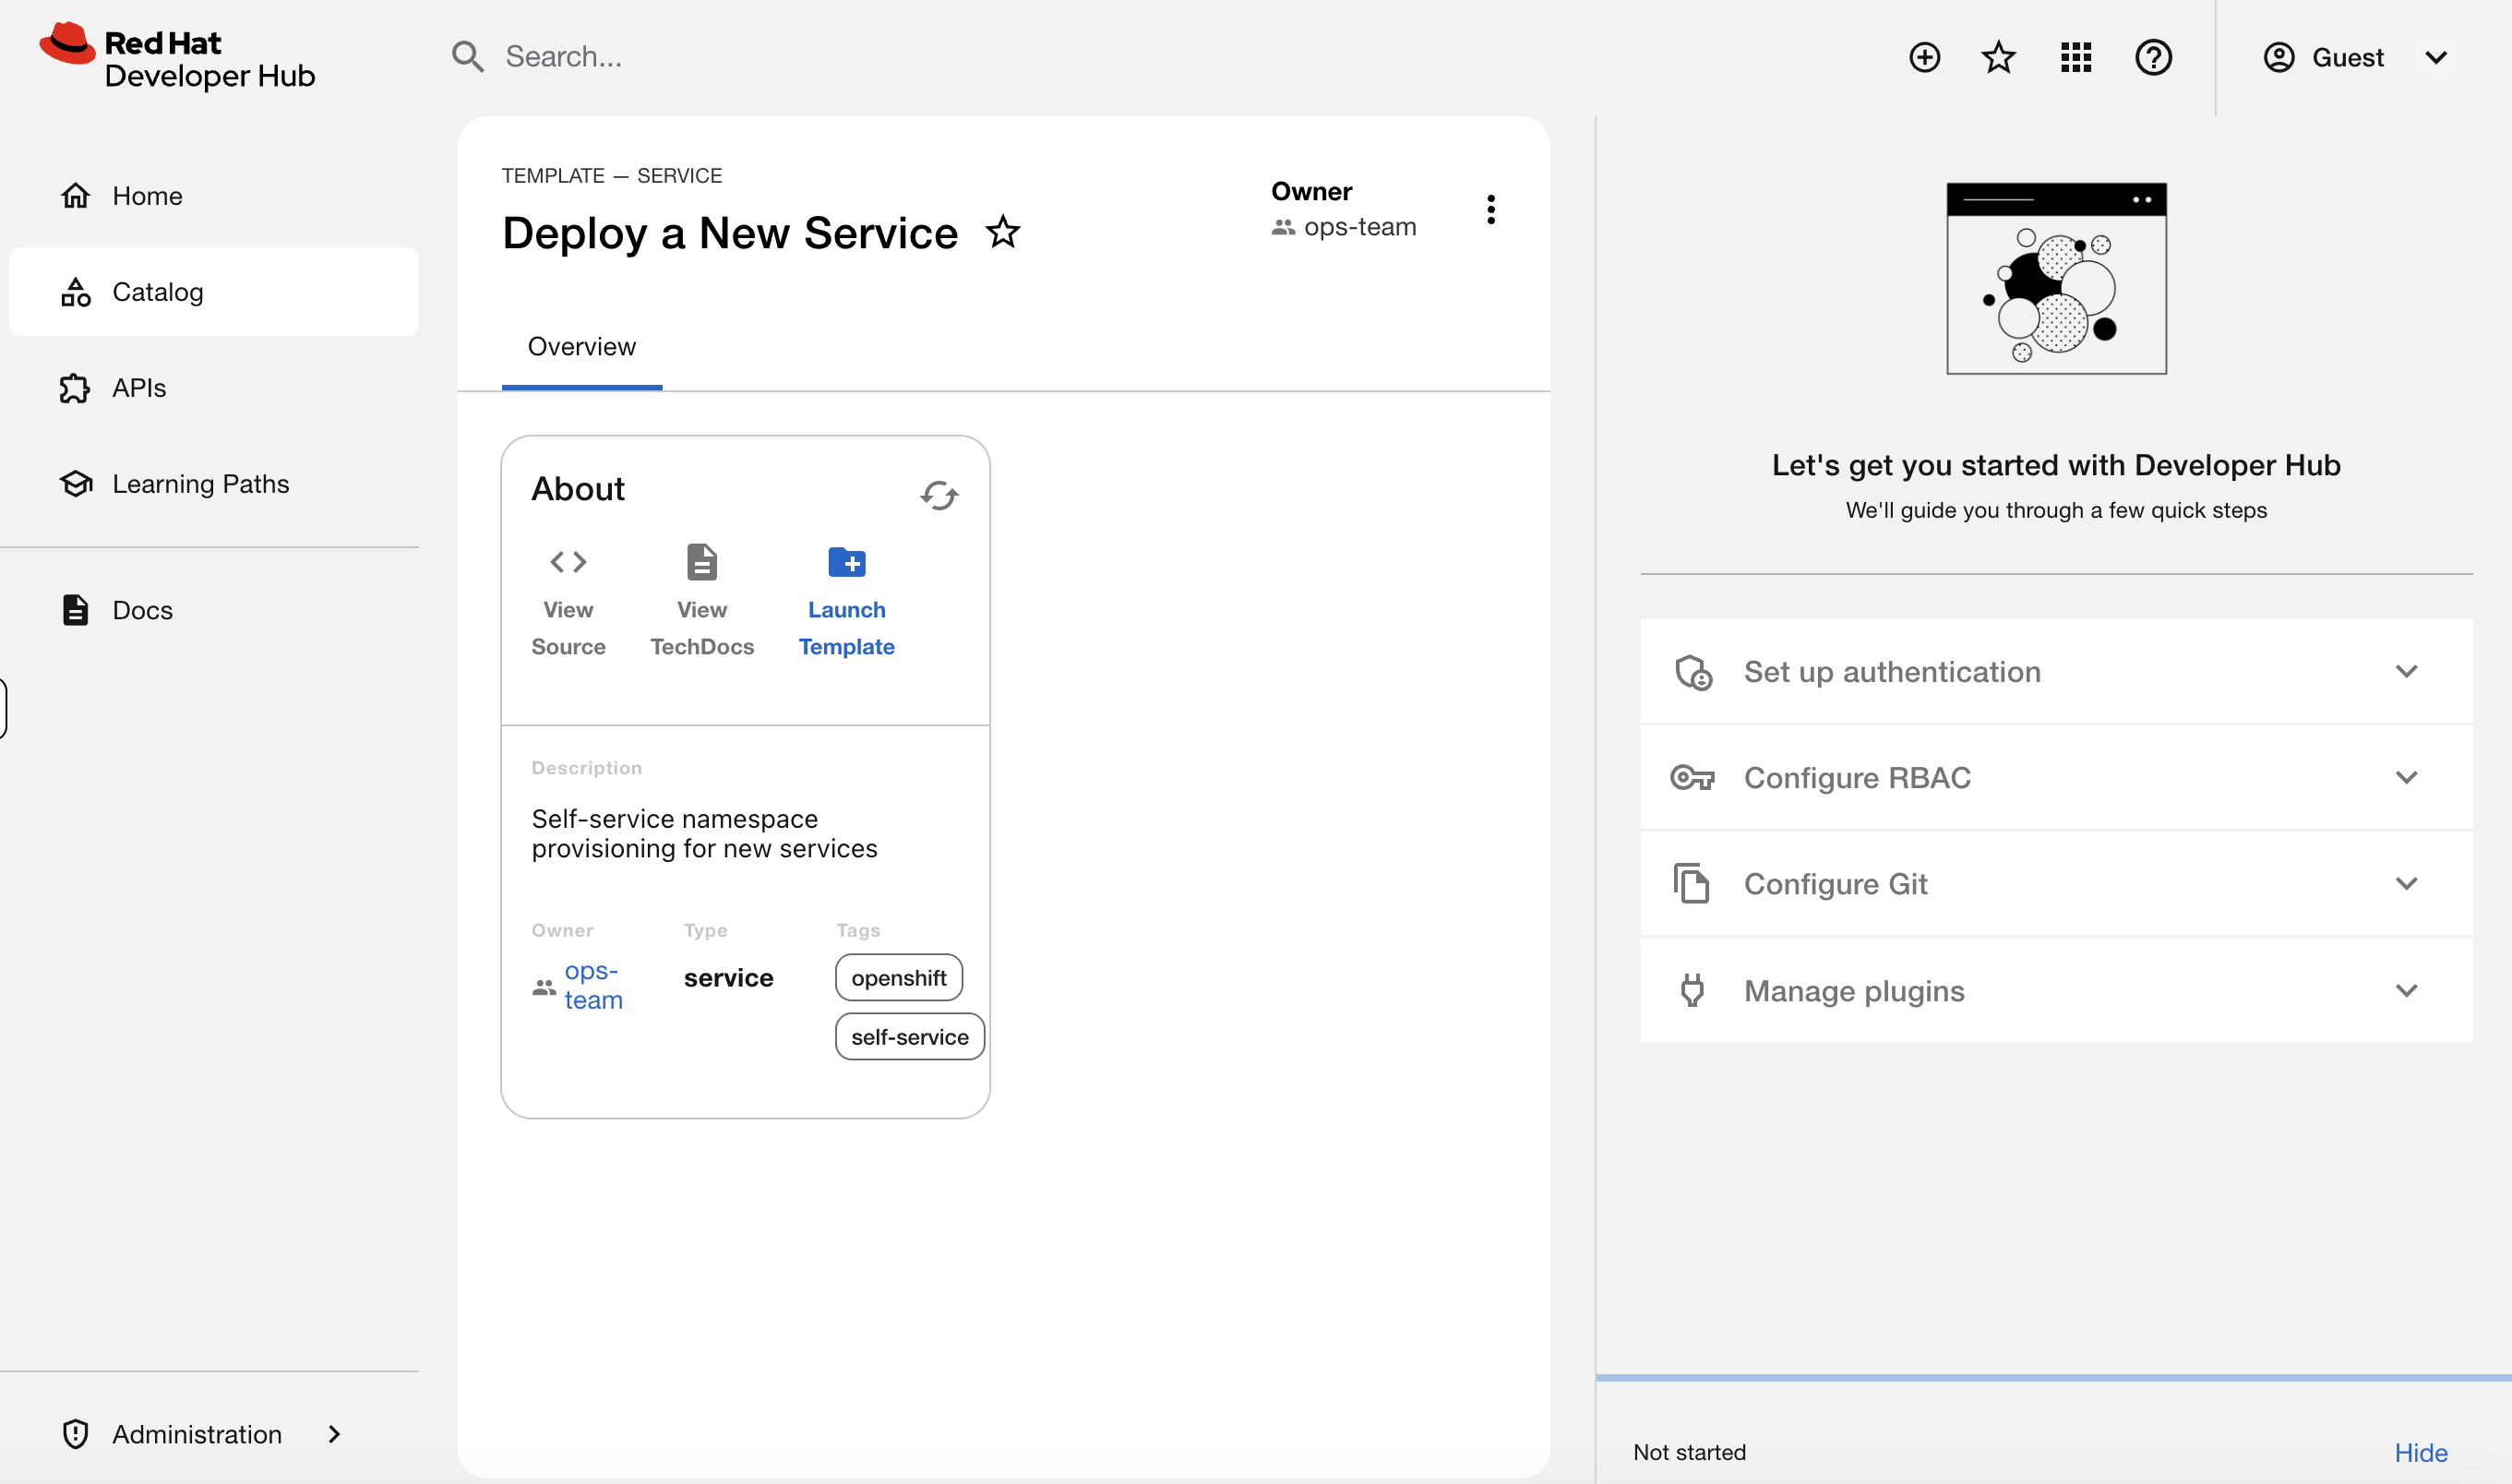
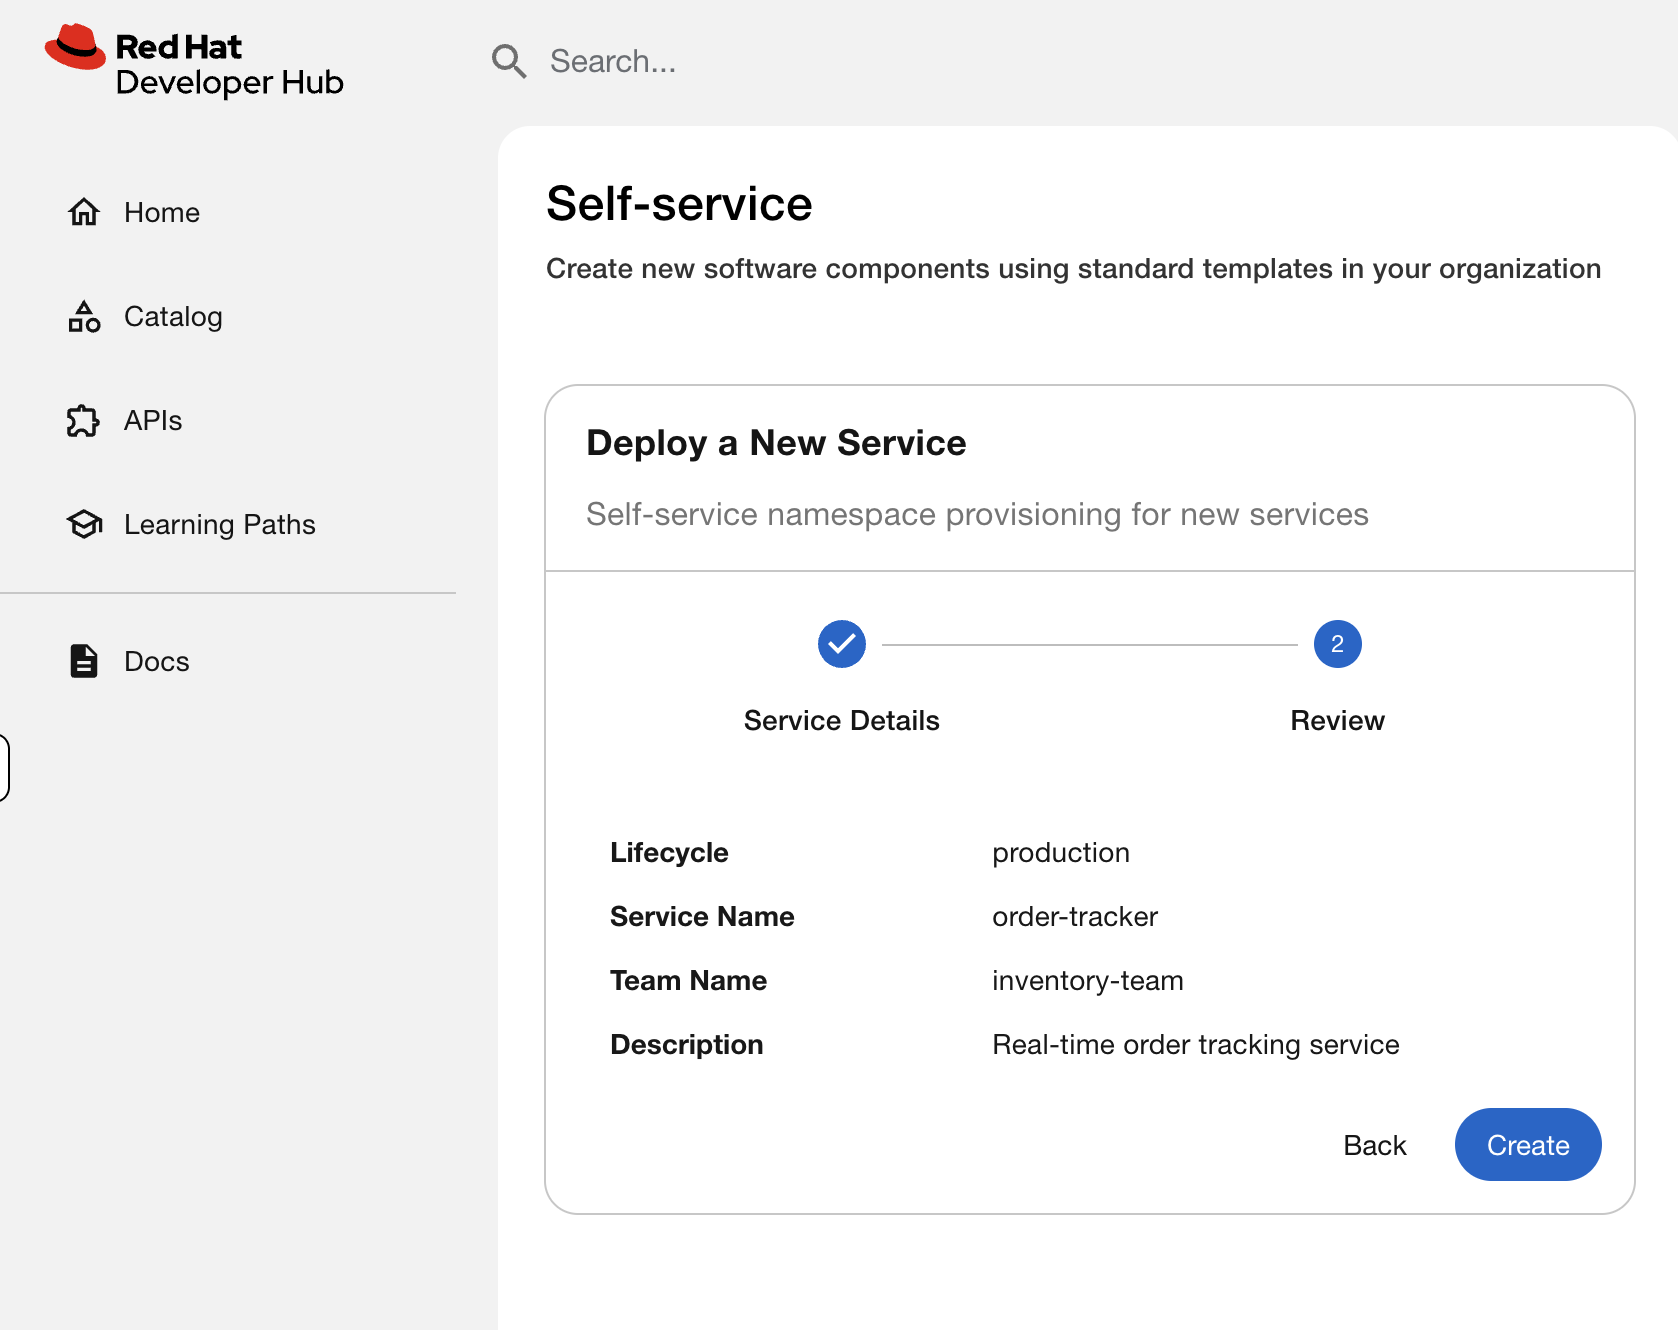
In the Developer Hub tab, scroll down on the Home page to Explore Templates. You’ll see the Deploy a New Service template - this was built by the platform team to let developers provision their own namespaces following approved patterns.
Click Deploy a New Service, then click Launch Template to open the form.
Fill in:
-
Service Name:
order-tracker -
Team Name:
inventory-team -
Description:
Real-time order tracking service -
Lifecycle:
production
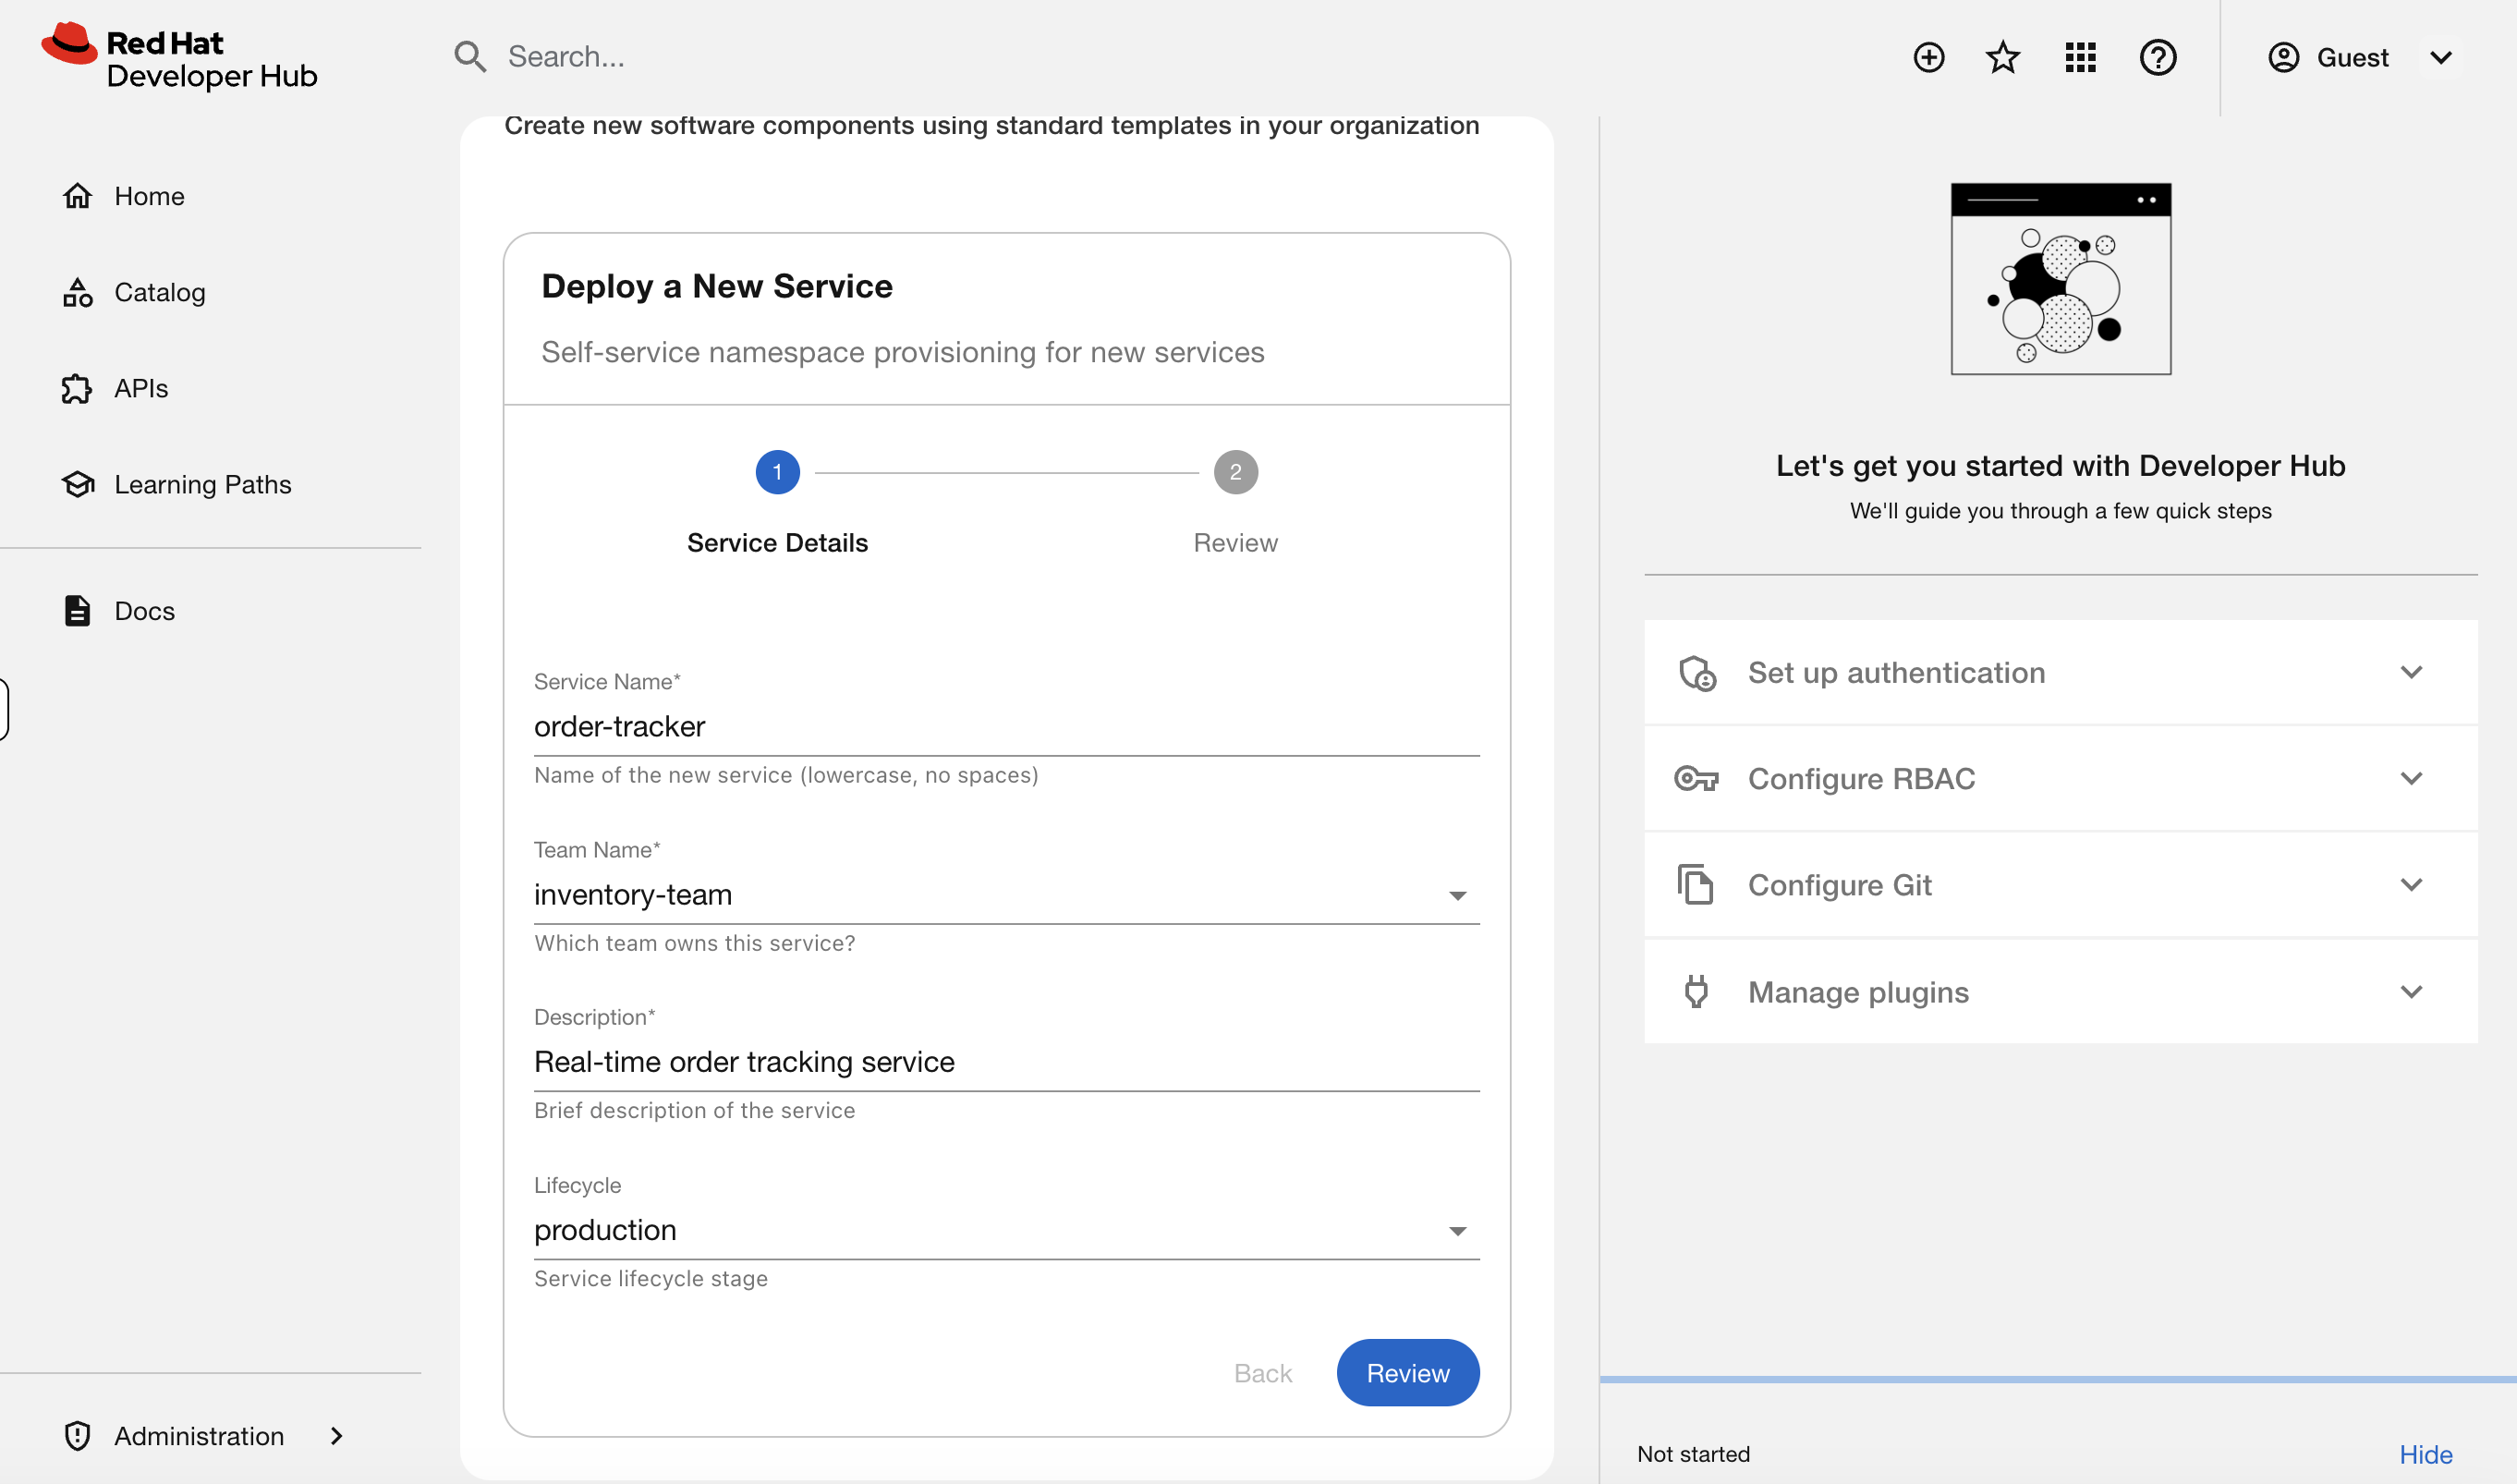
Click Review, then Create.
Watch the template execute. You’ll see four steps complete:
-
Create OpenShift Namespace - provisions the namespace with team labels
-
Deploy API Service - creates the API deployment with RHDH discovery labels
-
Deploy Worker Service - creates the worker deployment with RHDH discovery labels
-
Log Result - confirms what was created
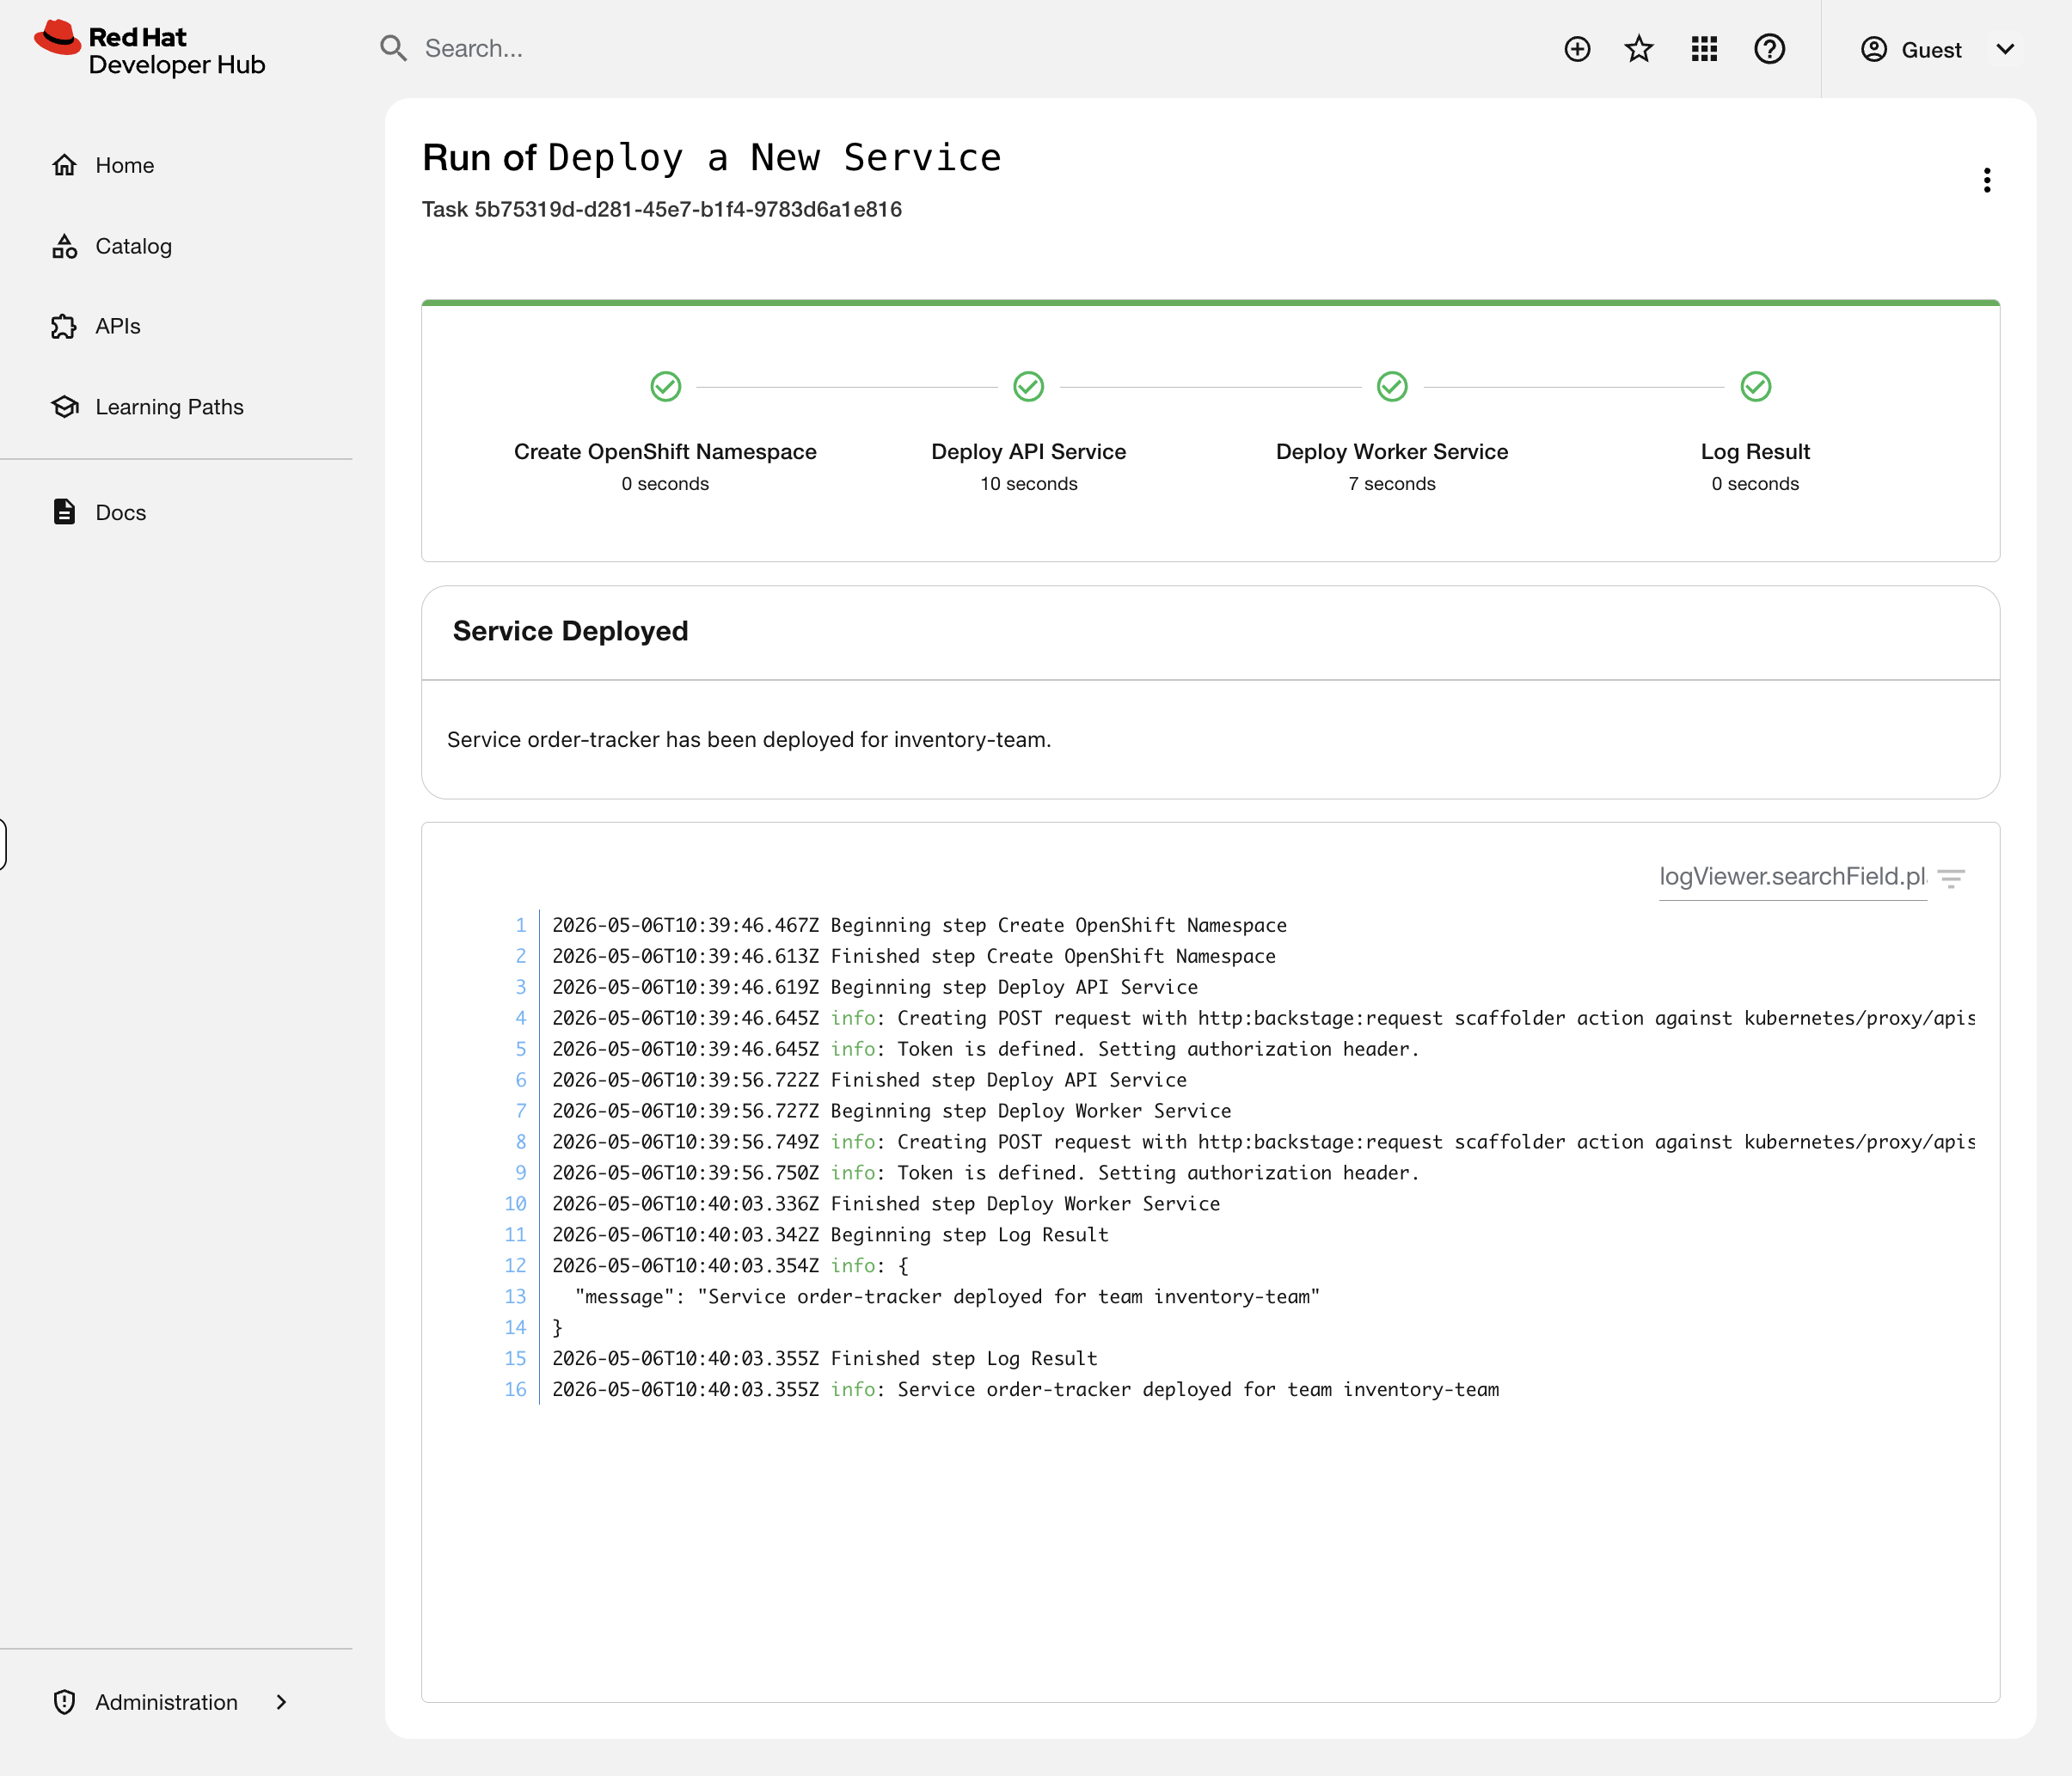
This is the golden path. A developer filled in a form. The template created a namespace, deployed two services, and labeled everything for Developer Hub discovery - all following patterns your platform team defined. No tickets, no manual namespace creation, no "can you label this for me", no drift from standards.
| In production, templates typically commit to a Git repository and sync via ArgoCD rather than deploying directly to the cluster. This gives you an audit trail and drift detection. For this workshop, we deploy directly to keep the focus on what RHDH does rather than the full GitOps pipeline. |
Step 10: See the Result Immediately
Back in the terminal, verify what the template created:
oc get namespace order-tracker --show-labelsoc get deployments -n order-tracker -o custom-columns='NAME:.metadata.name,BACKSTAGE-ID:.spec.template.metadata.labels.backstage\.io/kubernetes-id'The template created the namespace, deployed both services, and set the backstage labels - all in one click.
Now go to Developer Hub > Catalog > order-tracker > Kubernetes tab. You should see 2 pods running immediately - no manual labeling needed.
This is what replaced three separate requests to your team: "create me a namespace", "deploy my app", "wire it up to Developer Hub". One template, one click, done.
Troubleshoot: Tickets from Dev Teams
You have two tickets in your queue from developer teams. Let’s work through them.
Ticket 1: "Our gateway disappeared from Developer Hub"
The payments team reports that their gateway service vanished from the Developer Hub Kubernetes tab, but the pod is still running.
Simulate the problem:
oc patch deployment payments-gateway -n payments-team --type=json \
  -p '[{"op":"replace","path":"/spec/template/metadata/labels/backstage.io~1kubernetes-id","value":"payments-gateway"}]'
Go to Developer Hub > payments-platform > Kubernetes tab. You should see only 2 pods instead of 3.
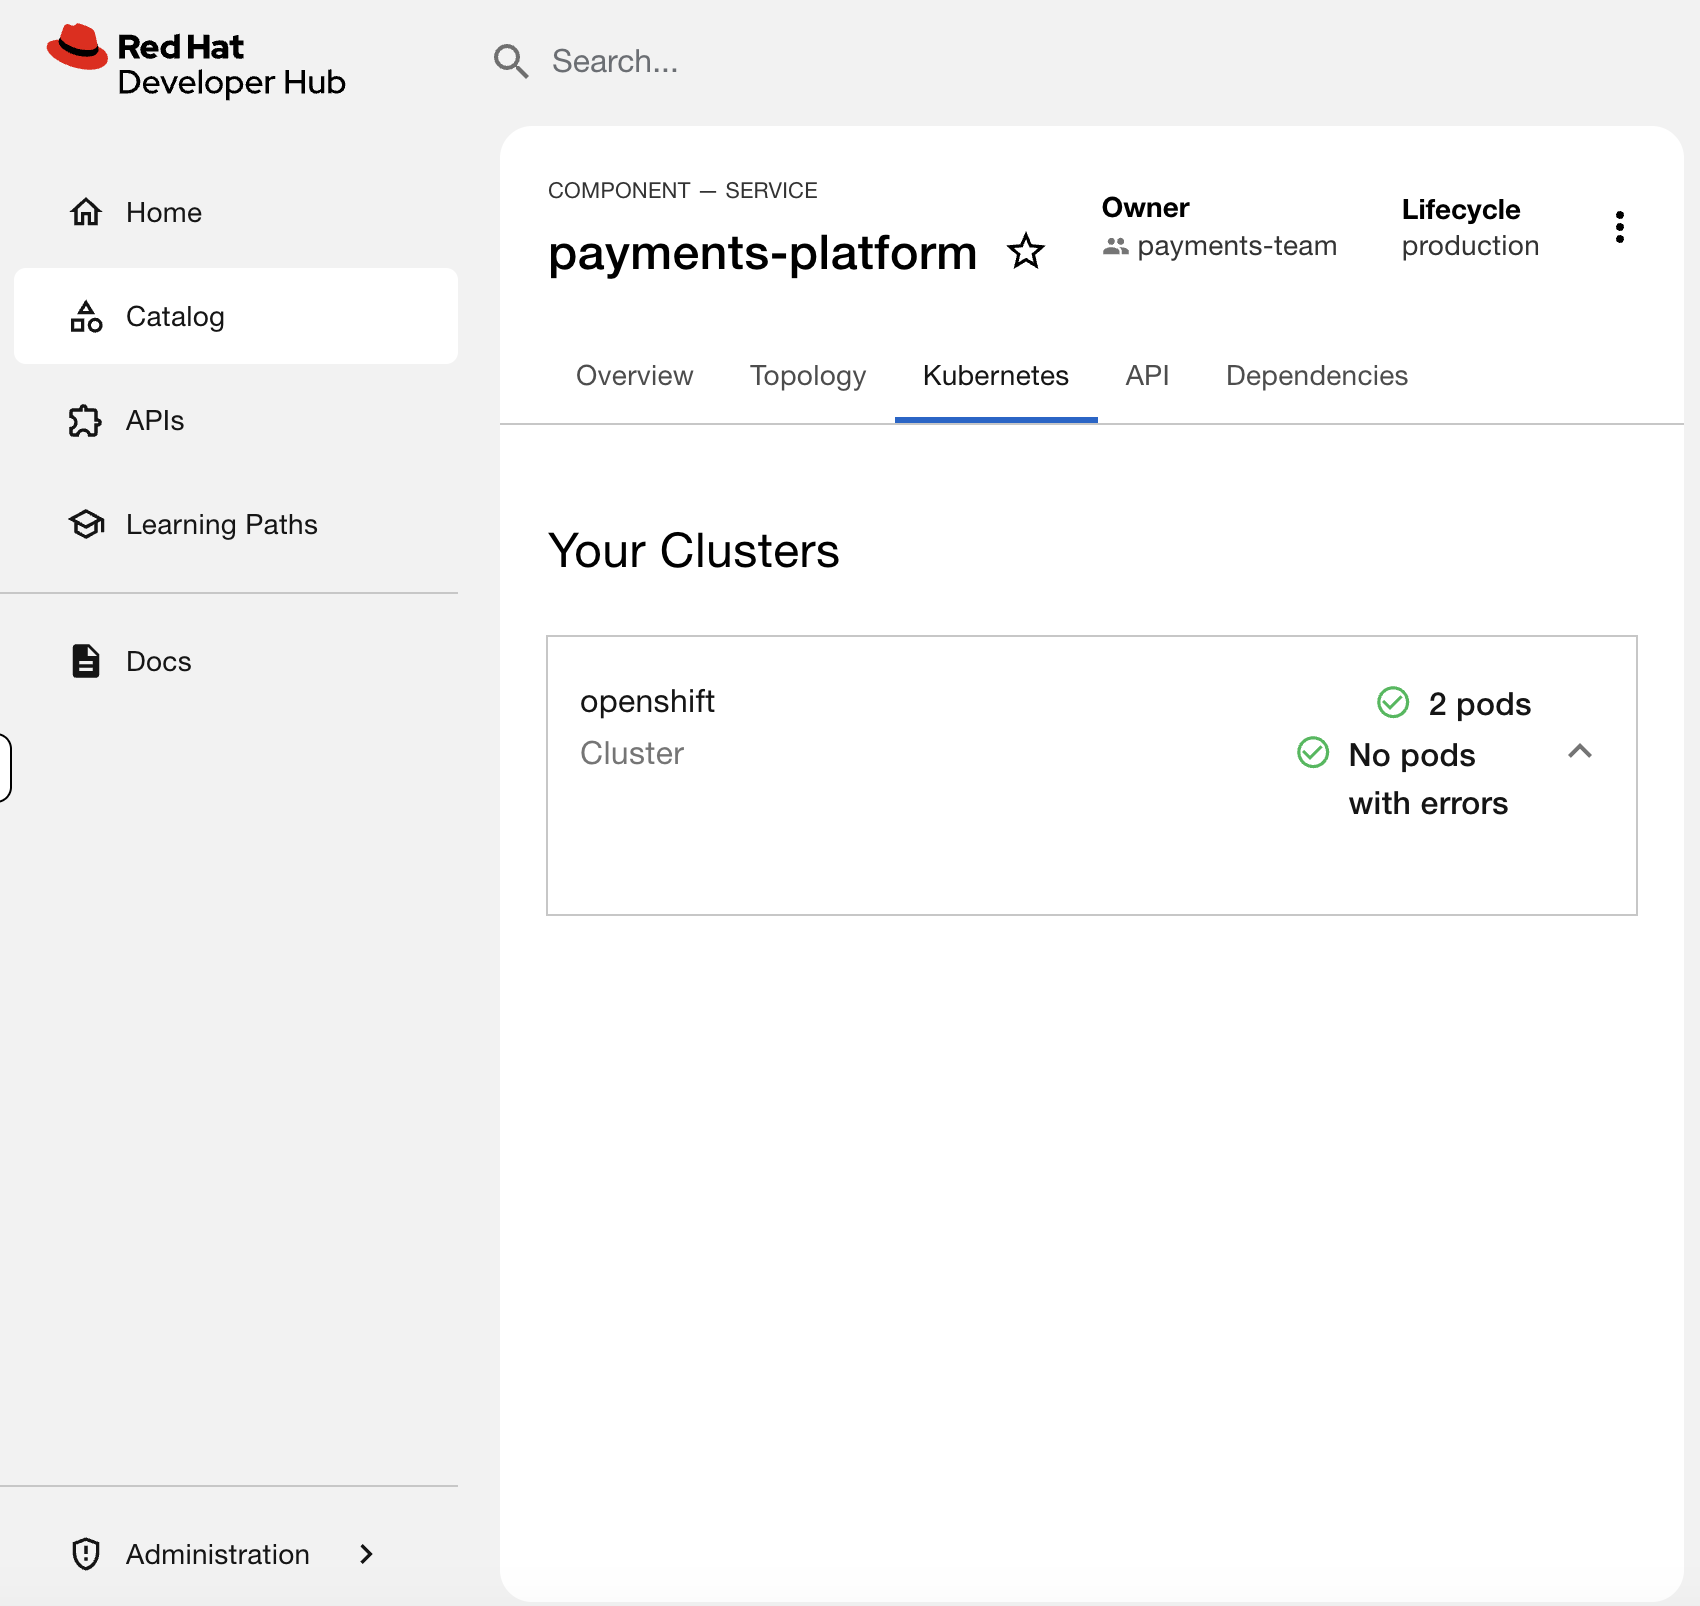
The deployment is running, but it’s invisible. Diagnose it:
oc get deployments -n payments-team -o custom-columns='NAME:.metadata.name,BACKSTAGE-ID:.spec.template.metadata.labels.backstage\.io/kubernetes-id'You should see payments-gateway has the value payments-gateway instead of payments-platform. The label doesn’t match the catalog annotation - so the plugin can’t find it.
Fix it:
oc patch deployment payments-gateway -n payments-team --type=json \
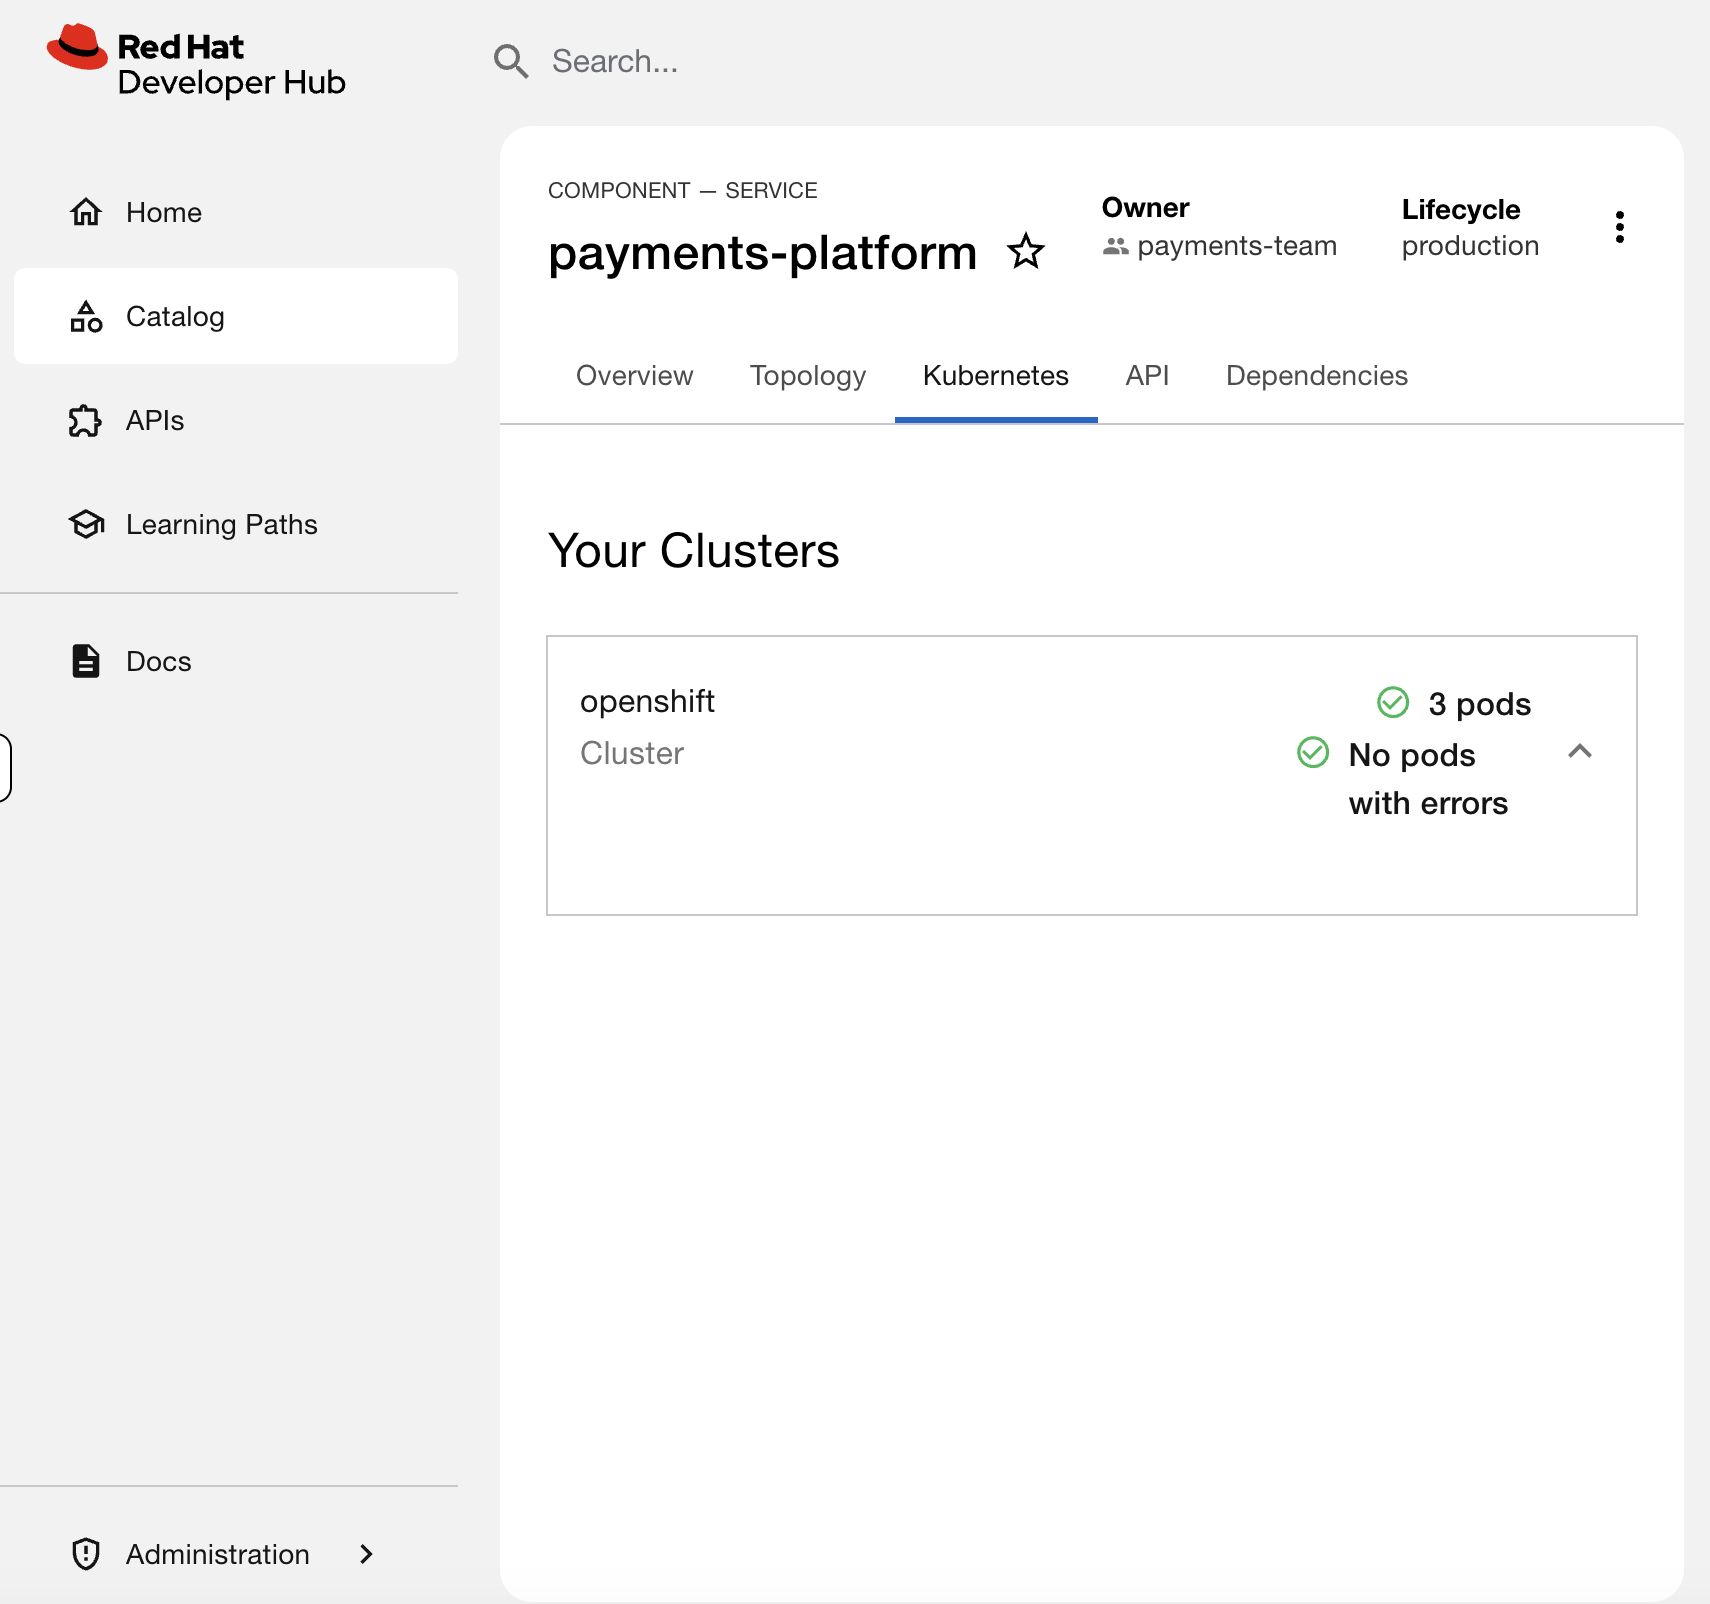
-p '[{"op":"replace","path":"/spec/template/metadata/labels/backstage.io~1kubernetes-id","value":"payments-platform"}]'Check the payments-platform Kubernetes tab again - all 3 pods should be back.
Ticket 2: "inventory-system shows errors in Developer Hub"
The inventory team reports their service is showing errors in Developer Hub. They want to know what’s wrong.
You already saw this in Step 5 - the inventory-db-migrator pod is crashlooping. Now diagnose it from the CLI like you would in production:
oc get pods -n inventory-teamYou’ll see inventory-db-migrator in CrashLoopBackOff. Check the logs:
oc logs deployment/inventory-db-migrator -n inventory-teamThe log shows: FATAL: Cannot connect to database at postgres.inventory-team:5432 - connection refused. The pod is trying to reach a database that doesn’t exist.
This is a development issue, not an ops issue - the inventory team deployed a database migration job before setting up their database. You’d respond to the ticket: "Your inventory-db-migrator is crashlooping because it can’t connect to postgres.inventory-team:5432. The database service doesn’t exist in that namespace. Check with your dev team that the database is deployed before running migrations."
Delete the broken deployment to clear the error:
oc delete deployment inventory-db-migrator -n inventory-teamCheck the inventory-system Kubernetes tab in Developer Hub - the error reporting section should be gone, and you should see 3 healthy pods.
What You Practiced
Two different failure modes, two different diagnosis paths:
| Ticket | Symptom in RHDH | Root Cause |
|---|---|---|
Gateway disappeared |
2 pods instead of 3, no errors |
Label value mismatch - label exists but doesn’t match the catalog annotation |
Errors in Developer Hub |
Error Reporting section, pod with errors |
CrashLoopBackOff - application bug, not an infrastructure issue |
The first is an ops fix (correct the label). The second is a dev team issue (tell them what’s wrong and let them fix their code). Knowing the difference saves you from chasing problems that aren’t yours.
Monitor Developer Hub
RHDH exposes Prometheus metrics by default - catalog entity counts, API request latency, memory usage, and background task health. As the admin responsible for keeping the portal running, you should be scraping these.
Enable Monitoring
The RHDH operator has a built-in monitoring toggle that creates a ServiceMonitor for Prometheus:
oc patch backstage developer-hub -n backstage --type=merge -p '{"spec":{"monitoring":{"enabled":true}}}'This doesn’t restart the pod - it just tells the operator to create a ServiceMonitor so Prometheus starts scraping the metrics endpoint that RHDH already exposes.
This requires user workload monitoring to be enabled on the cluster (enableUserWorkload: true in cluster-monitoring-config). It’s pre-configured on your workshop cluster. On your own cluster, see Enabling monitoring for user-defined projects.
|
Verify the ServiceMonitor was created:
oc get servicemonitor -n backstageQuery RHDH Metrics
| It takes 1-2 minutes for Prometheus to discover the new ServiceMonitor and start scraping. If you see "No datapoints found", wait a minute and click Run Queries again. |
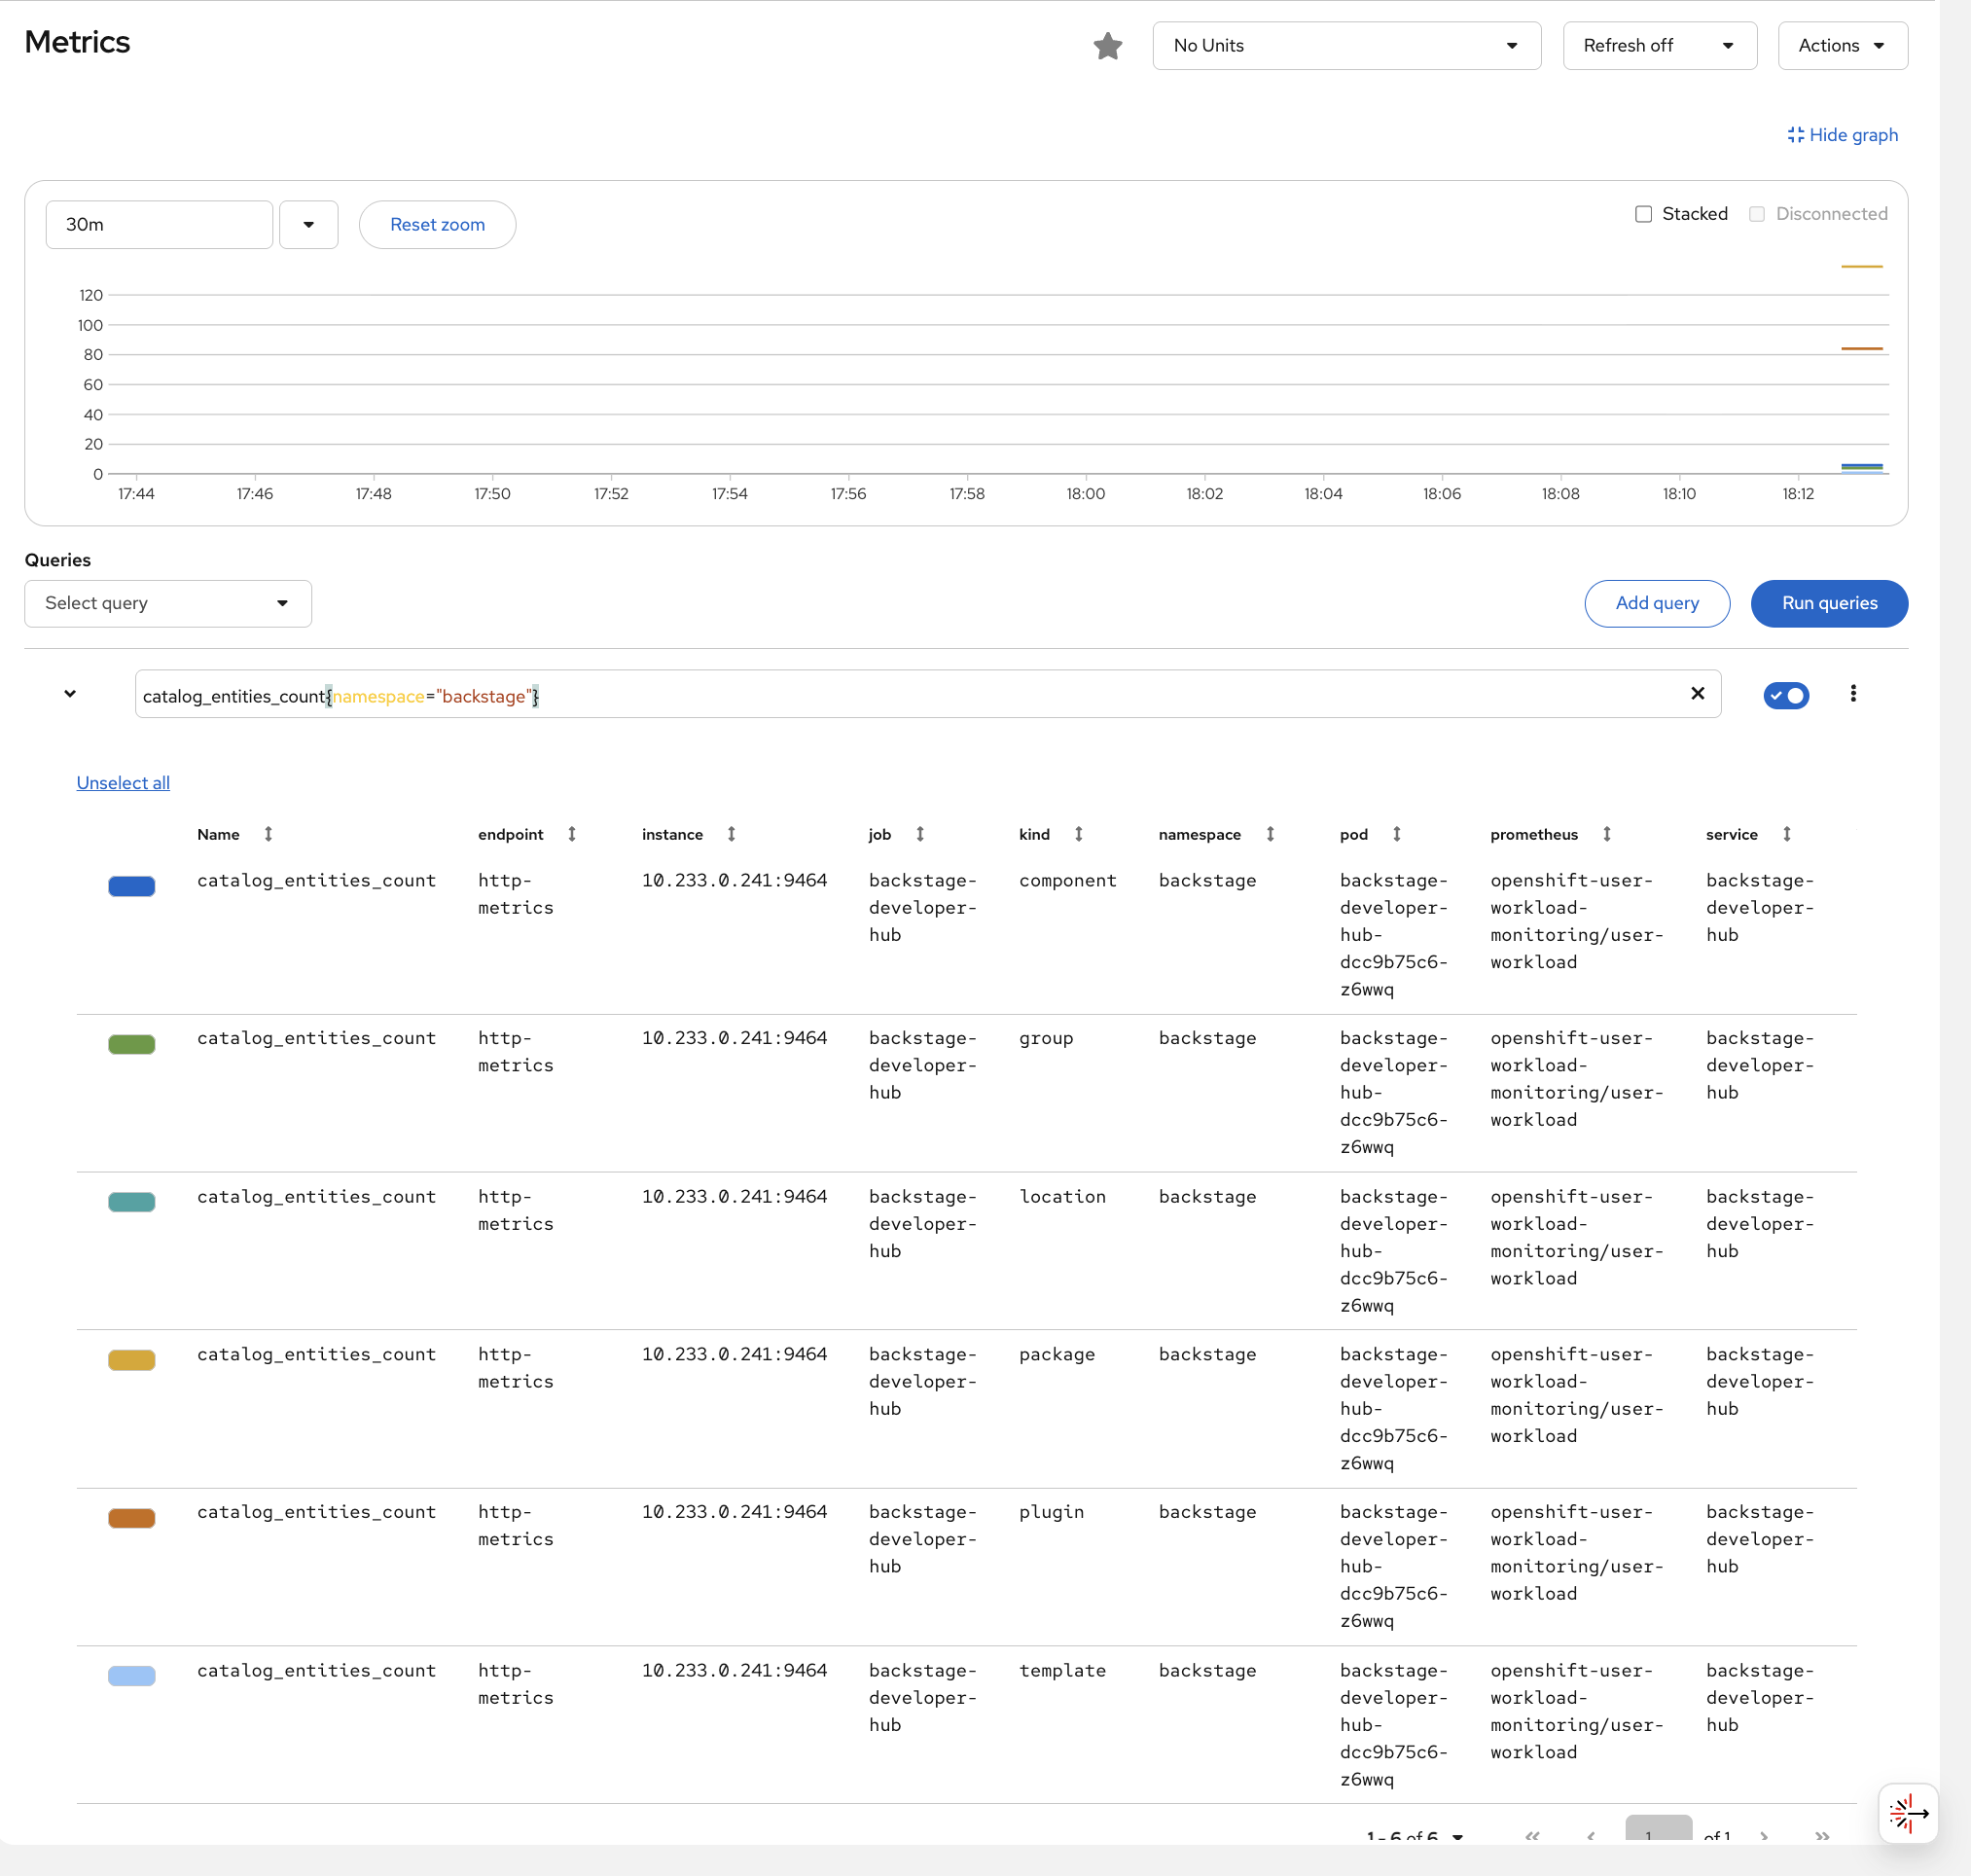
Navigate to the OCP Console > Observe > Metrics. Enter this query and click Run Queries:
catalog_entities_count{namespace="backstage"}You should see the catalog entity counts broken down by kind - the same components, templates, and groups you explored in the catalog earlier, now visible as metrics.
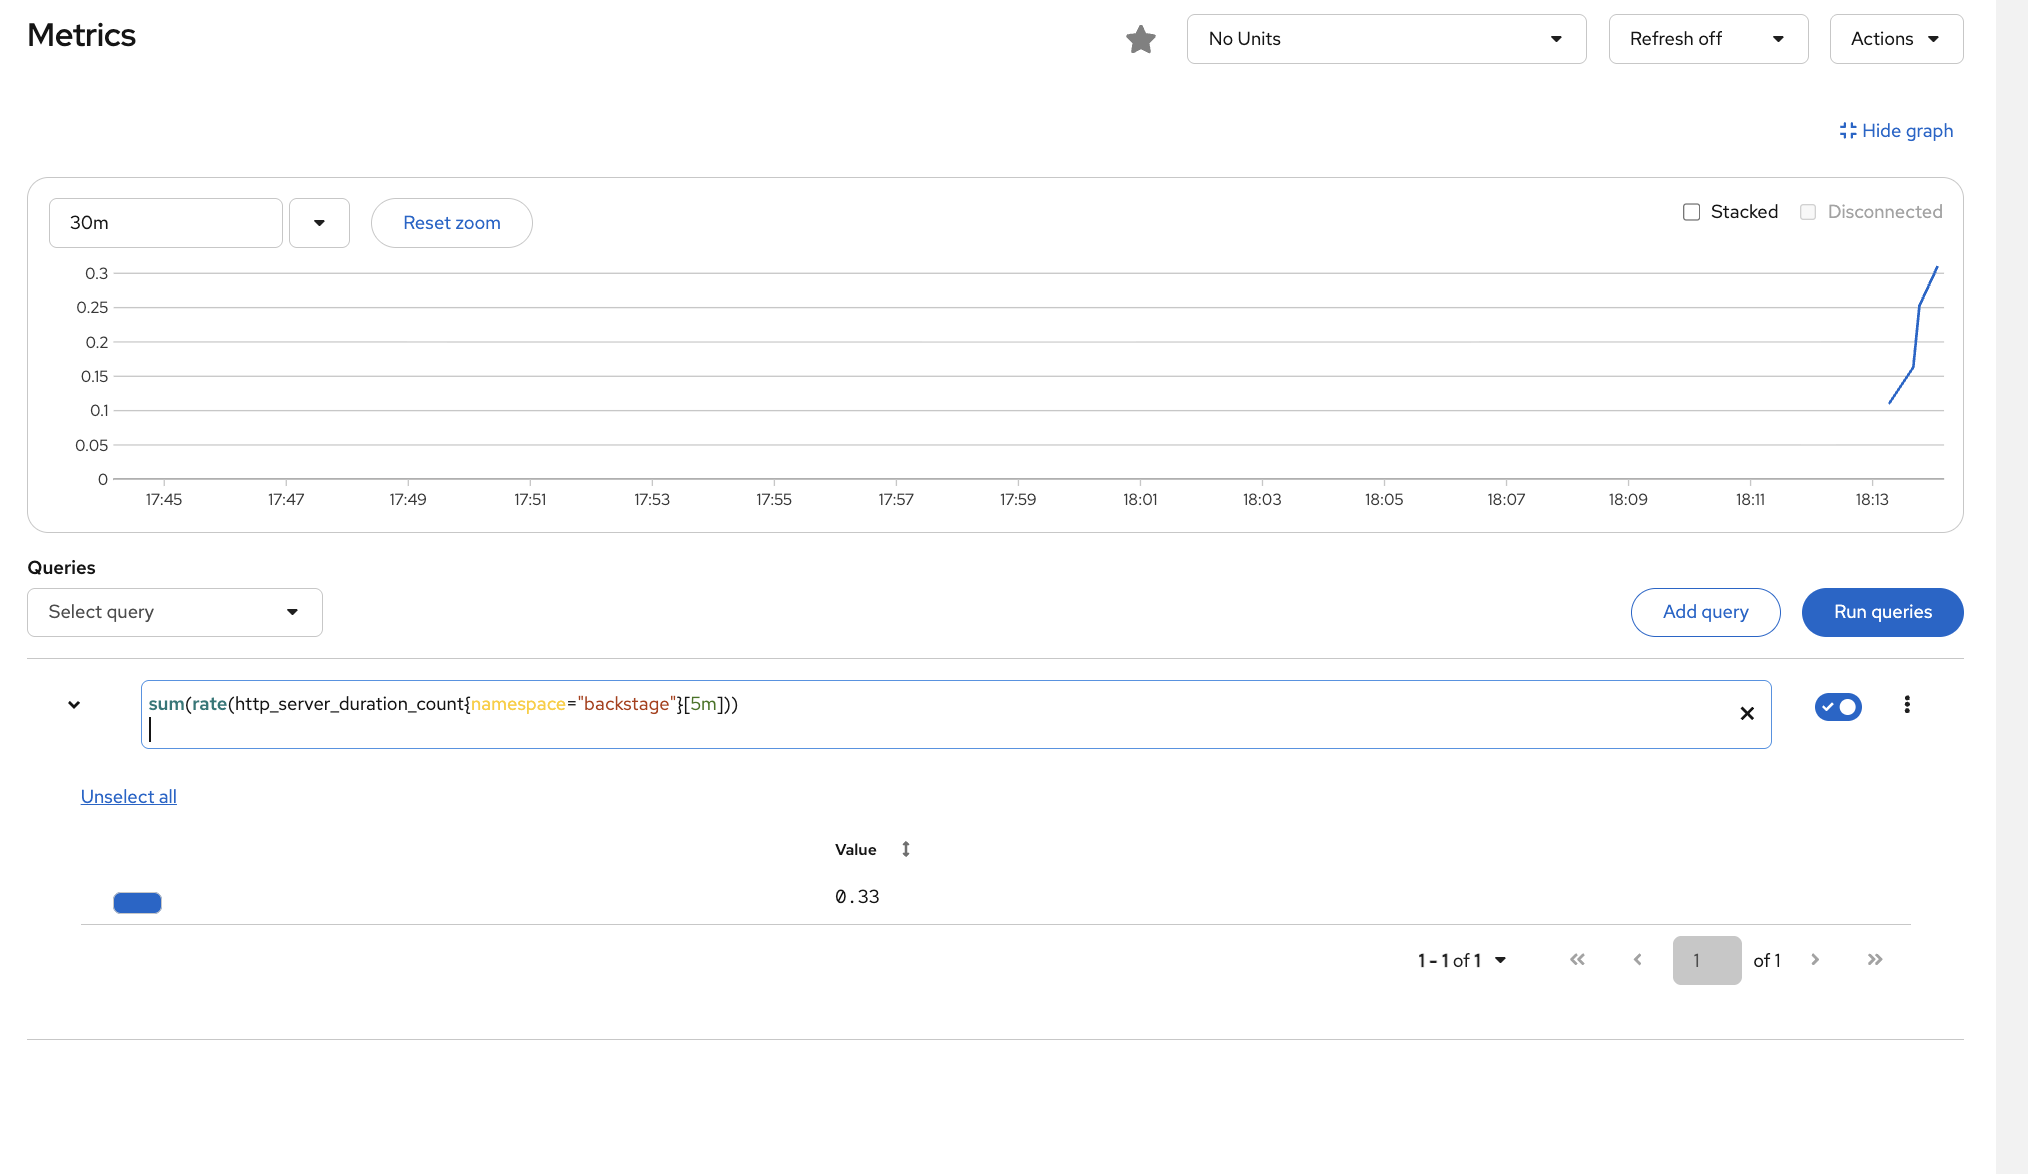
Try another query to see API traffic:
sum(rate(http_server_duration_count{namespace="backstage"}[5m]))This shows the request rate to RHDH - if this drops to zero, the portal is down. If it spikes, something is hammering the API.
| These are the same metrics Prometheus collects for any workload with a ServiceMonitor. RHDH is just another workload being monitored by the built-in Prometheus stack. |
What You Learned
| What You Did | Why It Matters |
|---|---|
Browsed and filtered the catalog |
The catalog is your service inventory - find owners, filter by tag, answer audit questions in seconds |
Saw live Kubernetes data and errors |
Developers see pod status and error details without |
Used a golden path template |
One click deployed a namespace + two services + RHDH labels. This replaced three tickets to your team |
Diagnosed two different failures |
Label mismatch = ops fix. Crashlooping pod = dev team issue. Knowing the difference saves you time |
Enabled RHDH monitoring |
One toggle exposes catalog and API metrics to Prometheus - same observability stack, one more workload |
Going Further
This module showed you RHDH from an ops perspective - understanding the tool your developers use every day. A full platform engineering implementation adds:
-
SSO Integration - connect to your identity provider so developers log in with their existing credentials
-
RBAC Plugin - control who can register components, create from templates, or view specific services
-
CI/CD Plugins - Tekton pipeline runs and ArgoCD sync status visible directly in the catalog
-
TechDocs - documentation lives alongside the code and renders in the portal
-
More Software Templates - golden paths for deploying applications, creating pipelines, and provisioning infrastructure
| Interested in building templates, configuring plugins, or platform engineering with Developer Hub? Check out OpenShift Days: Dev Track or ask your proctor about setting one up. |