Platform Engineering - Red Hat Developer Hub
Module Overview
Duration: 30 minutes
Format: Dashboard exploration + Demo
Audience: IT Operations, Platform Engineers, Infrastructure Architects
Workshop Narrative Context:
We’ve learned how to: - Secure workloads with RHACS - Enforce governance policies - Monitor compliance
Now: How do we enable developer self-service while maintaining operational control? How do we reduce repetitive requests and tickets?
Learning Objectives
By the end of this module, you will be able to:
-
Understand what Red Hat Developer Hub (RHDH) is and how it fits into platform operations
-
Verify RHDH deployment health and status
-
Navigate RHDH resources in OpenShift console and CLI
-
Enable dynamic plugins to extend RHDH functionality
-
Connect the software catalog to live cluster resources
What is Red Hat Developer Hub?
Red Hat Developer Hub (RHDH) is an enterprise-grade Internal Developer Platform based on Backstage.
Think of it as: Your organization’s developer self-service portal
The Operations Problem It Solves
Before RHDH:
-
Developers submit tickets: "Create me a new app with CI/CD"
-
Ops manually provisions: namespace, RBAC, quotas, pipeline, git repo
-
Process takes days or weeks
-
Inconsistent configurations
-
Documentation scattered everywhere
With RHDH:
-
Developer clicks "Create New App" in portal
-
Template automatically provisions: namespace, RBAC, quotas, pipeline, git repo
-
Process takes minutes
-
Ops-defined golden paths ensure consistency
-
Self-service with governance built-in
Key Capabilities
-
Software Catalog - Unified view of all services, APIs, libraries
-
Software Templates - Self-service app creation with Ops-approved patterns
-
TechDocs - Documentation integrated with code
-
Plugins - Integrate with tools (ArgoCD, Tekton, Jira, etc.)
-
RBAC - Fine-grained access control
-
API Integration - Connect to existing systems
RHDH Architecture (Quick Overview)
RHDH on OpenShift consists of:
-
Backstage Frontend - Web portal UI
-
Backstage Backend - API and orchestration layer
-
PostgreSQL Database - Stores catalog and configuration
-
Plugins - Extend functionality (Kubernetes, Tekton, ArgoCD, etc.)
All of this was deployed via the Red Hat Developer Hub Operator from OperatorHub.
Hands-On: Verify RHDH Deployment
Step 1: Check RHDH Pods
Verify the RHDH pods are running:
oc get pods -n backstageYou should see:
NAME                                       READY   STATUS
backstage-developer-hub-xxxxx              1/1     Running
backstage-psql-developer-hub-0             1/1     Running
Step 2: Enable External Catalog Sources
By default, RHDH only reads catalog files from within the cluster. To register components from Git repositories (where real teams store their catalog-info.yaml files), we need to allow external reads. This is a common ops task when setting up RHDH.
Add the GitHub reading configuration to the existing RHDH app config:
EXISTING=$(oc get configmap app-config-rhdh -n backstage -o jsonpath='{.data.app-config-rhdh\.yaml}')
if echo "$EXISTING" | grep -q "reading"; then
  echo "GitHub reading already configured"
else
  UPDATED=$(printf '%s\nbackend:\n  reading:\n    allow:\n      - host: github.com\n      - host: raw.githubusercontent.com\n' "$EXISTING")
  oc create configmap app-config-rhdh -n backstage --from-literal="app-config-rhdh.yaml=$UPDATED" --dry-run=client -o yaml | oc apply -f -
  echo "GitHub reading configuration added"
fi
Restart the deployment to pick up the config change:
oc rollout restart deployment/backstage-developer-hub -n backstageWait for the new pod to be ready (this takes about a minute):
oc rollout status deployment/backstage-developer-hub -n backstage --timeout=120s
In production, you’d also configure a GitHub integration with an access token for private repositories. The backend.reading.allow approach works for public repos.
|
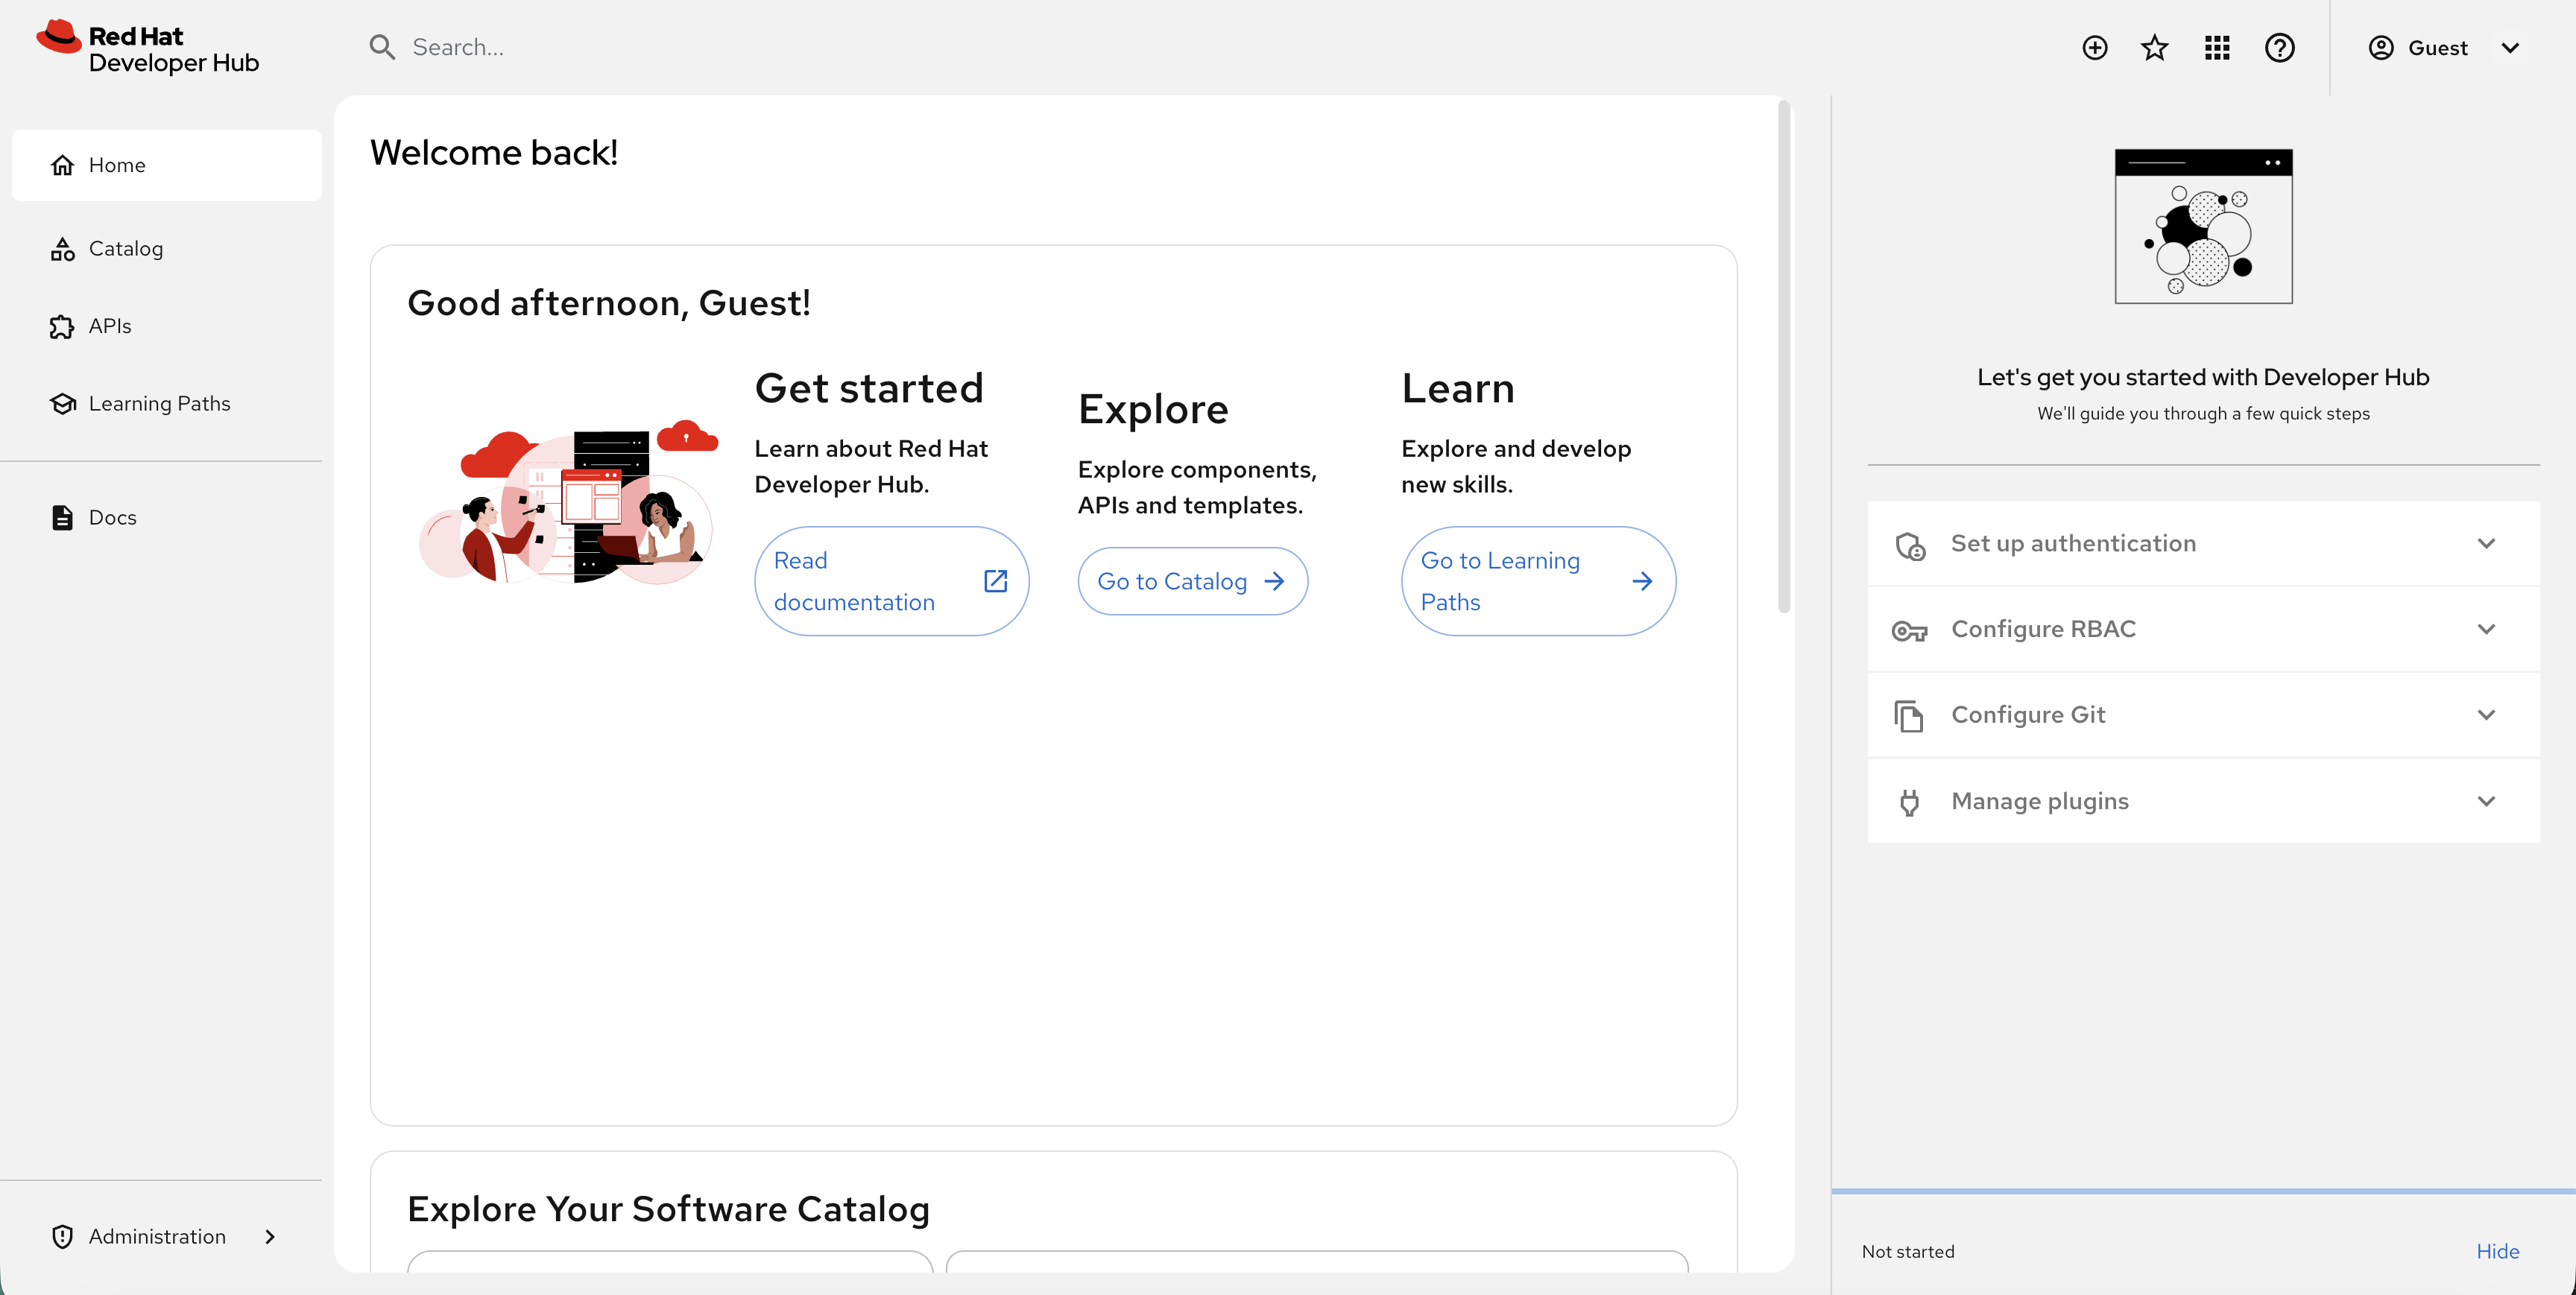
Step 3: Access the Portal
Click the Developer Hub tab at the top of Showroom. You’ll see the login page — select Guest and click Enter.
|
This is a basic RHDH deployment with guest authentication. In production, you would configure SSO integration, populate the software catalog, and add software templates. This module focuses on how Ops manages and monitors RHDH. |
Ops Admin: Managing RHDH from Console and CLI
As an operations administrator, you need to understand how RHDH is deployed and how to manage it. Let’s explore.
View RHDH in the OpenShift Console
-
In the OpenShift console, go to Workloads → Pods
-
Select the backstage project from the project dropdown
-
You’ll see the
backstage-developer-hubandbackstage-psql-developer-hubpods running

Click on a pod to see:
-
Pod details and status
-
Resource usage (CPU/Memory)
-
Environment variables
-
Mounted ConfigMaps and Secrets
Explore the Operator
The RHDH Operator manages the Backstage instance:
-
Go to Ecosystem → Installed Operators
-
Select All Projects or rhdh-operator
-
Click on Red Hat Developer Hub
-
Under Provided APIs, you’ll see Red Hat Developer Hub
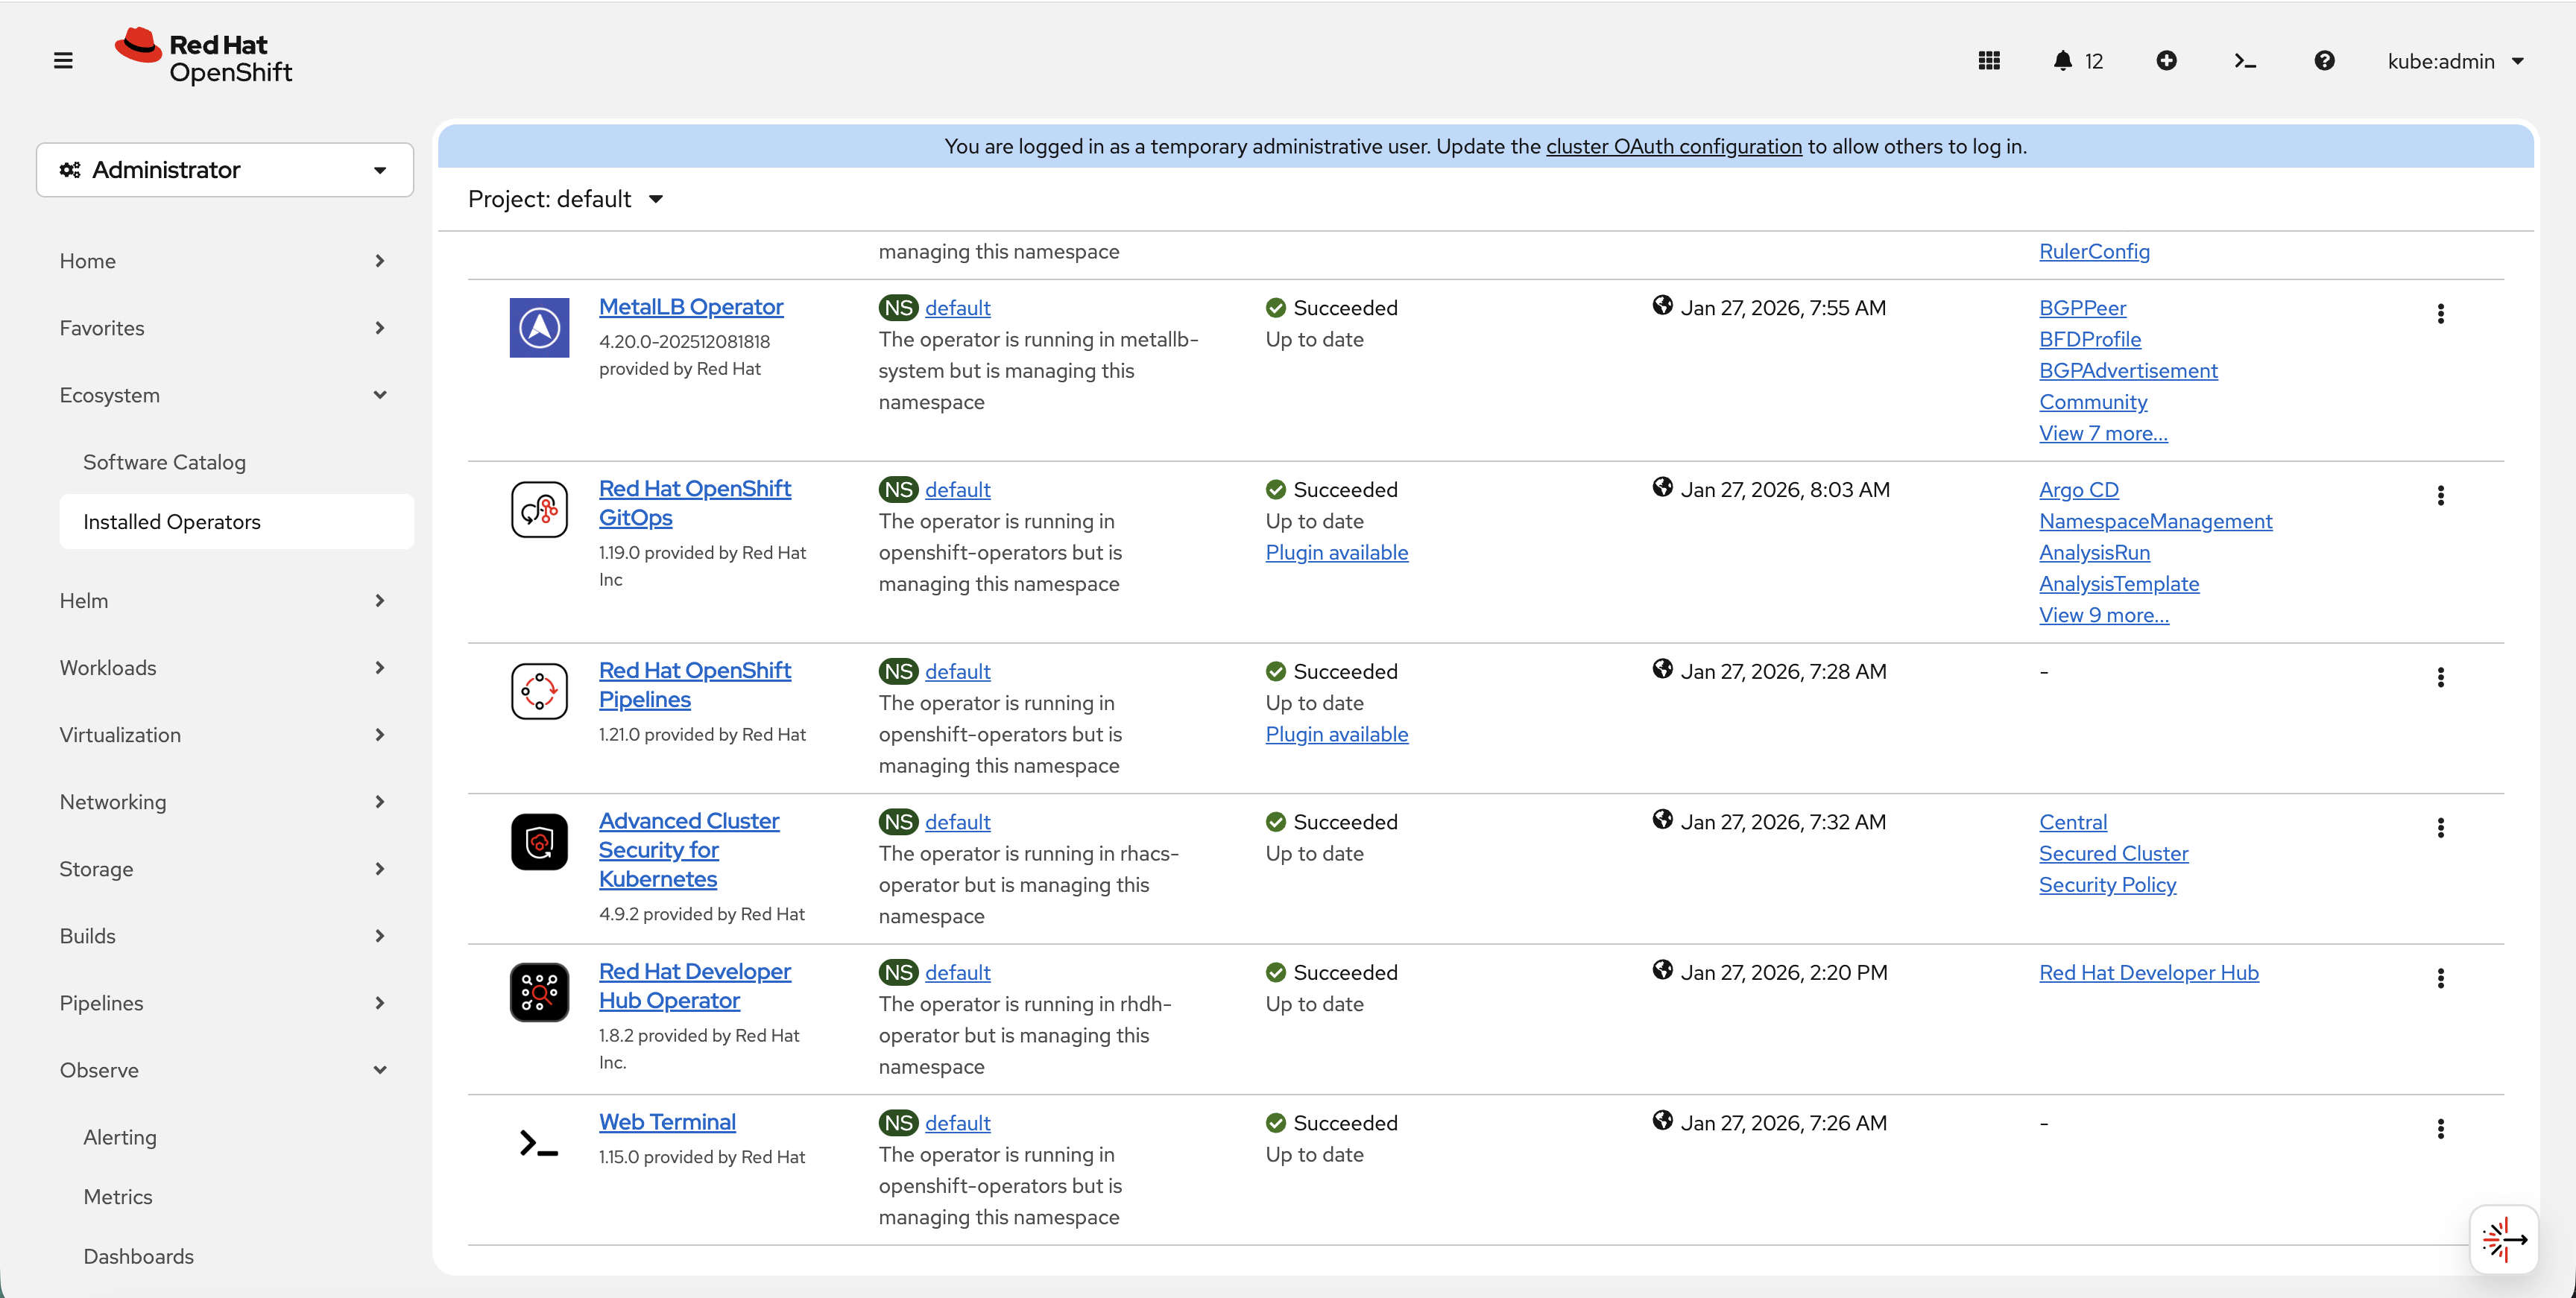
Click on the Red Hat Developer Hub tab to see the deployed instances:
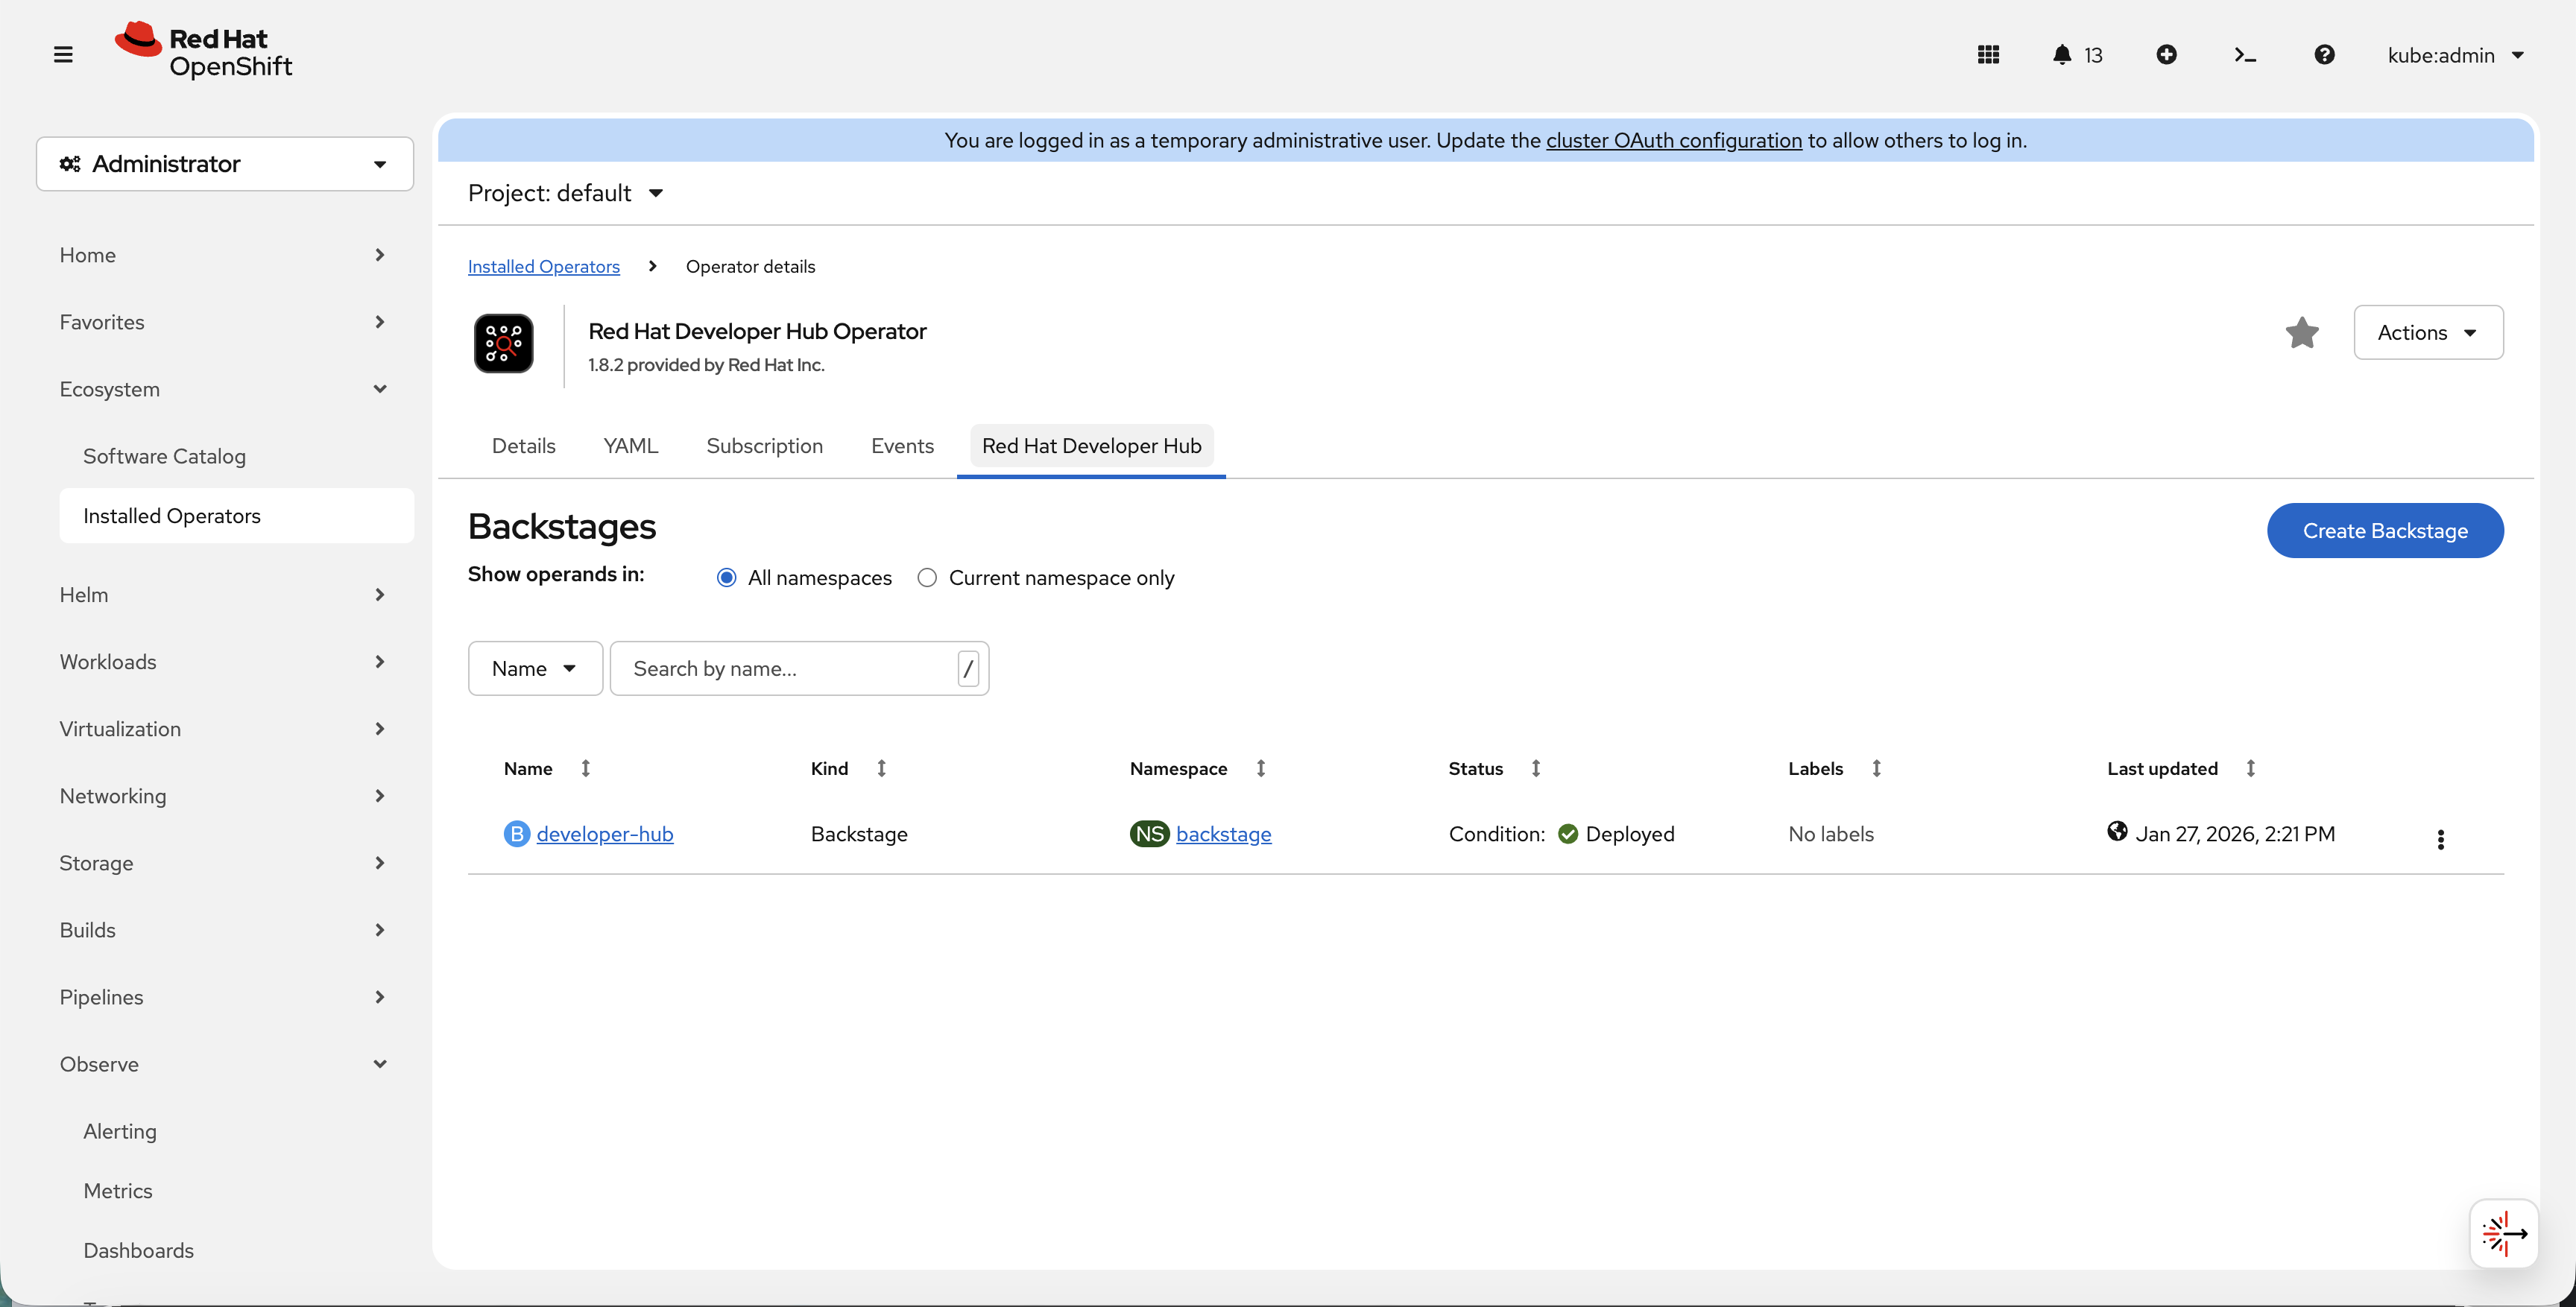
View the Backstage CR via CLI:
oc get backstage -n backstageGet detailed status:
oc describe backstage developer-hub -n backstageStep 5: Register an Application in the Catalog
The catalog is the heart of Developer Hub — a unified view of every service your organization runs. Right now it’s empty because nobody has registered anything. Let’s fix that.
Applications are registered via catalog-info.yaml files — simple YAML that describes what the service is, who owns it, and where it runs. Here’s what one looks like:
apiVersion: backstage.io/v1alpha1
kind: Component
metadata:
  name: weather-app
  description: Weather microservices application
  annotations:
    backstage.io/kubernetes-namespace: ops-track-demo   # links to OpenShift namespace
    backstage.io/kubernetes-id: weather-app              # matches labels on deployments
  tags:
    - openshift
    - ops-track
spec:
  type: service
  lifecycle: production
  owner: ops-team          # who is responsible for this service
Register two applications from this workshop into the catalog:
-
In the Developer Hub tab, scroll down to Explore Your Software Catalog and click Register a component (or click the + icon in the top navigation bar)
-
Paste this URL:
https://raw.githubusercontent.com/rhpds/openshift-days-ops-showroom/main/support/catalog-info.yaml -
Click Analyze — RHDH fetches the YAML and shows you what will be registered
-
Click Import to add them to the catalog
Now click Catalog in the left navigation. You should see two components registered:
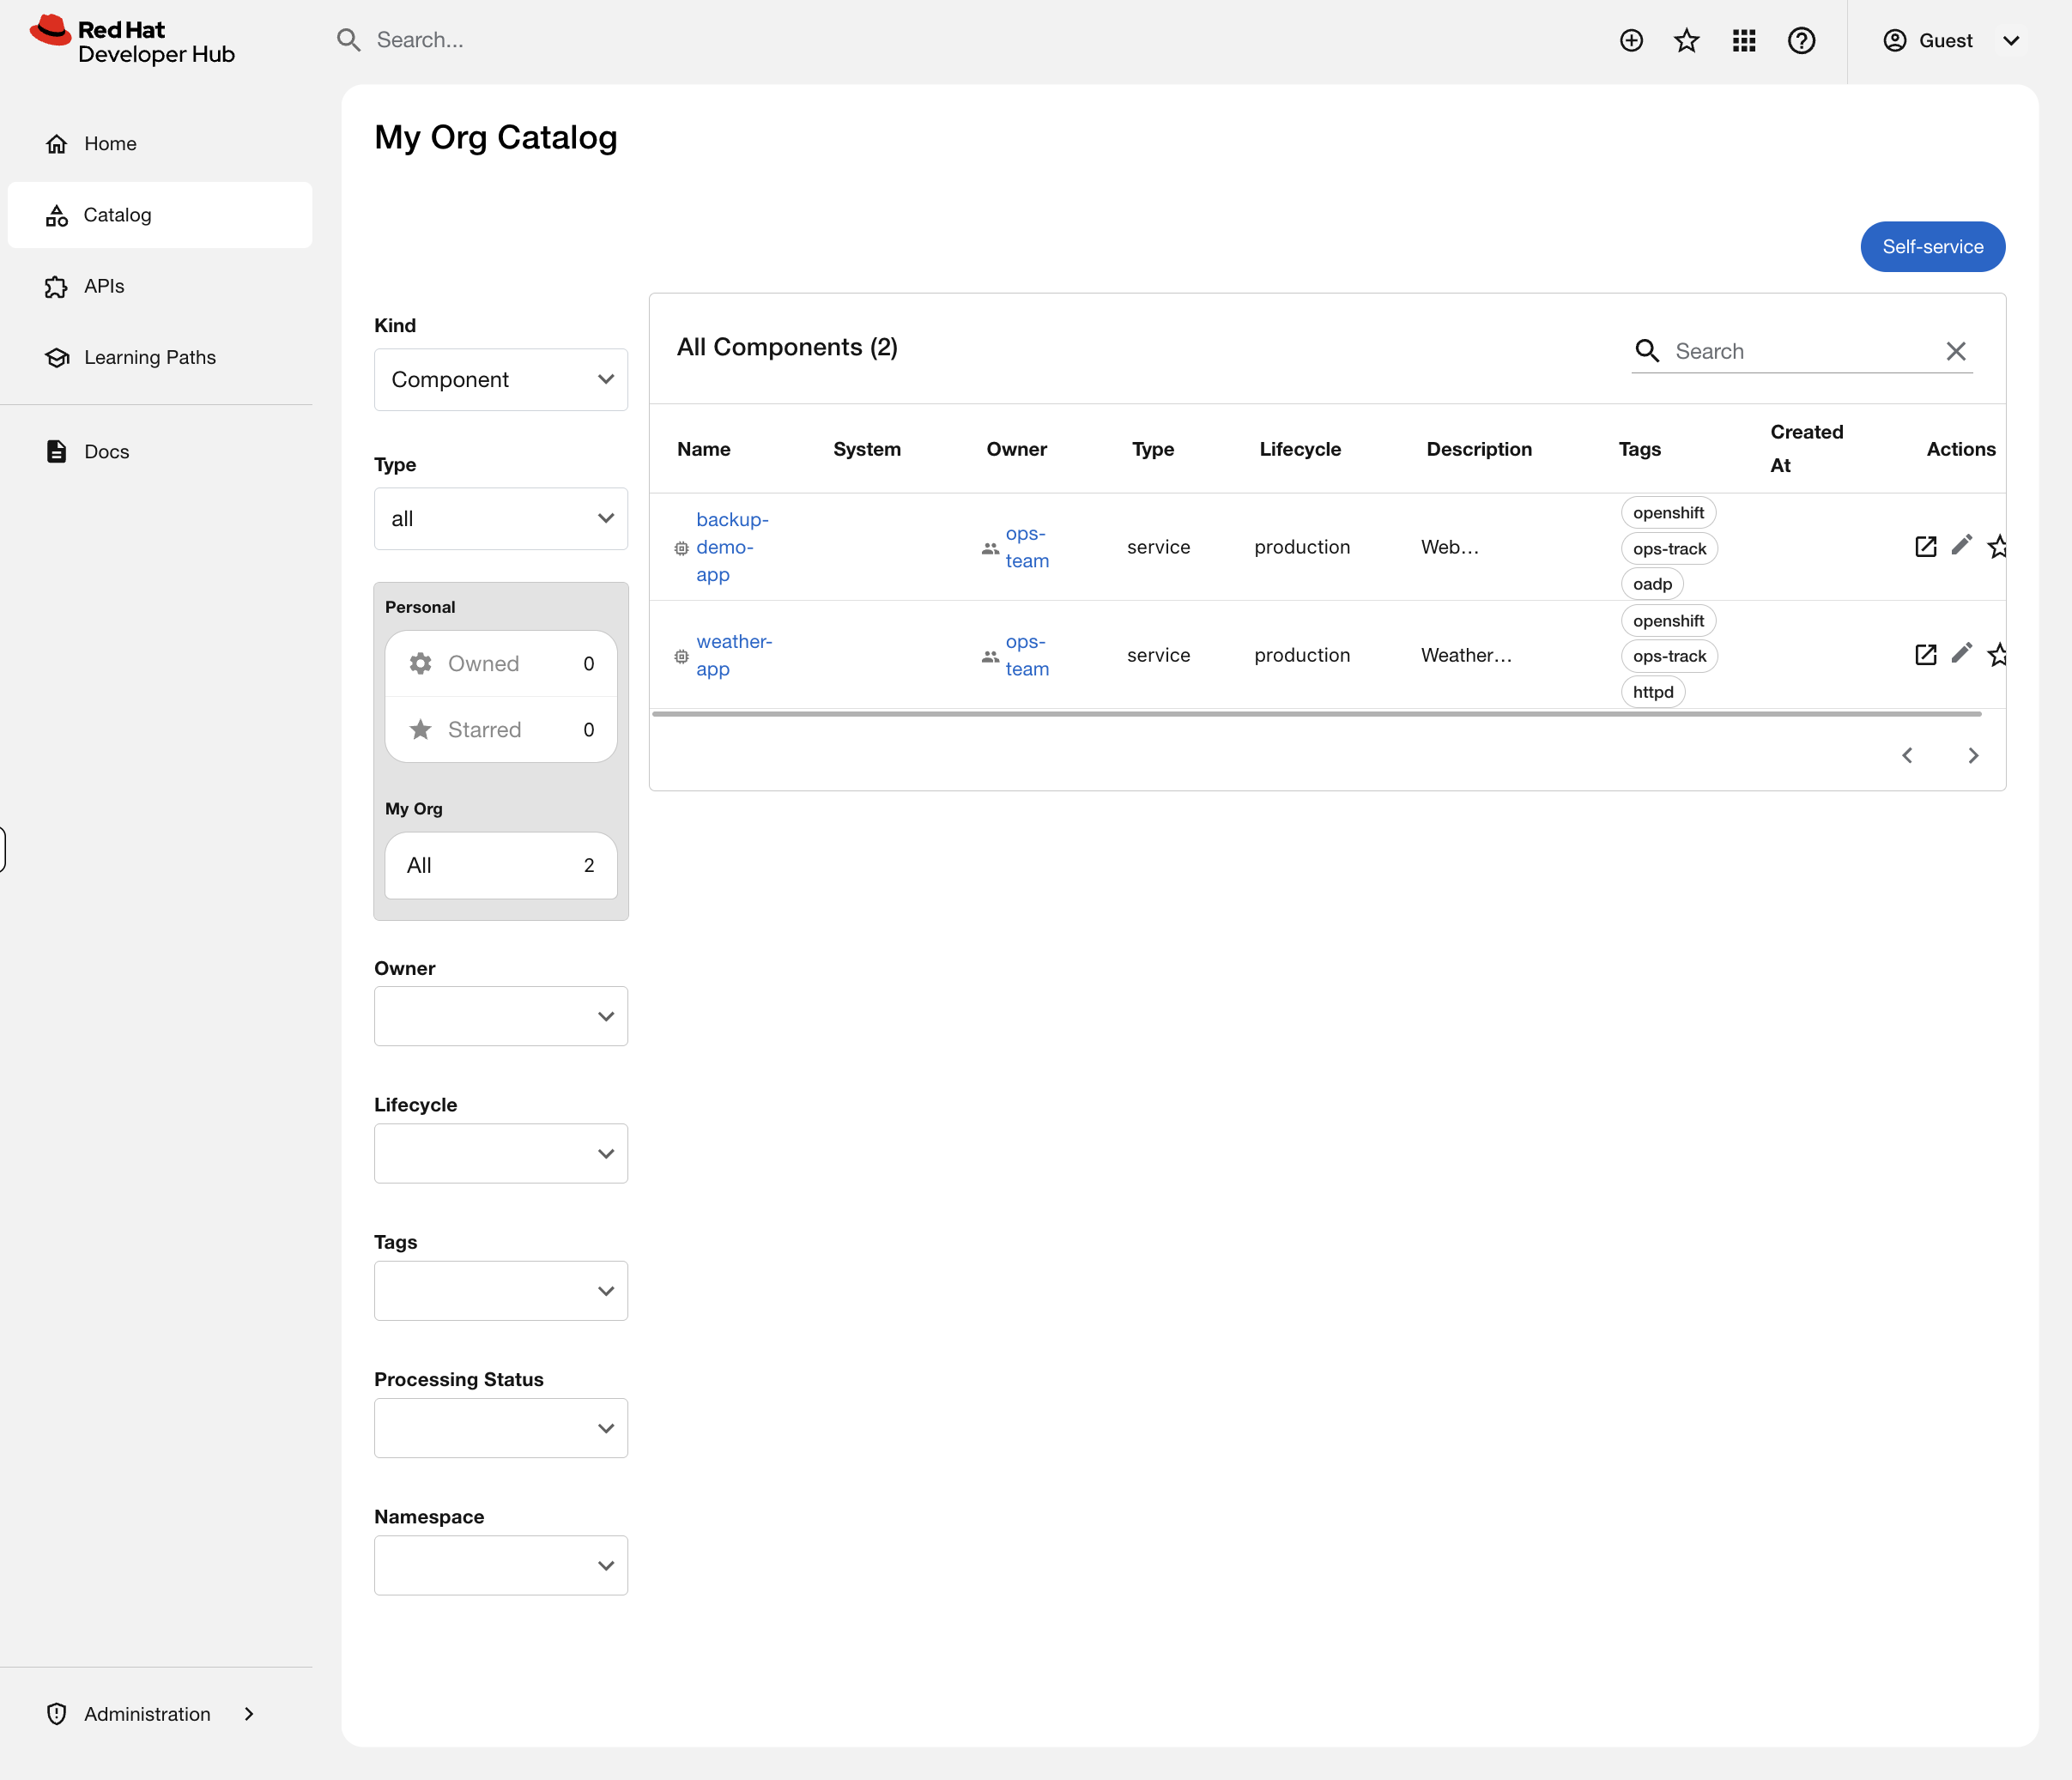
Click on either one to see the component overview page showing the owner, lifecycle, tags, and the OpenShift namespace annotation.
In production, this catalog would contain hundreds of services across dozens of teams. Developers find services, understand who owns them, read documentation, and check deployment status — all without asking ops. When teams leave or services are deprecated, the catalog makes it visible instead of leaving orphaned workloads running in the cluster.
But right now, this catalog is just a list. Click on weather-app — you see metadata, but nothing about what’s actually running in the cluster. A developer looking at this would still have to ask you: "Is my app running? How many pods are up? Any restarts?"
Let’s fix that.
Hands-On: Enable the Kubernetes Plugin
This is where RHDH goes from a static catalog to a live operational dashboard. We’re going to enable the Kubernetes plugin so that when a developer clicks on a service in the catalog, they see real-time pod status, resource usage, and deployment health — without needing oc access, without a ticket, without asking anyone.
Think about how many times a week your team gets asked: "Is my app running?" You’re about to eliminate that question.
Step 1: Create a Service Account for RHDH
RHDH needs read access to the cluster to display Kubernetes resources. We’ll create a dedicated service account with least-privilege access — cluster-reader, not cluster-admin:
oc create serviceaccount rhdh-kubernetes-plugin -n backstageoc adm policy add-cluster-role-to-user cluster-reader -z rhdh-kubernetes-plugin -n backstageCreate a token for the service account and store it as a Secret that RHDH can use:
SA_TOKEN=$(oc create token rhdh-kubernetes-plugin -n backstage --duration=8760h)
oc create secret generic rhdh-kubernetes-plugin-token -n backstage \
  --from-literal=K8S_PLUGIN_SA_TOKEN="$SA_TOKEN"
Step 2: Enable the Dynamic Plugins
RHDH ships with dozens of plugins bundled in the image — they just need to be switched on. We’ll enable three:
-
Kubernetes Backend — connects to the cluster API to fetch pod/deployment data
-
Kubernetes Frontend — renders the Kubernetes tab on catalog components
-
Topology — provides a visual map of how application components connect
Create a ConfigMap that tells RHDH which plugins to activate:
cat <<'EOF' | oc apply -f -
apiVersion: v1
kind: ConfigMap
metadata:
  name: dynamic-plugins-rhdh
  namespace: backstage
data:
  dynamic-plugins.yaml: |
    includes:
      - dynamic-plugins.default.yaml
    plugins:
      - package: ./dynamic-plugins/dist/backstage-plugin-kubernetes-backend-dynamic
        disabled: false
      - package: ./dynamic-plugins/dist/backstage-plugin-kubernetes
        disabled: false
      - package: ./dynamic-plugins/dist/backstage-community-plugin-topology
        disabled: false
EOF
Step 3: Configure the Cluster Connection
Now tell RHDH where to find the cluster and how to authenticate. We need the API server URL and the console URL (so developers can click through to OpenShift):
API_URL=$(oc whoami --show-server)
CONSOLE_URL=$(oc get route console -n openshift-console -o jsonpath='https://{.spec.host}')
EXISTING=$(oc get configmap app-config-rhdh -n backstage -o jsonpath='{.data.app-config-rhdh\.yaml}')

UPDATED=$(printf '%s\nkubernetes:\n  serviceLocatorMethod:\n    type: multiTenant\n  clusterLocatorMethods:\n    - type: config\n      clusters:\n        - name: openshift\n          url: %s\n          authProvider: serviceAccount\n          skipTLSVerify: true\n          serviceAccountToken: ${K8S_PLUGIN_SA_TOKEN}\n          dashboardUrl: %s\n          dashboardApp: openshift\n' "$EXISTING" "$API_URL" "$CONSOLE_URL")

oc create configmap app-config-rhdh -n backstage \
  --from-literal="app-config-rhdh.yaml=$UPDATED" \
  --dry-run=client -o yaml | oc apply -f -
We’re using skipTLSVerify for this workshop environment. In production, you would configure the cluster’s CA certificate using caData or caFile instead.
|
Step 4: Apply the Configuration
Now patch the Backstage Custom Resource to tell the Operator about our new dynamic plugins ConfigMap and the service account token Secret:
oc patch backstage developer-hub -n backstage --type=merge -p '{
  "spec": {
    "application": {
      "dynamicPluginsConfigMapName": "dynamic-plugins-rhdh",
      "extraEnvs": {
        "envs": [
          {
            "name": "NODE_TLS_REJECT_UNAUTHORIZED",
            "value": "0"
          }
        ],
        "secrets": [
          {
            "name": "rhdh-kubernetes-plugin-token"
          }
        ]
      }
    }
  }
}'
The Operator sees the CR change and triggers a rolling restart — new pods with plugins enabled, old pods terminated, zero downtime. Watch it happen:
oc rollout status deployment/backstage-developer-hub -n backstage --timeout=300sThis takes 2-3 minutes as the init container installs the dynamic plugins before the main container starts.
Step 5: Label the Workloads
The Kubernetes plugin discovers pods by matching a label on the workloads to the backstage.io/kubernetes-id annotation on the catalog component. Label the weather app deployments:
This step requires the weather app deployments from the Debugging & Troubleshooting module to be running in ops-track-demo. If you haven’t completed that module, you can skip this step — the catalog entry will still register, the Kubernetes tab will simply show no pods.
|
for dep in weather-api weather-backend weather-cache weather-frontend weather-proxy; do
  oc patch deployment $dep -n ops-track-demo --type=json \
    -p '[{"op":"add","path":"/spec/template/metadata/labels/backstage.io~1kubernetes-id","value":"weather-app"}]' 2>/dev/null
done
Step 6: See It in Action
| You must reload the Developer Hub tab at the top of Showroom for the newly enabled plugins to appear. Click the reload button (circular arrow) next to the Developer Hub tab, or close and reopen it. Without reloading, the Kubernetes and Topology tabs will not be visible. |
Go back to the Developer Hub tab and click on weather-app in the catalog. You should now see:
-
A Kubernetes tab showing all 5 pods with their status, restarts, and age
-
A Topology tab showing a visual map of the weather app’s deployments
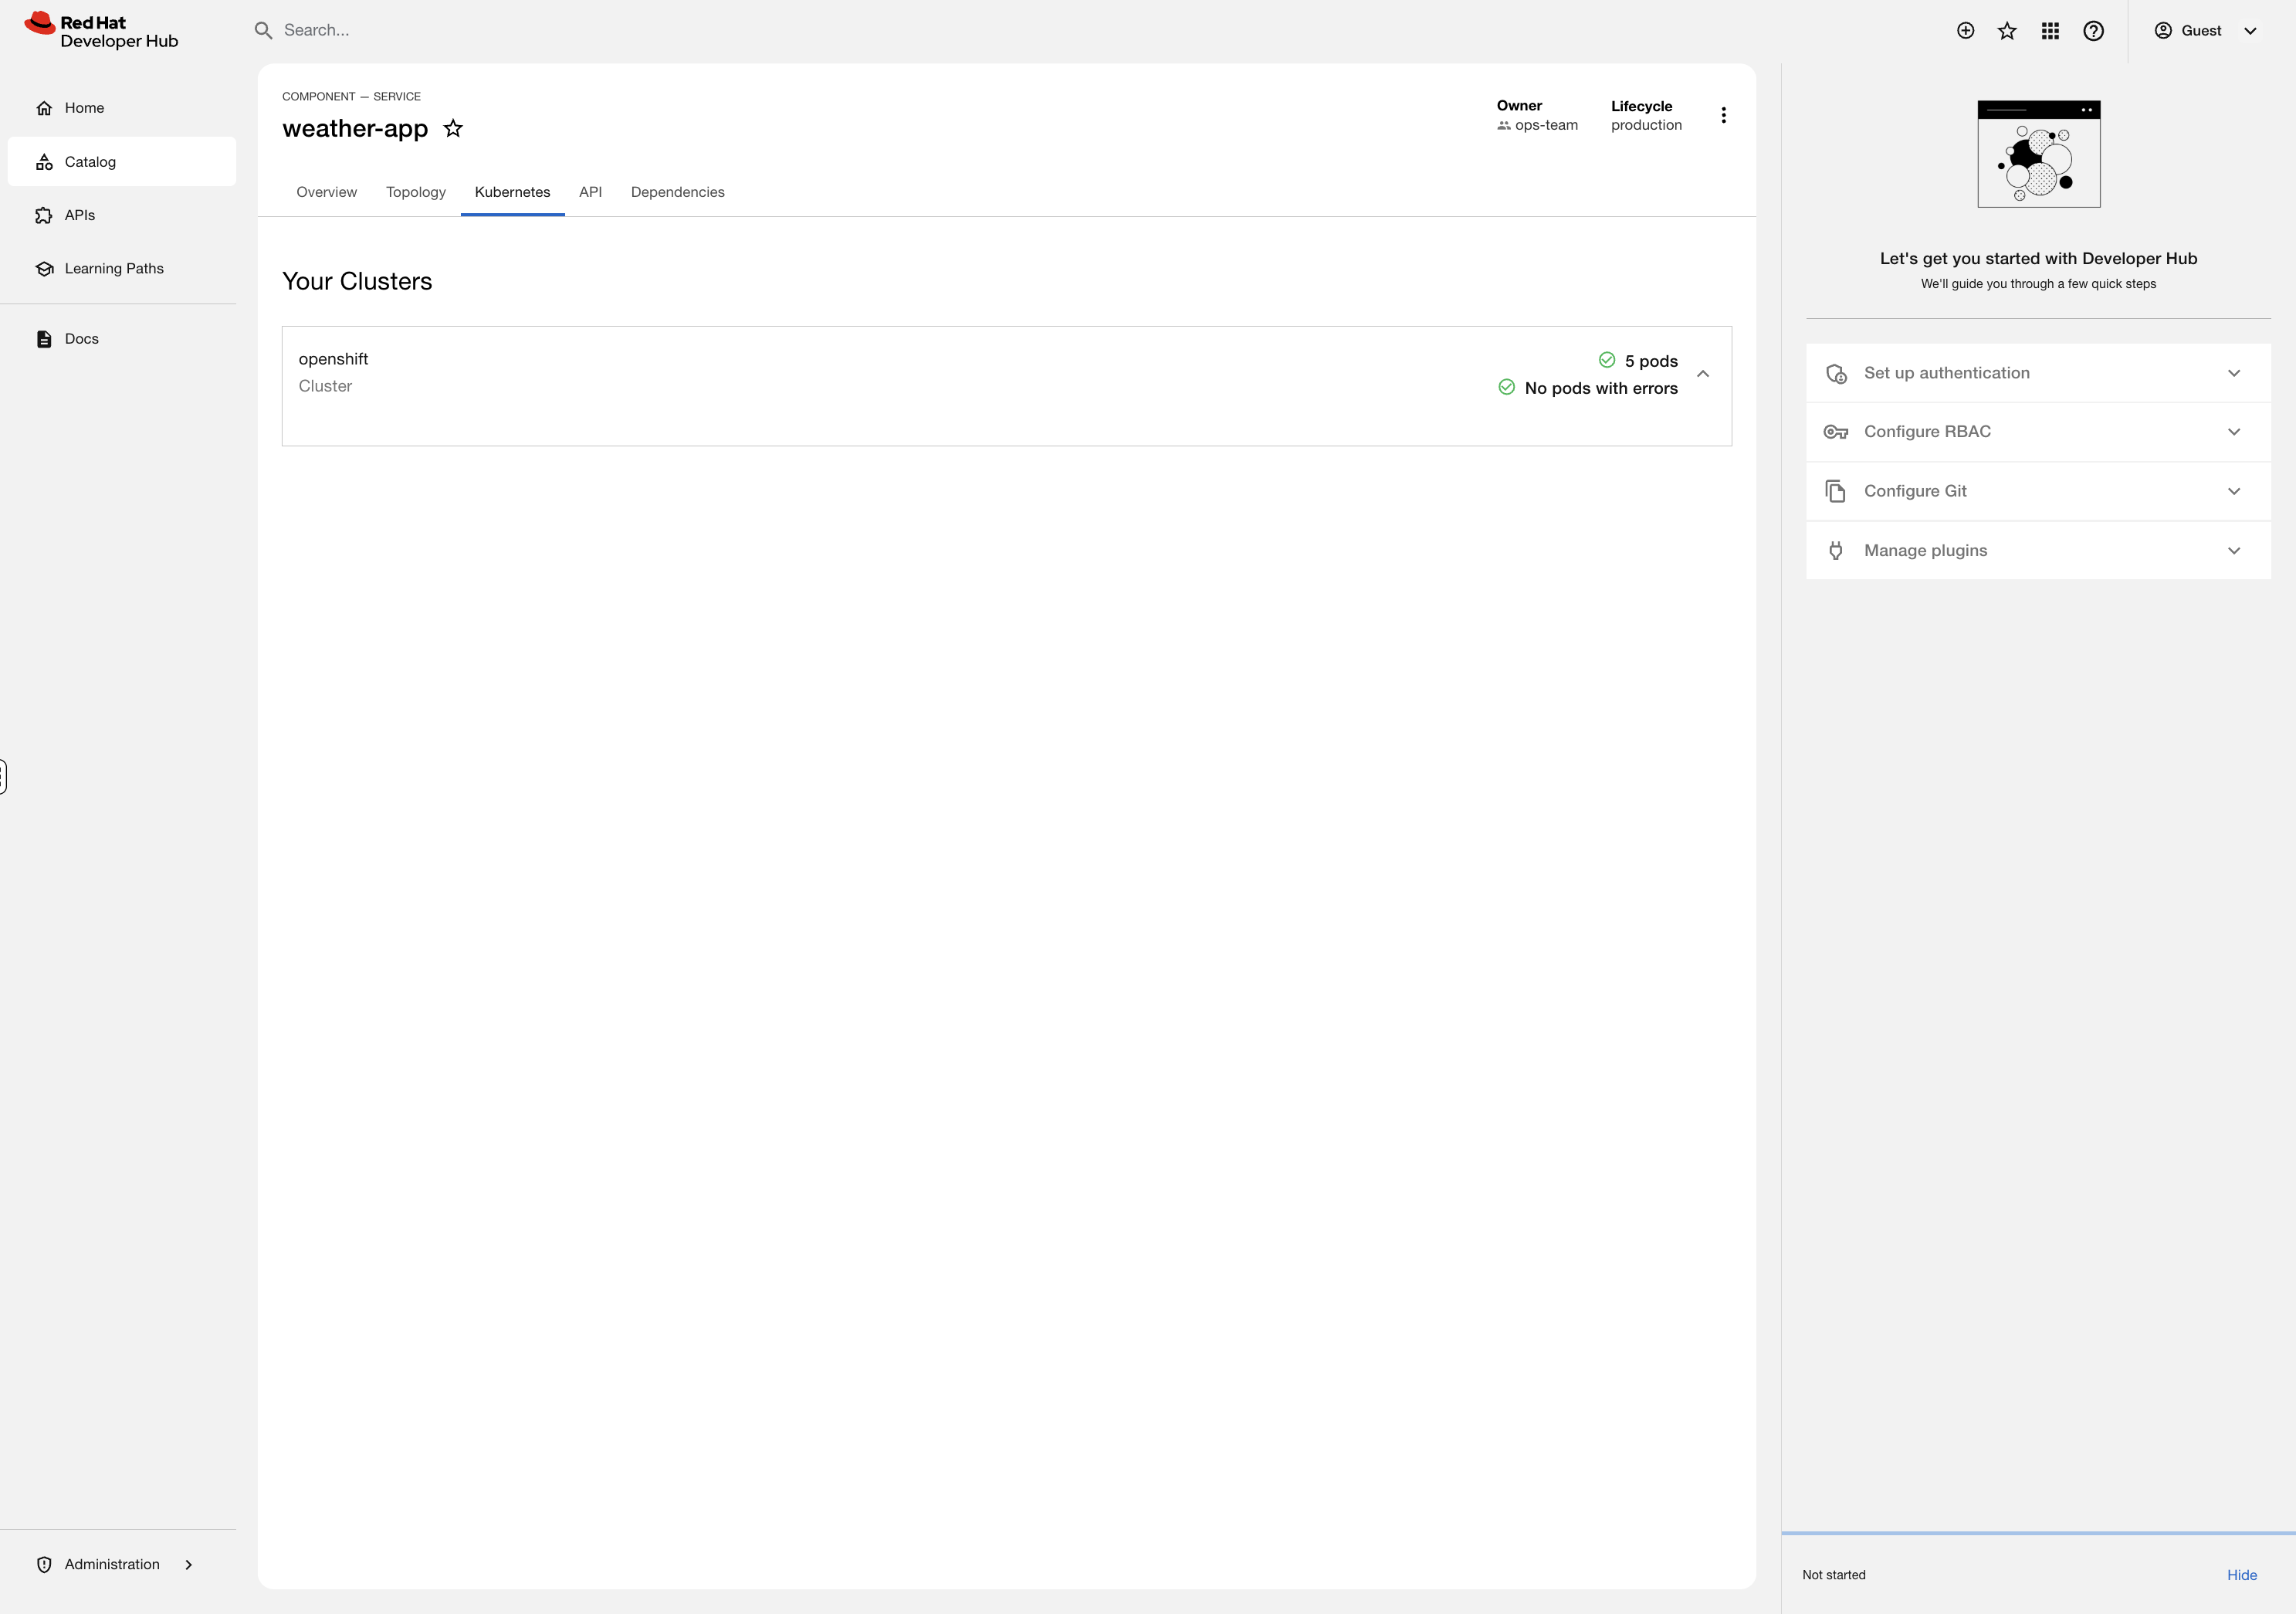
This is the moment. A developer clicks a service in the catalog and sees exactly what’s running — pod count, restart history, resource usage — without oc access, without opening a ticket, without messaging you on Slack.
You configured this once. Every service in the catalog gets this for free when it has the right annotations and labels. That’s the Kubernetes plugin eliminating your most common developer question: "Is my app running?"
What You Just Built
Take a step back and look at what you configured as a platform admin:
| What You Did | Why It Matters |
|---|---|
Created a scoped Service Account |
Least-privilege access — RHDH can read cluster state but can’t modify anything |
Enabled Dynamic Plugins via ConfigMap |
No rebuilding images, no redeployment from scratch — just declare which plugins to activate |
Configured cluster connection in app-config |
Centralized configuration managed through OpenShift-native ConfigMaps and Secrets |
Patched the Backstage CR |
The Operator handled the rolling restart — you declared intent, OpenShift did the work |
Labeled workloads for discovery |
Standard Kubernetes labels connect catalog entries to live resources |
Every step used OpenShift primitives you already know: Service Accounts, RBAC, ConfigMaps, Secrets, Operators, Custom Resources, and rolling deployments. RHDH isn’t a black box — it’s just another workload managed with the same tools you use for everything else.
Going Further
This module gave you a working RHDH with live cluster visibility. A full platform engineering implementation adds:
-
Software Templates — developers click "Create New App" and get a namespace, pipeline, git repo, and catalog entry automatically, all following ops-defined golden paths
-
RBAC Plugin — control who can register components, create from templates, or view specific services
-
SSO Integration — connect to your identity provider so developers log in with their existing credentials
-
CI/CD Plugins — Tekton pipeline runs and ArgoCD sync status visible directly in the catalog
-
TechDocs — documentation lives alongside the code and renders in the portal
Interested in a deep-dive? Ask your instructor about the Platform Engineering with RHDH Workshop.