OpenShift Platform Overview
Module Overview
Duration: 30 minutes
Format: Hands-on demonstration
Audience: IT Decision Makers, Infrastructure Architects, IT Operations
Learning Objectives
By the end of this module, you will understand:
-
Key differences between OpenShift and upstream Kubernetes
-
OpenShift’s integrated platform approach
-
How the Administrator Console provides operational advantages
-
Built-in capabilities that come ready to use out of the box
Accessing the Cluster
Your terminal is already connected to the cluster with admin access. Verify by clicking the command below:
oc whoamiYou should see your admin user.
What is OpenShift?
OpenShift Container Platform is an enterprise Kubernetes platform that includes:
-
Kubernetes - The container orchestration engine
-
Integrated Developer Tools - S2I builds, CI/CD pipelines
-
Enterprise Operations - Monitoring, logging, registry, networking
-
Security - Built-in RBAC, SELinux, secrets management
-
Full Support - Red Hat enterprise support and SLAs
Think of it as: Kubernetes + Everything Ops Teams Need
What OpenShift Adds to Kubernetes
1. Integrated Platform
OpenShift builds on Kubernetes and adds the operational tooling that production environments need — pre-integrated and ready to use:
-
Integrated image registry
-
Prometheus monitoring stack with built-in dashboards
-
Loki logging
-
HAProxy-based ingress routing
-
Tekton Pipelines
-
RHACS security scanning
-
Single vendor support for the entire stack
Hands-On: Exploring the OpenShift Console
Step 1: Access the Administrator Console
The OpenShift Web Console provides a unified view of your entire cluster.
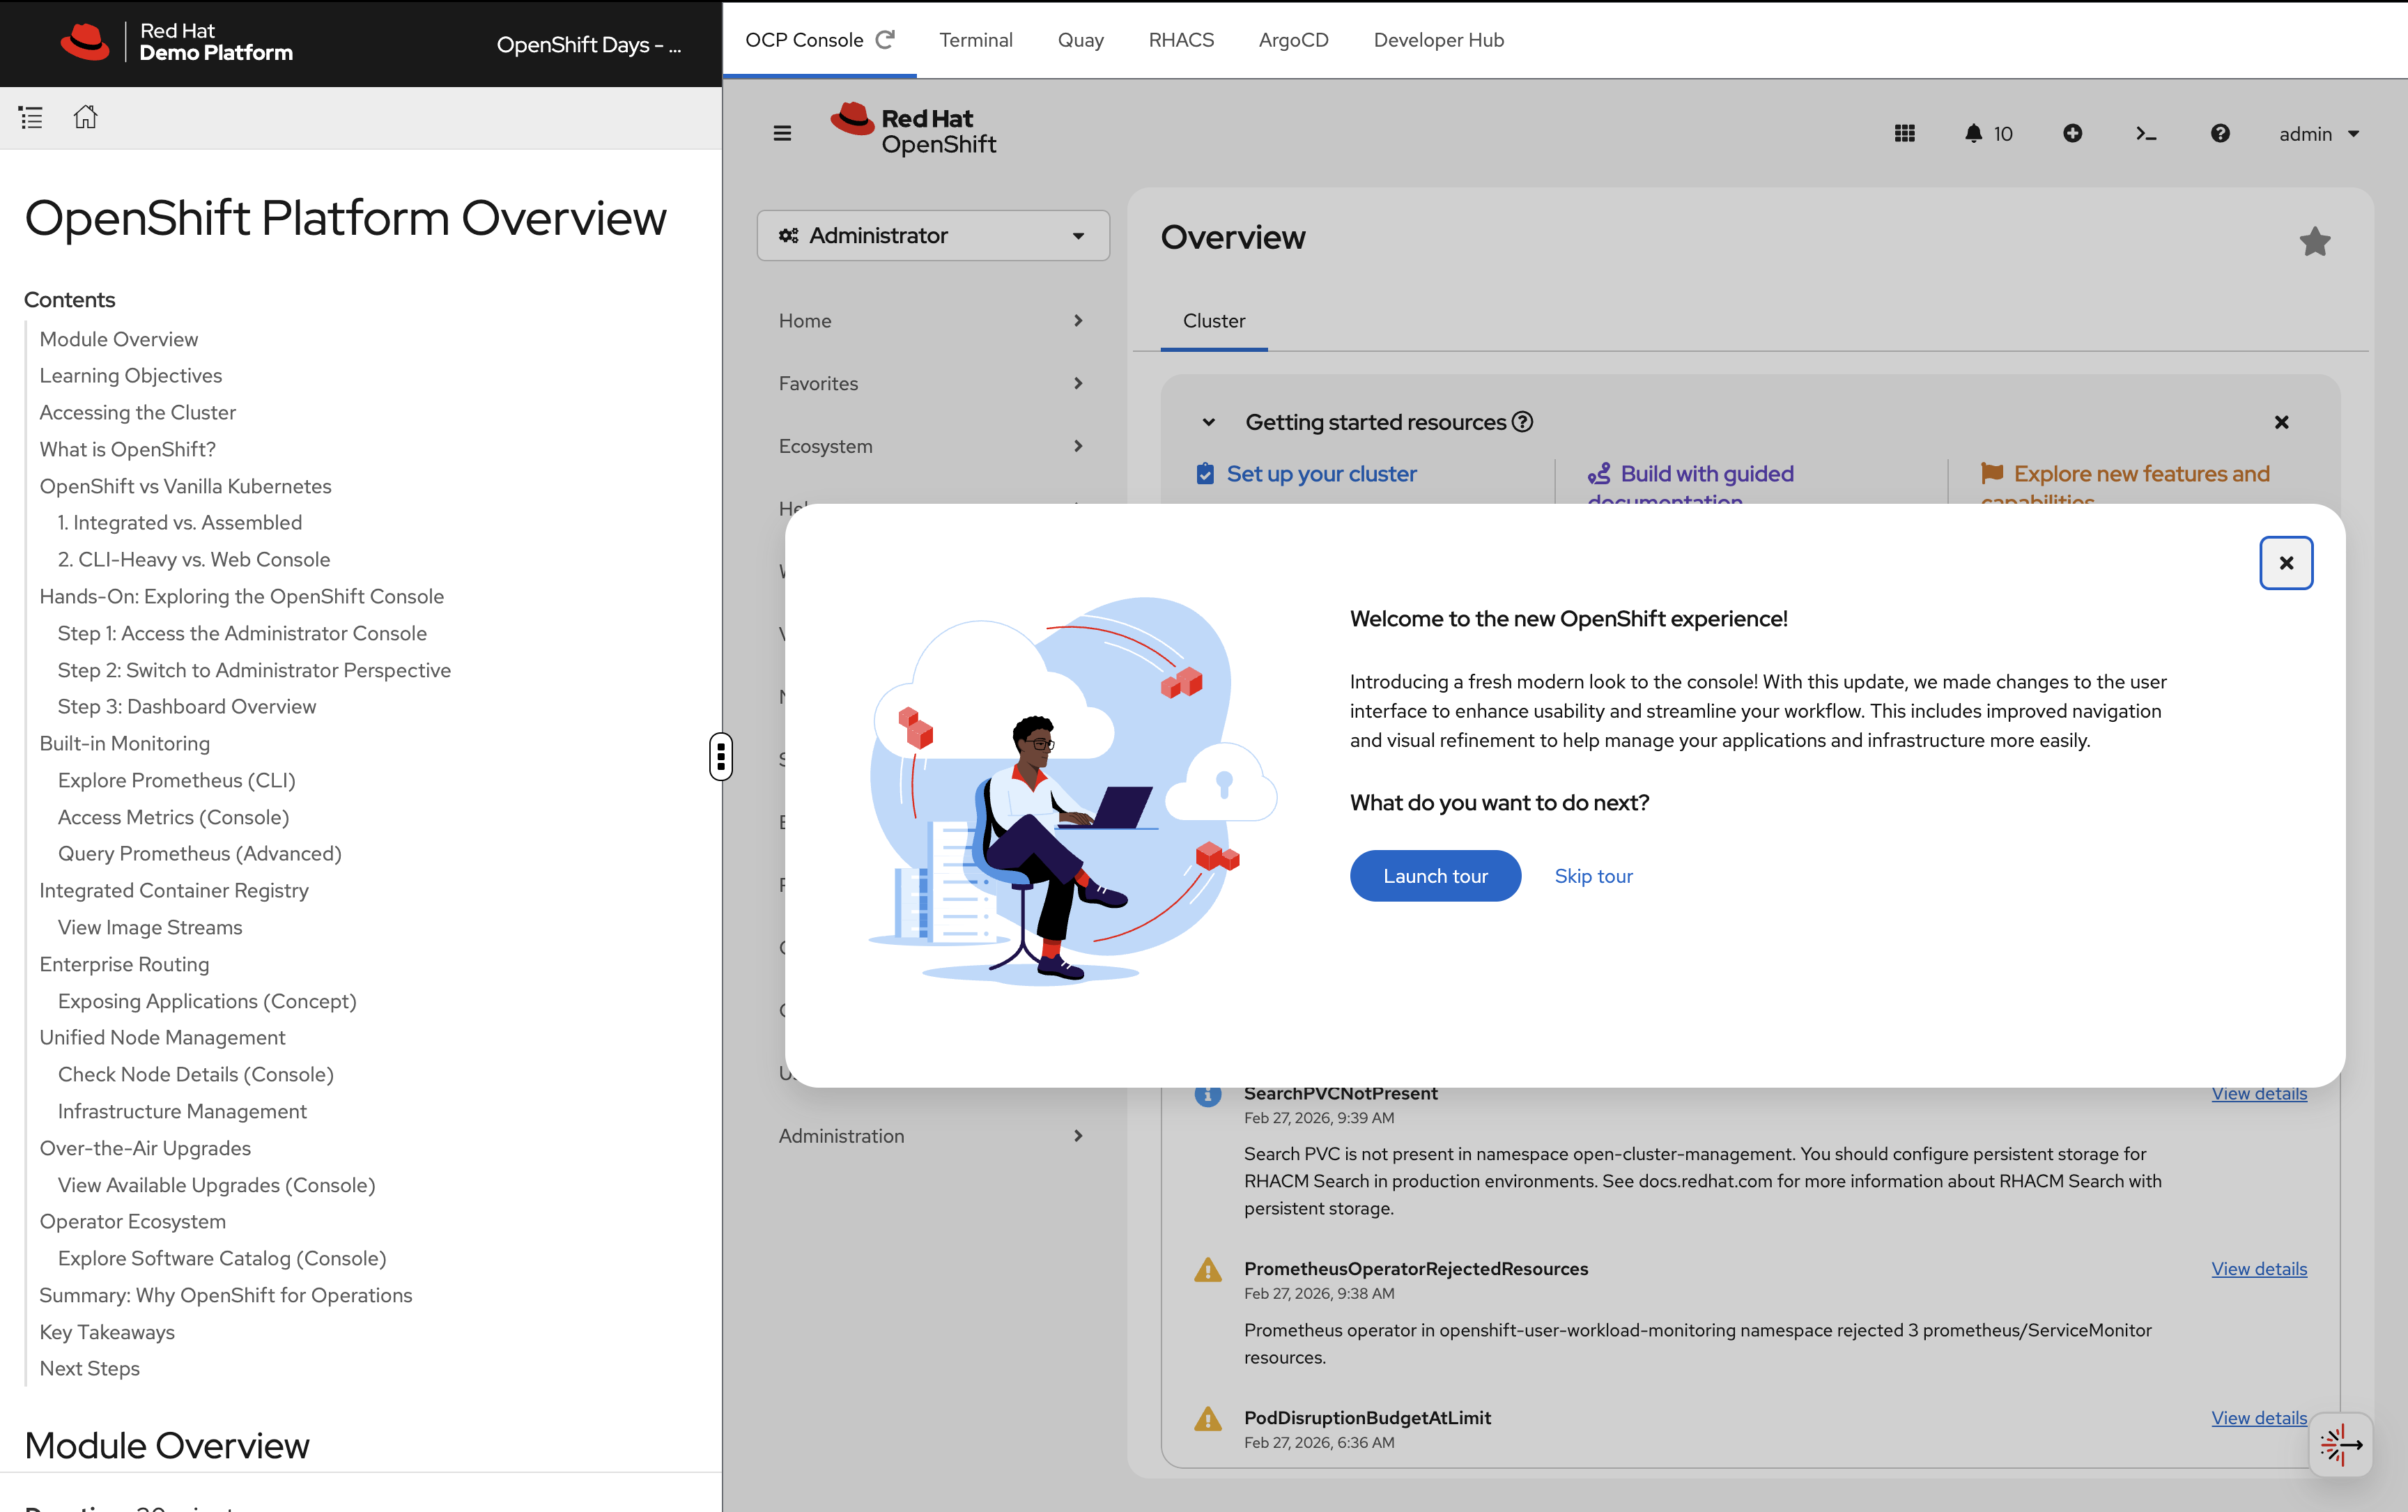
You can access the console in two ways:
-
OCP Console tab — Click the OCP Console tab at the top of this workshop. The console is embedded directly in the workshop interface so you can follow along without switching windows.
-
Separate browser tab — If you prefer a full-screen experience, run this to get the console URL and open it in a new browser tab:
oc whoami --show-console
Login with your credentials:
-
Username:
{openshift_cluster_admin_username} -
Password:
{openshift_cluster_admin_password}
Step 2: Switch to Administrator Perspective
In the top-left corner of the console, you’ll see a perspective switcher dropdown that may show Fleet Management.
Click the dropdown and select Administrator: - Administrator - Fleet Management
Make sure Administrator is selected.
Step 3: Dashboard Overview
Once in the Administrator perspective, you’ll see the Overview dashboard under Home → Overview.
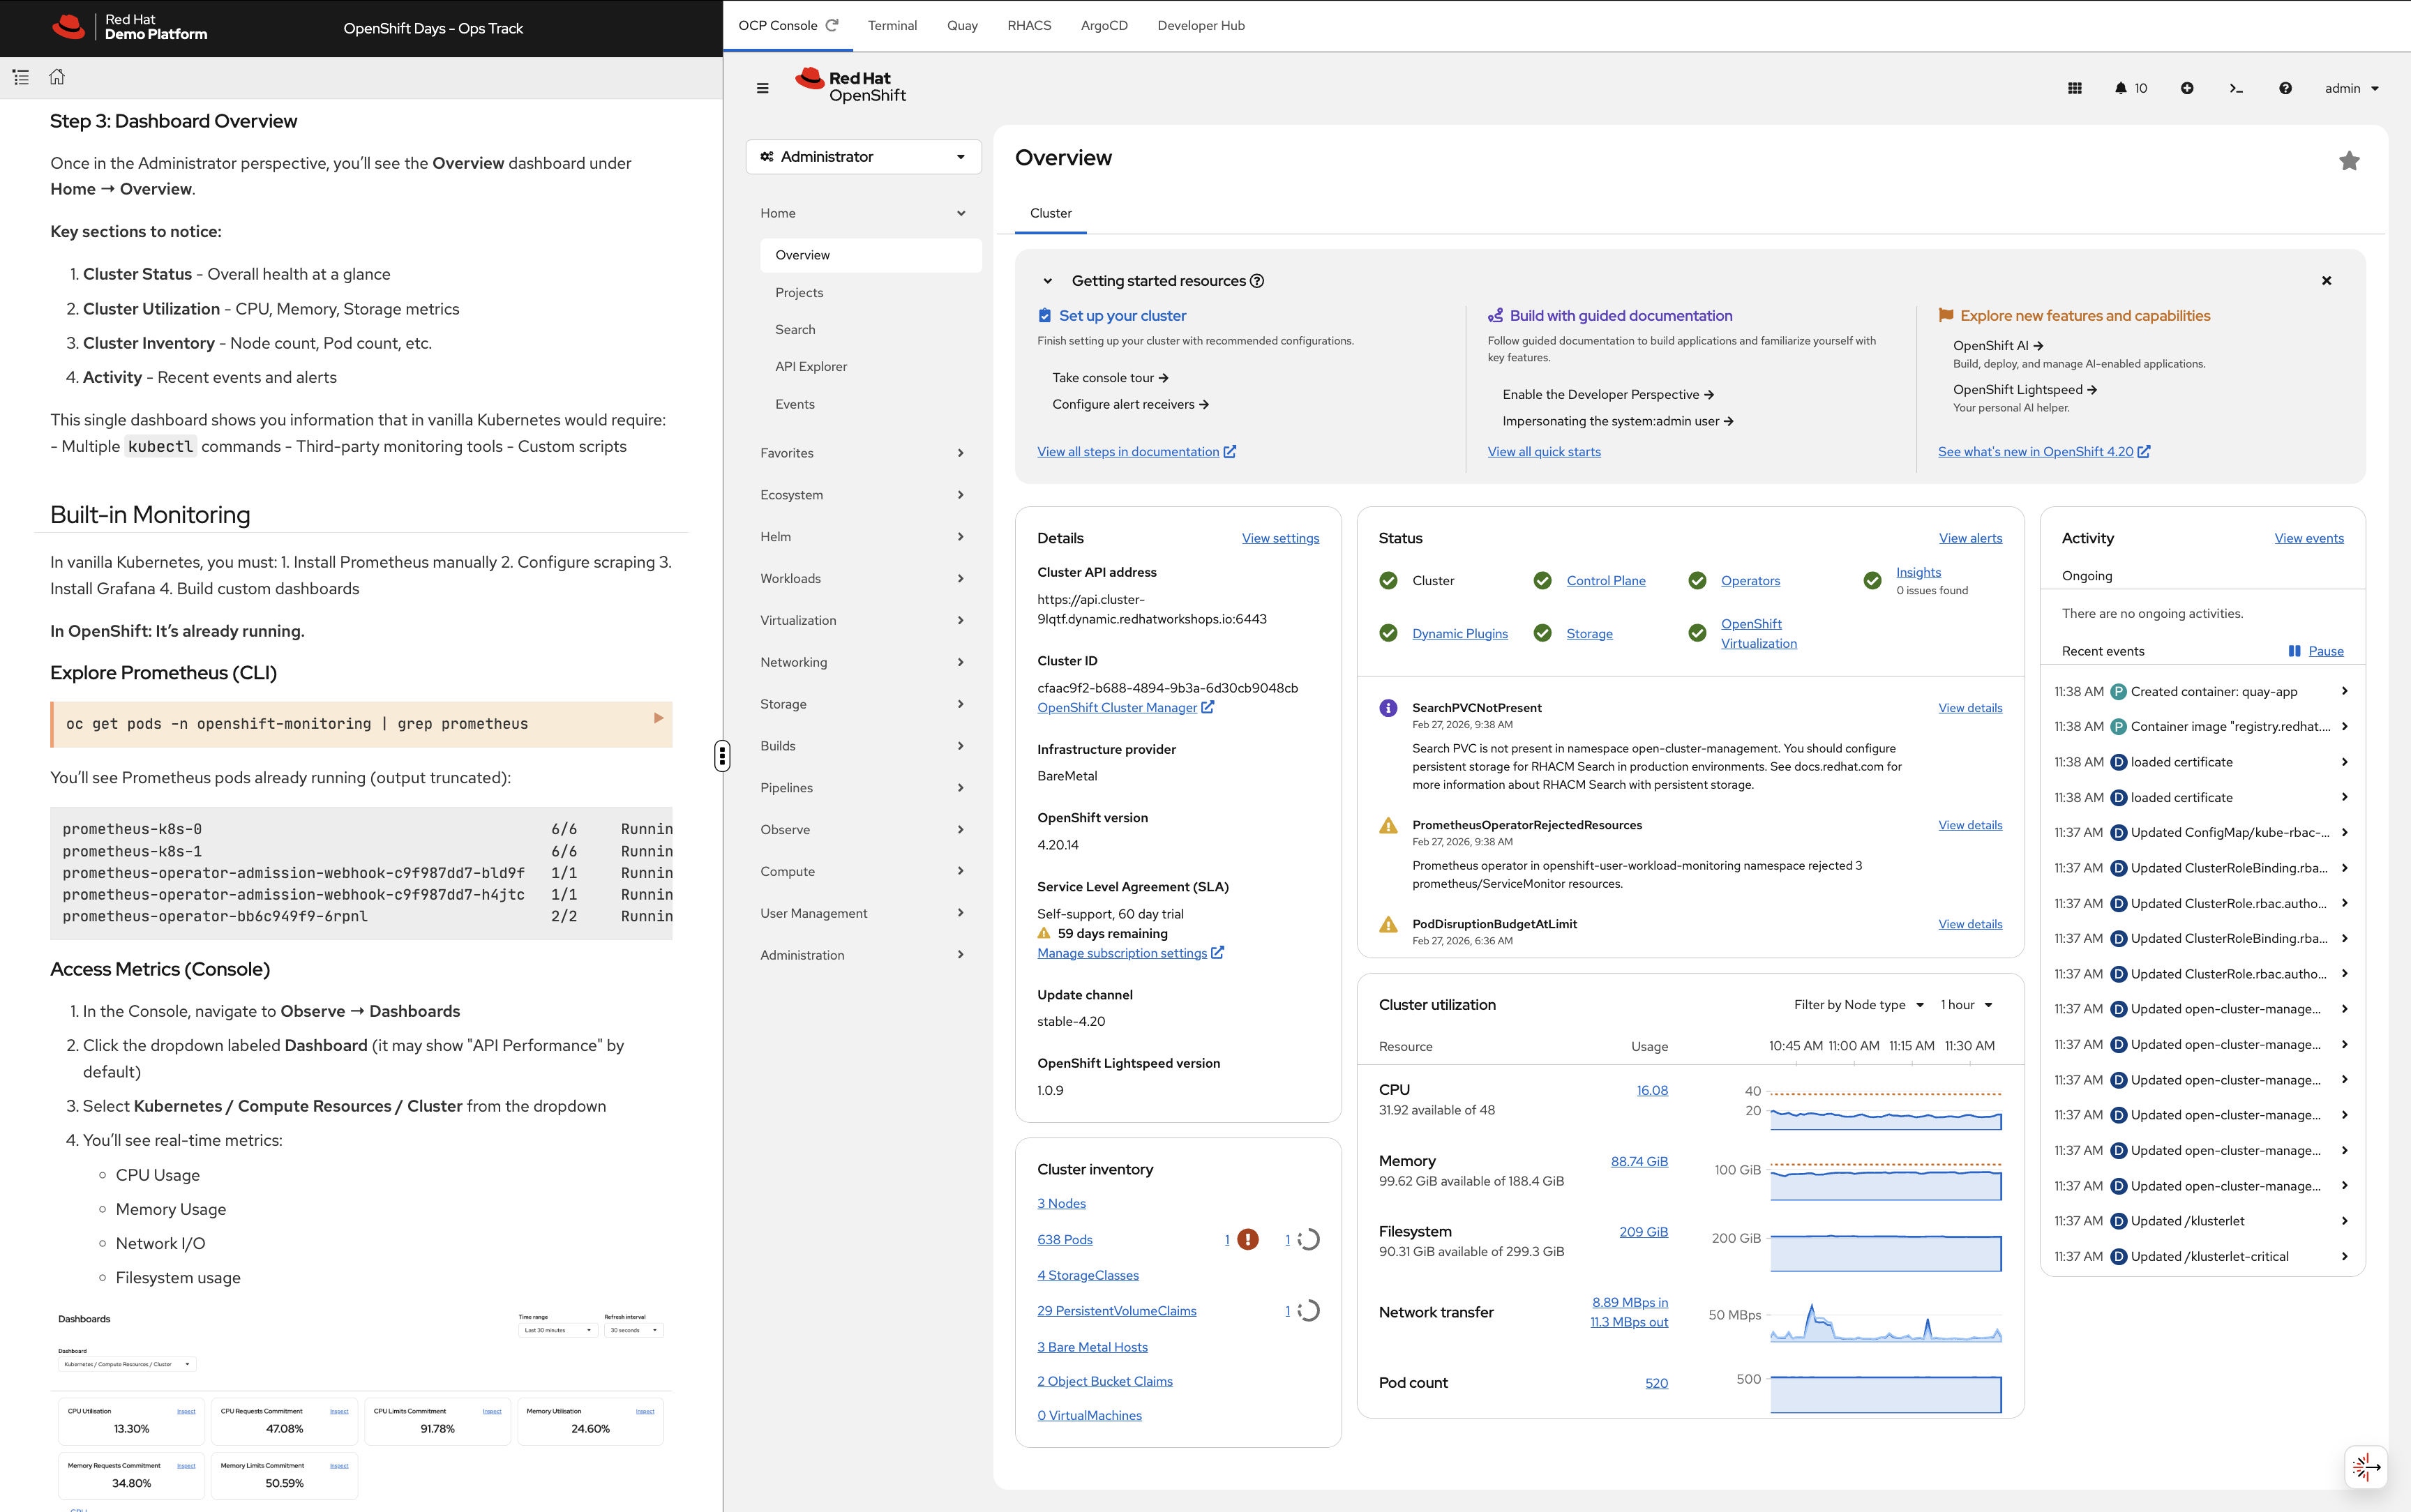
Key sections to notice:
-
Cluster Status - Overall health at a glance
-
Cluster Utilization - CPU, Memory, Storage metrics
-
Cluster Inventory - Node count, Pod count, etc.
-
Activity - Recent events and alerts
This single dashboard gives you cluster health, utilisation, inventory, and recent events — all in one view, with no setup required.
Built-in Monitoring
OpenShift ships with a fully managed Prometheus monitoring stack — Prometheus, Alertmanager, and pre-built dashboards are all running from the moment the cluster is installed.
Explore Prometheus (CLI)
oc get pods -n openshift-monitoring | grep prometheusYou’ll see Prometheus pods already running (output truncated):
prometheus-k8s-0                                        6/6     Running   0          55m
prometheus-k8s-1                                        6/6     Running   0          55m
prometheus-operator-admission-webhook-c9f987dd7-bld9f   1/1     Running   0          71m
prometheus-operator-admission-webhook-c9f987dd7-h4jtc   1/1     Running   0          71m
prometheus-operator-bb6c949f9-6rpnl                     2/2     Running   0          66m
Access Metrics (Console)
-
In the Console, navigate to Observe → Dashboards
-
Click the dropdown labeled Dashboard (it may show "API Performance" by default)
-
Select Kubernetes / Compute Resources / Cluster from the dropdown
-
You’ll see real-time metrics:
-
CPU Usage
-
Memory Usage
-
Network I/O
-
Filesystem usage
-
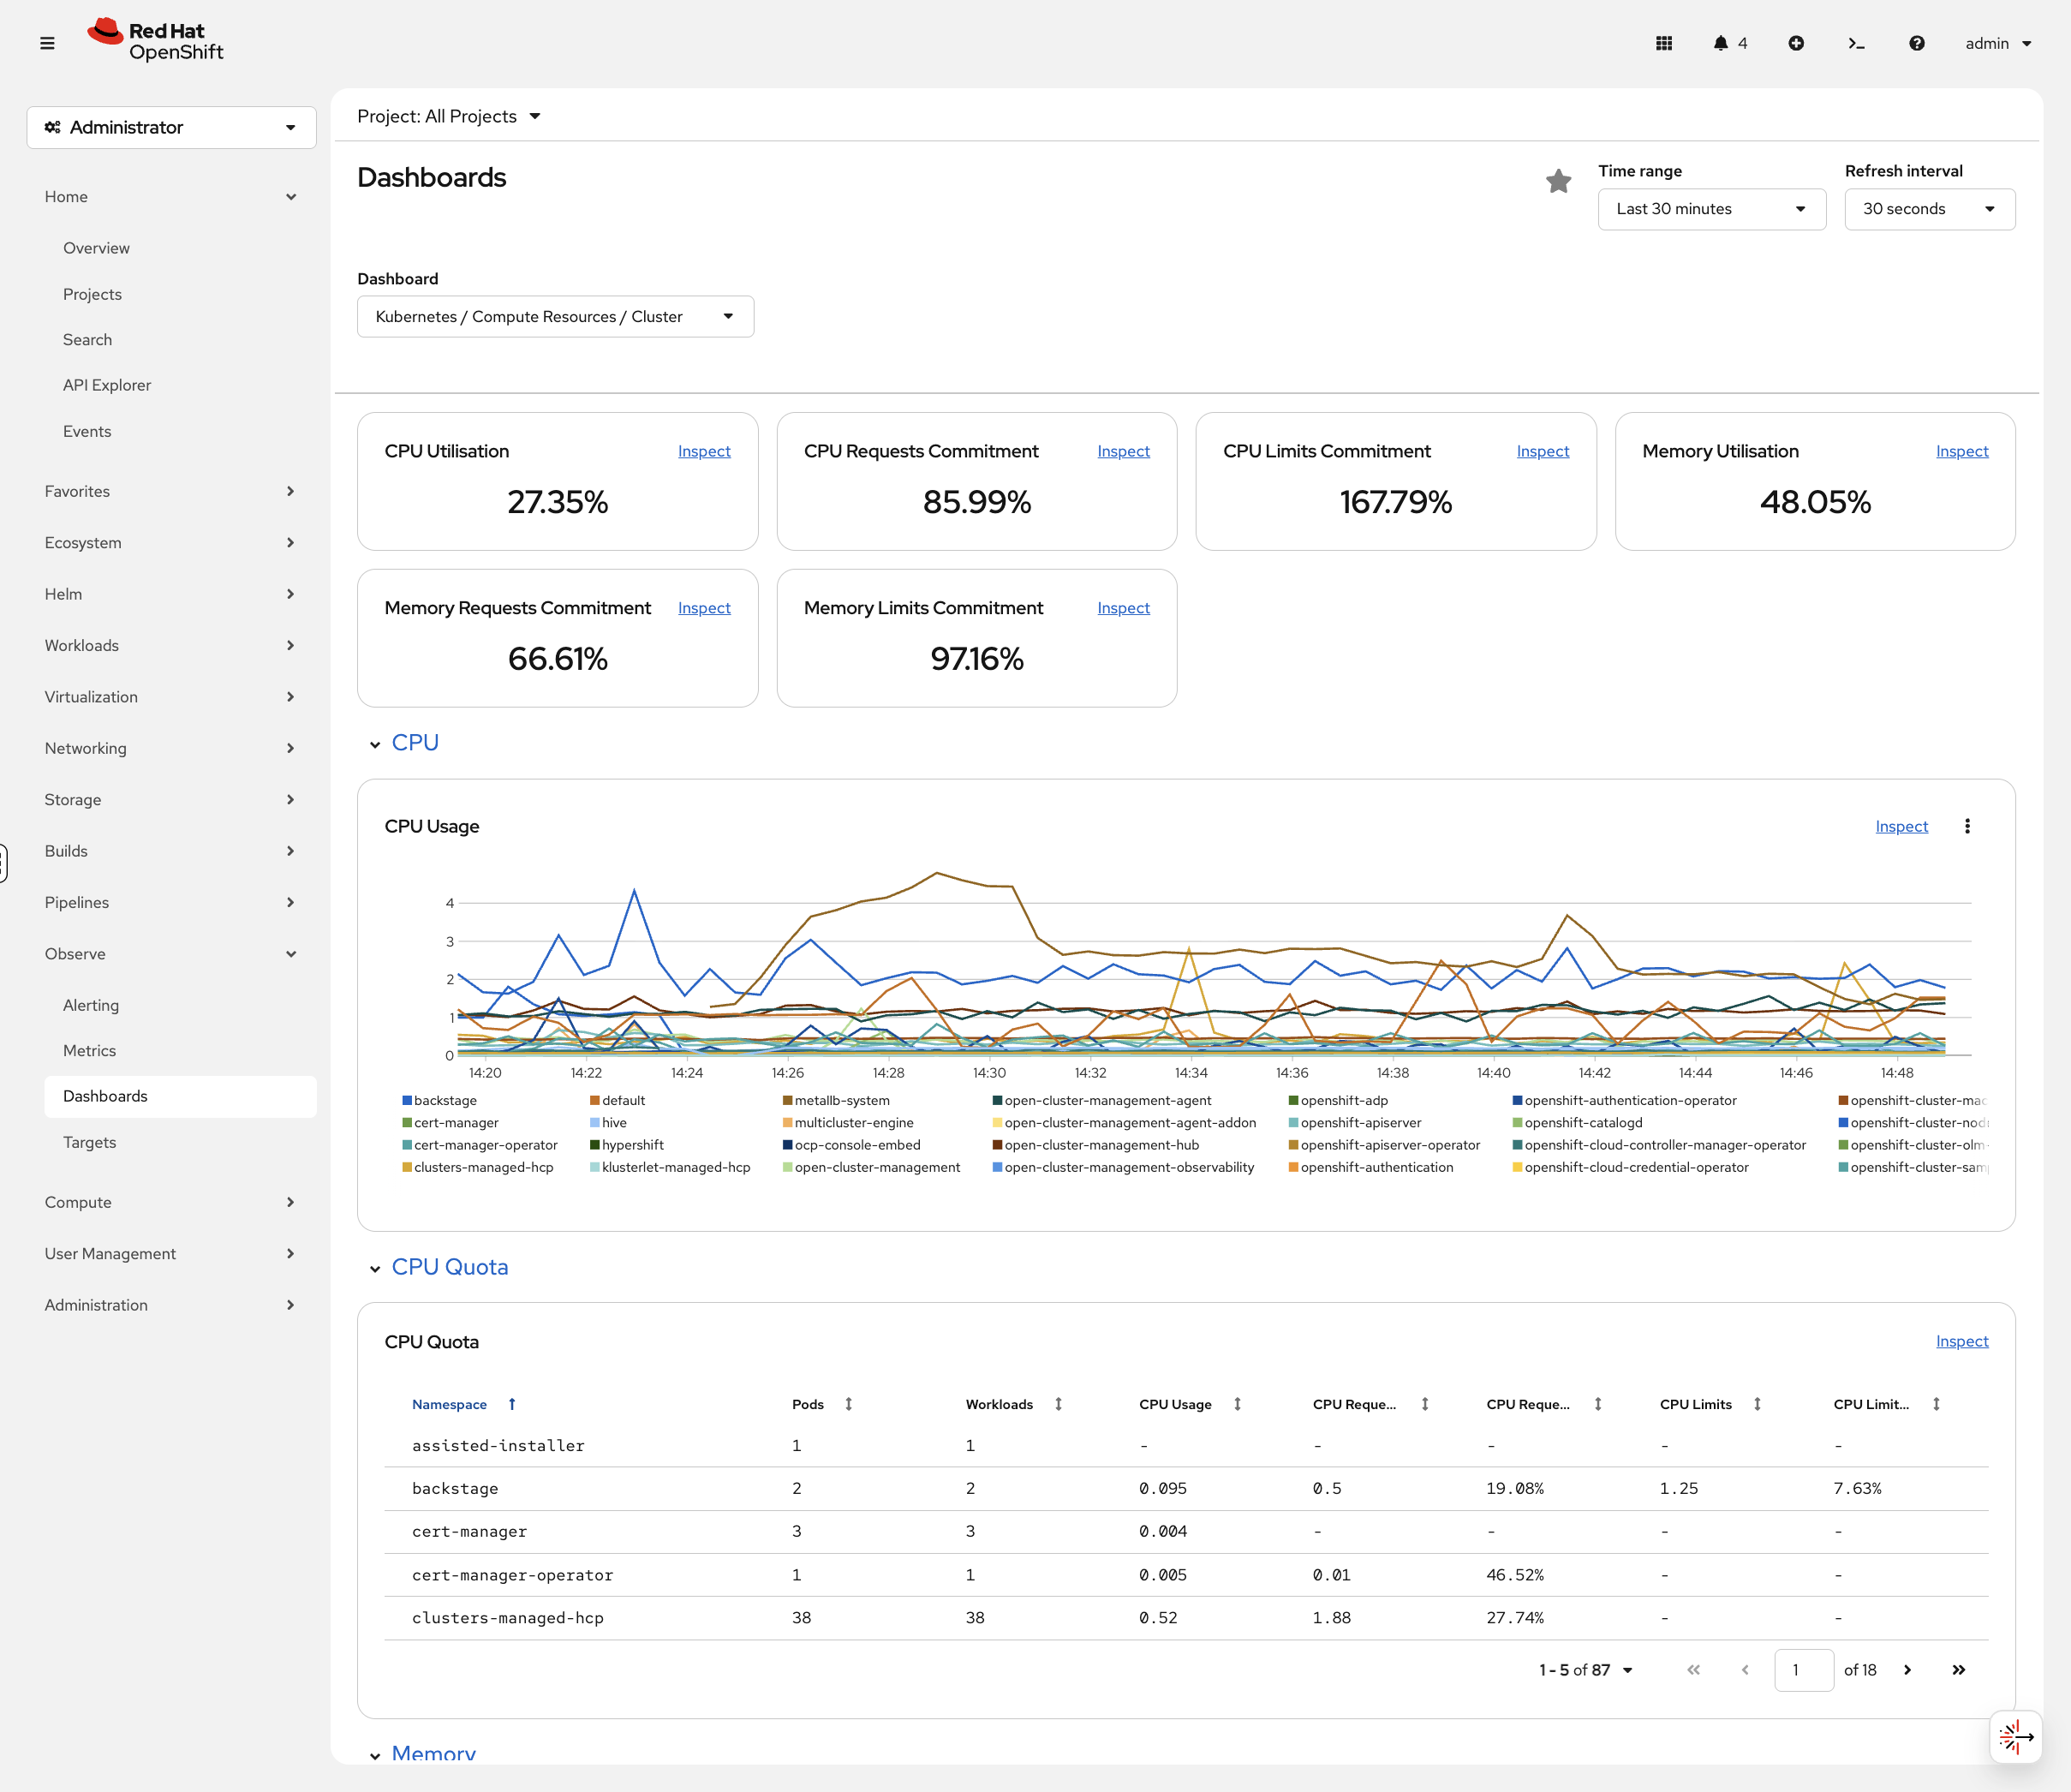
No configuration required. This is built-in.
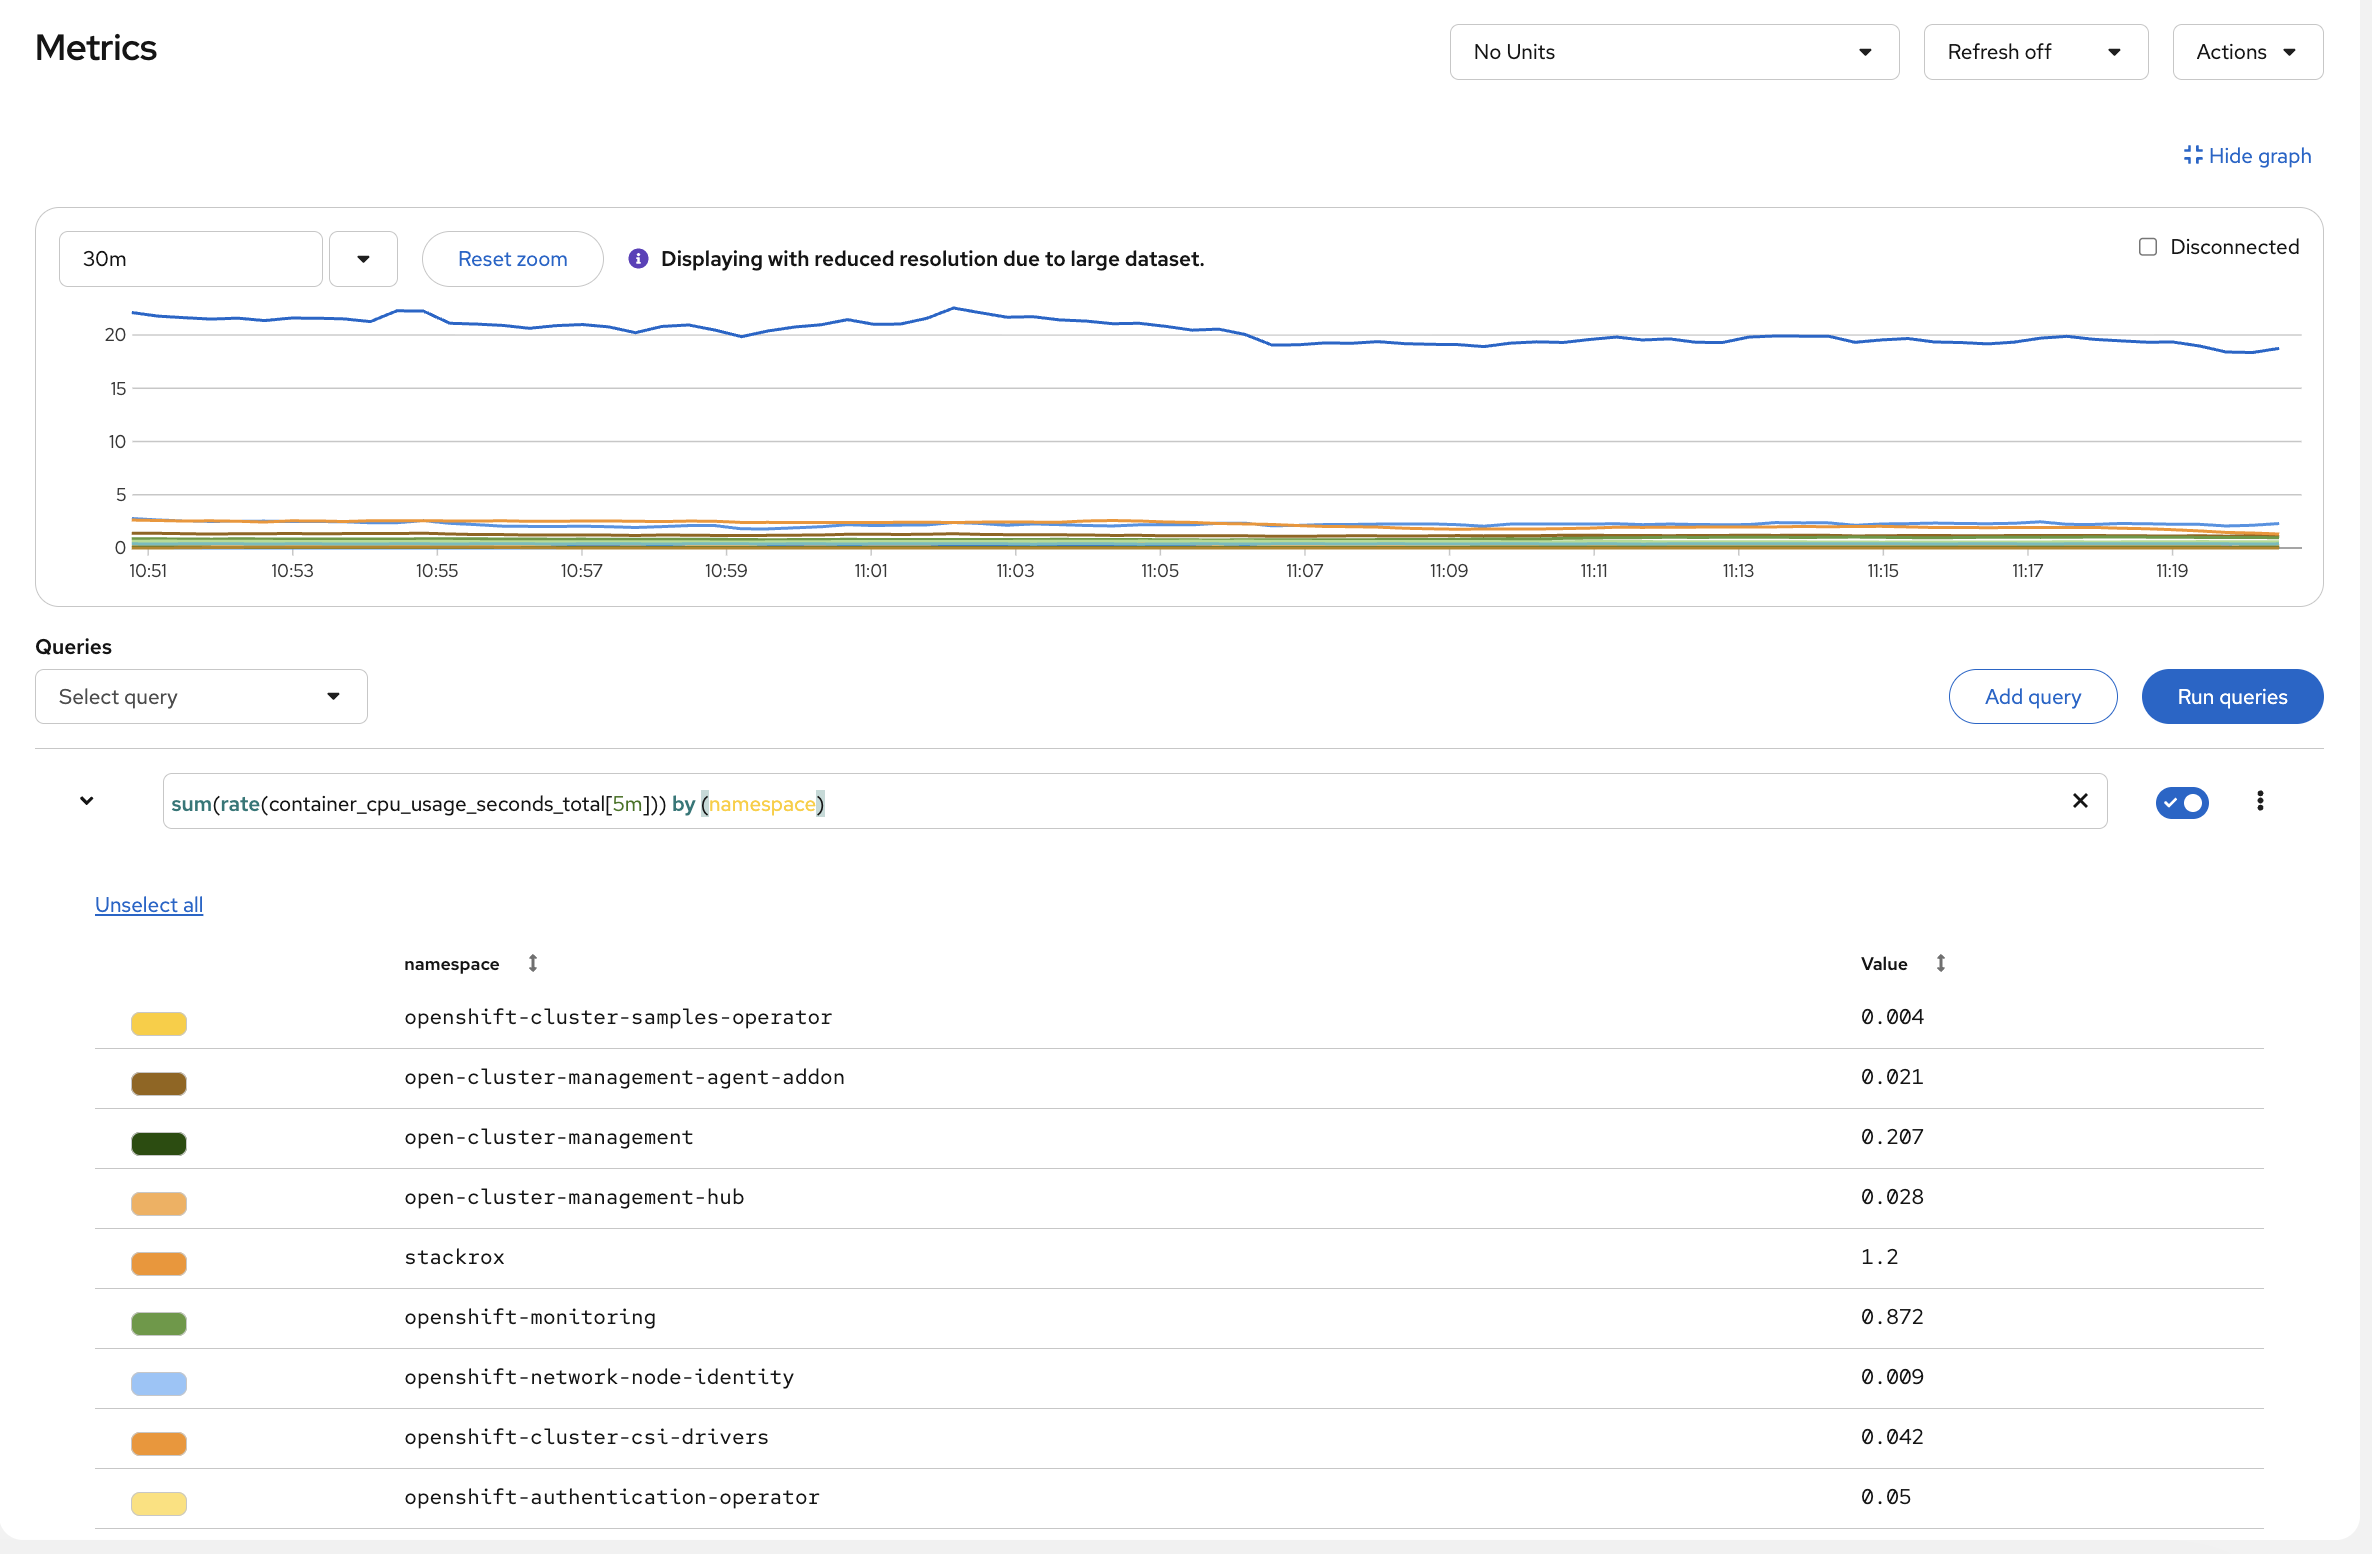
Query Prometheus (Advanced)
-
Navigate to Observe → Metrics
-
Try this PromQL query:
sum(rate(container_cpu_usage_seconds_total[5m])) by (namespace)-
Click Run Queries
You’ll see CPU usage broken down by namespace. Look at which namespaces are consuming the most — openshift-monitoring and openshift-etcd are usually at the top because they run the cluster’s own infrastructure. All of this was available the moment the cluster came up.
Integrated Container Registry
Check if a container registry is running:
oc get pods -n openshift-image-registryOutput (truncated):
NAME                                               READY   STATUS    RESTARTS      AGE
cluster-image-registry-operator-86c45576b9-v8j48   1/1     Running   1 (73m ago)   89m
image-registry-5cd768f9b5-nnrx5                    1/1     Running   0             72m
image-registry-5cd768f9b5-pcnqk                    1/1     Running   0             72m
node-ca-2487m                                      1/1     Running   0             72m
node-ca-5lh4f                                      1/1     Running   0             72m
...
OpenShift includes an integrated enterprise container registry — pre-configured with authentication, storage, and ready to use.
View Image Streams
oc get imagestreams -n openshiftYou’ll see pre-loaded builder images (output truncated):
NAME                   IMAGE REPOSITORY                                                     TAGS
cli                    image-registry.openshift-image-registry.svc:5000/openshift/cli      latest
dotnet                 image-registry.openshift-image-registry.svc:5000/openshift/dotnet   6.0,8.0,9.0,6.0-ubi8,8.0-ubi8,9.0-ubi8...
nodejs                 image-registry.openshift-image-registry.svc:5000/openshift/nodejs   20-minimal-ubi8,20-minimal-ubi9,20-ubi8...
python                 image-registry.openshift-image-registry.svc:5000/openshift/python   3.11-ubi8,3.11-ubi9,3.12-minimal-ubi10...
These are ready to use - no Docker Hub rate limits, no external dependencies.
Enterprise Routing
Check the ingress configuration:
oc get routes -A | head -10You’ll see Routes (OpenShift’s ingress abstraction - output truncated):
NAMESPACE                  NAME                  HOST/PORT
open-cluster-management    acm-cli-downloads     acm-cli-downloads.apps.cluster...
openshift-authentication   oauth-openshift       oauth-openshift.apps.cluster...
openshift-console          console               console-openshift-console.apps.cluster...
openshift-console          downloads             downloads-openshift-console.apps.cluster...
OpenShift Routes provide built-in HAProxy-based ingress routing with automatic TLS certificate management and support for path-based and hostname-based routing. OpenShift also supports standard Kubernetes Ingress resources.
Try It: Deploy and Expose in 30 Seconds
Deploy a web server and make it externally accessible — all in three commands:
oc new-project quick-demo
oc new-app --name=hello --image=registry.access.redhat.com/ubi9/httpd-24
oc create route edge hello --service=hello
Get the URL and test it:
curl -sk https://$(oc get route hello -n quick-demo -o jsonpath='{.spec.host}') | head -3You should see the httpd test page HTML. That’s a deployed app, with a service, a TLS-terminated route, and automatic DNS — in three commands.
Clean up (runs in the background so we can move on):
oc delete project quick-demo &>/dev/null &Unified Node Management
View your cluster nodes:
oc get nodesYour environment uses a compact cluster — 3 nodes that serve as both control plane and worker:
NAME                            STATUS   ROLES                         AGE   VERSION
control-plane-cluster-xxxxx-1   Ready    control-plane,master,worker   20h   v1.33.6
control-plane-cluster-xxxxx-2   Ready    control-plane,master,worker   20h   v1.33.6
control-plane-cluster-xxxxx-3   Ready    control-plane,master,worker   20h   v1.33.6
| Node names and count vary by deployment. Production clusters typically have separate control plane and worker nodes. This workshop uses a compact topology where all nodes serve both roles. |
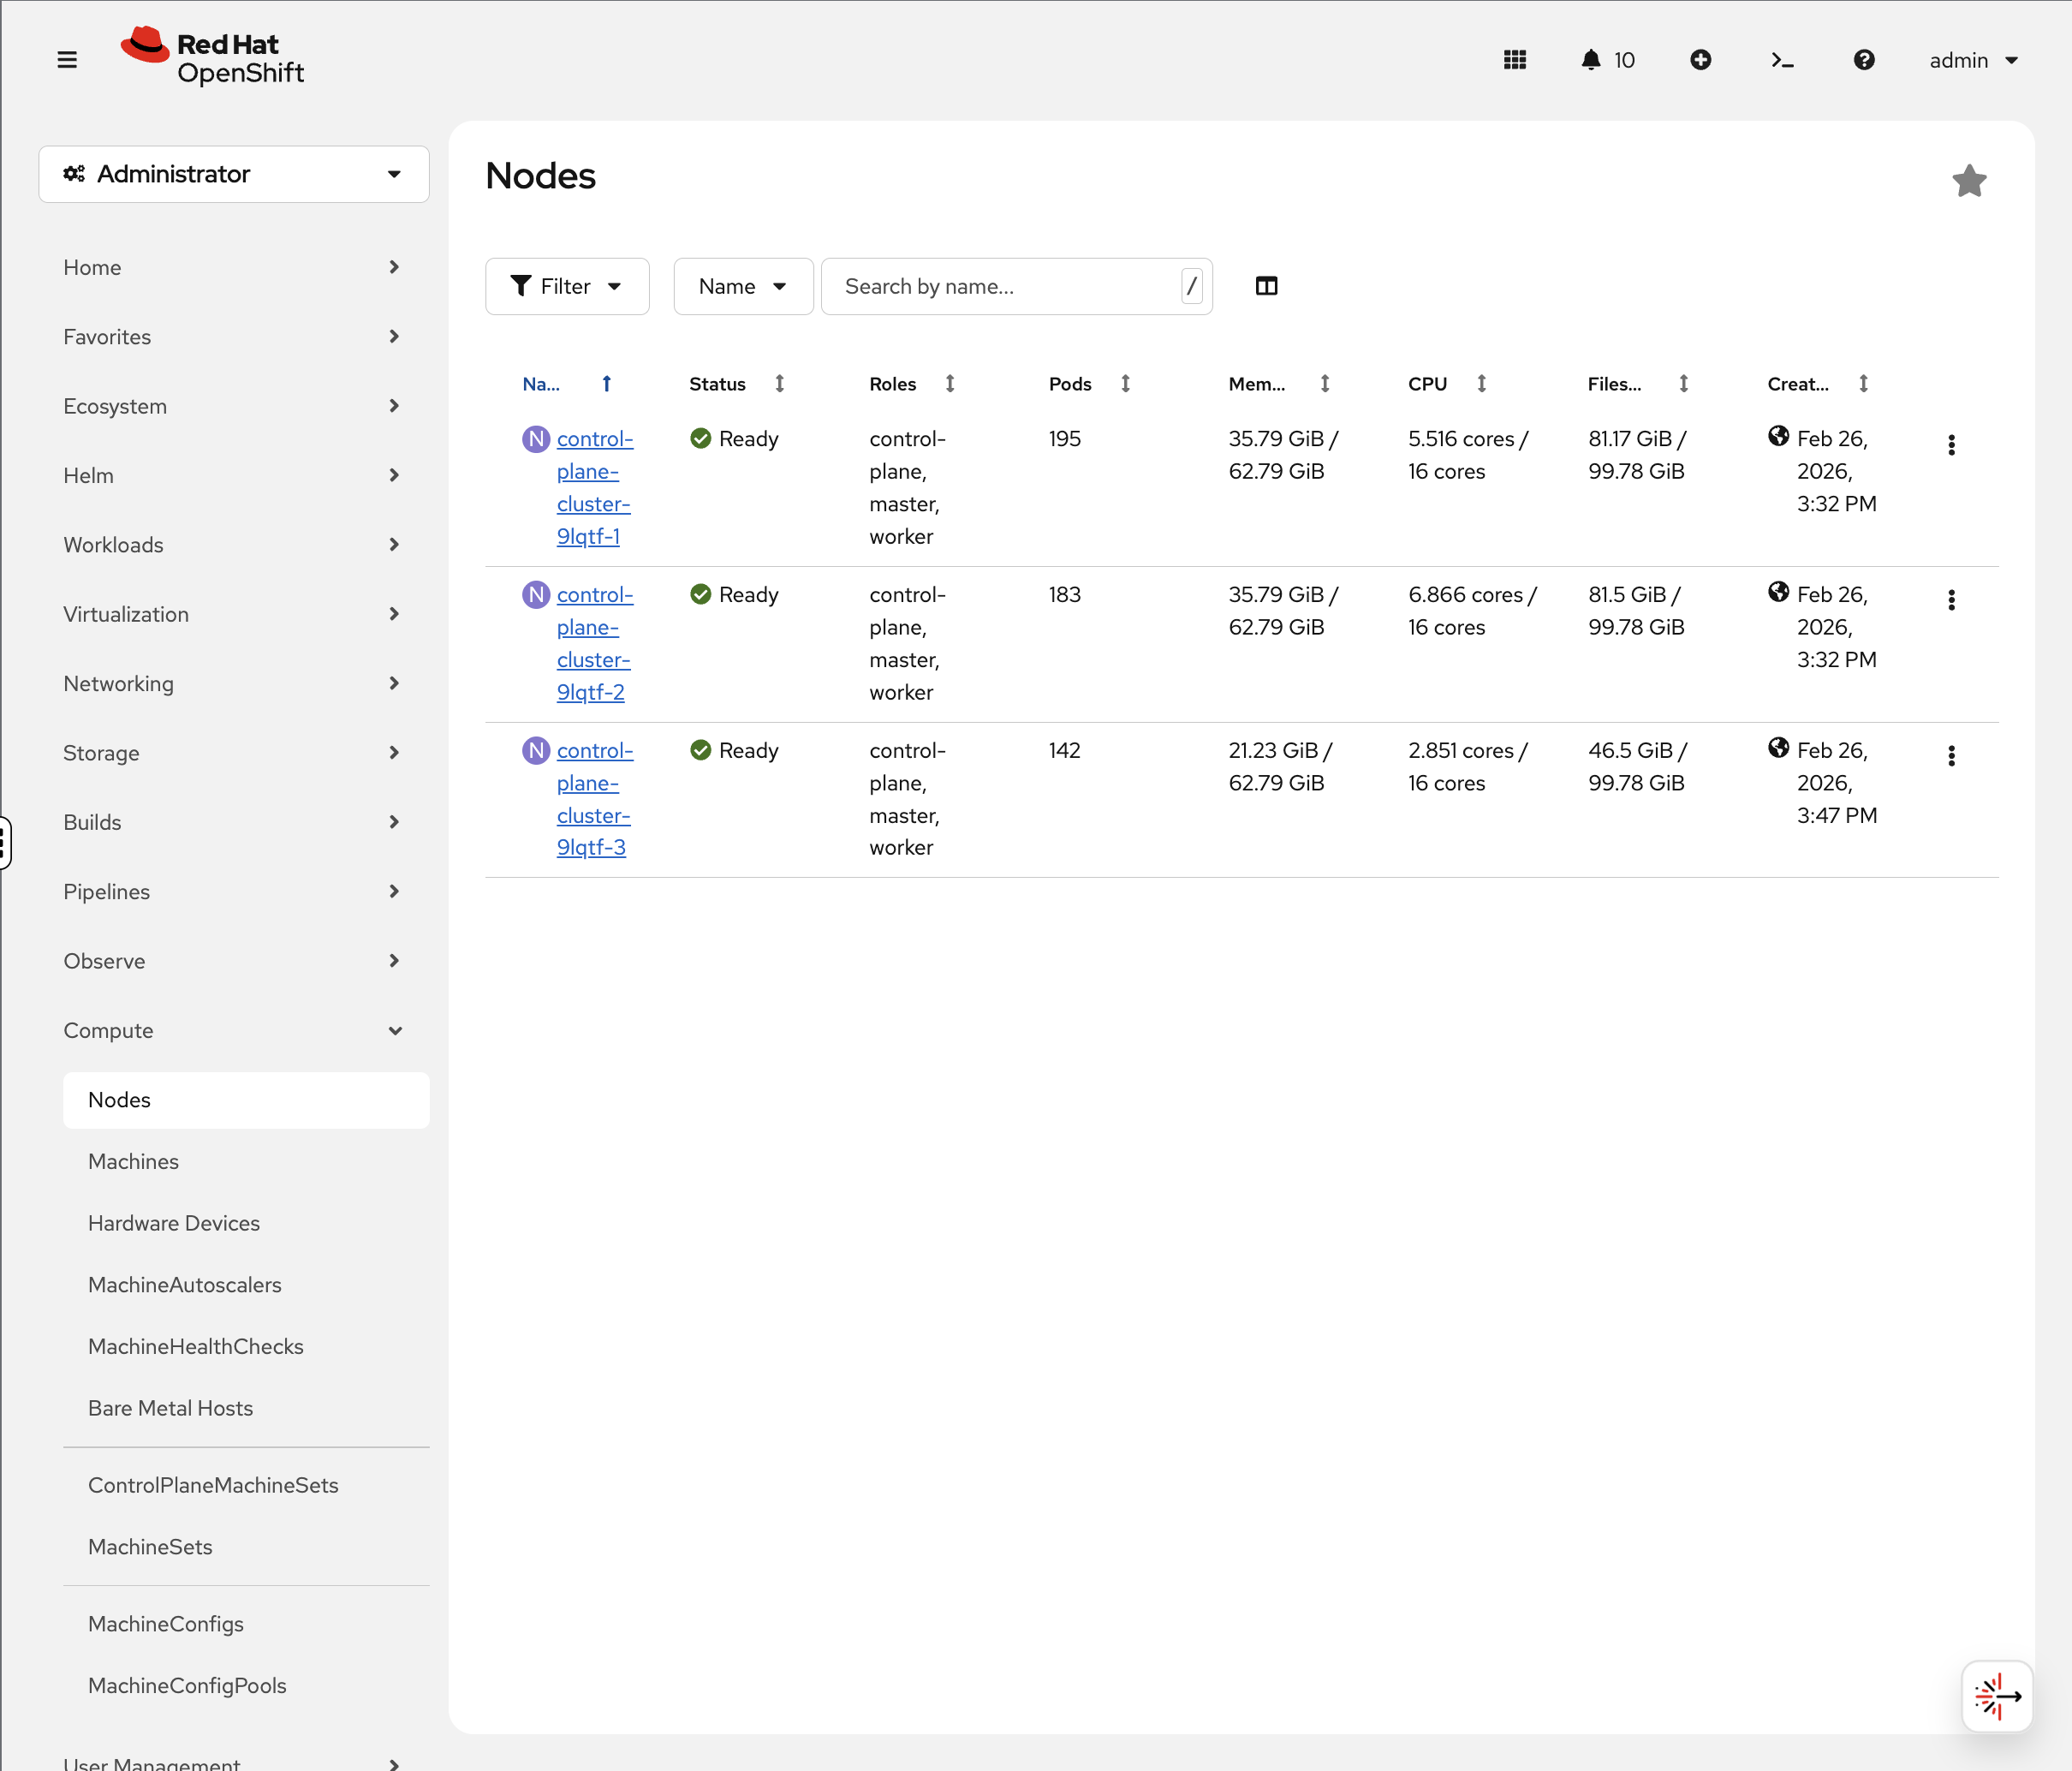
Check Node Details (Console)
-
Navigate to Compute → Nodes
-
Click on any node
-
The Overview tab immediately shows you:
-
Active alerts — you’ll likely see alerts like
KubeCPUOvercommitorKubeMemoryOvercommitat the top. These fire when the total CPU/memory limits of all pods on the node exceed the node’s capacity. This means if every pod tried to burst to its maximum simultaneously, the node couldn’t handle it and would throttle pods.However, look at the Utilization graphs below — actual CPU and memory usage is well within capacity. The difference is important: requests (what’s guaranteed) fit on the node, limits (what pods are allowed to burst to) don’t. In practice, all pods bursting at once rarely happens, especially in a workshop environment. In production, you’d either right-size your limits, add nodes, or accept the overcommit if your workloads don’t burst together.
-
Utilization graphs — CPU, Memory, Filesystem, and Network over time. Compare "available" to actual usage — that tells you the real capacity story, not the theoretical limits.
-
Pod count — how many pods are running on this node.
-
-
Click the Pods tab to see every pod on that node with its CPU and memory usage.
Active alerts, utilization graphs, and per-pod resource usage are all in one console view — no SSH to nodes required.
Infrastructure Management
MachineSets - Automated Infrastructure Scaling
OpenShift uses MachineSets to automate infrastructure scaling. On cloud platforms (AWS, Azure, GCP), MachineSets manage worker nodes across availability zones — you can scale up by changing a replica count rather than manually provisioning machines.
When ACM is installed, machinesets exists in two API groups (Cluster API and OpenShift Machine API). We use the full resource name machinesets.machine.openshift.io to target OpenShift’s Machine API.
|
oc get machinesets.machine.openshift.io -n openshift-machine-apiYour compact cluster has a single MachineSet scaled to 0 — all 3 nodes serve as both control plane and worker, so no separate worker machines are needed:
NAME                           DESIRED   CURRENT   READY   AVAILABLE   AGE
cluster-xxxxx-worker-0         0         0                             20h
In a production cloud deployment, you’d see multiple MachineSets (one per availability zone) with active worker replicas that can be scaled up or down.
You can see this in the console at Compute → MachineSets:
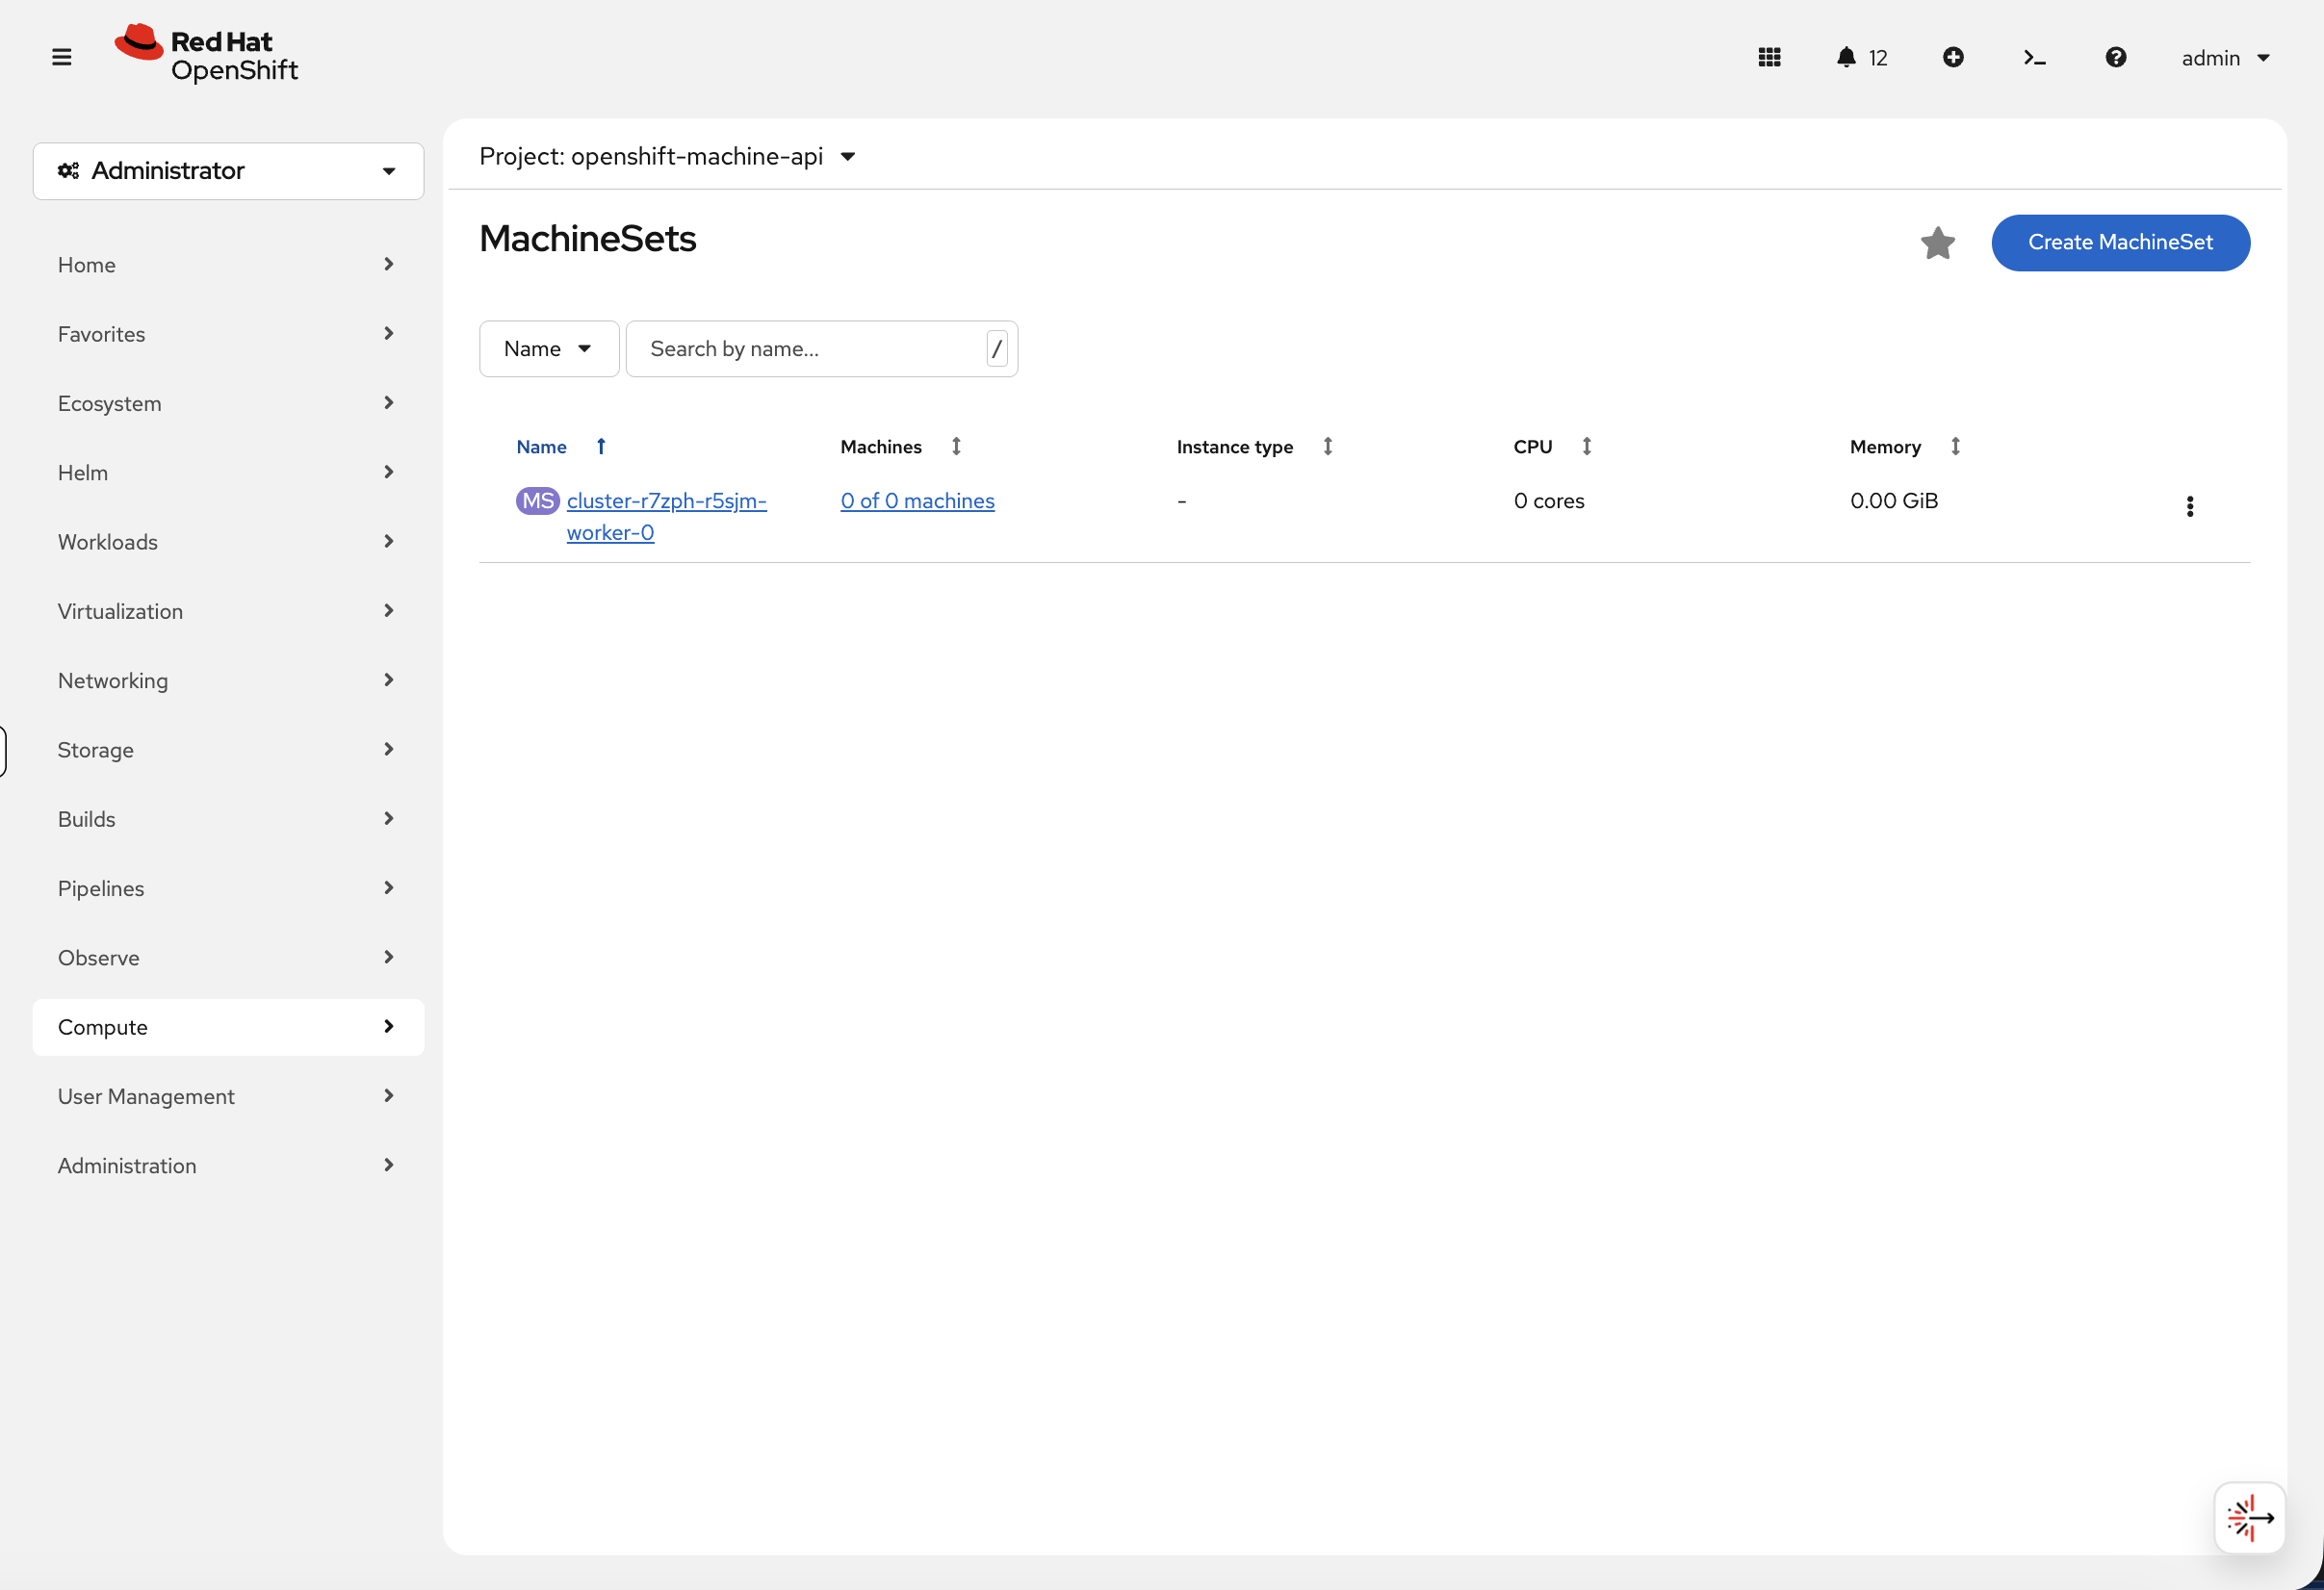
In a production cluster, this view shows the machine count, instance type, CPU, and memory for each MachineSet — and you can scale directly from the console by editing the desired count.
You can also view the machine resources:
oc get machines.machine.openshift.io -n openshift-machine-apiThis shows the underlying compute instances that OpenShift is managing.
Scaling Workers
To add another worker node, simply scale the MachineSet:
# Example - scales a zone from 0 to 1 worker
oc scale machineset.machine.openshift.io <machineset-name> --replicas=1 -n openshift-machine-api
OpenShift automatically provisions a compute instance, configures it, and joins it to the cluster — one command to scale your infrastructure.
| This workshop environment runs on bare metal without spare hosts available, so scaling is shown as an example rather than a live exercise. On cloud platforms (AWS, Azure, GCP), the Machine API provisions new instances automatically. |
Over-the-Air Upgrades
Check the cluster version:
oc get clusterversionOutput:
NAME      VERSION   AVAILABLE   PROGRESSING   SINCE   STATUS
version   4.x       True        False         32m     Cluster version is 4.x
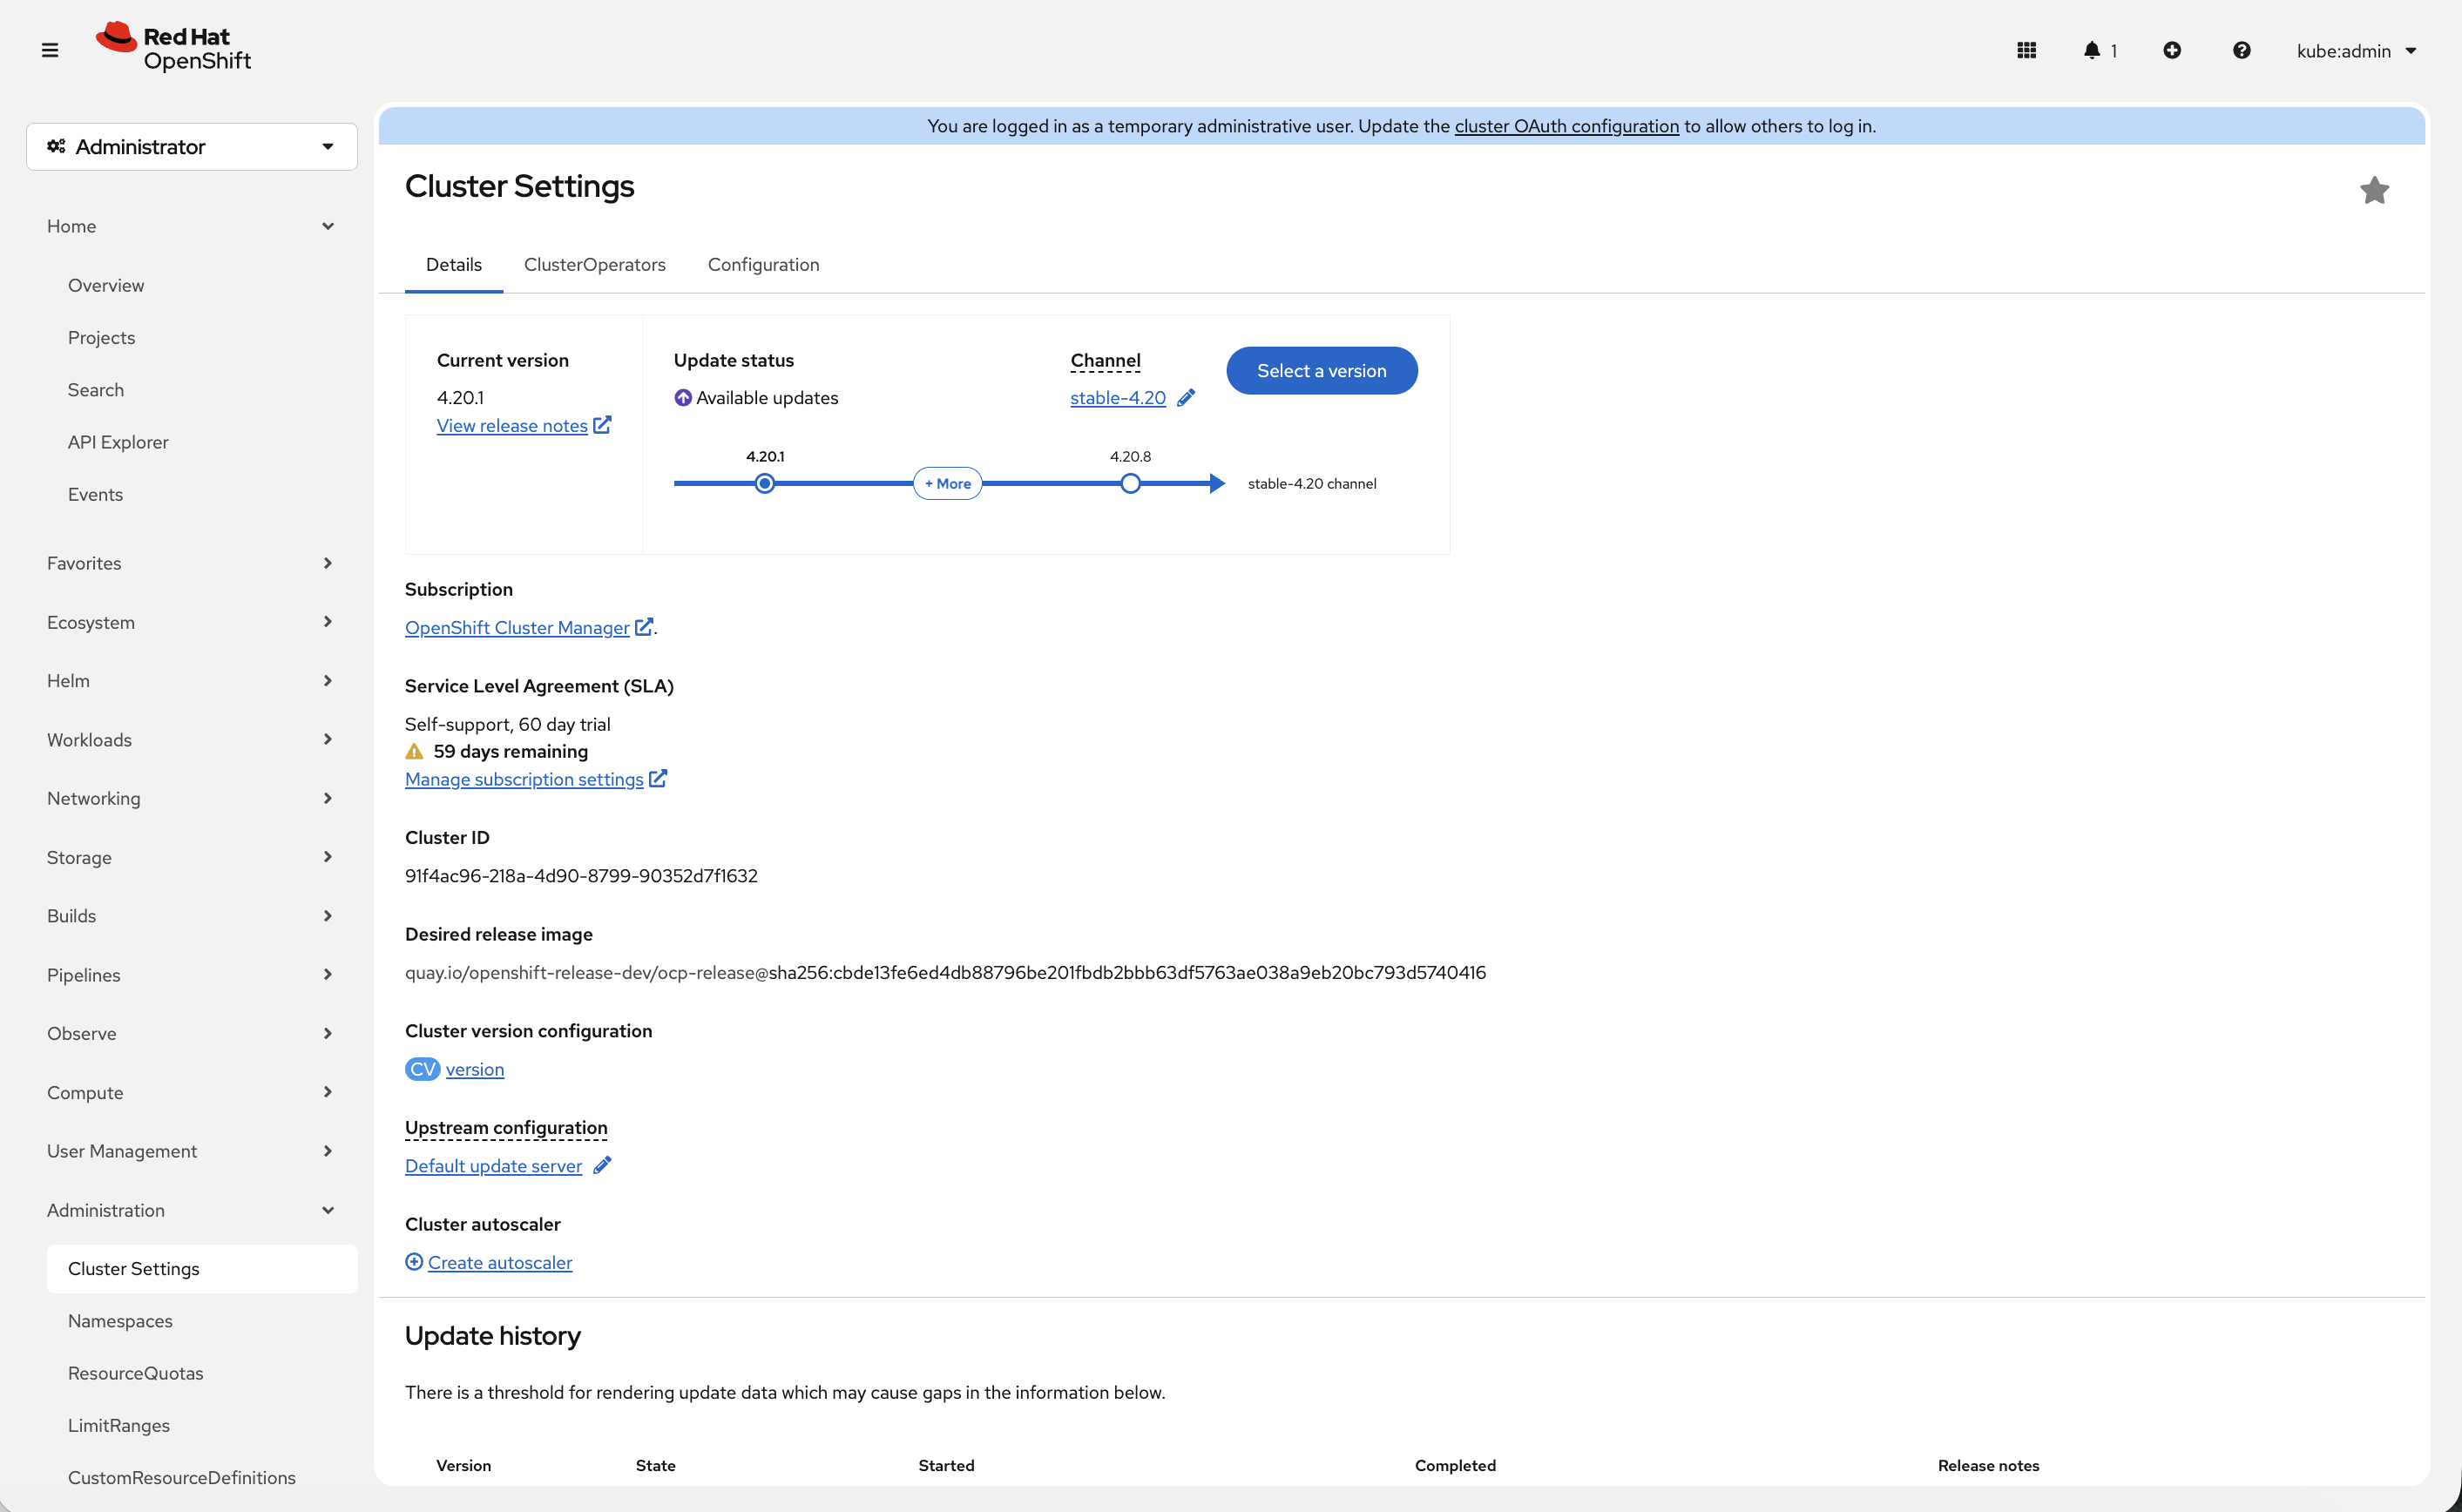
View Available Upgrades (Console)
-
Navigate to Administration → Cluster Settings
-
Click Select a version button (if available)
-
See available upgrade paths
| If your cluster shows Update status: Up to date, the Select a version button will not appear. This means your cluster is already running the latest available version in its update channel. |
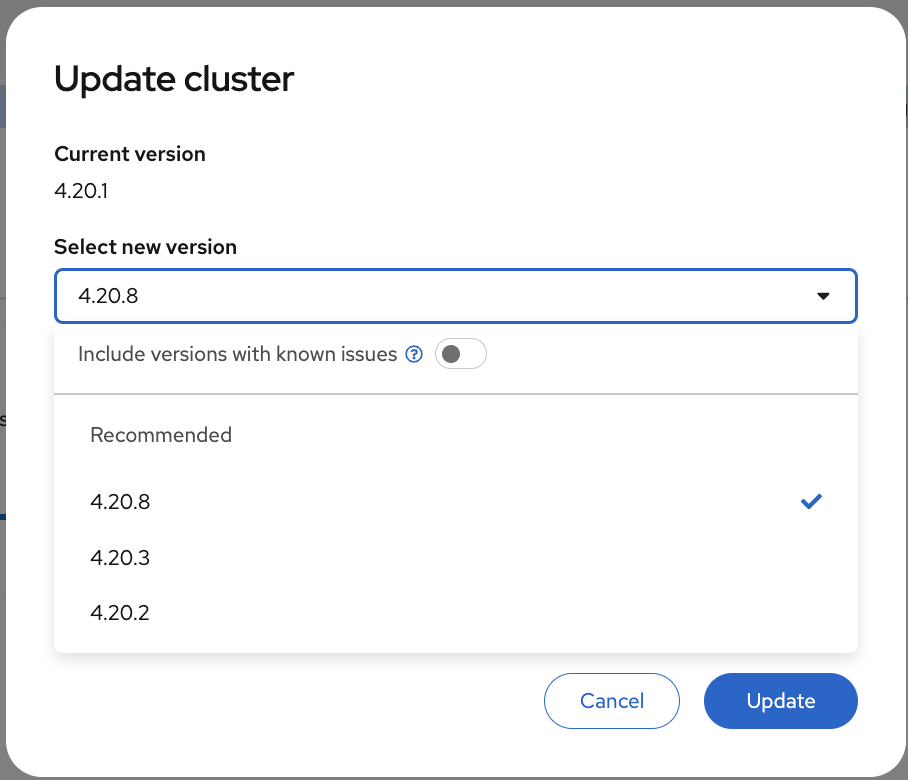
OpenShift handles upgrades automatically:
-
Rolling upgrades of control plane
-
Automated worker node updates
-
Rollback capability
-
Zero-downtime upgrades
Operator Ecosystem
OpenShift includes a Software Catalog - a marketplace of pre-certified operators.
oc get packagemanifests -n openshift-marketplace | wc -lYou’ll see hundreds of operators available out of the box.
Explore Software Catalog (Console)
-
Navigate to Ecosystem → Software Catalog
-
You may need to select a project from the dropdown — if one is not already selected, choose default
-
You’ll see the unified software catalog with categories on the left:
-
AI/Machine Learning - Red Hat OpenShift AI, Open Data Hub
-
CI/CD - Red Hat OpenShift GitOps, Red Hat OpenShift Pipelines
-
Database - Red Hat AMQ Streams (Kafka)
-
Security - Red Hat Advanced Cluster Security
-
Storage - Red Hat OpenShift Data Foundation
-
Integration & Delivery - Red Hat Integration, Red Hat Service Mesh, Red Hat Serverless
-
And many more…
-
-
Filter by Type and select Operators to see the full list of available operators
-
Feel free to click any operator tile to browse its details — this is just for exploration, no need to install anything
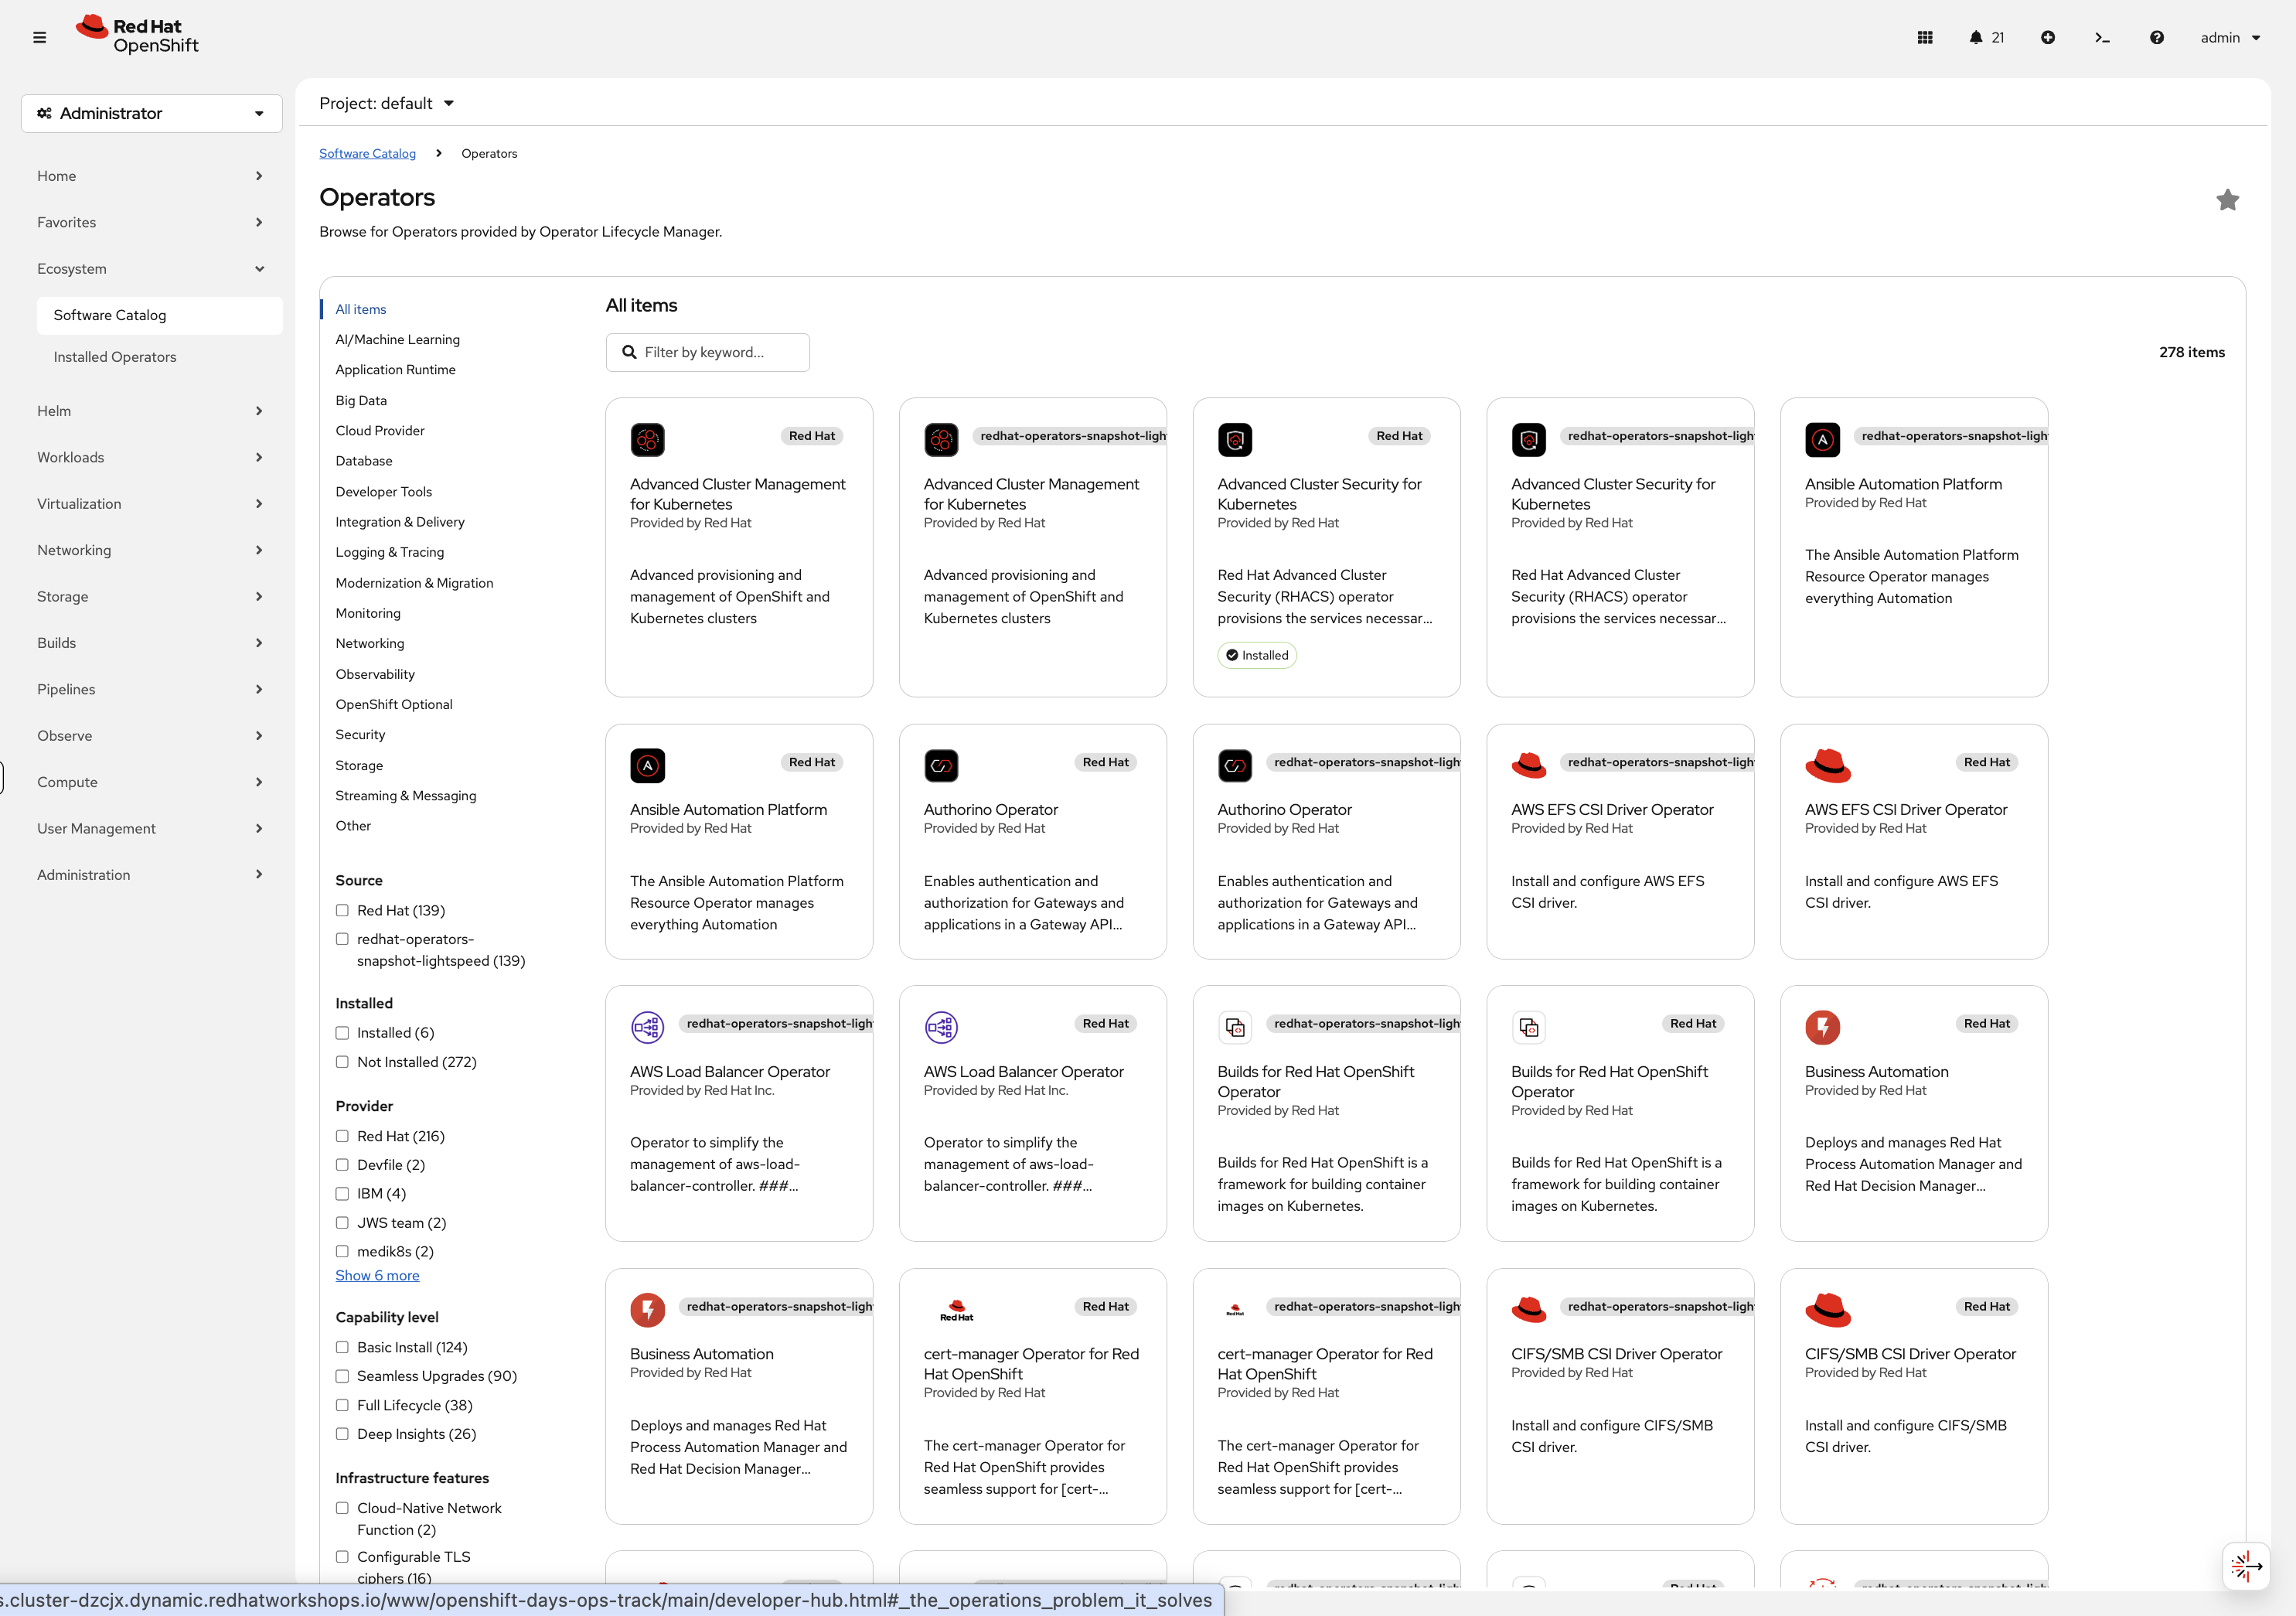
Install enterprise-grade, Red Hat certified software with one click.
Summary: Why OpenShift for Operations
| Challenge | OpenShift Solution |
|---|---|
"How do I monitor the cluster?" |
Built-in Prometheus & dashboards |
"How do I store container images?" |
Integrated registry |
"How do I route traffic to apps?" |
Built-in Routes with HAProxy |
"How do I upgrade Kubernetes?" |
Over-the-air upgrades, zero-downtime |
"How do I scale infrastructure?" |
MachineSets API |
"How do I add capabilities?" |
Software Catalog with hundreds of operators |
"Who supports this stack?" |
Single Red Hat support contract |
Key Takeaways
✅ Integrated Platform - No need to install/configure 10+ separate tools
✅ Web Console + CLI - Choose your workflow, same capabilities
✅ Built-in Operations - Monitoring, logging, registry, upgrades included
✅ Automated Infrastructure - MachineSets handle scaling, MachineConfigs handle OS
✅ Single Support Contract - One vendor for the entire stack