Observability & Logging
Module Overview
Duration: 50 minutes
Format: Hands-on observability configuration
Audience: Platform Engineers, Operations Teams
Your cluster is running workloads and you need visibility into what’s happening. OpenShift provides metrics and alerting out of the box via Prometheus and Alertmanager. In this module, you’ll explore those built-in capabilities, set up the logging pipeline with Loki and Vector, and deploy OpenTelemetry for distributed tracing.
Learning Objectives
By the end of this module, you will be able to:
-
Explore the built-in Prometheus metrics and dashboards
-
Configure alerting rules and understand Alertmanager
-
Install and configure the OpenShift Logging stack
-
Query logs using the OpenShift console
-
Deploy OpenTelemetry and Tempo for distributed tracing
-
View traces in the OpenShift console
Built-in Metrics with Prometheus
OpenShift ships with a fully managed Prometheus stack — no installation required. It collects metrics from every component in the cluster.
Explore Cluster Metrics
View the Prometheus pods that are already running:
oc get pods -n openshift-monitoring -l app.kubernetes.io/name=prometheusQuery cluster CPU usage using the console metrics viewer:
-
Switch to the OCP Console tab
-
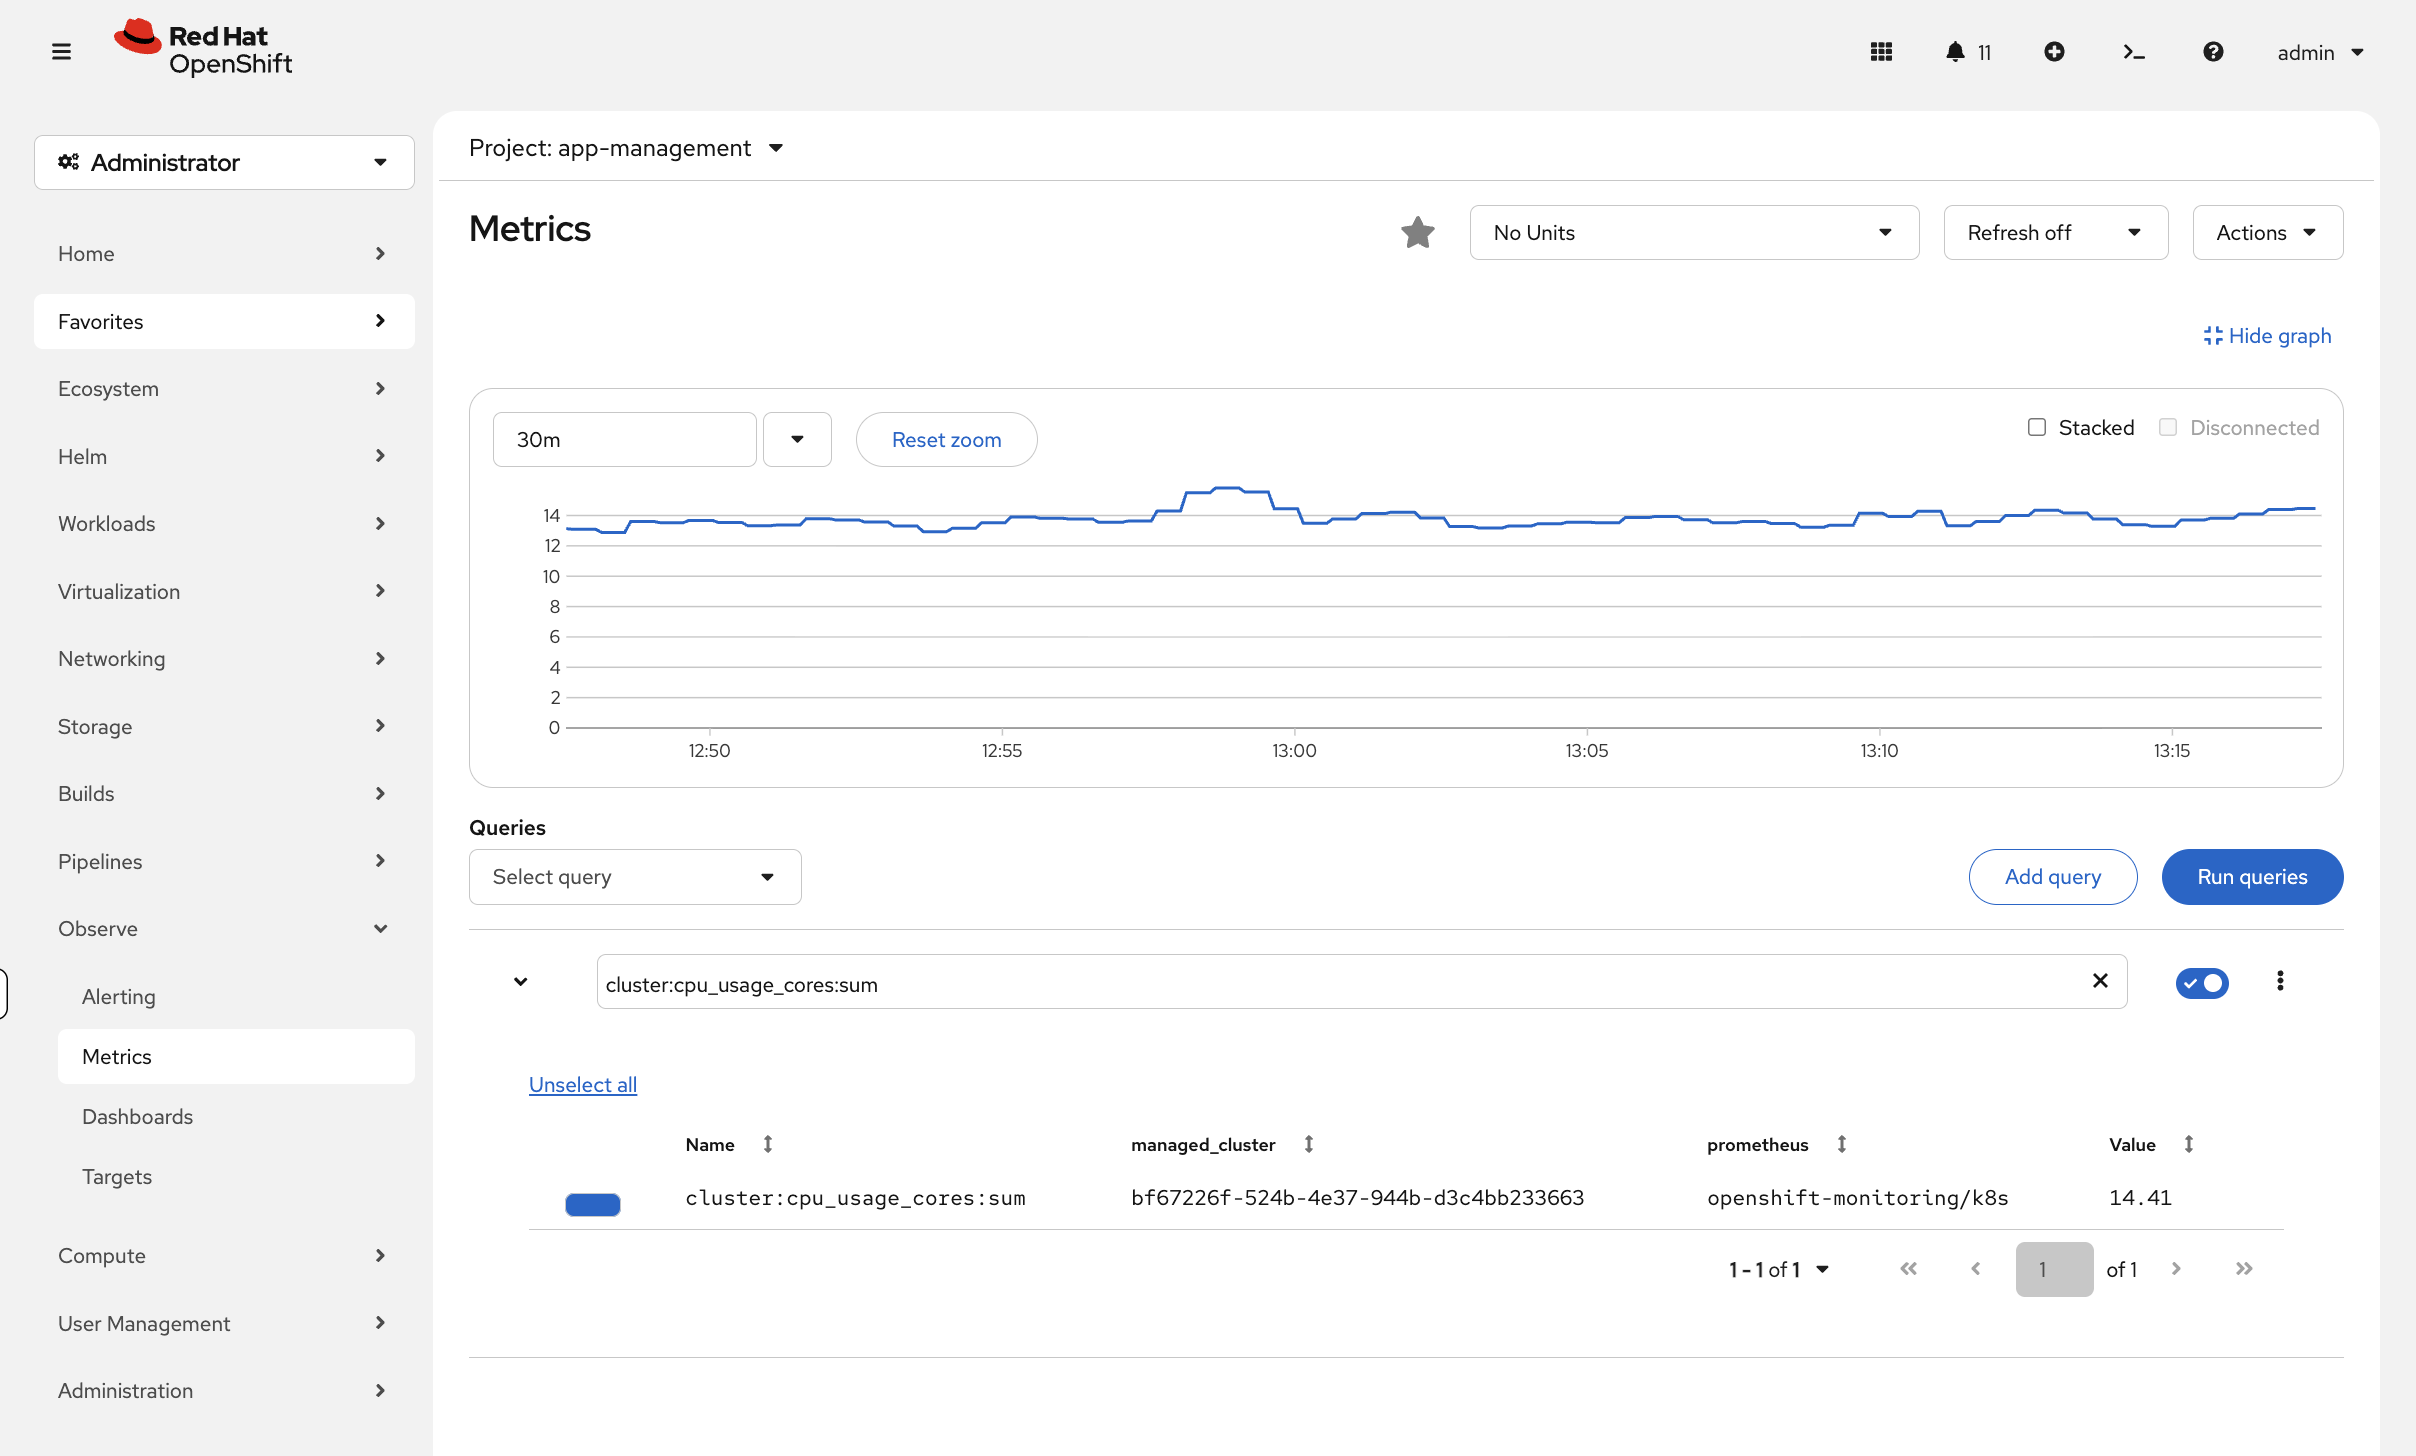
Navigate to Observe → Metrics
-
Enter the query:
cluster:cpu_usage_cores:sum -
Click Run Queries
You’ll see a time-series graph showing cluster CPU usage over time — far more useful than a point-in-time number.
Try other queries like node_memory_MemAvailable_bytes or kubelet_running_pods to explore what metrics are available.
|
For quick CLI snapshots, you can also use:
oc adm top nodesoc adm top pods -A --sort-by=cpu | head -15Dashboards in the Console
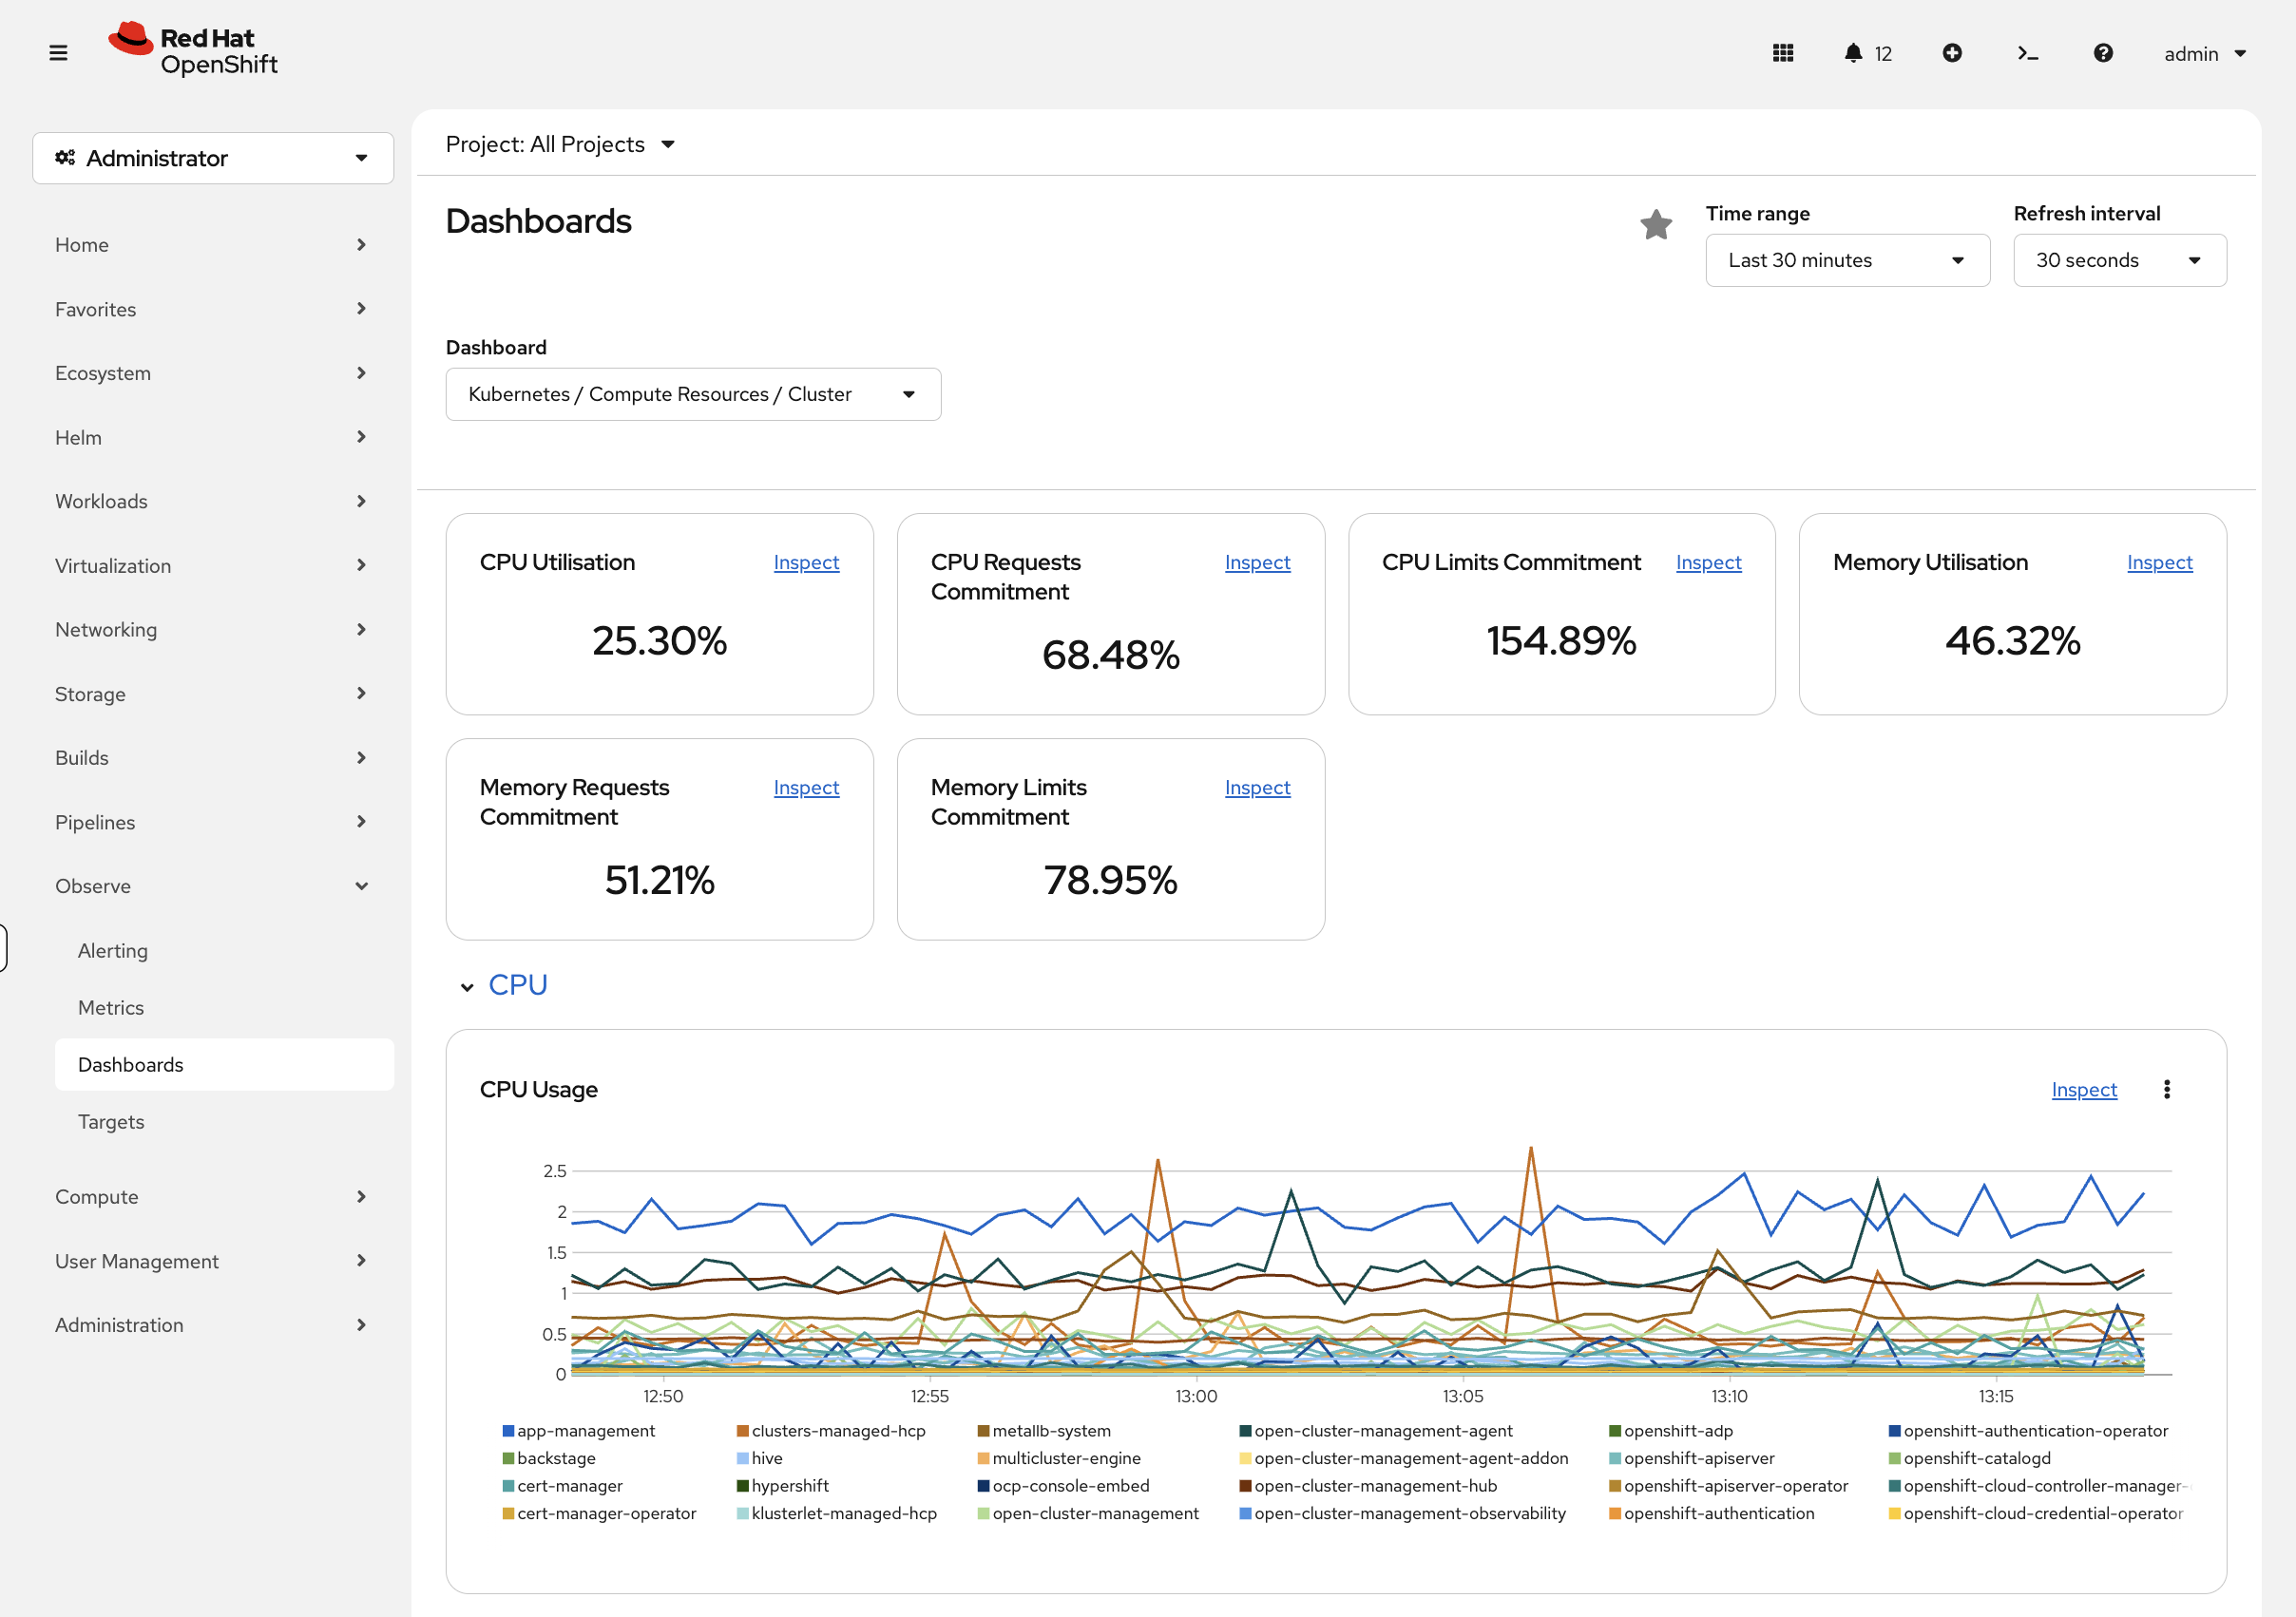
Navigate to Observe → Dashboards in the OpenShift console. Key dashboards include:
-
etcd - Control plane database health
-
Kubernetes / Compute Resources / Cluster - Cluster-wide CPU and memory
-
Kubernetes / Compute Resources / Namespace (Pods) - Per-namespace breakdown
-
Node Exporter / USE Method / Cluster - Utilization, Saturation, Errors
User Workload Monitoring
OpenShift can also scrape metrics from your own applications. User workload monitoring is not enabled by default — it has been pre-enabled on this workshop cluster. Verify it’s running:
oc get pods -n openshift-user-workload-monitoringIf pods are running, any application that exposes a /metrics endpoint can be scraped by creating a ServiceMonitor or PodMonitor resource.
| This is already enabled on your workshop cluster — you don’t need to run this. On your own cluster, you would enable it with: |
oc apply -f - <<EOF
apiVersion: v1
kind: ConfigMap
metadata:
  name: cluster-monitoring-config
  namespace: openshift-monitoring
data:
  config.yaml: |
    enableUserWorkload: true
EOF
You’ll use user workload monitoring in the Performance Tuning module when HPA needs metrics to make scaling decisions. Any application that exposes a Prometheus /metrics endpoint can be scraped — you just create a ServiceMonitor pointing at it.
Alerting with Alertmanager
OpenShift includes Alertmanager for routing alerts to notification channels (email, Slack, PagerDuty, webhooks).
View Current Alerts
Check what alerting rules exist:
oc get prometheusrules -A | head -15You can also view alerts in the console under Observe → Alerting.
Create a Custom Alert
You can define your own alerts for application namespaces. Here’s an example that fires when a pod has been restarting. We’ll create it in the openshift-monitoring namespace where the built-in alerting rules live:
cat <<EOF | oc apply -f -
apiVersion: monitoring.coreos.com/v1
kind: PrometheusRule
metadata:
  name: ops-track-alerts
  namespace: openshift-monitoring
spec:
  groups:
  - name: ops-track
    rules:
    - alert: HighPodRestartRate
      expr: increase(kube_pod_container_status_restarts_total[15m]) > 3
      for: 5m
      labels:
        severity: warning
      annotations:
        summary: "Pod {{ \$labels.pod }} restarting frequently"
        description: "Pod {{ \$labels.pod }} in {{ \$labels.namespace }} has restarted more than 3 times in 15 minutes."
EOF
Verify the rule was created:
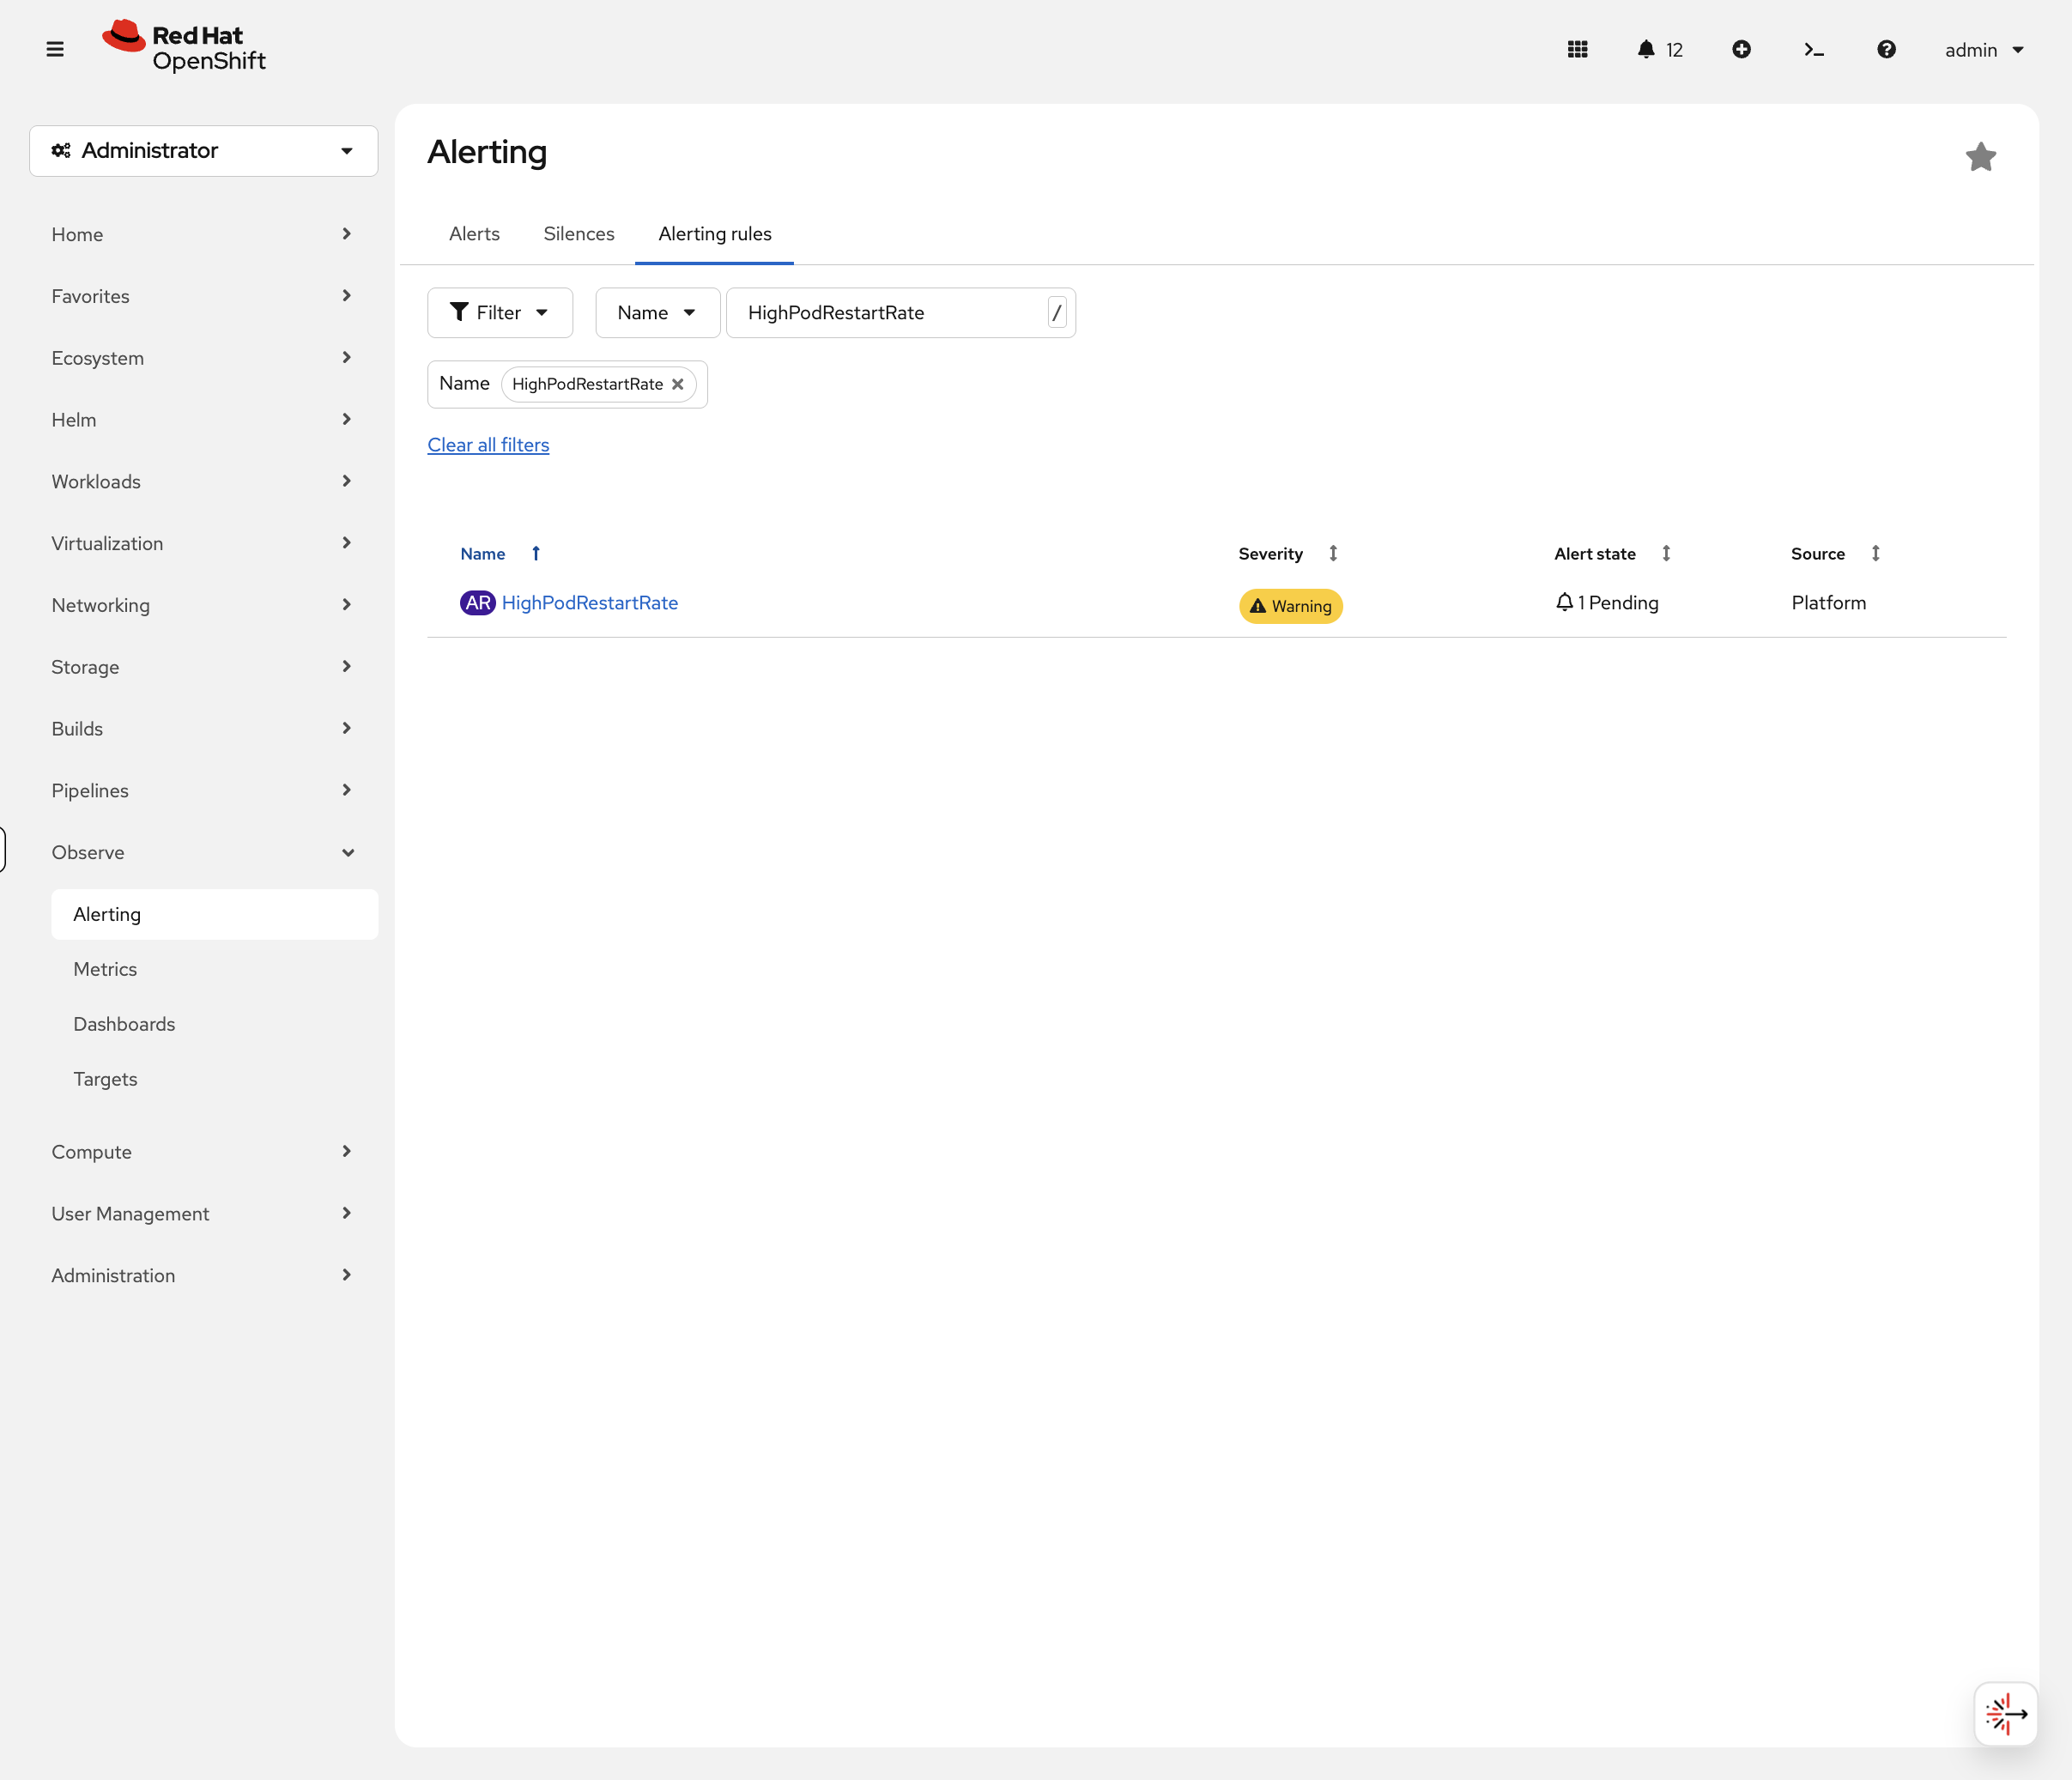
oc get prometheusrule ops-track-alerts -n openshift-monitoringNavigate to Observe → Alerting → Alerting Rules in the console. Search for HighPodRestartRate to find your custom rule:
| You may need to clear the Source filter to see all rules, or just search by name. |
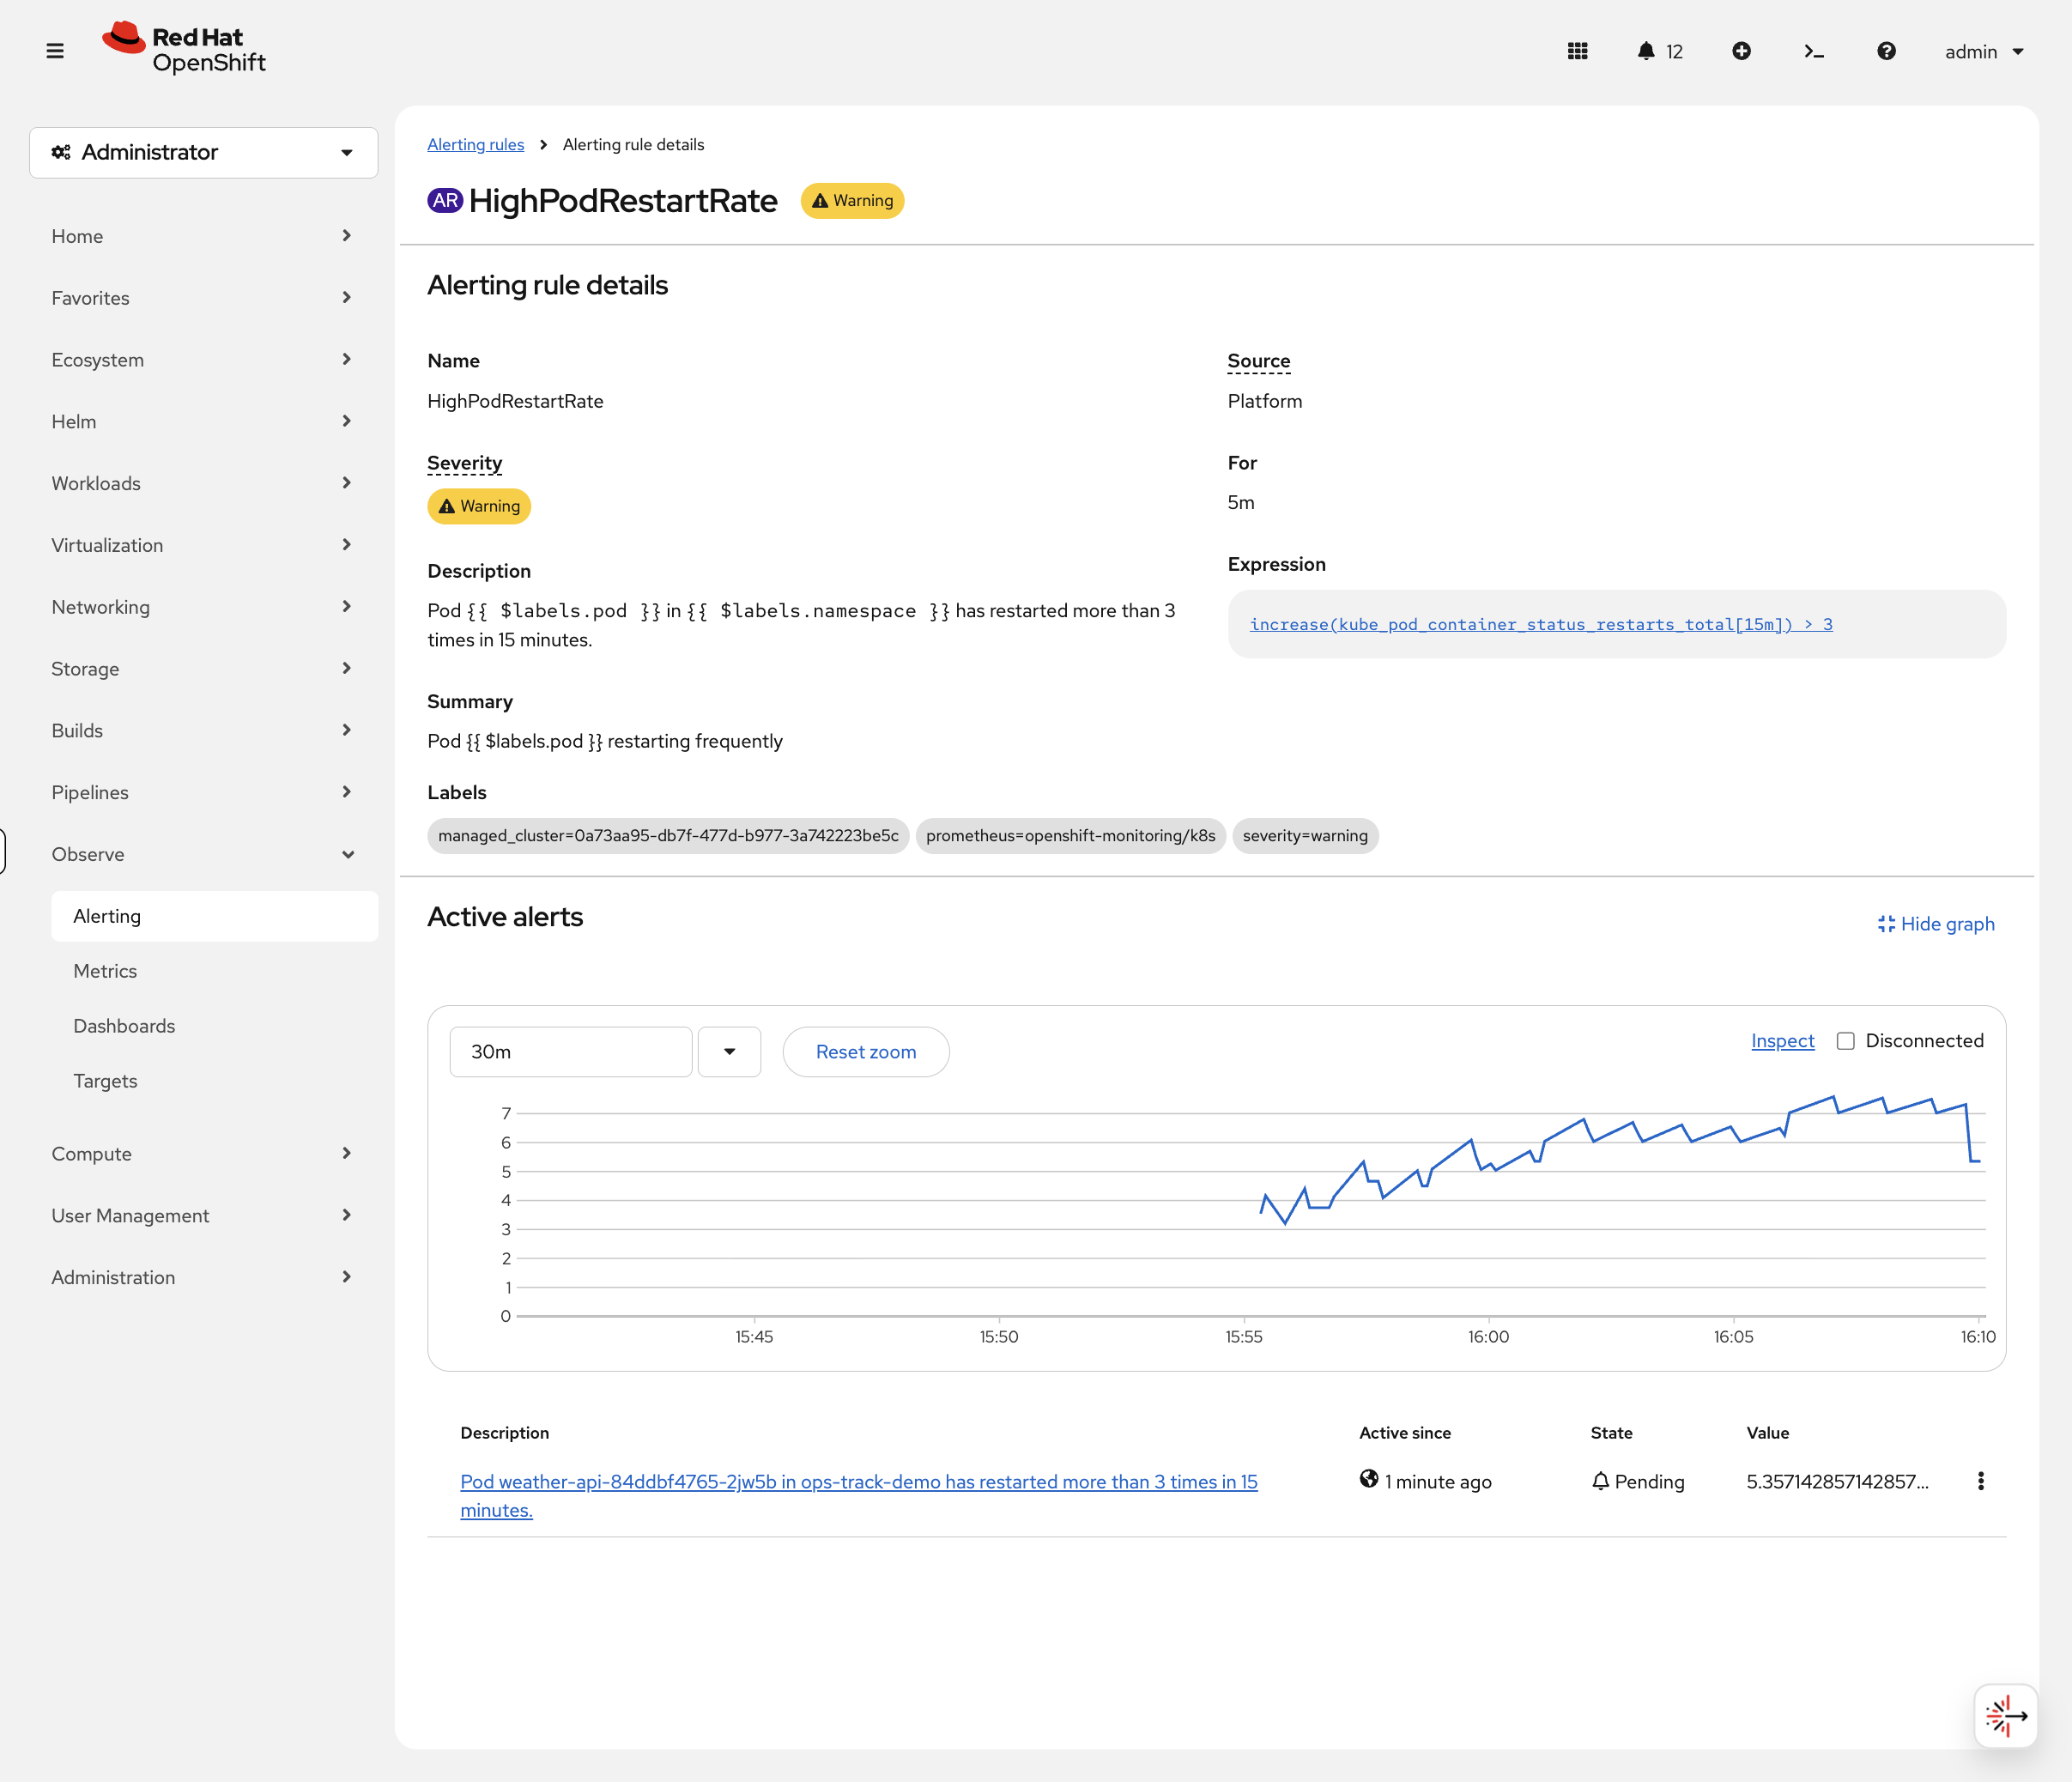
Click on the rule to see its details — the expression, severity, and any active alerts. If pods are restart-looping in the cluster, you’ll see them here with a graph showing the trend:
Now switch to the Alerts tab (not Alerting Rules). Filter by Alert State: Firing to see what’s currently active in the cluster:
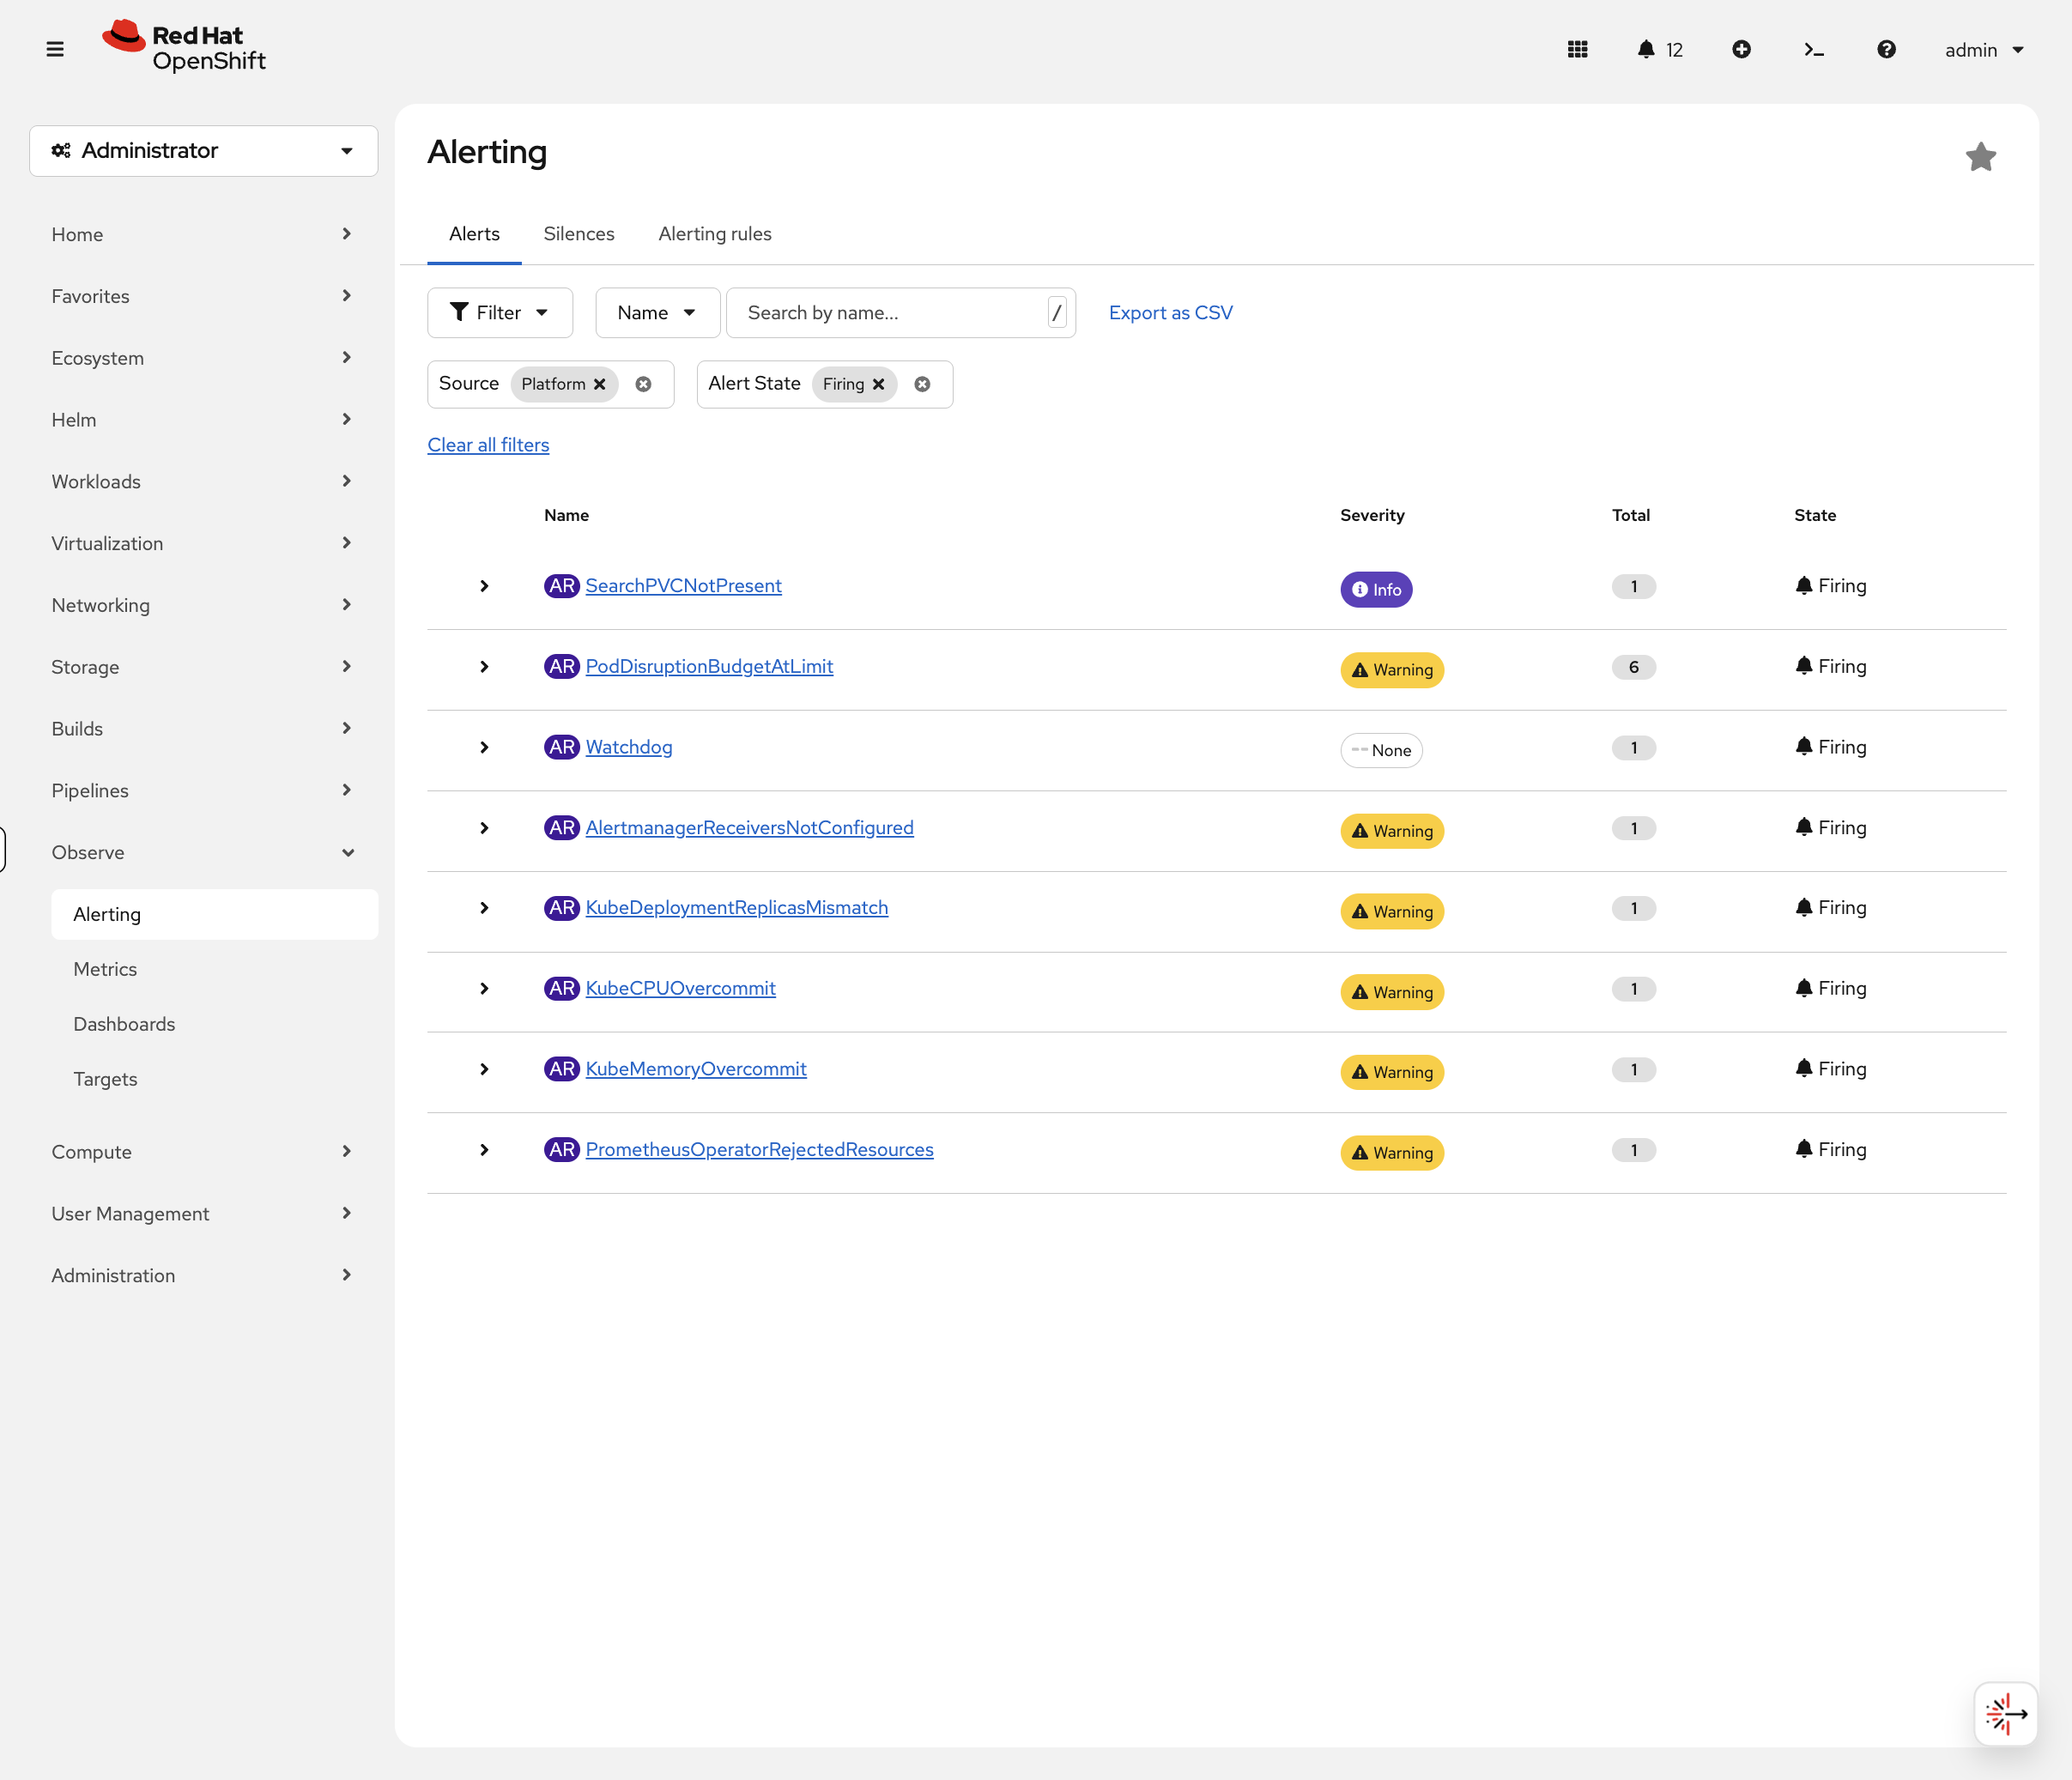
This is the view on-call engineers live in — knowing how to read it matters more than knowing how to create rules.
Set Up the Logging Stack
While metrics tell you what is happening, logs tell you why. OpenShift’s logging stack has three layers — you need to understand each one because when logging breaks in production, you need to know which layer to troubleshoot.
The Architecture
The logging pipeline works like this:
-
Collectors (Vector) run on every node and gather logs from containers, the OS, and the Kubernetes API
-
Loki stores and indexes the logs (backed by S3-compatible object storage)
-
Console UI plugin lets you query logs from the OpenShift web console
Each layer is managed by a separate operator, so you can upgrade or troubleshoot them independently.
Install the Logging Operators
Three operators are needed. Each one manages a different part of the pipeline. First, create the required namespaces and operator groups:
oc create namespace openshift-operators-redhat 2>/dev/null || true
oc create namespace openshift-logging 2>/dev/null || true
cat <<EOF | oc apply -f -
apiVersion: operators.coreos.com/v1
kind: OperatorGroup
metadata:
  name: openshift-operators-redhat
  namespace: openshift-operators-redhat
spec: {}
---
apiVersion: operators.coreos.com/v1
kind: OperatorGroup
metadata:
  name: cluster-logging
  namespace: openshift-logging
spec:
  targetNamespaces:
  - openshift-logging
EOF
Now install the operators from the Software Catalog.
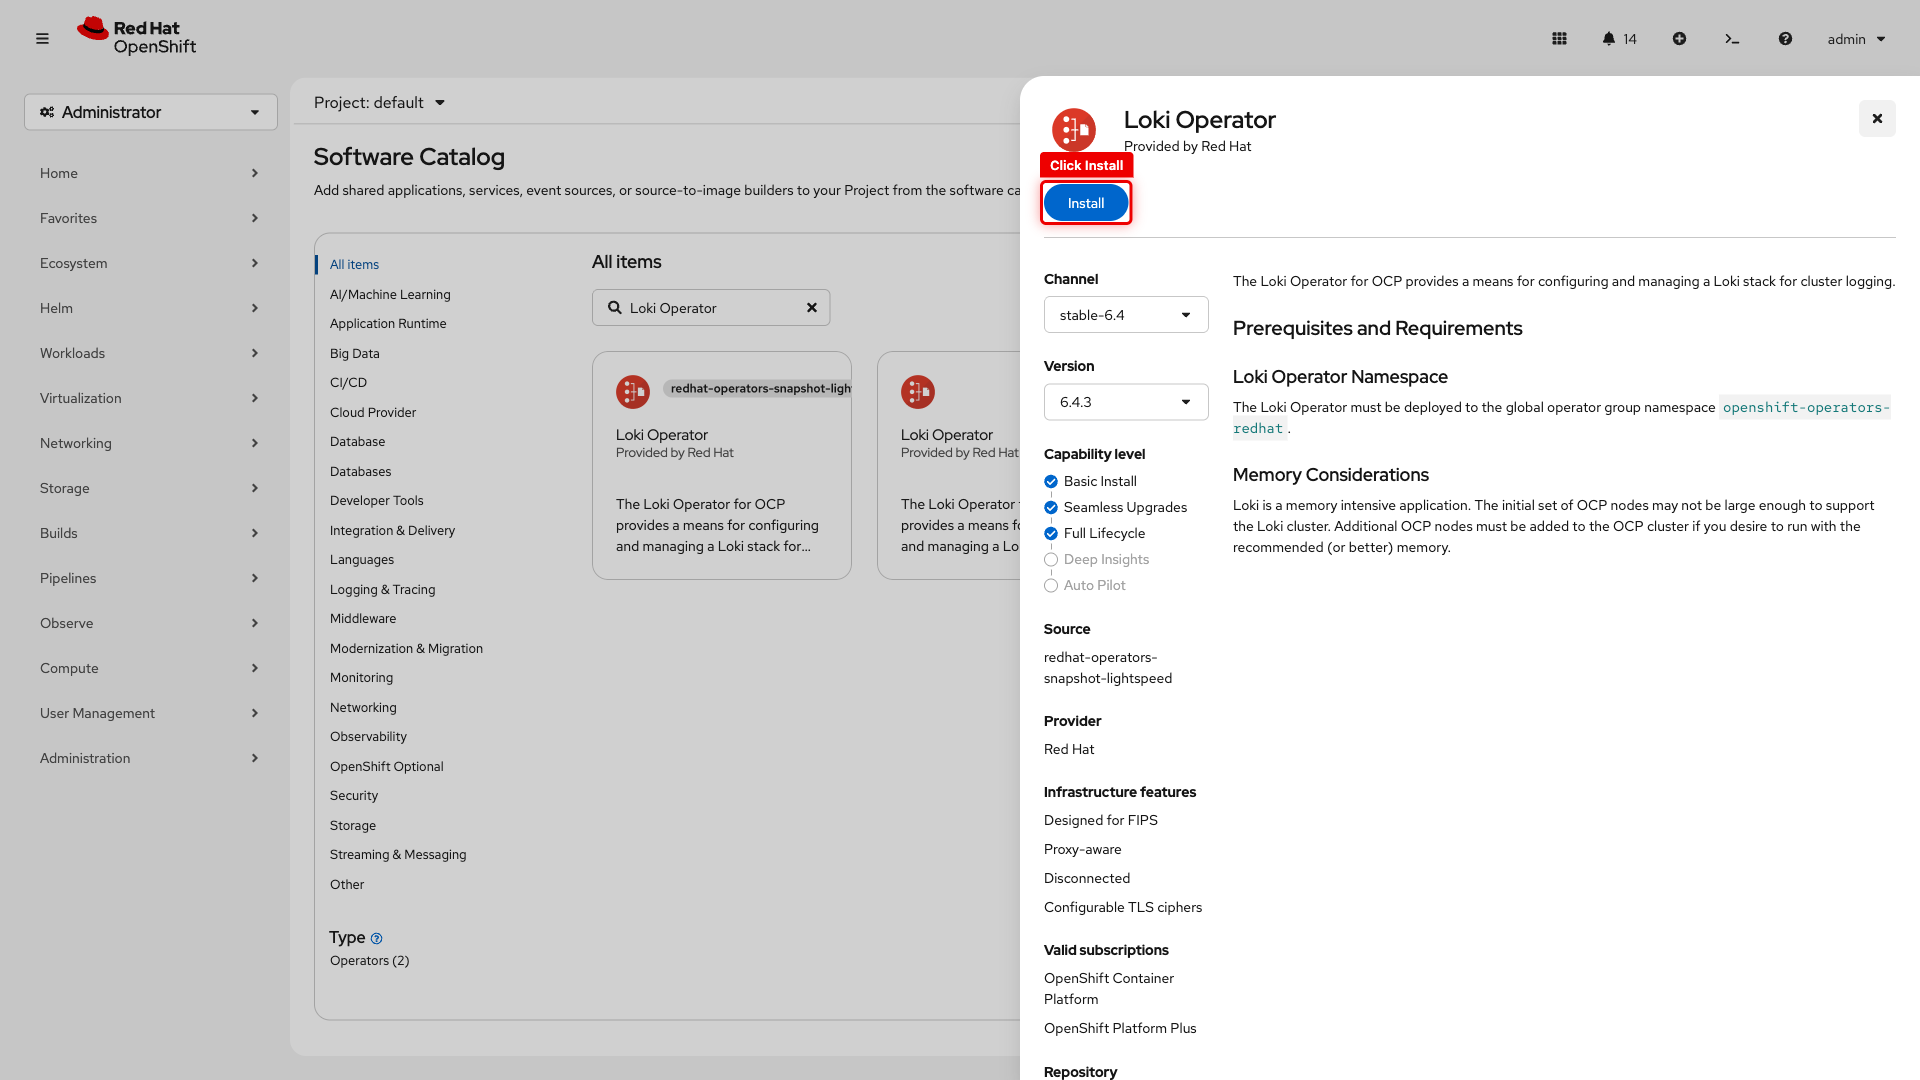
Operator 1: Loki Operator (log storage)
-
Navigate to Ecosystem → Software Catalog
-
Search for Loki Operator
-
Click the Loki Operator tile (select the one labeled Red Hat, not snapshot-lightspeed)
-
Click Install
-
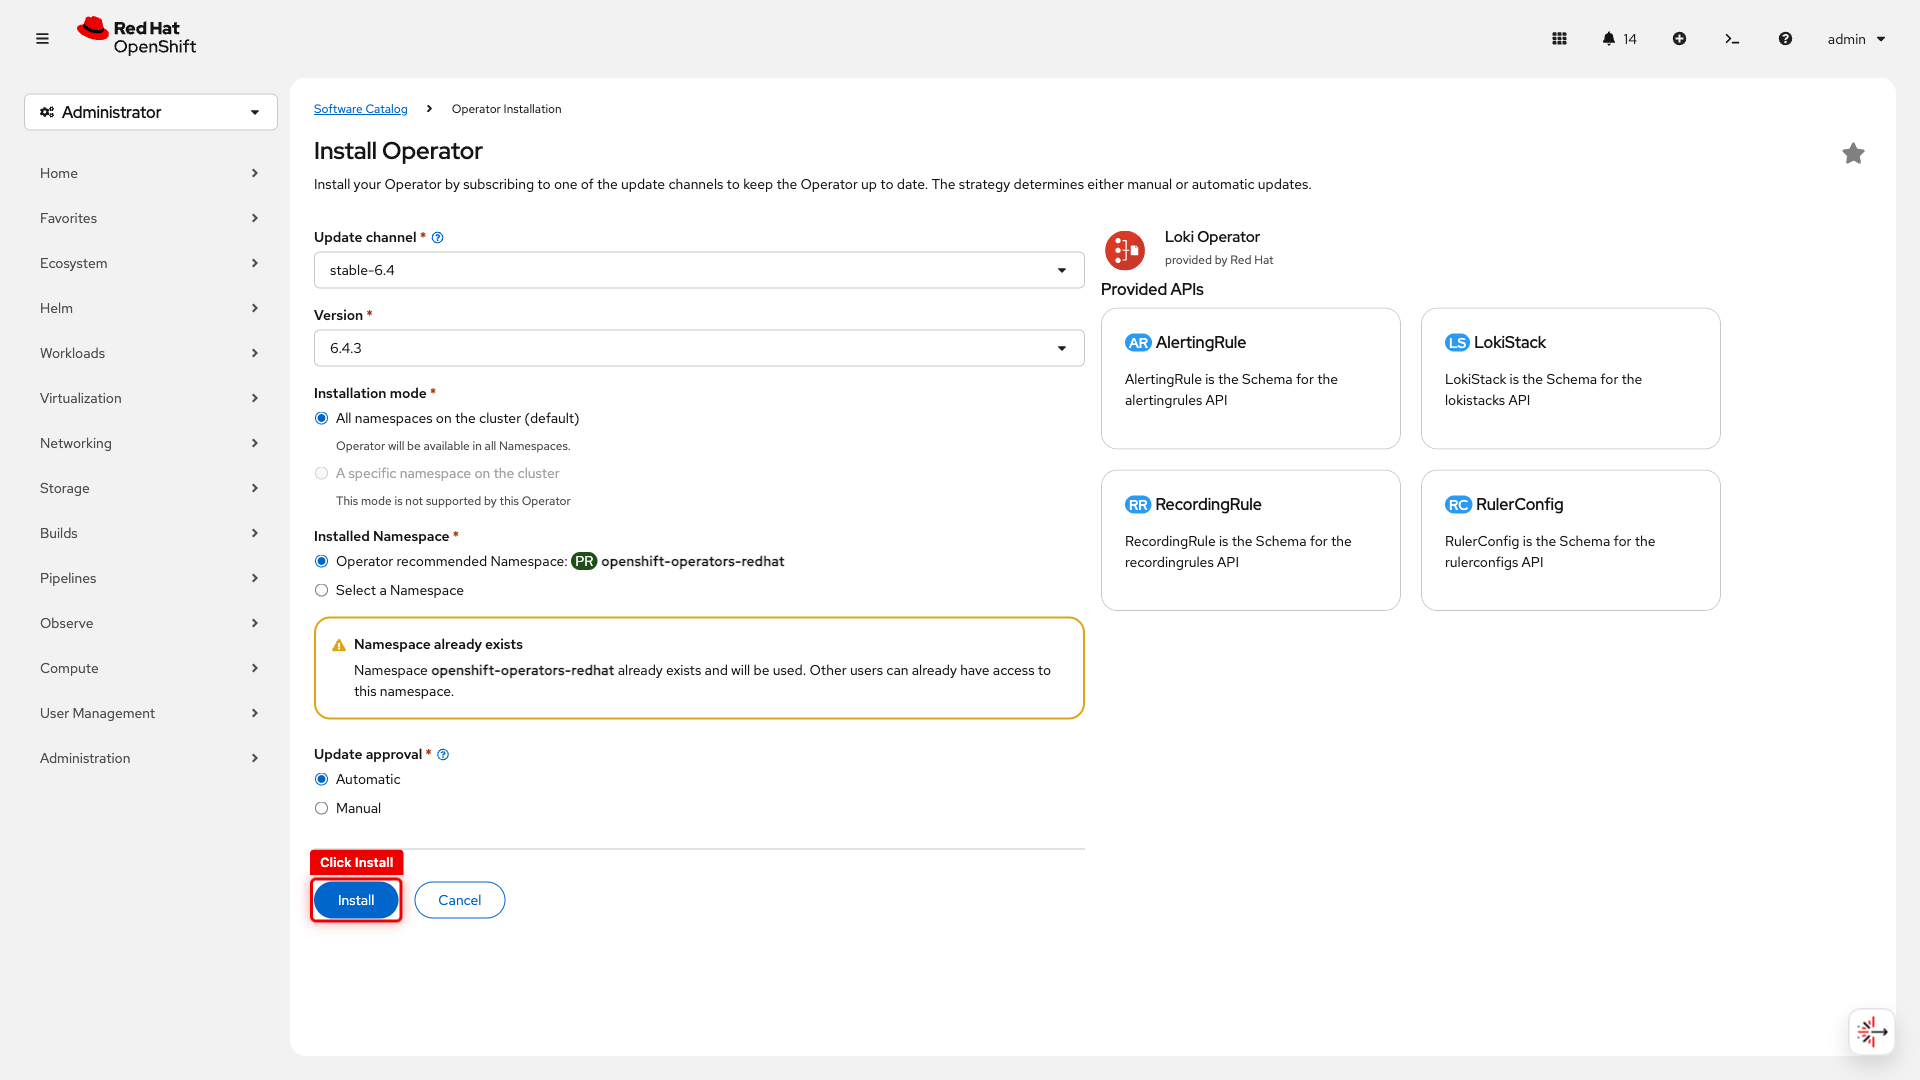
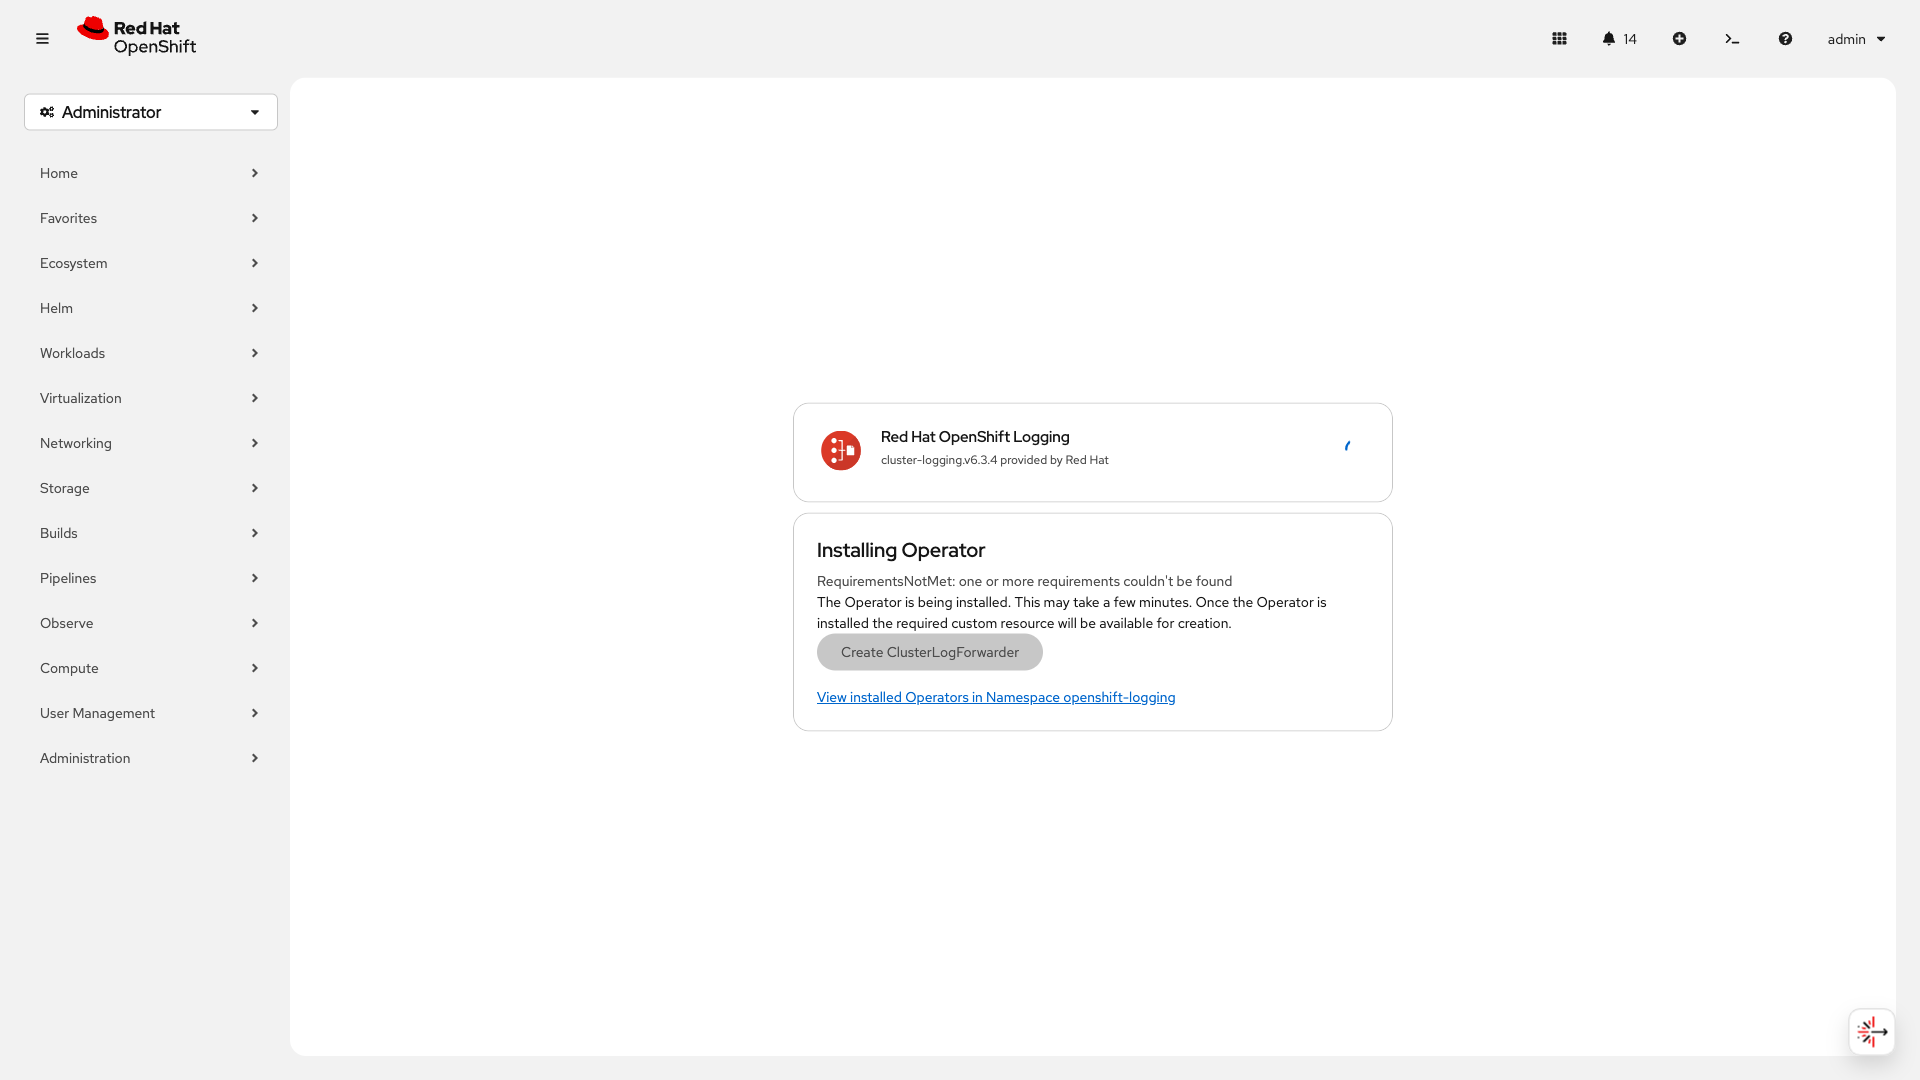
On the install configuration page, leave all defaults (channel, namespace, approval) and click Install
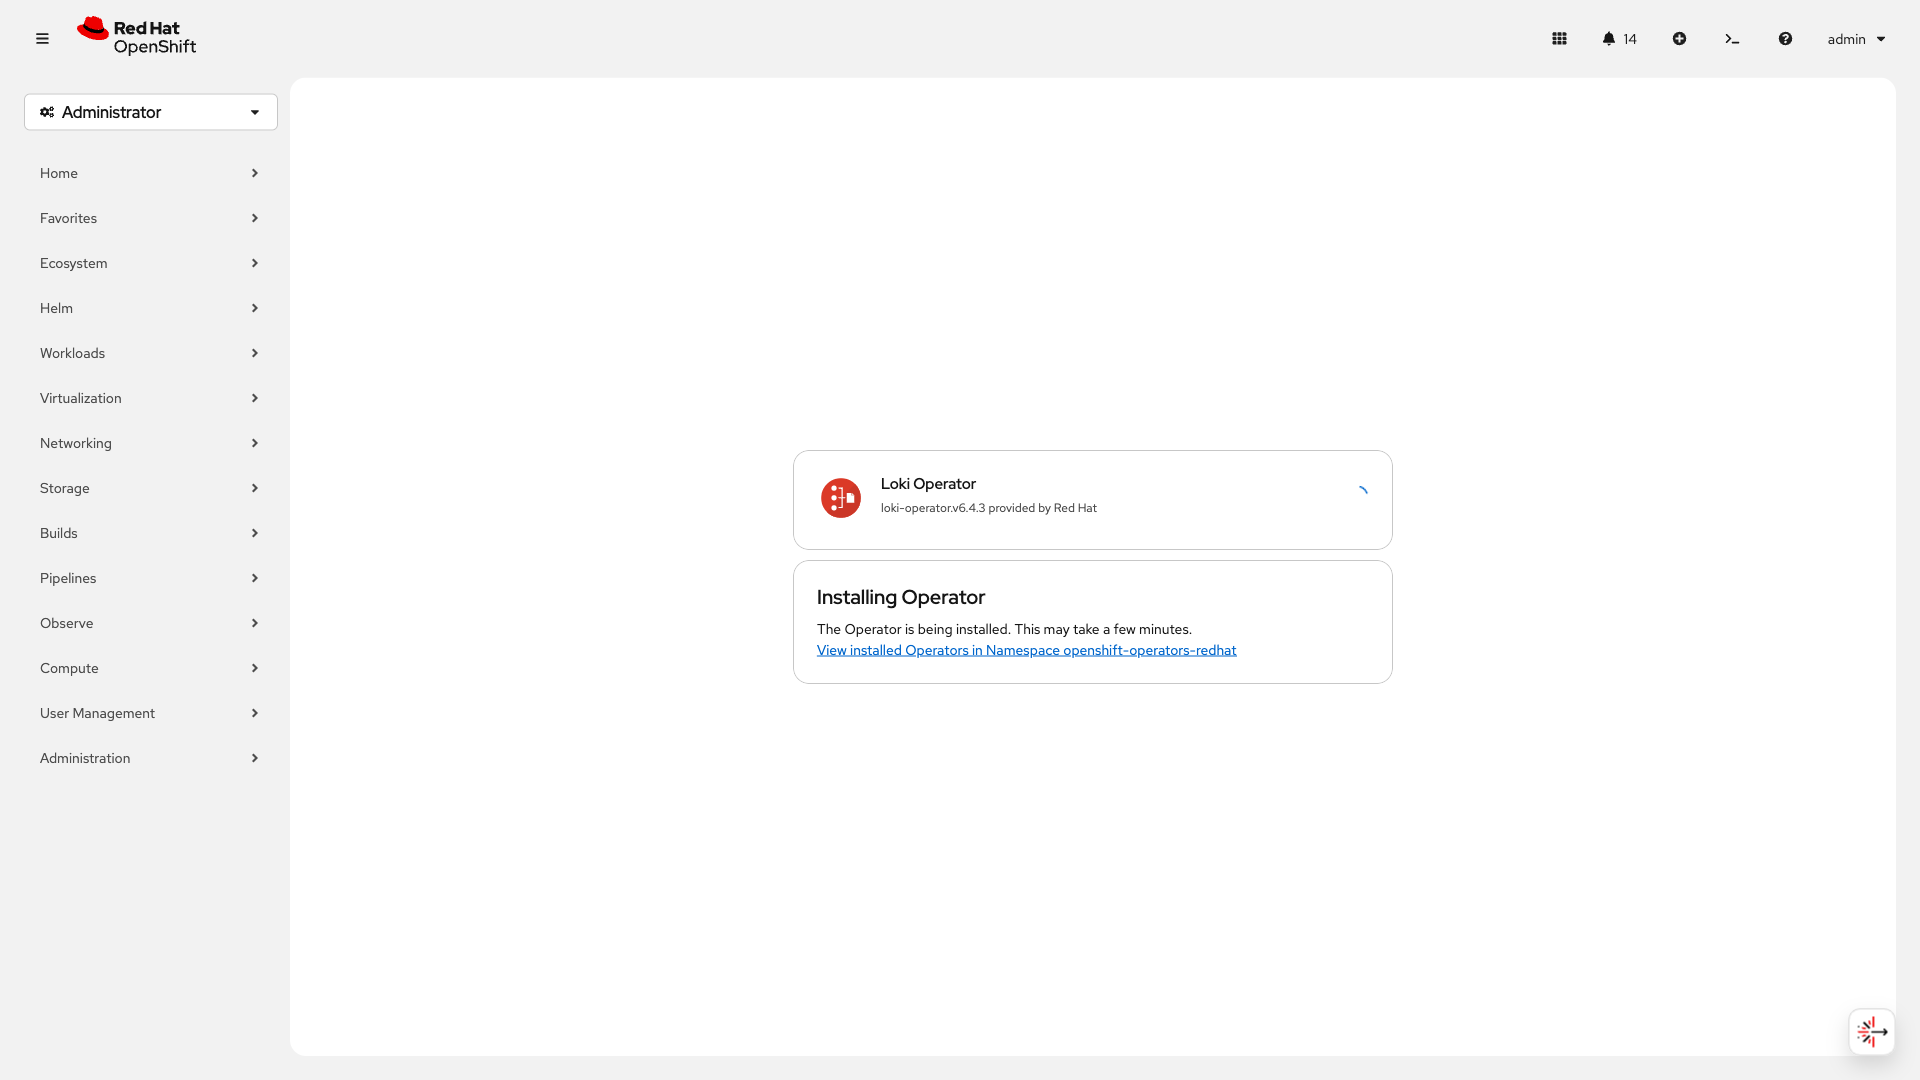
You’ll see the "Installing Operator" confirmation:
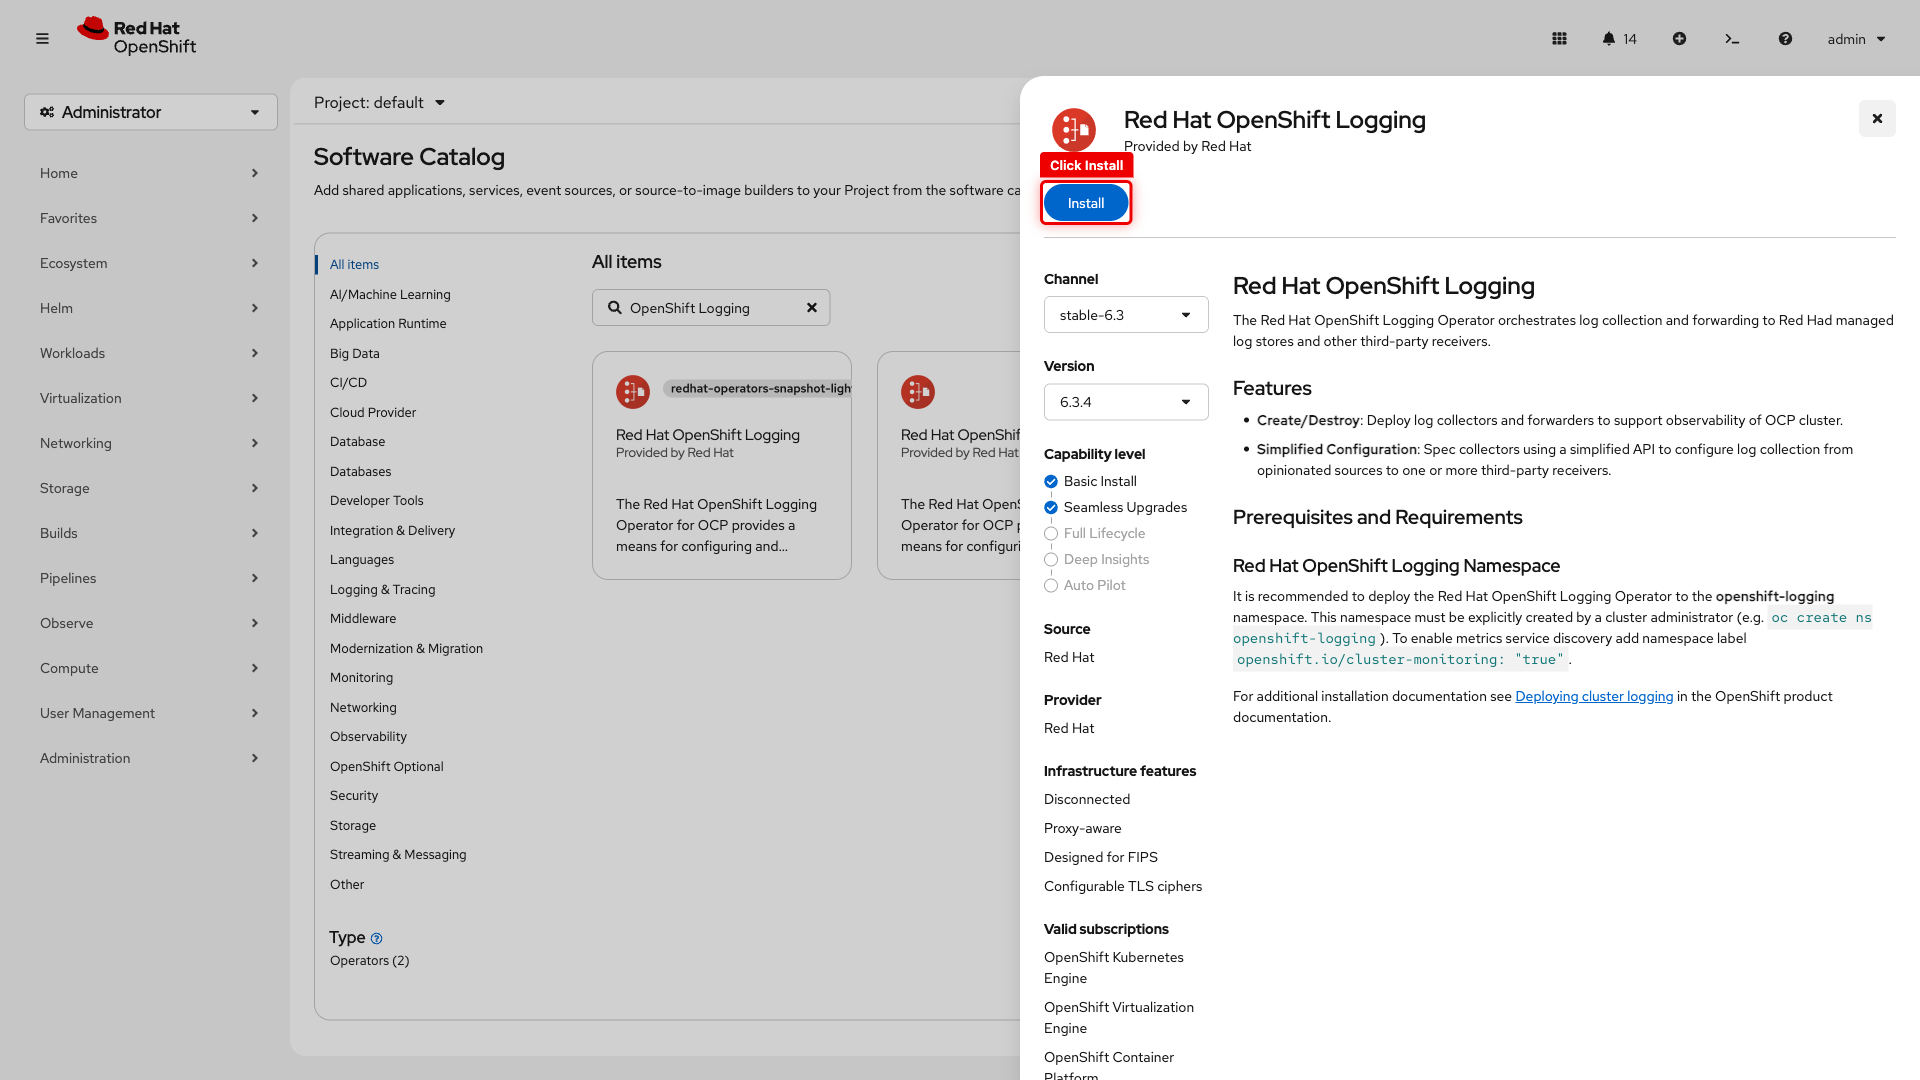
Operator 2: Red Hat OpenShift Logging (log collection)
-
Go back to Ecosystem → Software Catalog
-
Search for OpenShift Logging
-
Click the Red Hat OpenShift Logging tile
-
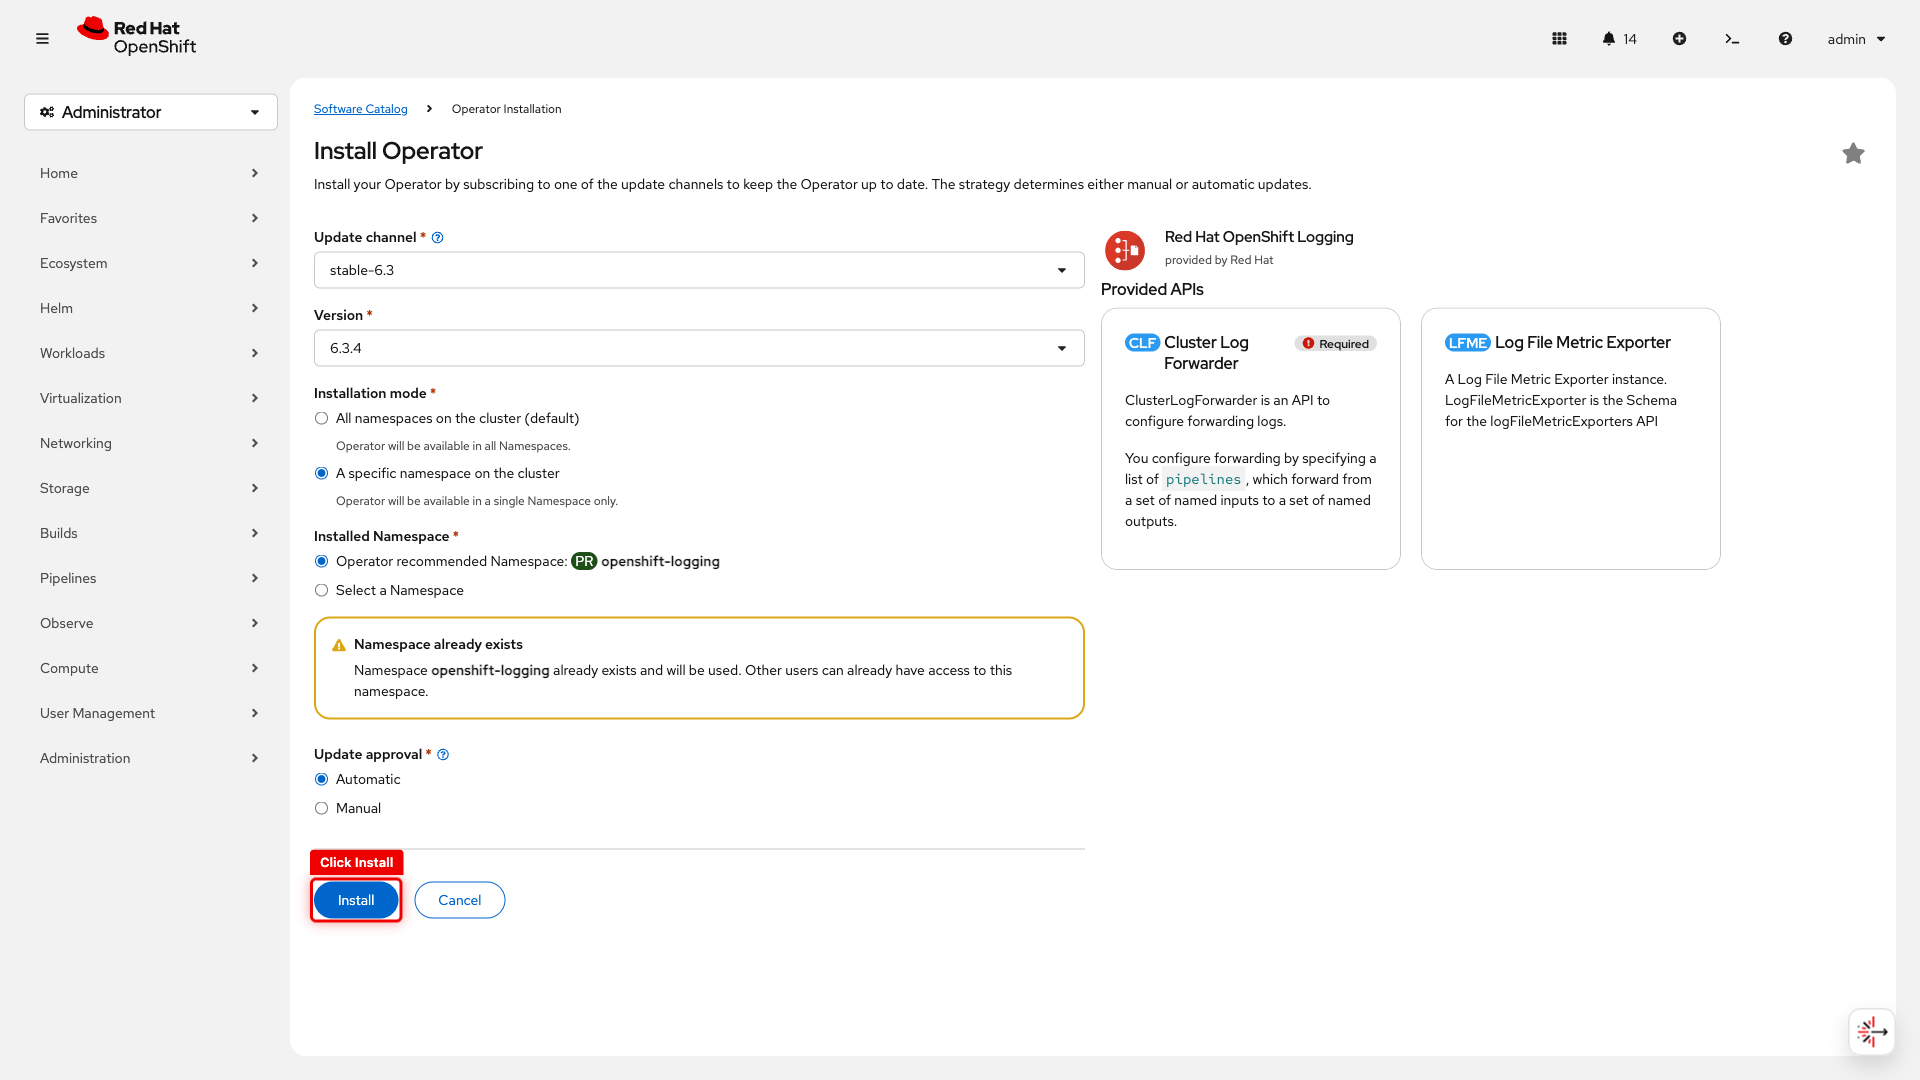
Click Install
-
On the install configuration page, select A specific namespace on the cluster and verify the namespace is set to openshift-logging
-
Click Install
Operator 3: Cluster Observability Operator (console UI)
-
Go back to Ecosystem → Software Catalog
-
Search for Cluster Observability Operator
-
Click the tile, then click Install
-
Leave all defaults and click Install
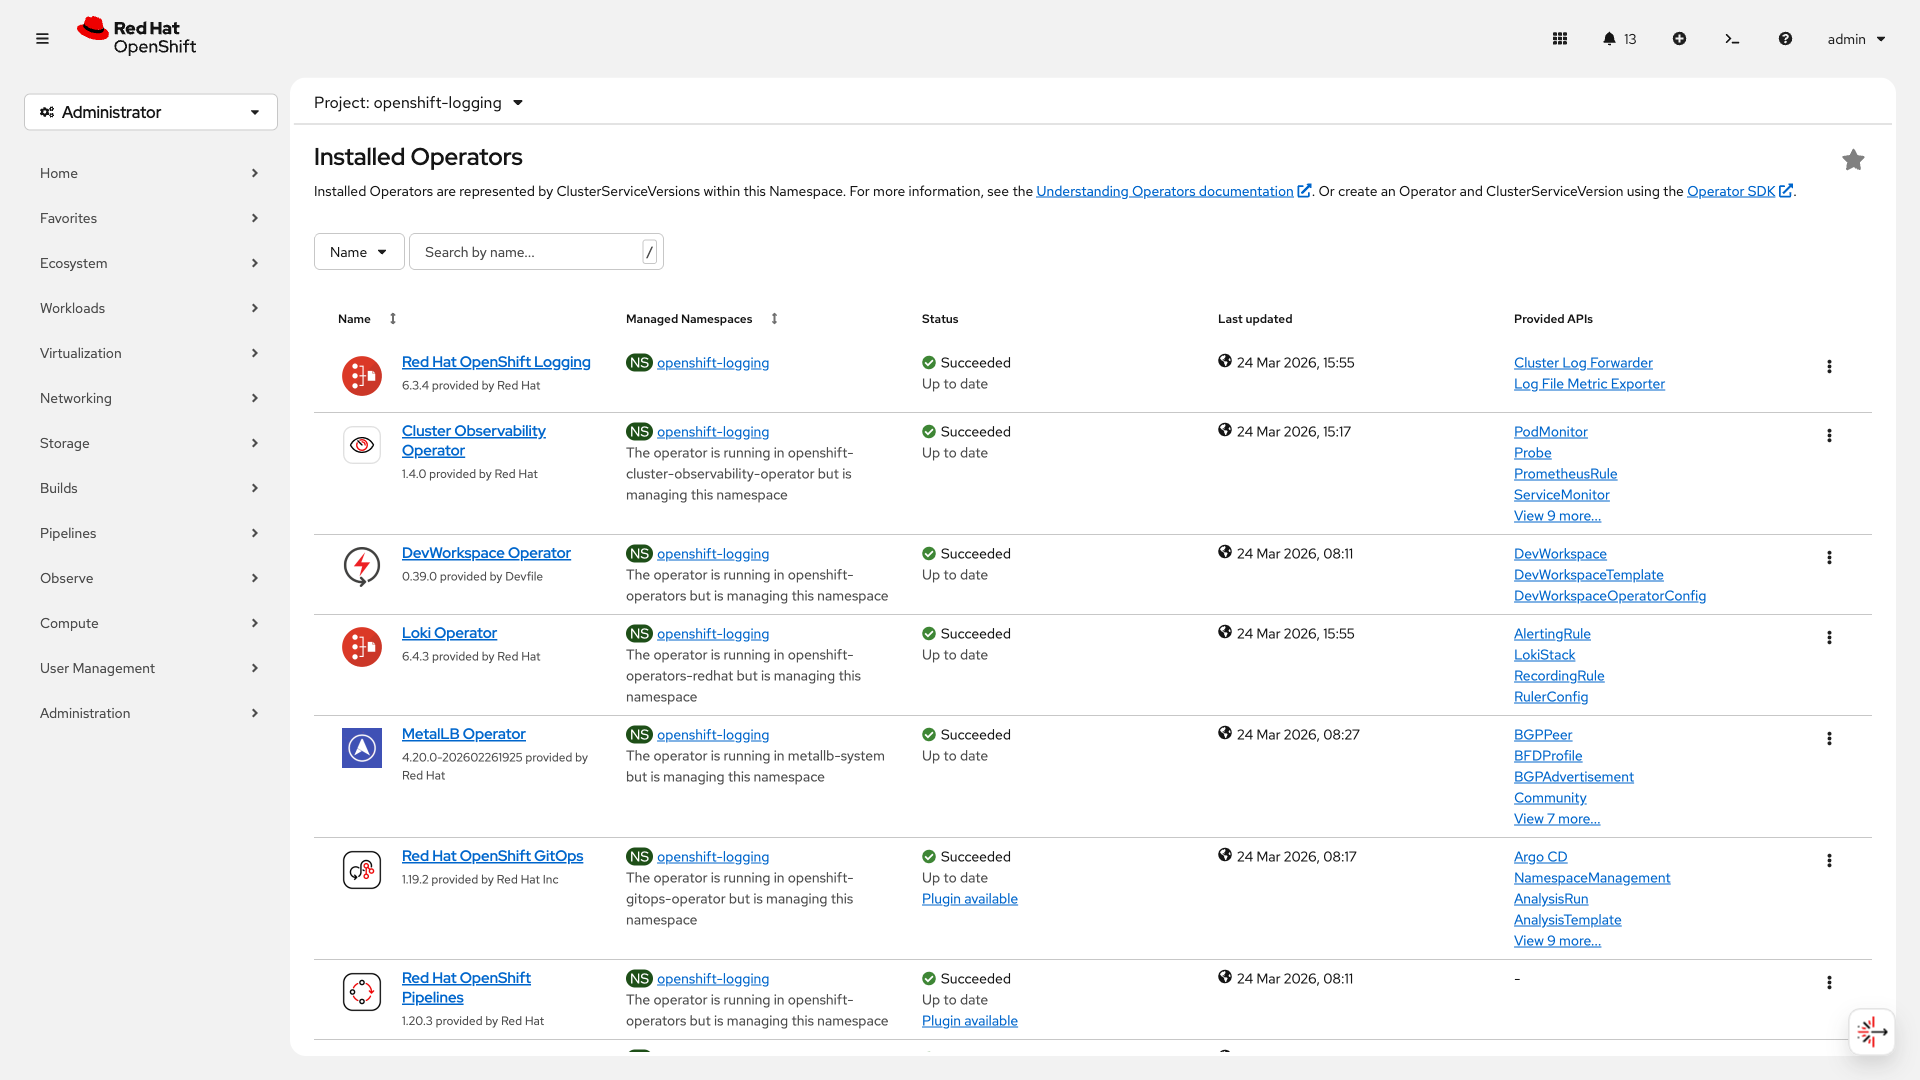
Verify All Operators
Wait 2-3 minutes, then navigate to Ecosystem → Installed Operators and select the openshift-logging project. You should see all operators showing Succeeded:
You can also verify from CLI:
echo "Waiting for Loki operator..."
until oc get csv -n openshift-operators-redhat 2>/dev/null | grep -q Succeeded; do sleep 10; done
echo "Waiting for Cluster Logging operator..."
until oc get csv -n openshift-logging 2>/dev/null | grep -q Succeeded; do sleep 10; done
echo "Waiting for Cluster Observability operator..."
until oc get csv -n openshift-operators 2>/dev/null | grep -q observability.*Succeeded; do sleep 10; done
echo "All operators ready"
Do not proceed to the next step until all three show Succeeded — the LokiStack and UIPlugin resources require the operator CRDs to be installed first.
Configure Log Storage (Loki + S3)
Loki needs object storage for log data. This cluster has OpenShift Data Foundation (ODF) which provides S3-compatible storage via NooBaa. In production, you’d point this at AWS S3, Azure Blob, or any S3-compatible store.
Create an S3 bucket for log storage:
cat <<EOF | oc apply -f -
apiVersion: objectbucket.io/v1alpha1
kind: ObjectBucketClaim
metadata:
  name: loki-bucket
  namespace: openshift-logging
spec:
  generateBucketName: loki-bucket
  storageClassName: openshift-storage.noobaa.io  # ODF's S3 provider
EOF
Wait for the bucket to be provisioned:
oc wait --for=jsonpath='{.status.phase}'=Bound obc/loki-bucket -n openshift-logging --timeout=60sNow extract the auto-generated S3 credentials and create a CA certificate ConfigMap so Loki can trust the NooBaa S3 endpoint’s TLS certificate:
ACCESS_KEY=$(oc get secret loki-bucket -n openshift-logging -o jsonpath='{.data.AWS_ACCESS_KEY_ID}' | base64 -d)
SECRET_KEY=$(oc get secret loki-bucket -n openshift-logging -o jsonpath='{.data.AWS_SECRET_ACCESS_KEY}' | base64 -d)
BUCKET_NAME=$(oc get configmap loki-bucket -n openshift-logging -o jsonpath='{.data.BUCKET_NAME}')
BUCKET_HOST=$(oc get configmap loki-bucket -n openshift-logging -o jsonpath='{.data.BUCKET_HOST}')
DEFAULT_SC=$(oc get sc -o jsonpath='{.items[?(@.metadata.annotations.storageclass\.kubernetes\.io/is-default-class=="true")].metadata.name}')

oc get secret noobaa-s3-serving-cert -n openshift-storage \
  -o jsonpath='{.data.tls\.crt}' | base64 -d > /tmp/noobaa-ca.crt
oc create configmap loki-s3-ca -n openshift-logging \
--from-file=service-ca.crt=/tmp/noobaa-ca.crt| The NooBaa S3 endpoint uses a cluster-internal service CA certificate. Without providing this CA to the LokiStack, the ingester would fail to write log chunks to S3 with a TLS verification error. |
Create the S3 credentials secret and the LokiStack:
cat <<EOF | oc apply -f -
apiVersion: v1
kind: Secret
metadata:
  name: lokistack-dev-s3
  namespace: openshift-logging
stringData:
  access_key_id: ${ACCESS_KEY}
  access_key_secret: ${SECRET_KEY}
  bucketnames: ${BUCKET_NAME}
  endpoint: https://${BUCKET_HOST}
  region: ""
---
apiVersion: loki.grafana.com/v1
kind: LokiStack
metadata:
  name: logging-loki
  namespace: openshift-logging
spec:
  managementState: Managed
  size: 1x.extra-small              # smallest size — scale up for production
  replication:
    factor: 1                        # single replica — matches compact cluster sizing
  storage:
    schemas:
    - effectiveDate: '2024-10-01'
      version: v13
    secret:
      name: lokistack-dev-s3        # S3 credentials from the bucket claim
      type: s3
    tls:
      caName: loki-s3-ca            # CA cert for NooBaa's S3 endpoint
  storageClassName: ${DEFAULT_SC}    # uses the cluster's default storage class
  limits:
    global:
      ingestion:
        ingestionRate: 16            # MB/sec — default 2 is too low for busy clusters
        ingestionBurstSize: 32       # MB — must exceed largest single push request
  tenants:
    mode: openshift-logging          # multi-tenant: separates app, infra, and audit logs
EOF
Set Up Log Collection
The ClusterLogForwarder tells Vector (the collector) what to collect and where to send it. The collector runs as a DaemonSet — one pod per node — so it captures logs from every container on every node.
Create the collector service account with the required permissions:
oc create sa collector -n openshift-logging
oc adm policy add-cluster-role-to-user logging-collector-logs-writer -z collector -n openshift-logging
oc adm policy add-cluster-role-to-user collect-application-logs -z collector -n openshift-logging
oc adm policy add-cluster-role-to-user collect-audit-logs -z collector -n openshift-logging
oc adm policy add-cluster-role-to-user collect-infrastructure-logs -z collector -n openshift-logging
Wait for the LokiStack gateway CA bundle to be created (the ClusterLogForwarder needs it):
echo "Waiting for LokiStack gateway CA bundle..."
until oc get configmap logging-loki-gateway-ca-bundle -n openshift-logging 2>/dev/null; do sleep 5; done
echo "CA bundle ready"
Create the ClusterLogForwarder — this defines the pipeline:
cat <<EOF | oc apply -f -
apiVersion: observability.openshift.io/v1
kind: ClusterLogForwarder
metadata:
  name: collector
  namespace: openshift-logging
spec:
  collector:
    resources:
      limits:
        memory: 8Gi                  # default 2Gi is too low for busy clusters
      requests:
        cpu: 500m
        memory: 256Mi
  serviceAccount:
    name: collector
  outputs:
  - name: default-lokistack
    type: lokiStack
    lokiStack:
      authentication:
        token:
          from: serviceAccount       # authenticates to Loki using the SA token
      target:
        name: logging-loki           # the LokiStack we created above
        namespace: openshift-logging
    tls:
      ca:
        key: service-ca.crt
        configMapName: logging-loki-gateway-ca-bundle
  pipelines:
  - name: default-logstore
    inputRefs:
    - application                    # logs from user workloads
    - infrastructure                 # logs from OpenShift components
    - audit                          # Kubernetes API audit logs
    outputRefs:
    - default-lokistack
EOFVerify and View Logs
Wait 2-3 minutes for LokiStack pods and collectors to start, then verify the full stack:
oc get pods -n openshift-loggingYou should see the logging operator, collector pods (one per node), and multiple Loki component pods all Running.
After the UIPlugin is created, you may see a notification in the console:
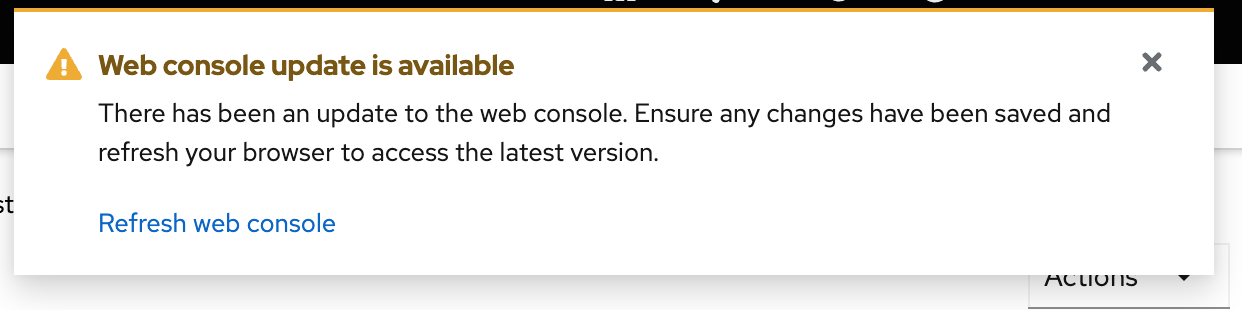
Click Refresh to reload the console with the new Logs view.
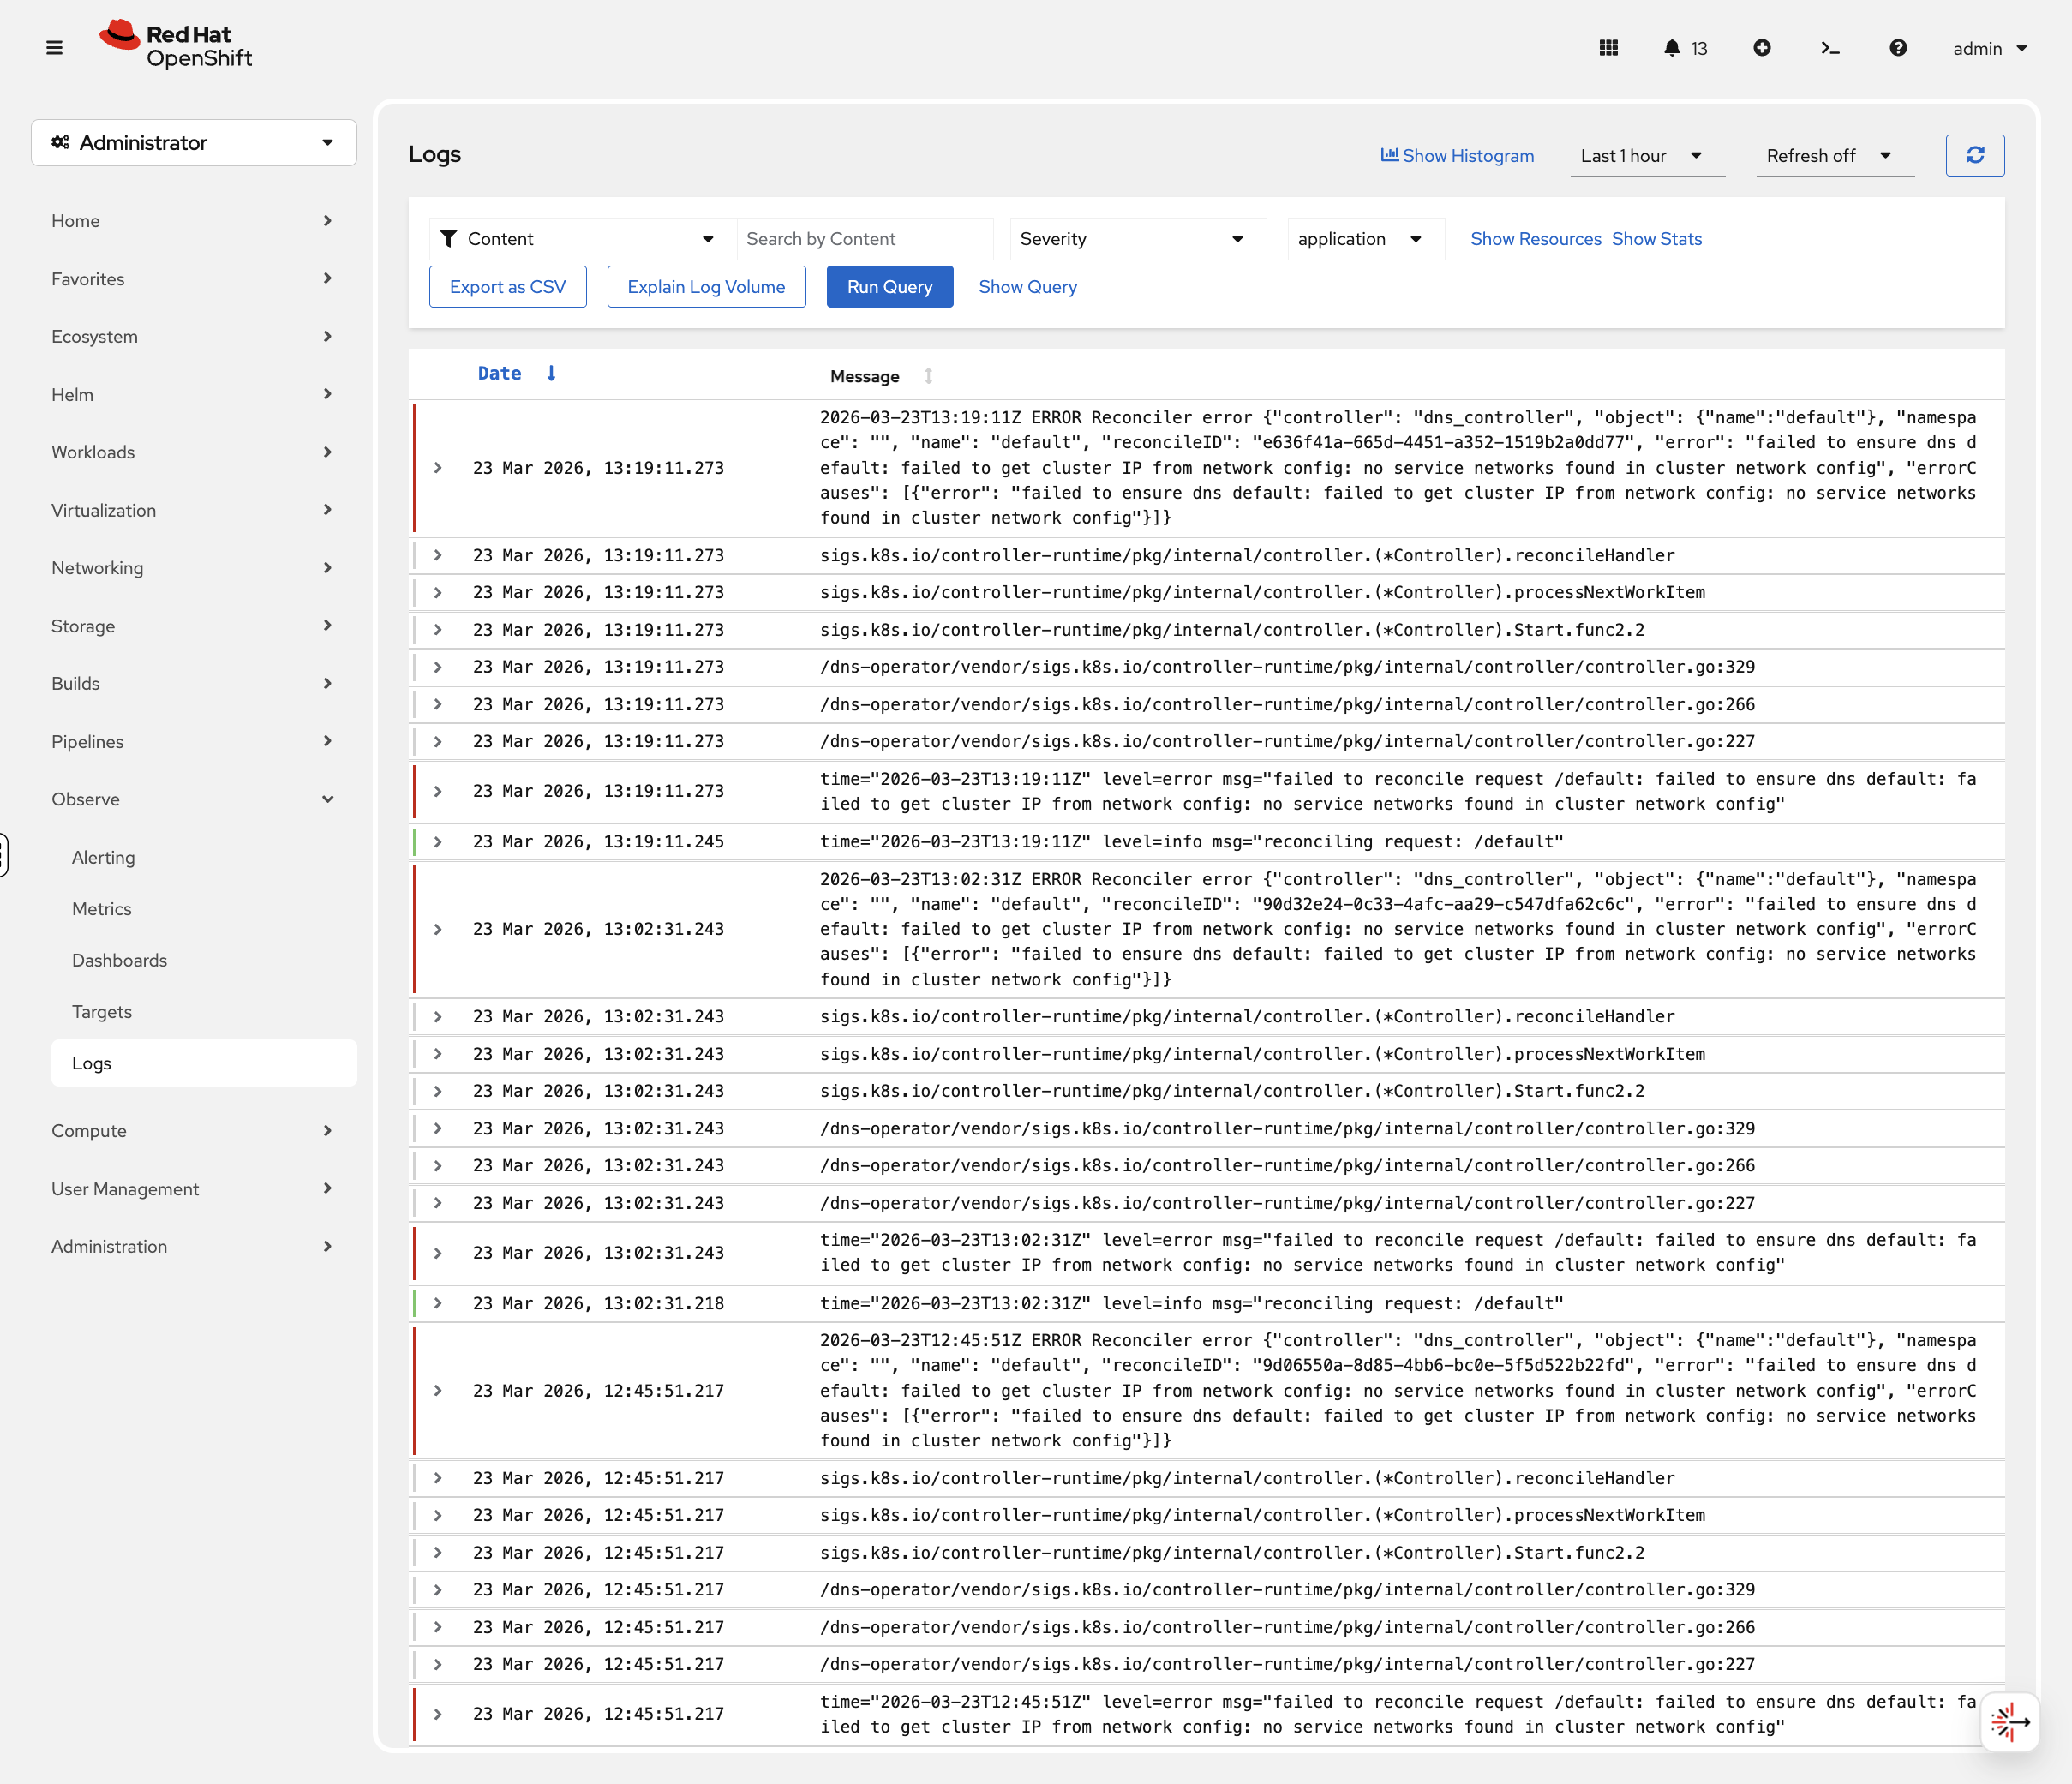
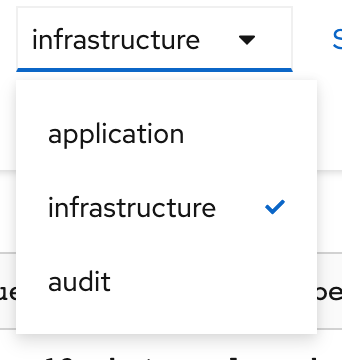
Navigate to Observe → Logs in the console. You’ll see three log types:
-
Application — Logs from user workloads
-
Infrastructure — Logs from OpenShift components
-
Audit — Kubernetes API audit logs
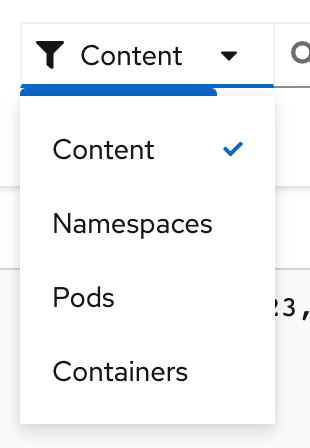
Use the filters to search by namespace, pod name, or severity level:
Filter by severity (Critical, Error, Warning, Info, Debug):
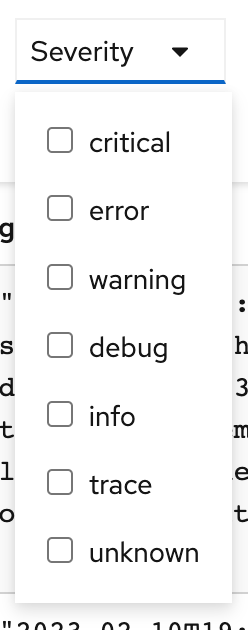
Try it now: select Infrastructure logs, then filter by severity Warning or Error. These are the log entries that matter during an incident — pod evictions, OOM kills, certificate expiry warnings. If you’ve completed the Application Management module, switch to Application logs and select the app-management namespace to find your application’s output.
The histogram at the top shows log volume over time — spikes in the error count correlate with incidents. Click on a spike to zoom into that time window.
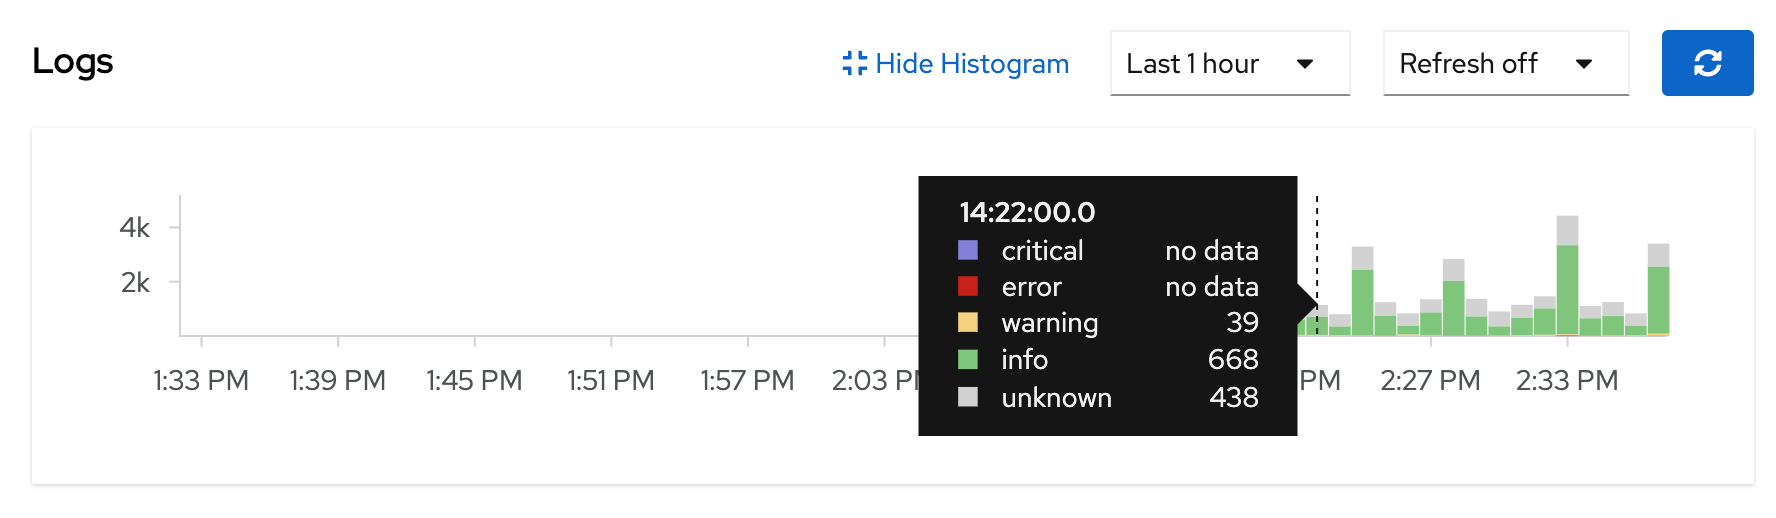
|
It may take 1-2 minutes for logs to start appearing after the collector pods are running. If you see "No datapoints found", wait a moment and refresh. |
OpenTelemetry for Distributed Tracing
Metrics tell you what is happening. Logs tell you why. Traces tell you where — when a request crosses multiple microservices, traces show the exact path and timing across every service. If a user reports "checkout is slow", a trace shows you: frontend (2ms) → API gateway (5ms) → inventory service (800ms) → payment (3ms) — so you instantly see inventory is the bottleneck.
Developers instrument their apps with OpenTelemetry SDKs, but ops teams own the tracing infrastructure — deploying the collector, managing the storage backend, and making traces visible in the console.
Install the Operators
You need two additional operators. The Cluster Observability Operator (already installed for logging) provides the console UI.
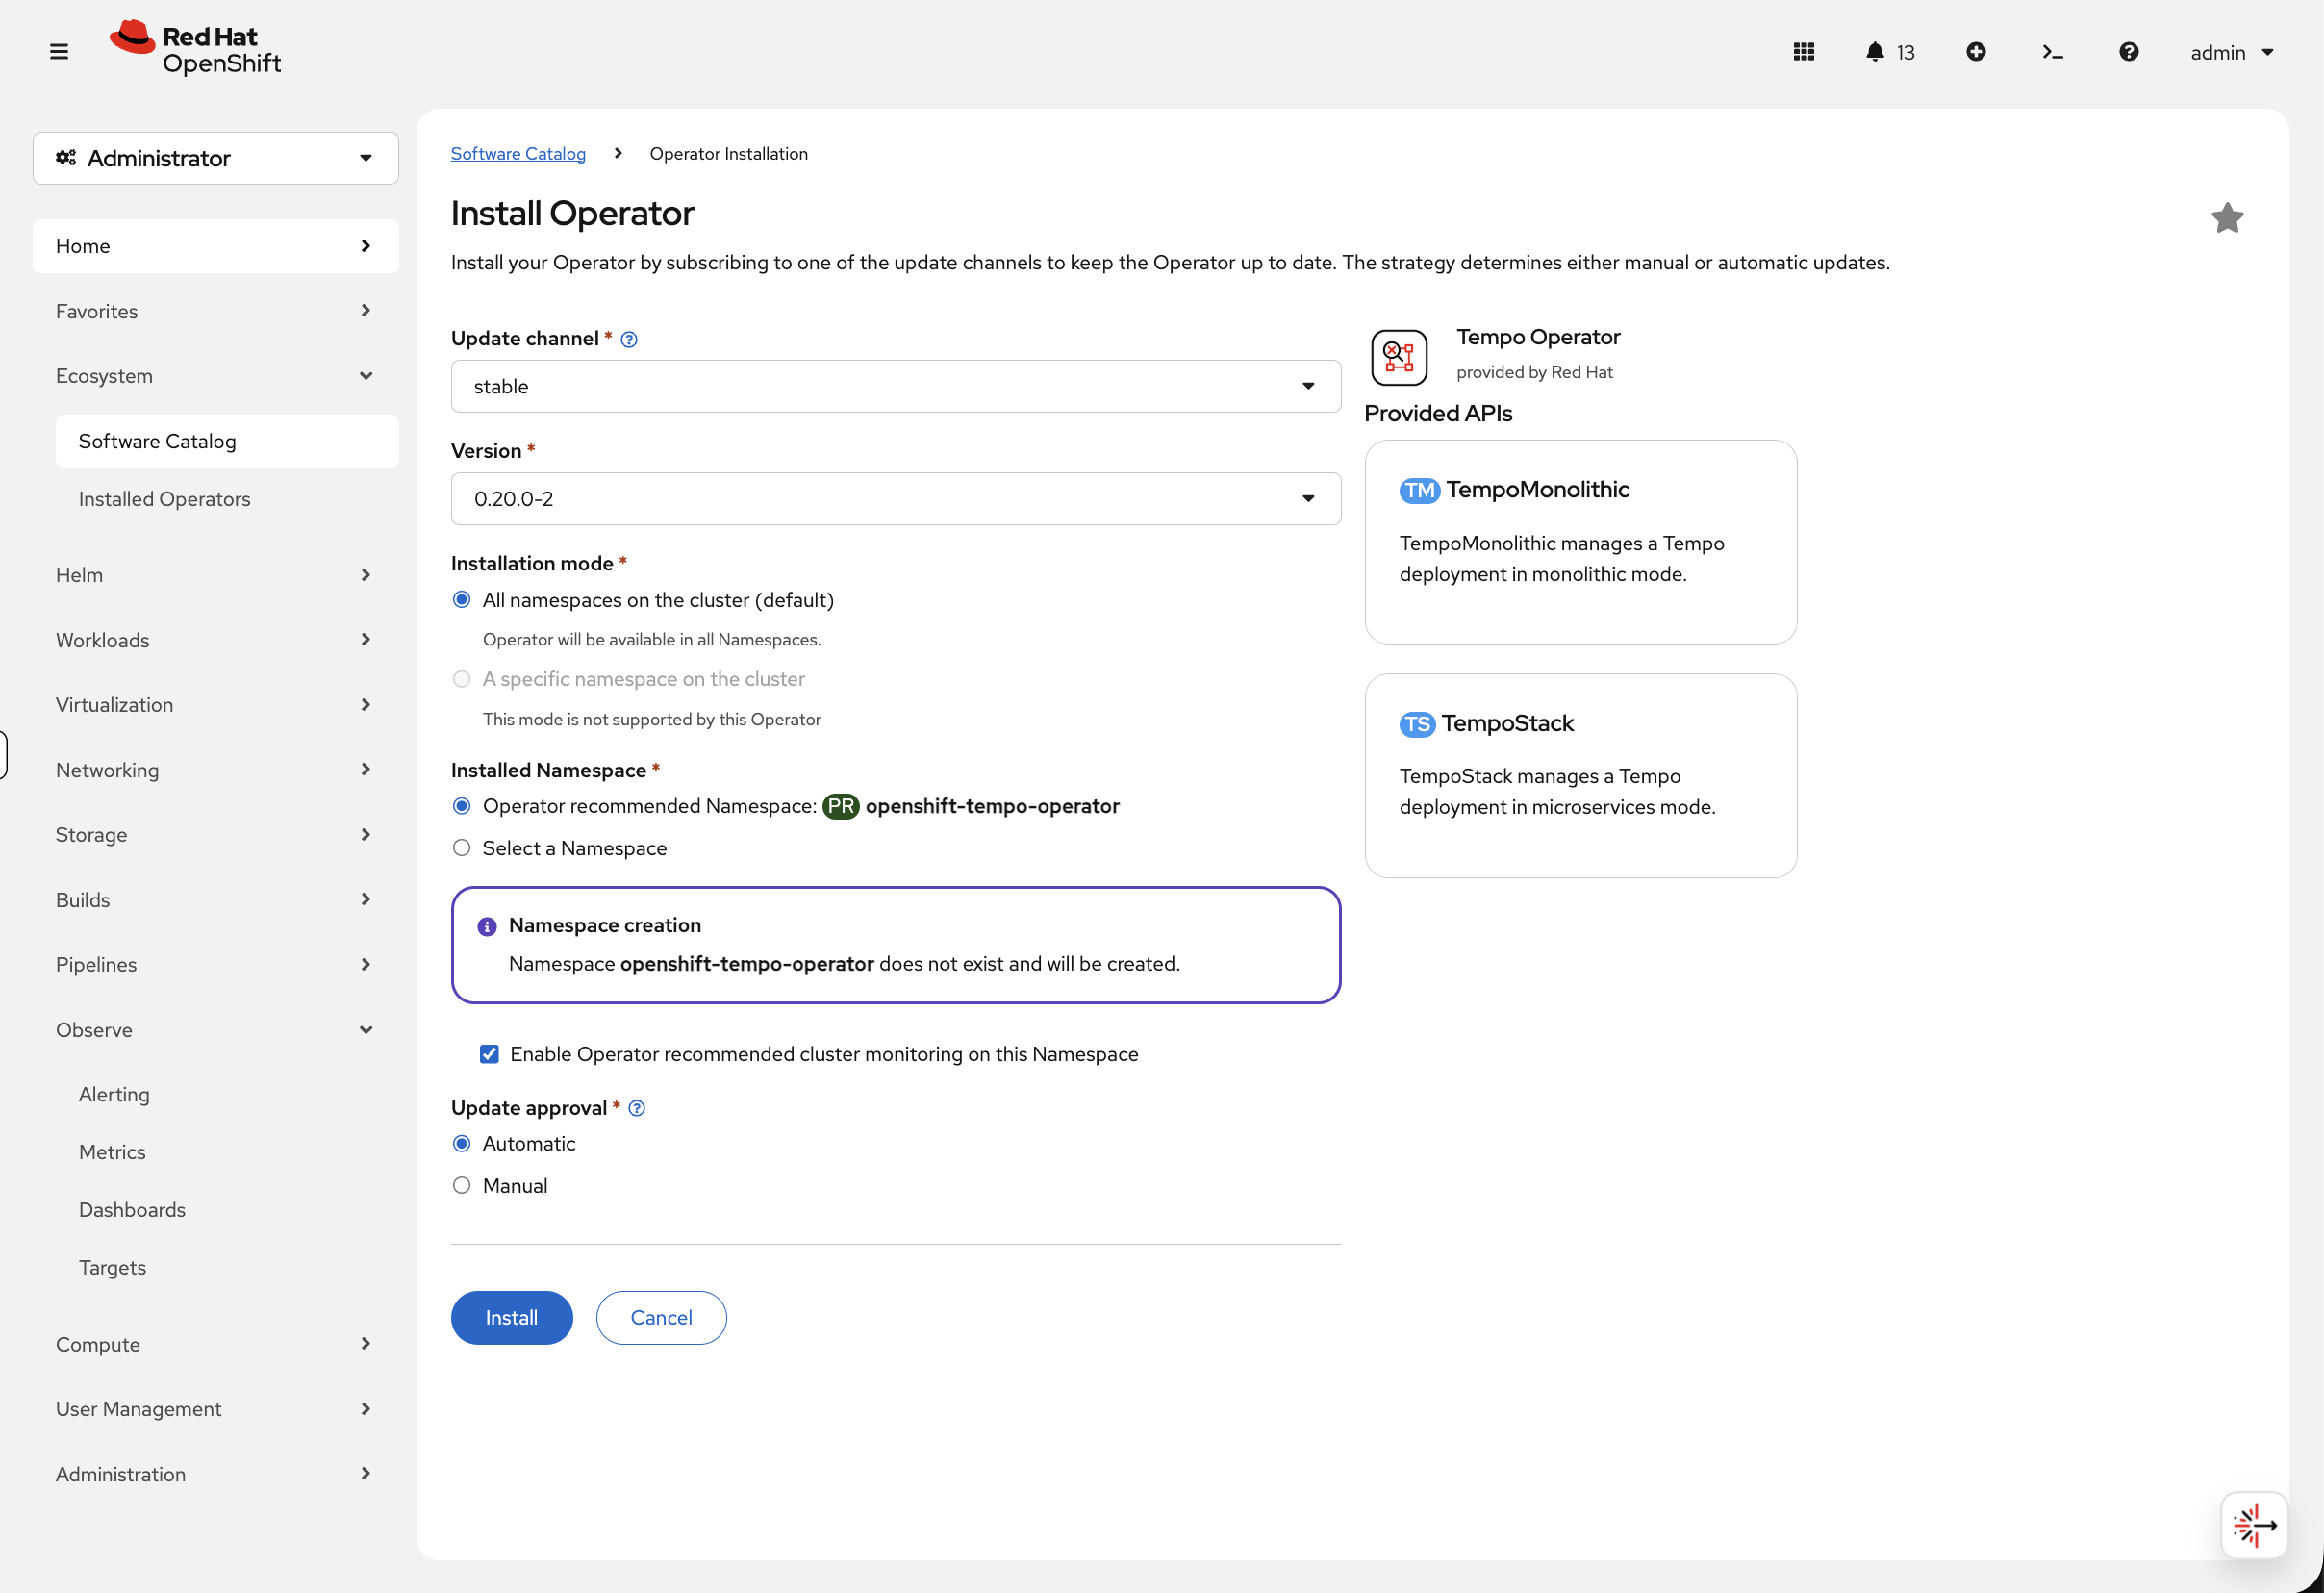
Tempo Operator (trace storage)
-
Navigate to Ecosystem → Software Catalog
-
Search for Tempo Operator
-
Click the Tempo Operator tile (Red Hat)
-
Click Install, leave all defaults, click Install
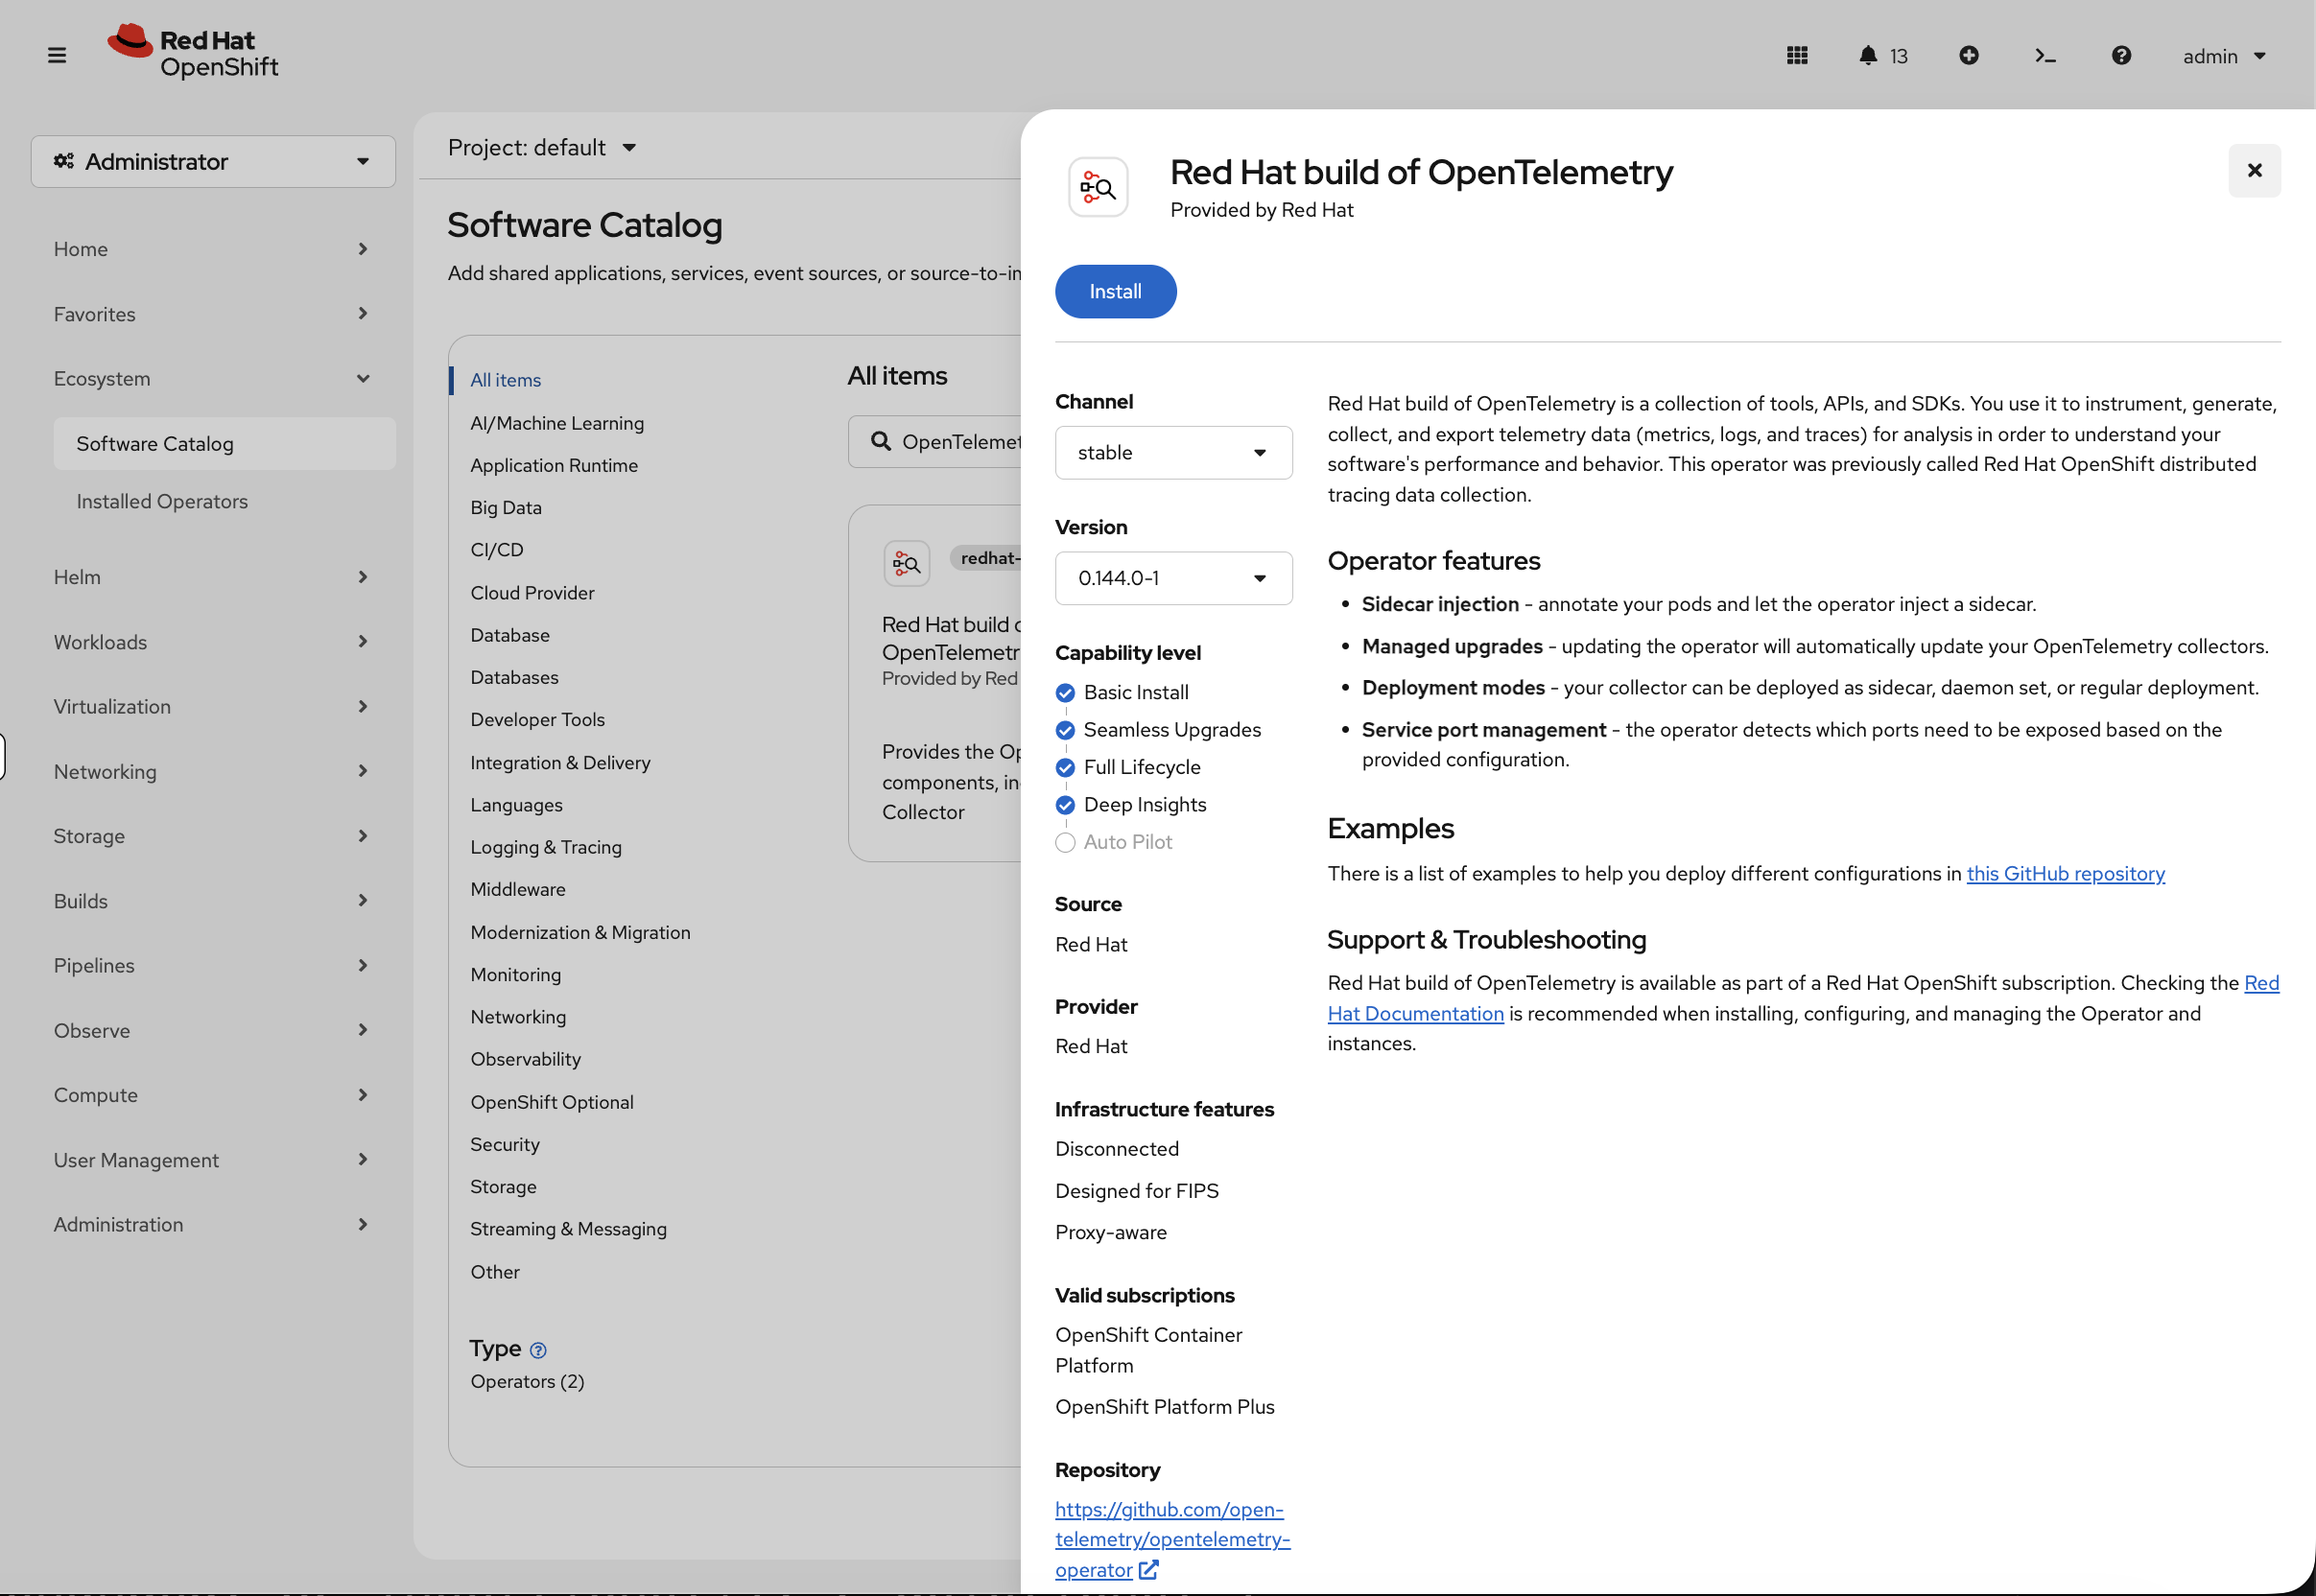
Red Hat build of OpenTelemetry (trace collection)
-
Go back to Ecosystem → Software Catalog
-
Search for Red Hat build of OpenTelemetry
-
Click the tile, then Install
-
Leave all defaults, click Install
Verify both operators are ready:
echo "Waiting for Tempo operator..."
until oc get csv -A 2>/dev/null | grep -q "tempo.*Succeeded"; do sleep 10; done
echo "Waiting for OpenTelemetry operator..."
until oc get csv -A 2>/dev/null | grep -q "opentelemetry.*Succeeded"; do sleep 10; done
echo "Both operators ready"
Deploy Tempo (Trace Storage)
Tempo is the backend that stores and indexes traces — similar to how Loki stores logs. We’ll use TempoMonolithic, a single-binary deployment suitable for workshops and small clusters.
Create the namespace and deploy TempoMonolithic with multi-tenancy enabled:
oc create namespace tracing-system 2>/dev/null || true
cat <<EOF | oc apply -f -
apiVersion: tempo.grafana.com/v1alpha1
kind: TempoMonolithic
metadata:
  name: sample
  namespace: tracing-system
spec:
  storage:
    traces:
      backend: pv
      size: 10Gi
  jaegerui:
    enabled: true
    route:
      enabled: true
  multitenancy:
    enabled: true
    mode: openshift
    authentication:
      - tenantName: dev
        tenantId: "1610b0c3-c509-4592-a256-a1871353dbfa"
EOF
Multi-tenancy is required for the console Traces UI to detect the Tempo instance. The openshift mode uses OpenShift’s built-in authentication — no external OIDC setup needed.
|
Wait for Tempo to be ready:
echo "Waiting for Tempo pod..."
until oc get pods -n tracing-system -l app.kubernetes.io/component=tempo 2>/dev/null | grep -q Running; do sleep 5; done
oc get pods -n tracing-system -l app.kubernetes.io/component=tempo
Set Up RBAC
The tracing pipeline needs two sets of permissions: the collector needs write access to push traces, and users need read access to query them.
cat <<EOF | oc apply -f -
---
apiVersion: v1
kind: ServiceAccount
metadata:
  name: otel-collector
  namespace: tracing-system
---
apiVersion: rbac.authorization.k8s.io/v1
kind: ClusterRole
metadata:
  name: tempomonolithic-traces-reader
rules:
  - apiGroups: ["tempo.grafana.com"]
    resources: ["dev"]
    resourceNames: ["traces"]
    verbs: ["get"]
---
apiVersion: rbac.authorization.k8s.io/v1
kind: ClusterRoleBinding
metadata:
  name: tempomonolithic-traces-reader
roleRef:
  apiGroup: rbac.authorization.k8s.io
  kind: ClusterRole
  name: tempomonolithic-traces-reader
subjects:
  - apiGroup: rbac.authorization.k8s.io
    kind: Group
    name: system:authenticated
---
apiVersion: rbac.authorization.k8s.io/v1
kind: ClusterRole
metadata:
  name: tempomonolithic-traces-write
rules:
  - apiGroups: ["tempo.grafana.com"]
    resources: ["dev"]
    resourceNames: ["traces"]
    verbs: ["create"]
---
apiVersion: rbac.authorization.k8s.io/v1
kind: ClusterRoleBinding
metadata:
  name: tempomonolithic-traces-write
roleRef:
  apiGroup: rbac.authorization.k8s.io
  kind: ClusterRole
  name: tempomonolithic-traces-write
subjects:
  - kind: ServiceAccount
    name: otel-collector
    namespace: tracing-system
EOF
Deploy the OpenTelemetry Collector
The collector is the central receiving station for trace data. Apps send traces to the collector, and the collector forwards them to Tempo for storage. Think of it like Vector for logs — a pipeline component that sits between producers and storage.
cat <<EOF | oc apply -f -
apiVersion: opentelemetry.io/v1beta1
kind: OpenTelemetryCollector
metadata:
  name: otel
  namespace: tracing-system
spec:
  mode: deployment
  serviceAccount: otel-collector
  config:
    extensions:
      bearertokenauth:
        filename: /var/run/secrets/kubernetes.io/serviceaccount/token
    receivers:
      otlp:
        protocols:
          grpc:
            endpoint: 0.0.0.0:4317
          http:
            endpoint: 0.0.0.0:4318
    processors:
      batch:
        send_batch_size: 512
        timeout: 5s
    exporters:
      otlp/tempo:
        endpoint: tempo-sample-gateway.tracing-system.svc:4317
        tls:
          ca_file: /var/run/secrets/kubernetes.io/serviceaccount/service-ca.crt
        headers:
          X-Scope-OrgID: dev
        auth:
          authenticator: bearertokenauth
    service:
      extensions: [bearertokenauth]
      pipelines:
        traces:
          receivers: [otlp]
          processors: [batch]
          exporters: [otlp/tempo]
EOF
This collector:
-
Receives traces via OTLP on ports 4317 (gRPC) and 4318 (HTTP)
-
Batches incoming spans for efficiency
-
Exports to the Tempo gateway, authenticating with the service account token
Verify the collector is running:
oc get pods -n tracing-systemYou should see both the Tempo pod and the collector pod Running.
Enable the Traces Console UI
Like the logging UI, the Traces view needs a UIPlugin:
cat <<EOF | oc apply -f -
apiVersion: observability.openshift.io/v1alpha1
kind: UIPlugin
metadata:
  name: distributed-tracing
spec:
  type: DistributedTracing
EOF
You may see a console notification to refresh — click Refresh to reload.
Send a Test Trace
The collector is ready but nothing is sending traces yet. Let’s send a test trace to verify the full pipeline:
oc run test-trace --rm -i --restart=Never --image=registry.access.redhat.com/ubi9/ubi-minimal -n tracing-system -- sh -c "
curl -s -X POST http://otel-collector.tracing-system.svc:4318/v1/traces \
  -H 'Content-Type: application/json' \
  -d '{
    \"resourceSpans\": [{
      \"resource\": {
        \"attributes\": [{
          \"key\": \"service.name\",
          \"value\": {\"stringValue\": \"workshop-demo\"}
        }]
      },
      \"scopeSpans\": [{
        \"spans\": [{
          \"traceId\": \"11112222333344445555666677778888\",
          \"spanId\": \"aaaa222233334444\",
          \"name\": \"GET /api/weather\",
          \"kind\": 2,
          \"startTimeUnixNano\": \"\$(date +%s)000000000\",
          \"endTimeUnixNano\": \"\$(date +%s)500000000\",
          \"attributes\": [{
            \"key\": \"http.method\",
            \"value\": {\"stringValue\": \"GET\"}
          }]
        }]
      }]
    }]
  }' && echo 'Trace sent successfully'
"
This simulates what an instrumented application does — sends a span describing a single operation (GET /api/weather) with timing data.
View Traces in the Console
Navigate to Observe → Traces in the console. Select the Tempo instance (tracing-system / sample) and tenant (dev):
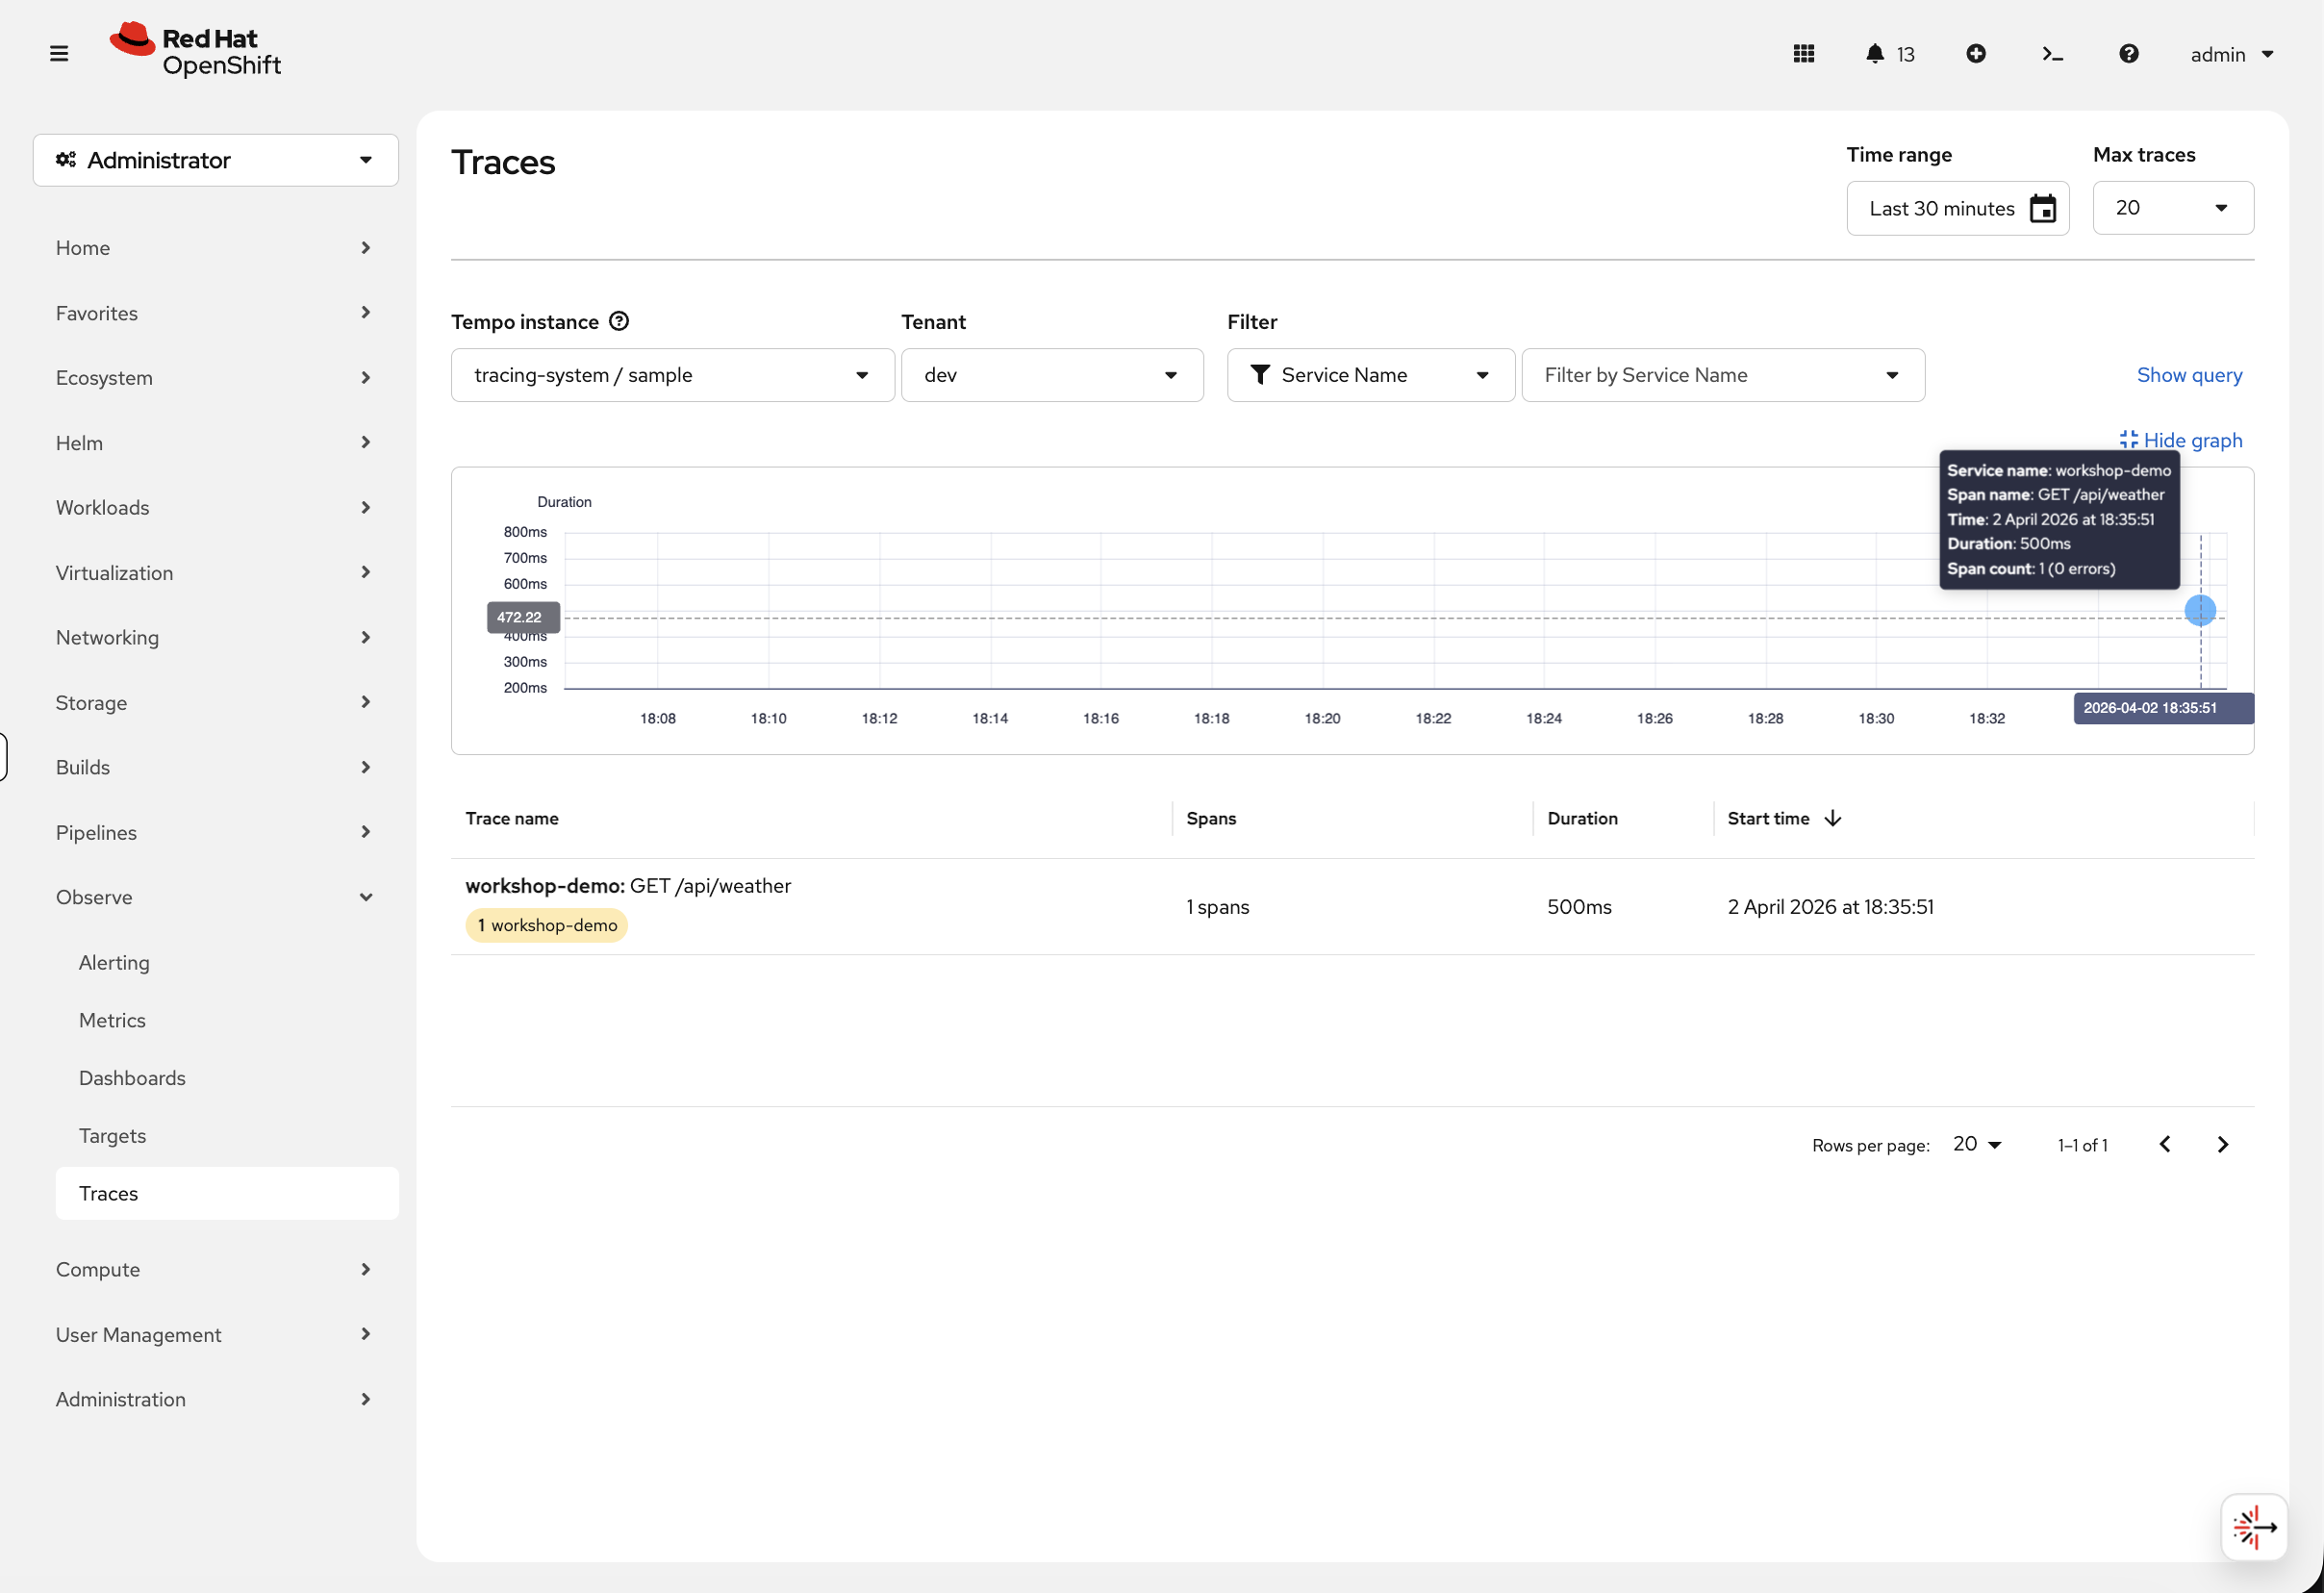
You should see the workshop-demo trace. Click on it to see the trace detail view — a timing waterfall showing each span:

With a single service this shows one span. In a real microservices application, you’d see multiple spans stacked in a waterfall — frontend → API → database — making it immediately obvious where latency is coming from.
The collector is now ready for production use. Developers point their apps at otel-collector.tracing-system.svc:4317 using OpenTelemetry SDKs, and traces automatically appear here.
Cleanup
Remove the observability resources you deployed. The Prometheus monitoring stack is built-in and doesn’t need cleanup.
# Remove the custom alerting rule
oc delete prometheusrule ops-track-alerts -n openshift-monitoring --ignore-not-found

# Remove the tracing stack
(
  oc delete opentelemetrycollector otel -n tracing-system --ignore-not-found
  oc delete uiplugin distributed-tracing --ignore-not-found
  oc delete tempomonolithic sample -n tracing-system --ignore-not-found
  oc delete clusterrolebinding tempomonolithic-traces-reader tempomonolithic-traces-write --ignore-not-found
  oc delete clusterrole tempomonolithic-traces-reader tempomonolithic-traces-write --ignore-not-found
  oc delete sa otel-collector -n tracing-system --ignore-not-found
  oc delete namespace tracing-system --ignore-not-found --wait=false
) &>/dev/null &

# Remove the logging stack
(
  oc delete clusterlogforwarder collector -n openshift-logging --ignore-not-found
  oc delete uiplugin logging --ignore-not-found
  oc delete lokistack logging-loki -n openshift-logging --ignore-not-found
  oc delete obc loki-bucket -n openshift-logging --ignore-not-found
  oc delete secret lokistack-dev-s3 -n openshift-logging --ignore-not-found
  oc delete configmap loki-s3-ca -n openshift-logging --ignore-not-found
  oc delete sa collector -n openshift-logging --ignore-not-found
) &>/dev/null &
echo "Cleanup running in background — you can continue to the next module"
Summary
What you learned:
-
OpenShift’s built-in Prometheus stack provides metrics and dashboards with no setup
-
How to create custom alerting rules with PrometheusRule
-
How to install and configure the full logging stack (Loki + Vector)
-
How to view and filter logs in the OpenShift console
-
How to deploy the OpenTelemetry tracing pipeline (Tempo + OTel Collector)
-
How to view distributed traces in the console
Together, metrics, logs, and traces give you the three pillars of observability — each answers a different question about your cluster and workloads.
Key operational commands:
# Cluster metrics
oc adm top nodes
oc adm top pods -A --sort-by=cpu | head -15

# View alerting rules
oc get prometheusrules -A

# View logging pods
oc get pods -n openshift-logging

# Check LokiStack status
oc get lokistack -n openshift-logging

# Check ClusterLogForwarder status
oc get clusterlogforwarder -n openshift-logging

# View tracing pods
oc get pods -n tracing-system

# Check TempoMonolithic status
oc get tempomonolithic -n tracing-system
Additional Resources
-
OpenShift Monitoring: Monitoring
-
OpenShift Logging Documentation: Logging
-
Logging 6.2 Stack: Logging 6.2
-
OpenShift Distributed Tracing: Distributed Tracing
-
Red Hat build of OpenTelemetry: OpenTelemetry