Installation & Verification
Module Overview
Duration: 20-25 minutes
Format: Hands-on verification
Audience: Platform Engineers, Operations Teams, Cluster Administrators
You’ve learned about OpenShift’s architecture and value. Now let’s verify a cluster is healthy and ready for workloads.
These are the same checks you’d perform after installation, after upgrades, during troubleshooting, or as part of regular health monitoring.
Learning Objectives
By the end of this module, you will be able to:
-
Verify cluster health using ClusterOperators
-
Understand upgrade channels and available updates
-
Verify node configuration with MachineConfigPools
-
Validate networking and storage functionality
-
Check etcd health for control plane stability
About This Cluster
This workshop cluster is pre-provisioned using Installer-Provisioned Infrastructure (IPI) — OpenShift fully automated the provisioning of compute, network, storage, and DNS. The result is a production-ready 3-node compact cluster (combined control-plane and worker roles).
OpenShift supports multiple installation methods depending on your environment:
-
IPI — Full-stack automation for cloud (AWS, Azure, GCP) and on-premise (vSphere, bare metal)
-
UPI — You provision infrastructure, installer deploys OpenShift
-
Agent-based / Assisted Installer — Bootable ISO or web-based GUI for bare metal
-
Managed offerings — ROSA, ARO, OpenShift Dedicated (Red Hat and cloud providers handle operations)
For details on installation planning and configuration, see the OpenShift Installation Documentation.
| Two things that cannot be changed after installation: the pod network CIDR and the service network CIDR. Plan these carefully — if they overlap with your corporate network, you’ll need to rebuild the cluster. |
Now let’s verify this cluster is healthy and ready for workloads.
Step 1: Verify Cluster Operators (Primary Health Check)
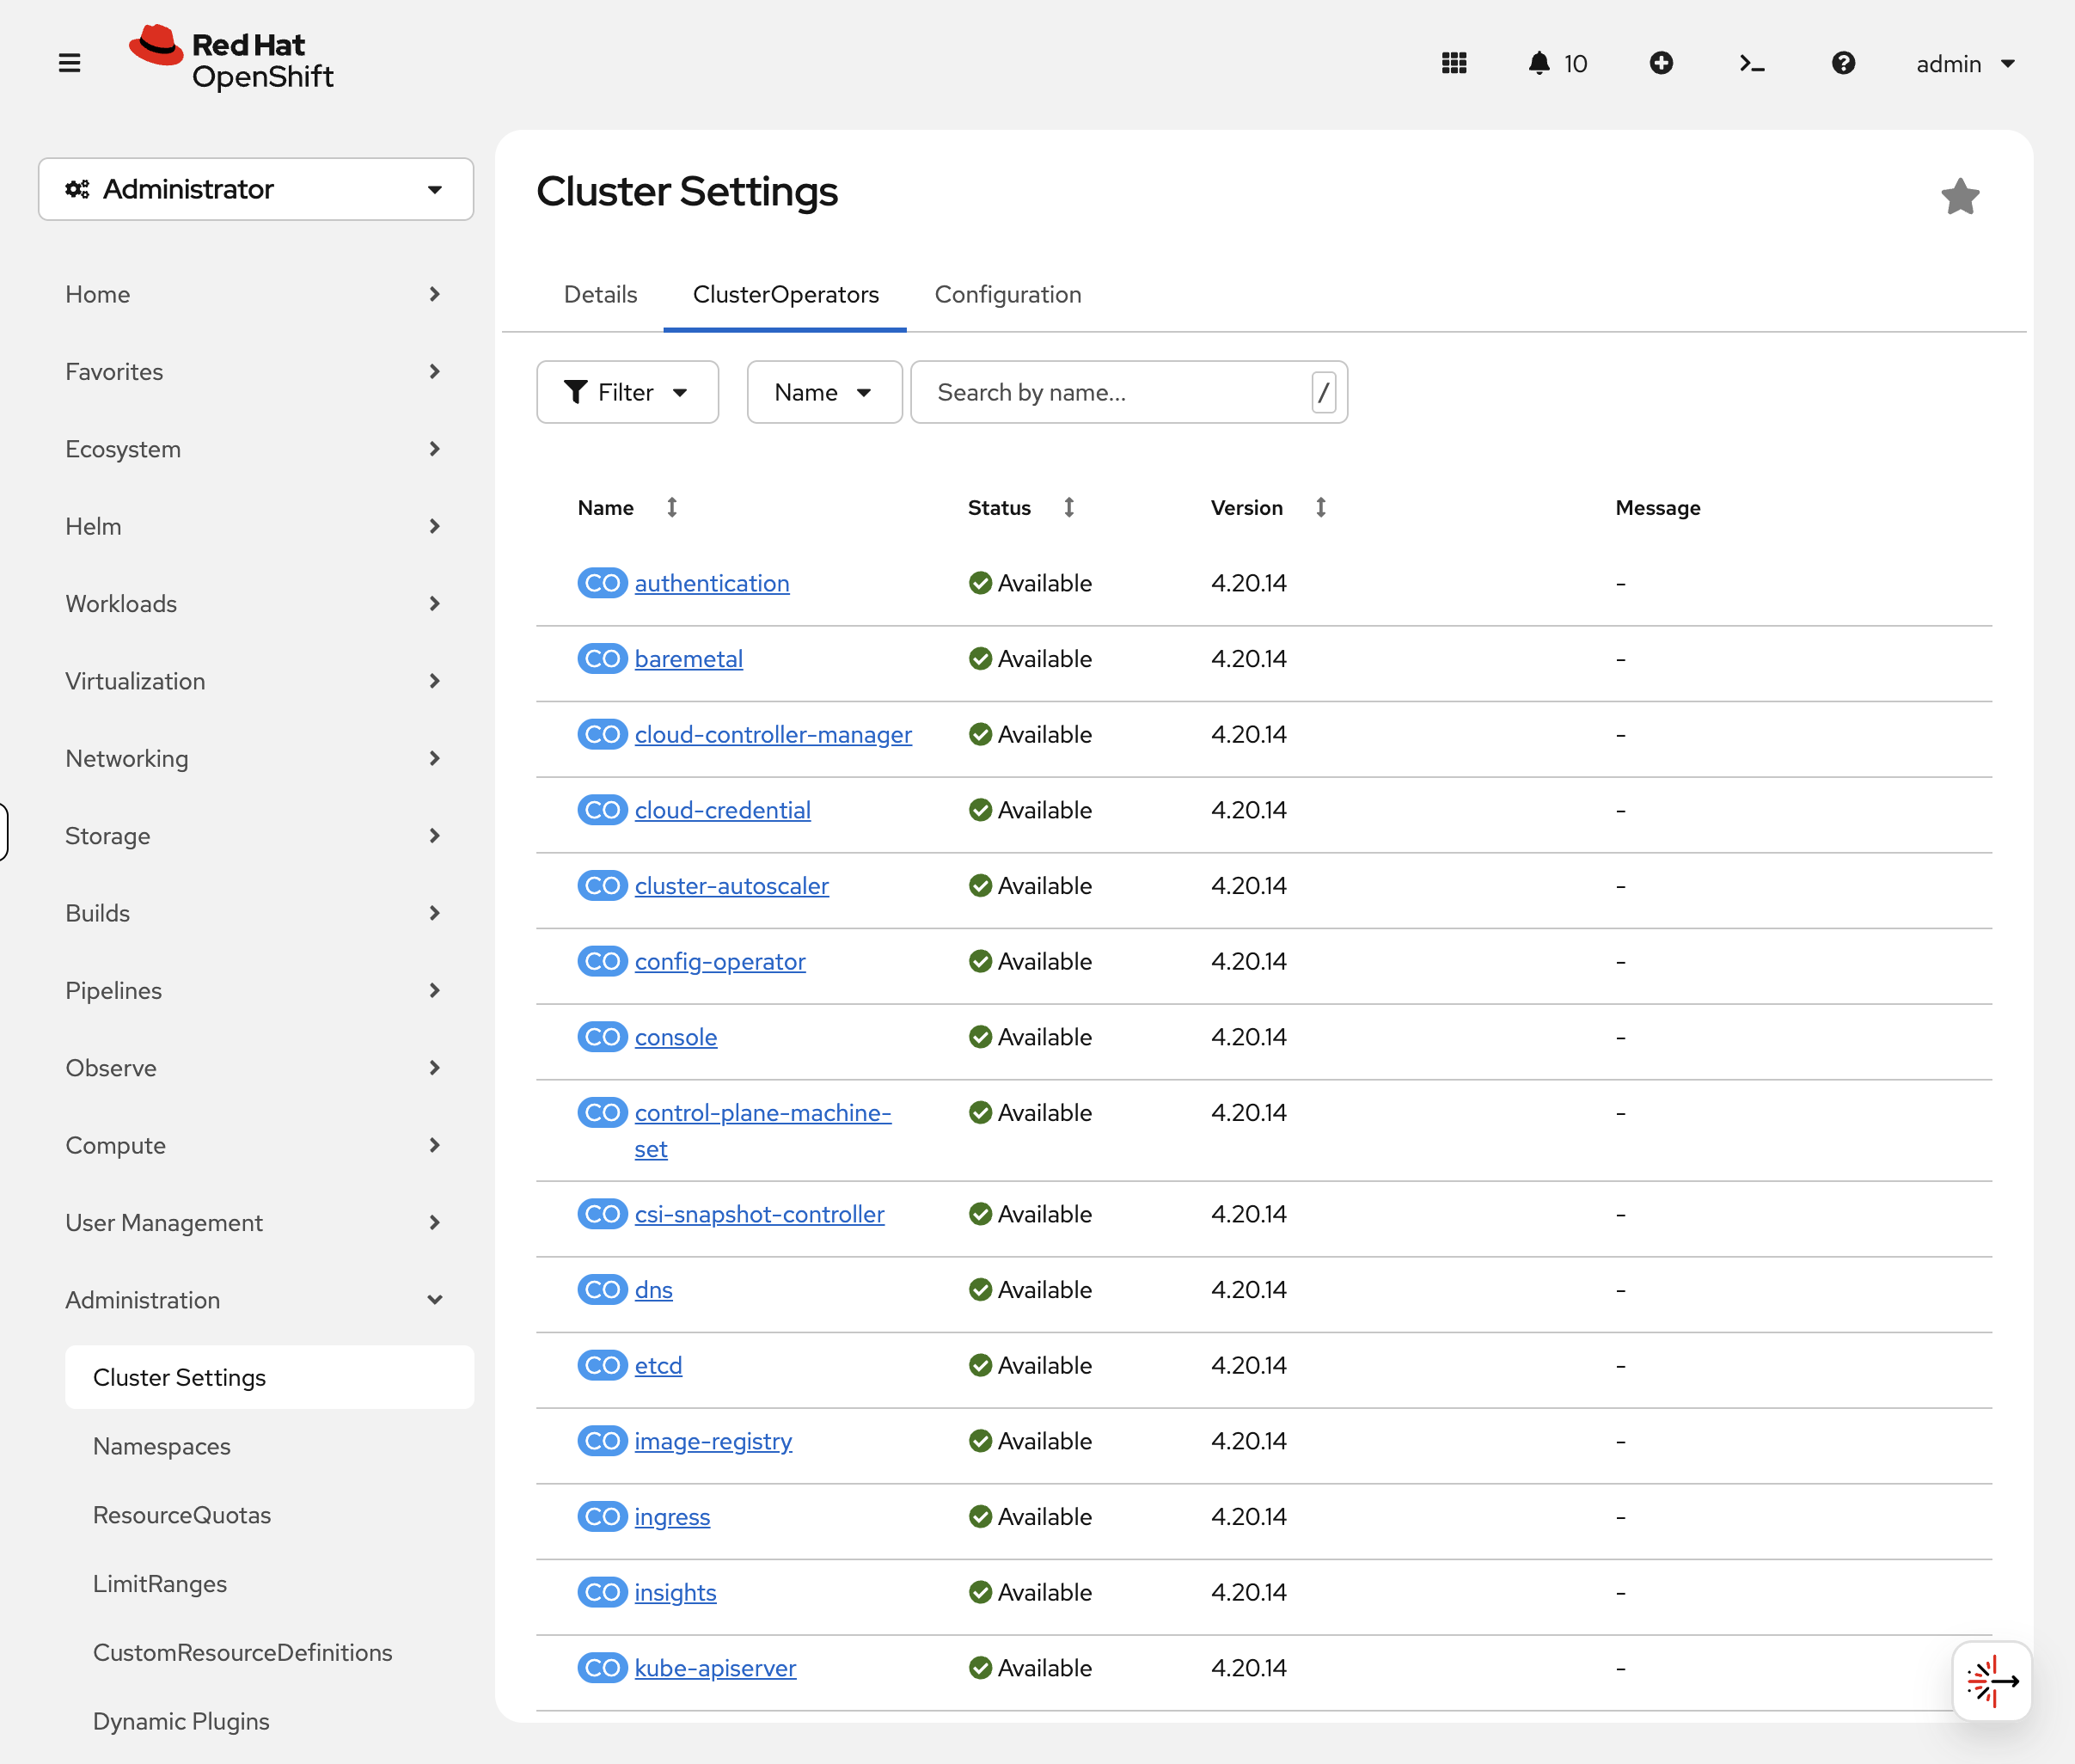
ClusterOperators are the single source of truth for cluster health. Each operator manages a specific cluster component and reports its status.
View all cluster operators:
oc get clusteroperatorsYou’ll see ~34 operators. Example output:
NAME                         VERSION   AVAILABLE   PROGRESSING   DEGRADED   SINCE
authentication               4.20.x    True        False         False      3h
cloud-credential             4.20.x    True        False         False      4h
console                      4.20.x    True        False         False      3h
dns                          4.20.x    True        False         False      4h
etcd                         4.20.x    True        False         False      4h
ingress                      4.20.x    True        False         False      3h
kube-apiserver               4.20.x    True        False         False      4h
kube-controller-manager      4.20.x    True        False         False      4h
kube-scheduler               4.20.x    True        False         False      4h
machine-api                  4.20.x    True        False         False      4h
machine-config               4.20.x    True        False         False      4h
monitoring                   4.20.x    True        False         False      3h
network                      4.20.x    True        False         False      4h
openshift-apiserver          4.20.x    True        False         False      3h
storage                      4.20.x    True        False         False      4h
What to check:
-
AVAILABLE = True - Component is functional
-
PROGRESSING = False - No upgrade/rollout in progress
-
DEGRADED = False - Component is healthy
Healthy cluster: All operators show True False False
If an operator is degraded, investigate further:
oc describe clusteroperator <operator-name>Check the Conditions section for details about why it’s degraded.
Common issues:
-
machine-configprogressing - Nodes are being updated (normal during updates) -
monitoringdegraded - Storage or resource issues -
authenticationdegraded - OAuth or LDAP configuration issues
Console view: Switch to the OCP Console tab and navigate to Administration → Cluster Settings → ClusterOperators. The console shows each operator with green/red status icons — degraded operators are immediately visible without scanning a 34-row table. This is faster than CLI for a quick health check.
Step 2: Check Cluster Version and Update Status
View the current cluster version:
oc get clusterversionYour output will look similar to:
NAME      VERSION   AVAILABLE   PROGRESSING   SINCE   STATUS
version   4.20.x    True        False         3h      Cluster version is 4.20.x
Check which update channel you’re subscribed to:
oc get clusterversion version -o jsonpath='{.spec.channel}'Common channels:
-
stable-4.20 - Production-ready releases (recommended)
-
fast-4.20 - Early access to stable releases
-
eus-4.20 - Extended Update Support (14-month lifecycle)
-
candidate-4.20 - Pre-release testing
View available updates:
oc adm upgradeIf updates are available, you’ll see a list of recommended versions. If your cluster is already up to date, you’ll see:
No updates available. You may still upgrade to a specific release image
with --to-image or wait for new updates to be available.
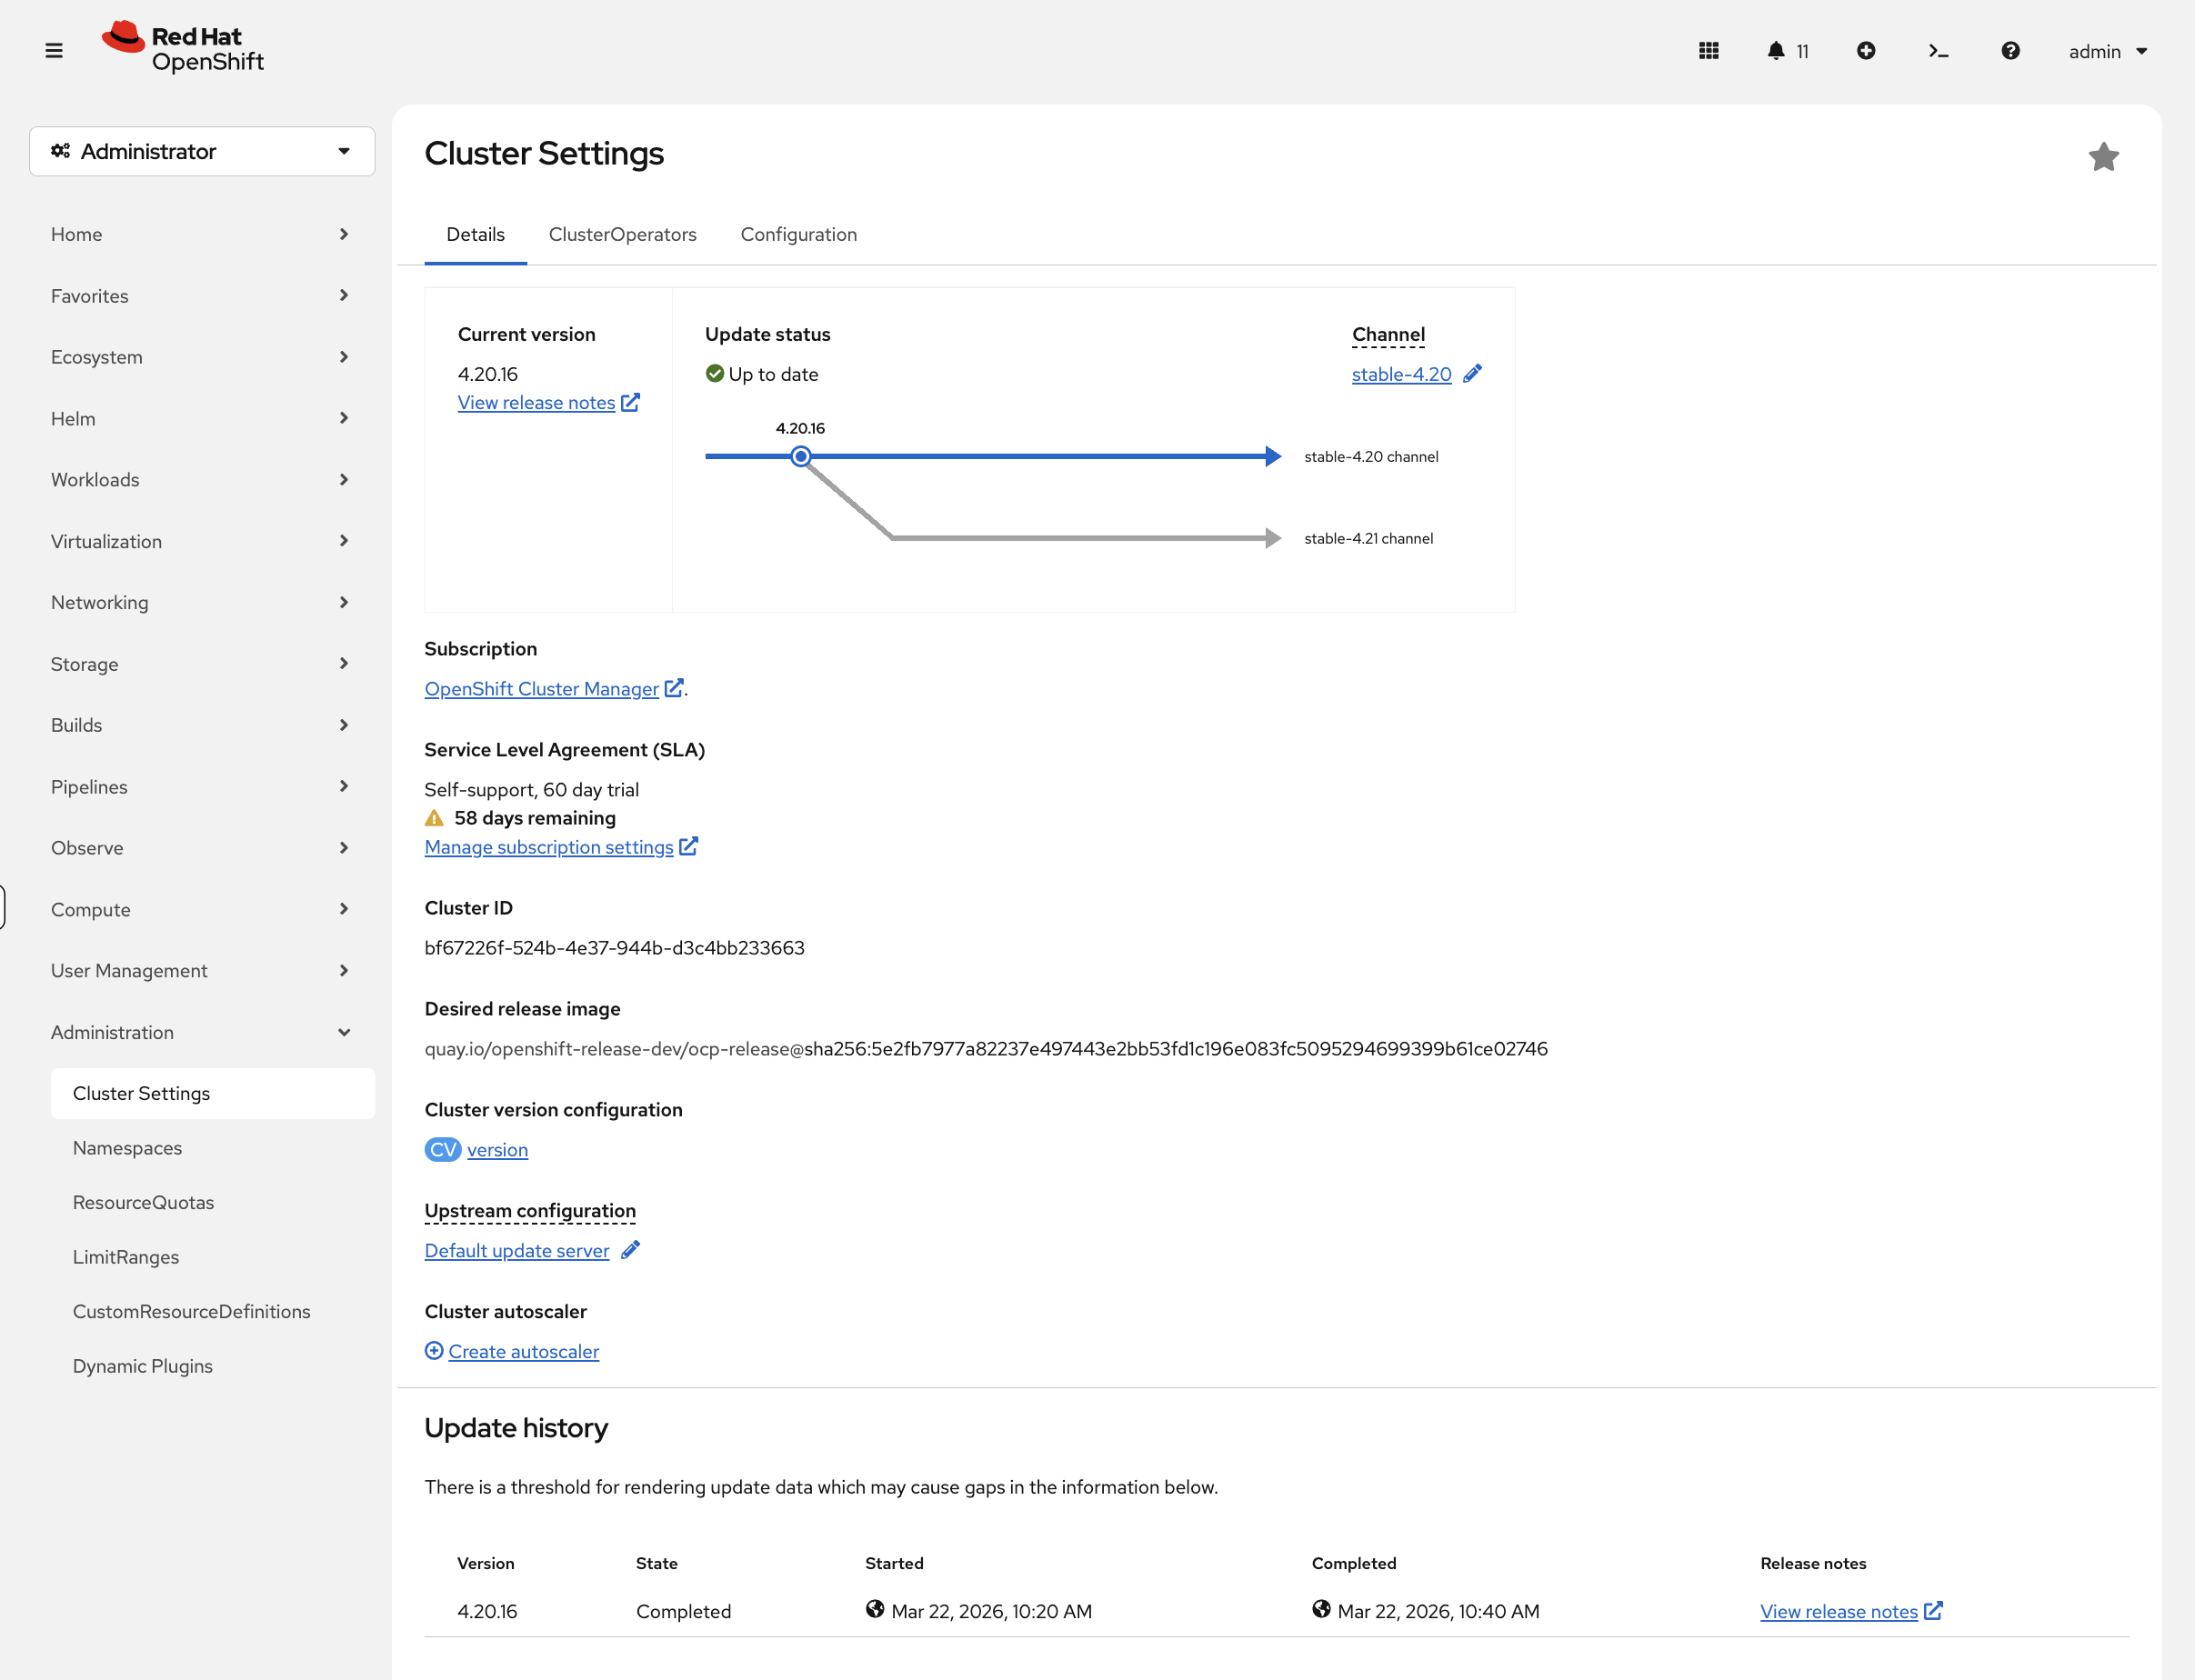
In the OCP Console, navigate to Administration → Cluster Settings. The Details tab shows the current version, update channel, and — when updates are available — a visual upgrade path graph showing the route from your current version to available targets. This is far more informative than the CLI text output for planning upgrades.
Key takeaway: Operators manage cluster updates. When updates are available, you can upgrade with a single command: oc adm upgrade --to=<version>
Step 3: Verify Node Configuration
Beyond the node health you explored in the Platform Overview, there’s an important verification step specific to post-installation: MachineConfigPools.
Check node configuration status:
oc get machineconfigpoolYour output will look similar to:
NAME     CONFIG             UPDATED   UPDATING   DEGRADED   MACHINECOUNT   READYMACHINECOUNT
master   rendered-master-…  True      False      False      3              3
worker   rendered-worker-…  True      False      False      0              0
| On this compact cluster the worker pool shows 0 machines because all nodes serve both control-plane and worker roles under the master pool. |
What this shows:
-
UPDATED = True - All nodes have latest configuration
-
UPDATING = True - Nodes are being rolled out with new config (normal during changes)
-
DEGRADED = True - Configuration failed on some nodes (investigate)
MachineConfigPools manage node-level configuration (kernel arguments, systemd units, etc.) and coordinate rolling updates.
You can also verify this in the console. Navigate to Compute → MachineConfigPools:
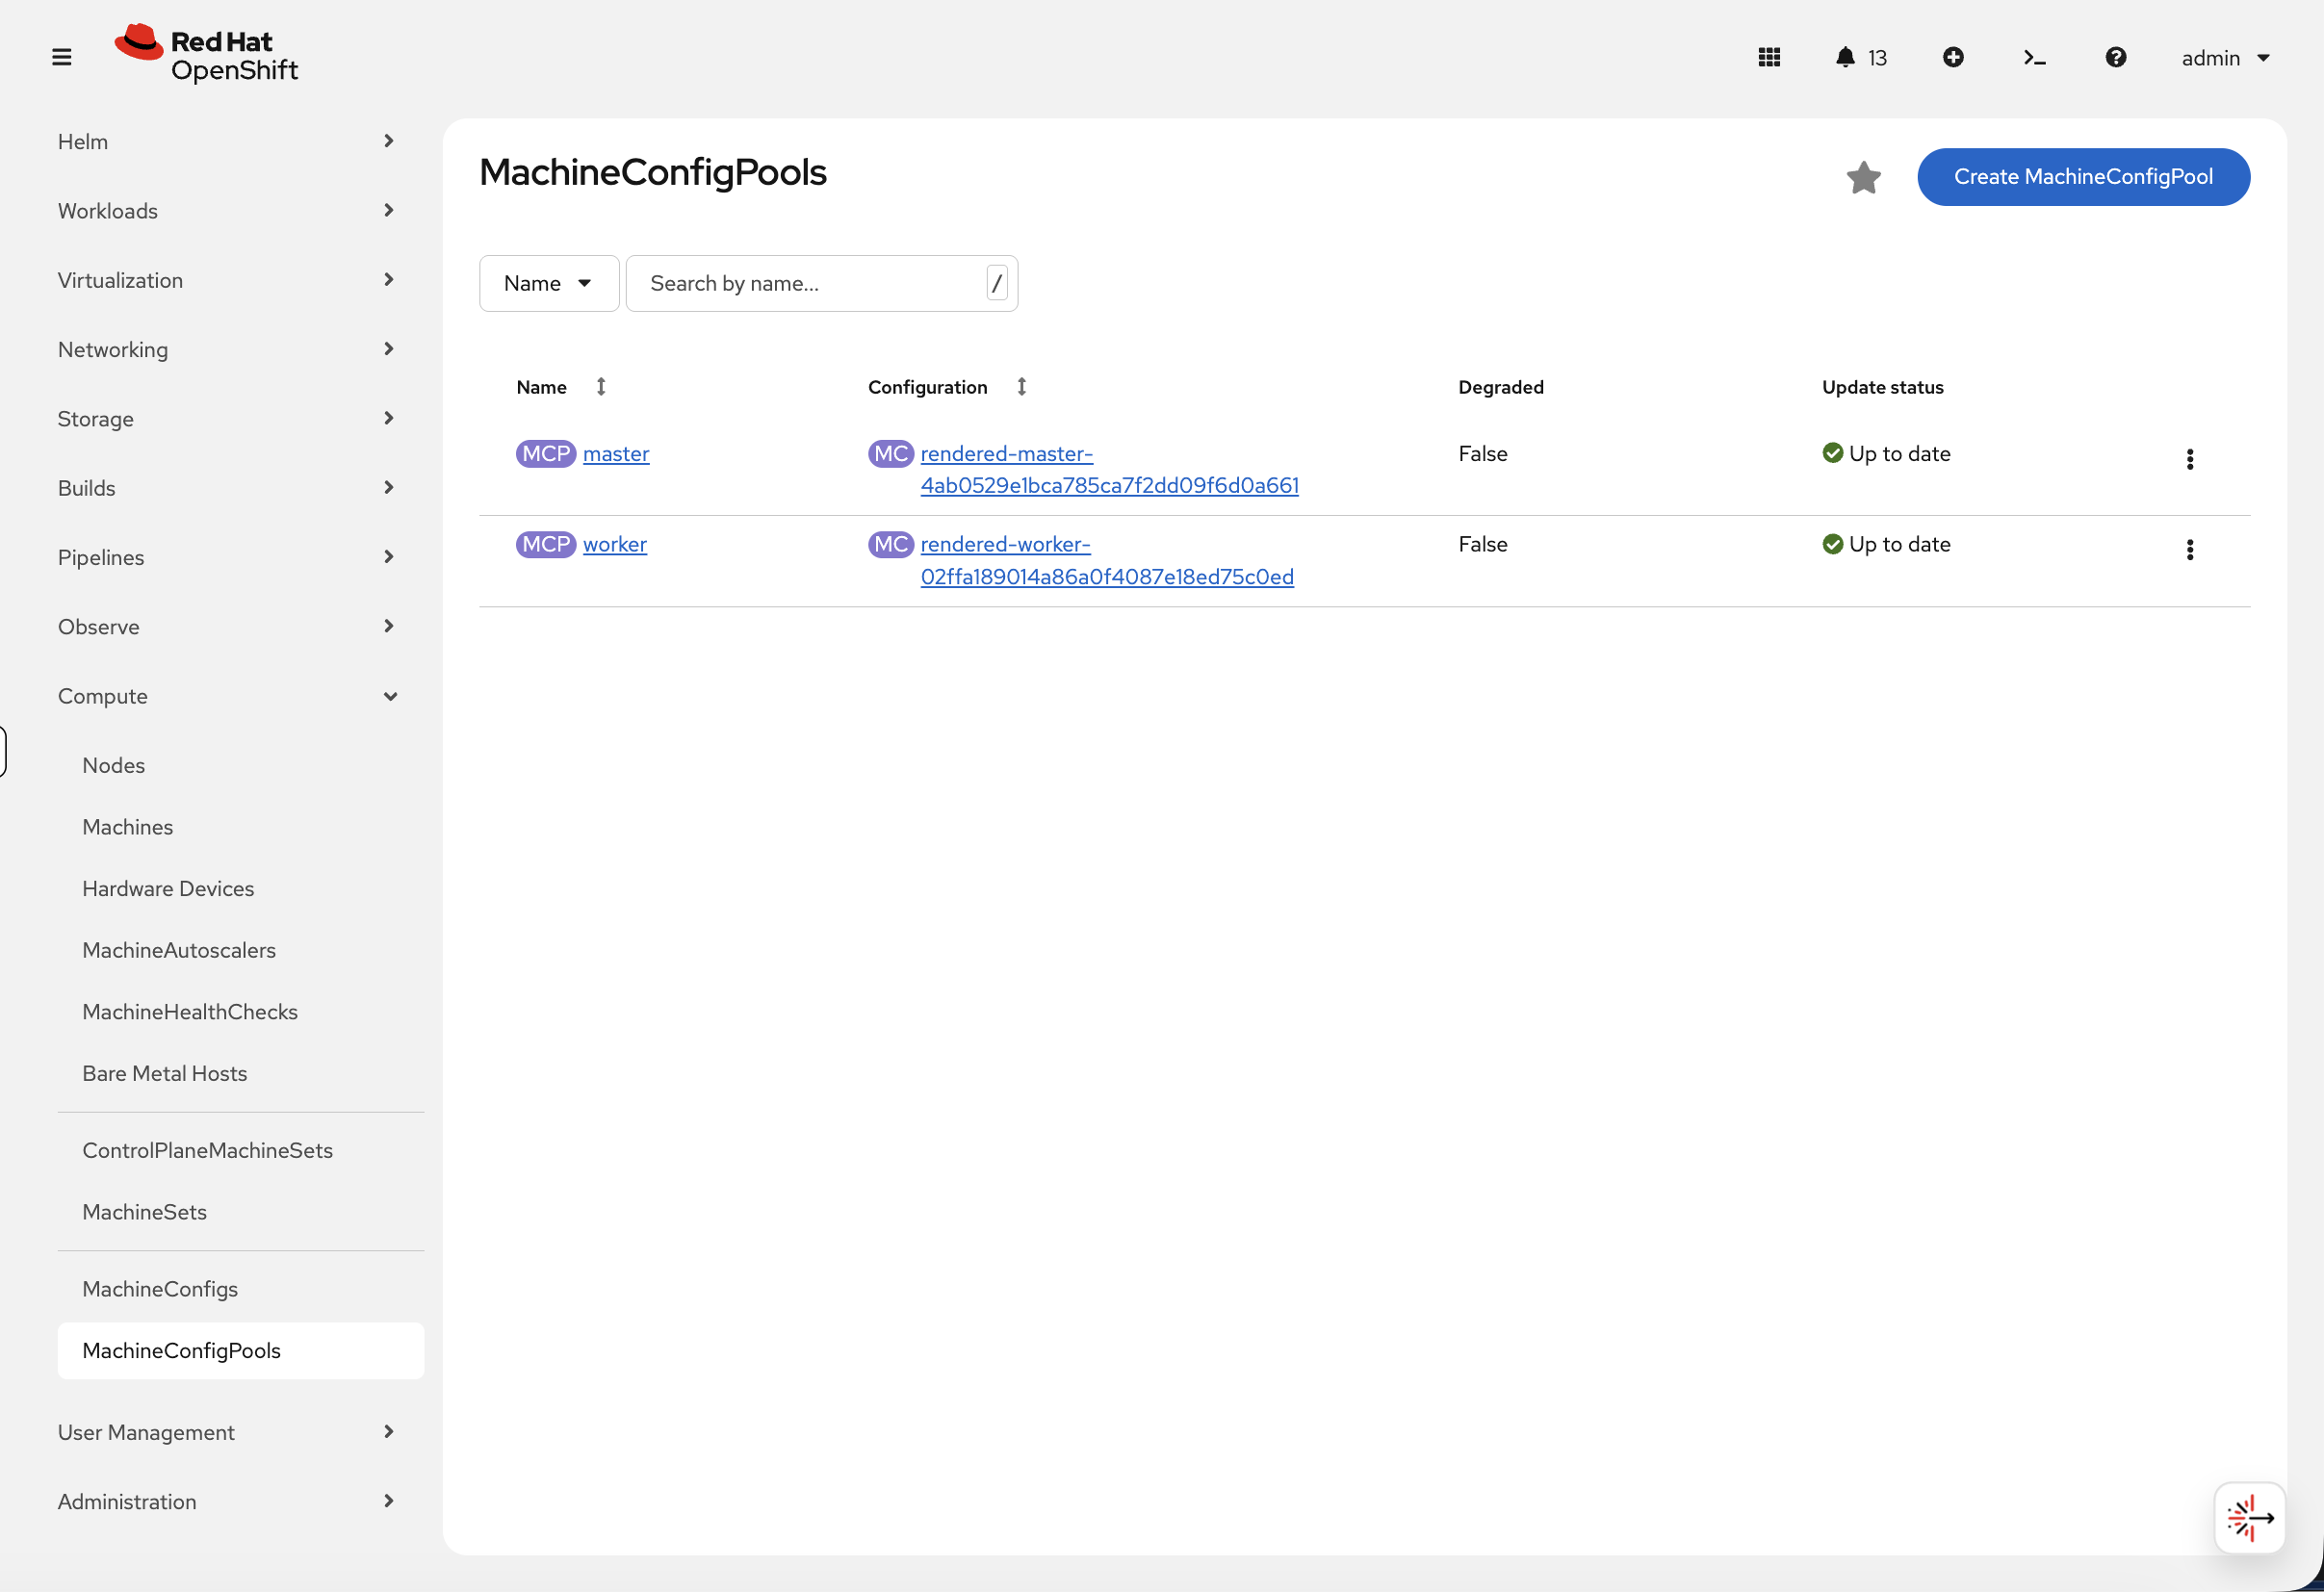
The green Up to date indicators and Degraded: False confirm that all node configurations have been applied successfully. During an upgrade or configuration change, you would see the Update status change to Updating — this view is a quick way to monitor node rollout progress without polling the CLI.
Step 4: Test Networking (Hands-on)
Verify networking works by creating a test application and route:
oc new-project install-test 2>/dev/null || oc project install-test
oc new-app --name=test-app --image=registry.access.redhat.com/ubi9/httpd-24 -n install-test
Wait for the pod to be running, then create a route:
oc rollout status deployment/test-app -n install-test --timeout=60s
oc create route edge test-app --service=test-app -n install-test
Test the route:
curl -sk https://$(oc get route test-app -n install-test -o jsonpath='{.spec.host}') | head -3What this proves: DNS works, router is functional, TLS certificates auto-generated, and the application is reachable from outside the cluster.
You can also verify the route in the console at Networking > Routes (project: install-test) — click the route URL to test it directly from the browser.
|
Clean up:
oc delete project install-testStep 5: Test Storage Provisioning
Verify dynamic storage works by creating a PVC and a pod that mounts it:
oc new-project storage-test 2>/dev/null || oc project storage-test
cat <<EOF | oc apply -n storage-test -f -
apiVersion: v1
kind: PersistentVolumeClaim
metadata:
  name: test-pvc
spec:
  accessModes:
  - ReadWriteOnce
  resources:
    requests:
      storage: 1Gi
---
apiVersion: v1
kind: Pod
metadata:
  name: test-storage
spec:
  containers:
  - name: test
    image: registry.access.redhat.com/ubi9/ubi-minimal
    command: ["/bin/sh", "-c", "echo 'Storage works!' > /data/test.txt && cat /data/test.txt && sleep 30"]
    volumeMounts:
    - name: data
      mountPath: /data
    securityContext:
      allowPrivilegeEscalation: false
      runAsNonRoot: true
      capabilities:
        drop: ["ALL"]
      seccompProfile:
        type: RuntimeDefault
  volumes:
  - name: data
    persistentVolumeClaim:
      claimName: test-pvc
  restartPolicy: Never
EOF
Wait a moment, then check that the PVC is Bound and the pod is Running:
sleep 15 && oc get pvc test-pvc -n storage-test && oc get pod test-storage -n storage-testThe PVC should show Bound and the pod should be Running or Completed.
In the console, navigate to Storage > PersistentVolumeClaims (project: storage-test) to see the PVC status and its bound PersistentVolume.
|
Check the pod wrote to the volume successfully:
oc logs test-storage -n storage-testYou should see Storage works! — confirming that dynamic provisioning, volume attachment, and read/write all function correctly.
Clean up:
oc delete project storage-testStep 6: Verify etcd Health
You’ve already seen the Prometheus monitoring stack in the Platform Overview. For post-installation verification, the most important dashboard is etcd — the distributed key-value store that holds all cluster state.
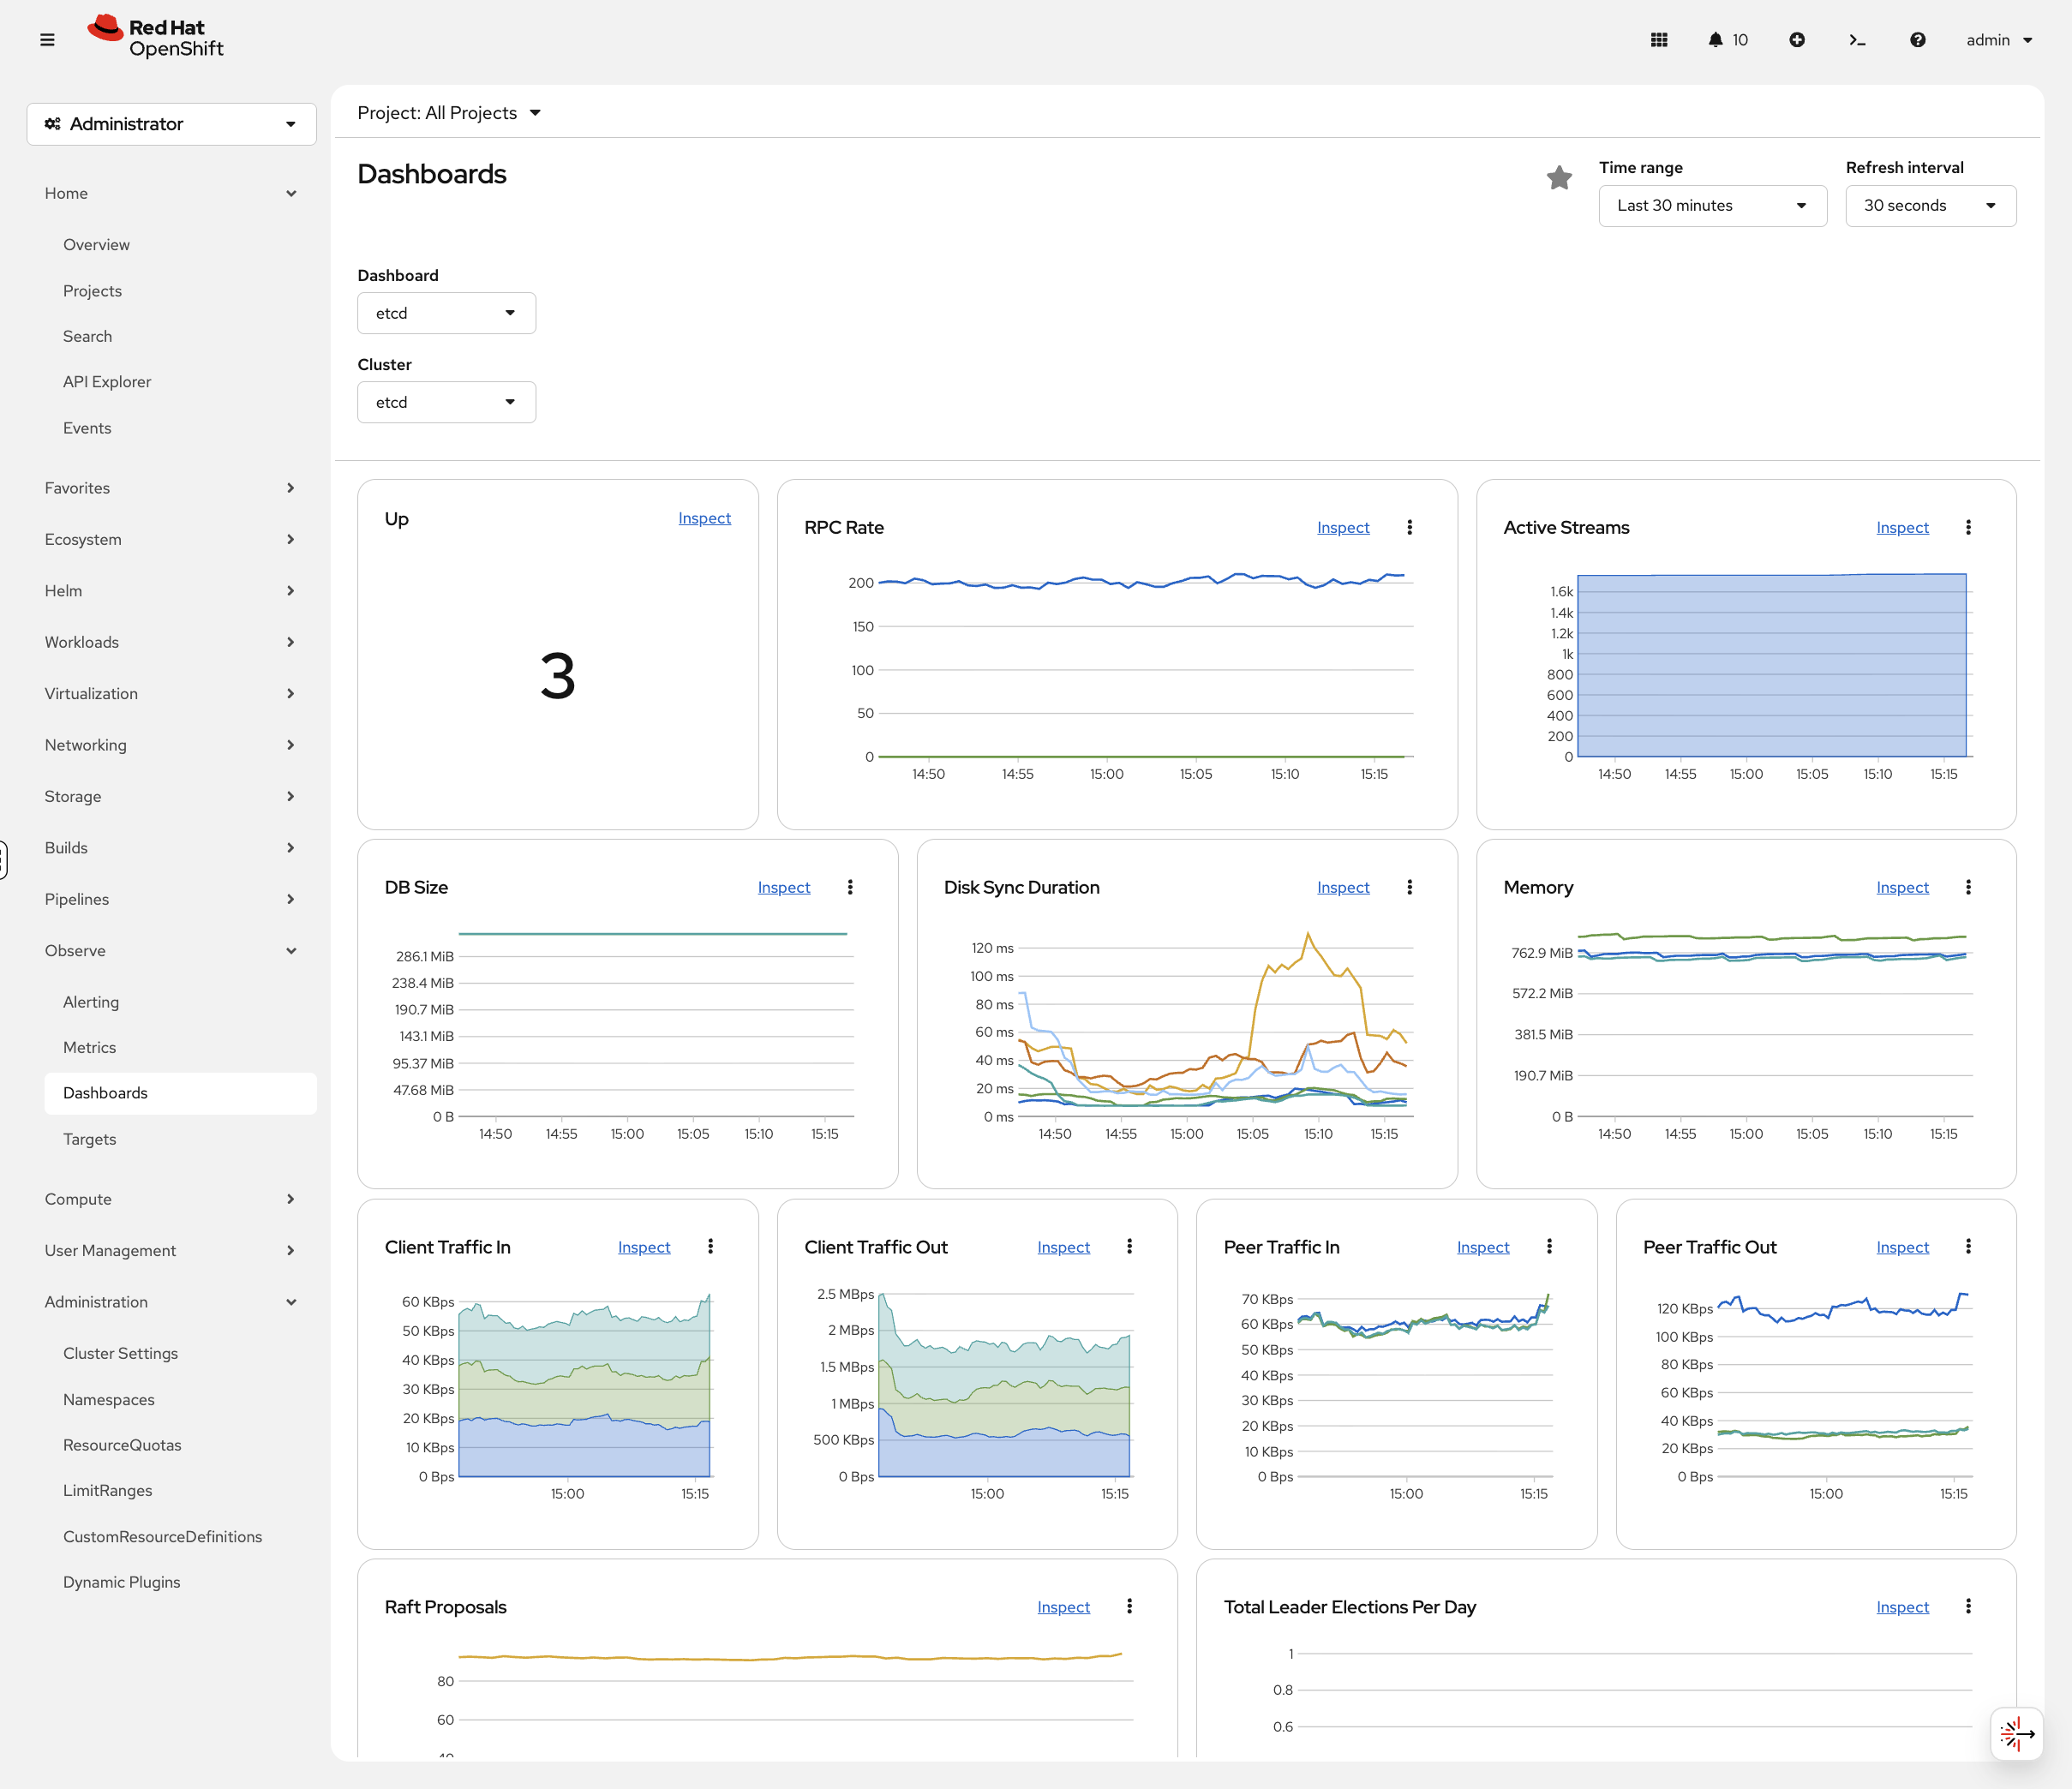
In the OCP Console, navigate to Observe → Dashboards and select the etcd dashboard. Key panels to check:
-
Total Leader Elections Per Day — should be 0 or very low. Frequent leader elections indicate disk I/O problems or network latency between control plane nodes — the kind of issue that causes cascading API failures at 2am.
-
Disk Sync Duration — if fsync times are consistently above 10ms, etcd performance will suffer and
occommands will start timing out.
Also verify the monitoring operator is healthy:
oc get clusteroperator monitoringSummary
Installation: You learned how OpenShift can be installed using full stack automation (IPI, Agent-based, Assisted Installer) or pre-existing infrastructure (UPI) across public cloud, private cloud, bare metal, and specialized platforms.
Verification: You verified this cluster is production-ready by checking ClusterOperators, update channels, MachineConfigPools, networking, storage provisioning, and etcd health.
Key takeaway: oc get clusteroperators is your primary health check. All operators showing True False False means a healthy cluster ready for workloads.
Additional Resources
-
Installing OpenShift: Installation Documentation
-
Verifying Cluster Status: Troubleshooting Guide
-
ClusterOperators Reference: Operator Reference