Accelerate Agentic AI Innovation
From answering questions to taking action.
The data section shows RAG grounding Lenora with documents. But Lenora doesn’t just look up facts - she calls tools, runs calculations, and coordinates across systems.
When we say tools, we mean functions (APIs, database queries, calculators) that the agent can invoke at runtime. The model decides when and with what arguments to call a tool, but it is the agent framework that actually executes it and returns the result back to the model for further reasoning.
This section covers the agentic layer: tool access via MCP, continuous evaluation with EvalHub, and utilizing a predictive AI model to power the risk assessments.
Estimated time: 25 minutes
Learning Objectives
By the end of this section, you will be able to:
-
Observe Lenora making tool calls as the Underwriter persona
-
Trace a multi-step agent decision end-to-end in MLflow
-
Understand MCP and explore the MCP catalog
-
Use the Risk MCP server to get precise mortgage risk calculations
-
Compare Playground responses with and without MCP tools
-
Evaluate agent quality with EvalHub, RAGAS, and MLflow llm-as-judge
Exercise 1: Experience Fed Aura Capital as a Underwriter
You have already seen Lenora as a Borrower and a CEO. Now step into the Underwriter persona, the role closest to where the AI’s precision matters most. Loan officers assess risk, review applications, and make recommendations. When they ask Lenora a question, they need exact numbers, not estimates.
-
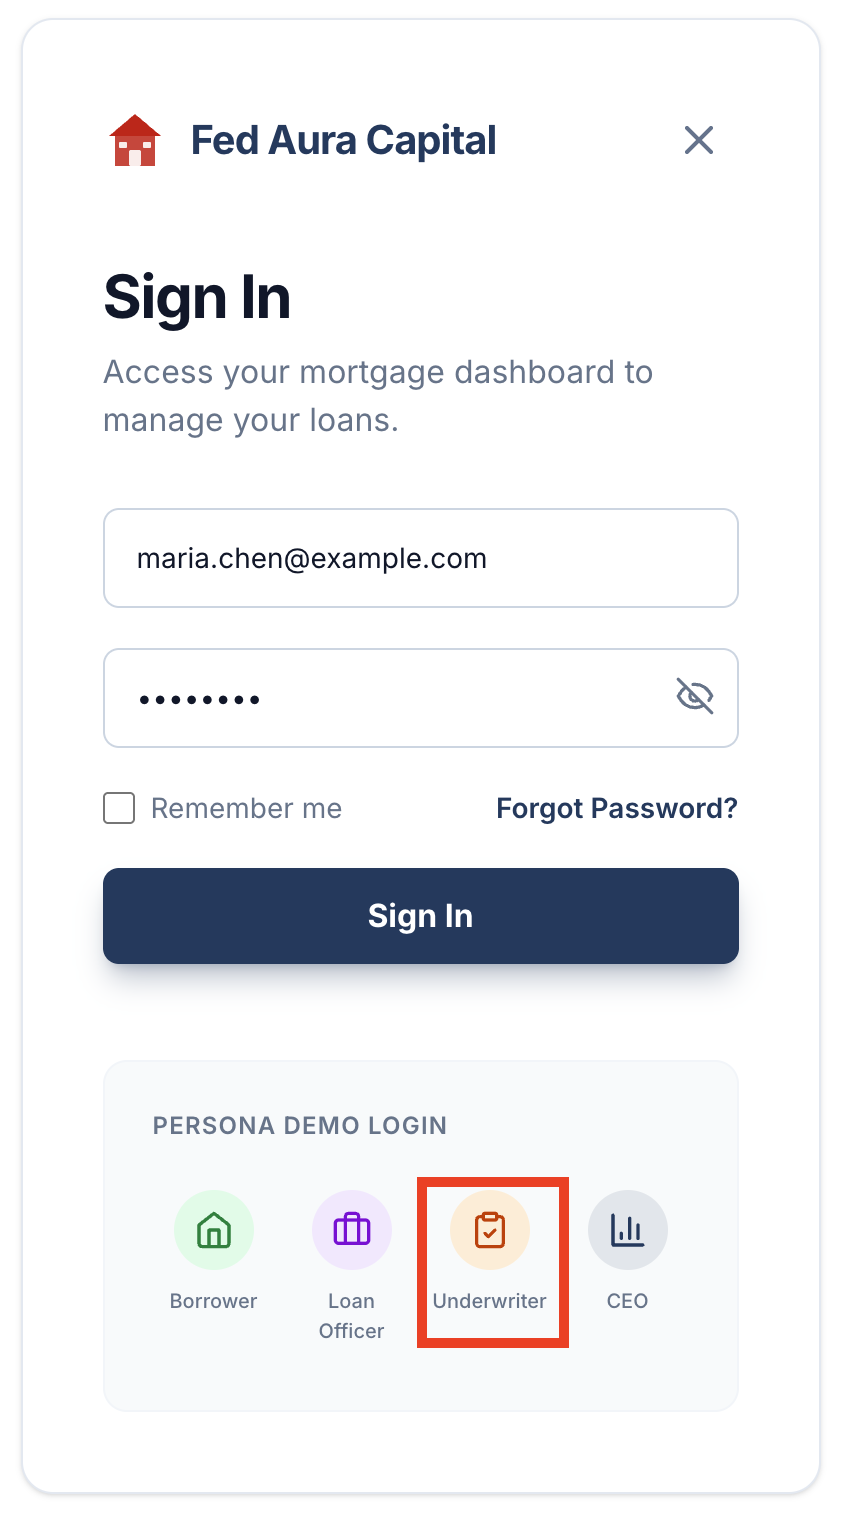
Navigate to the Mortgage AI App tab. Click Sign In and select the Underwriter persona:
-
In the Underwriting Queue, click Lisa Washington’s application and note its number. Here it is
#44, but it can change per environment, so use the number you see: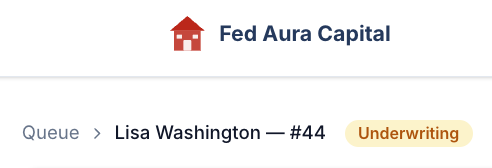
-
In the chat panel, ask:
Run a risk assessment on application #44 -
Observe the response. Lenora returns a structured risk assessment with precise numbers (DTI ratio, LTV, credit score, approval recommendation), basically things a loan officer needs to know:
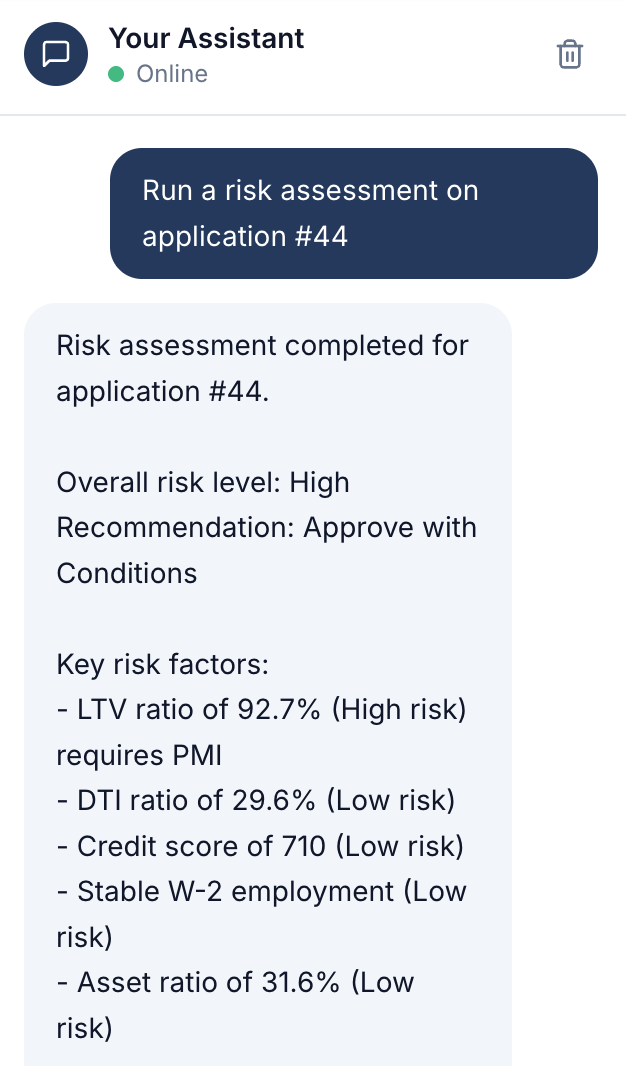
This is not a chatbot estimating from general knowledge. Lenora called real tools, retrieved the application data, ran the calculations, and passed the results through a predictive model. The numbers are grounded in the actual application record.
-
Ask a follow-up to see that she retains context across turns:
What conditions apply?Lenora responds with the conditions from the assessment she just ran. The context from the previous tool call is carried forward in the conversation, she didn’t re-call the tools.
| The exact values in the response may differ depending on the cluster state, but the structure will be consistent: tool-backed precision, conditions listed by category, and a clear recommendation. |
Exercise 2: Trace the Decision in MLflow
The response looked right. But what tools ran in order to get that response? What inputs did the tools receive? What outputs did they produce? How long did each step take? MLflow captured all of it automatically!
-
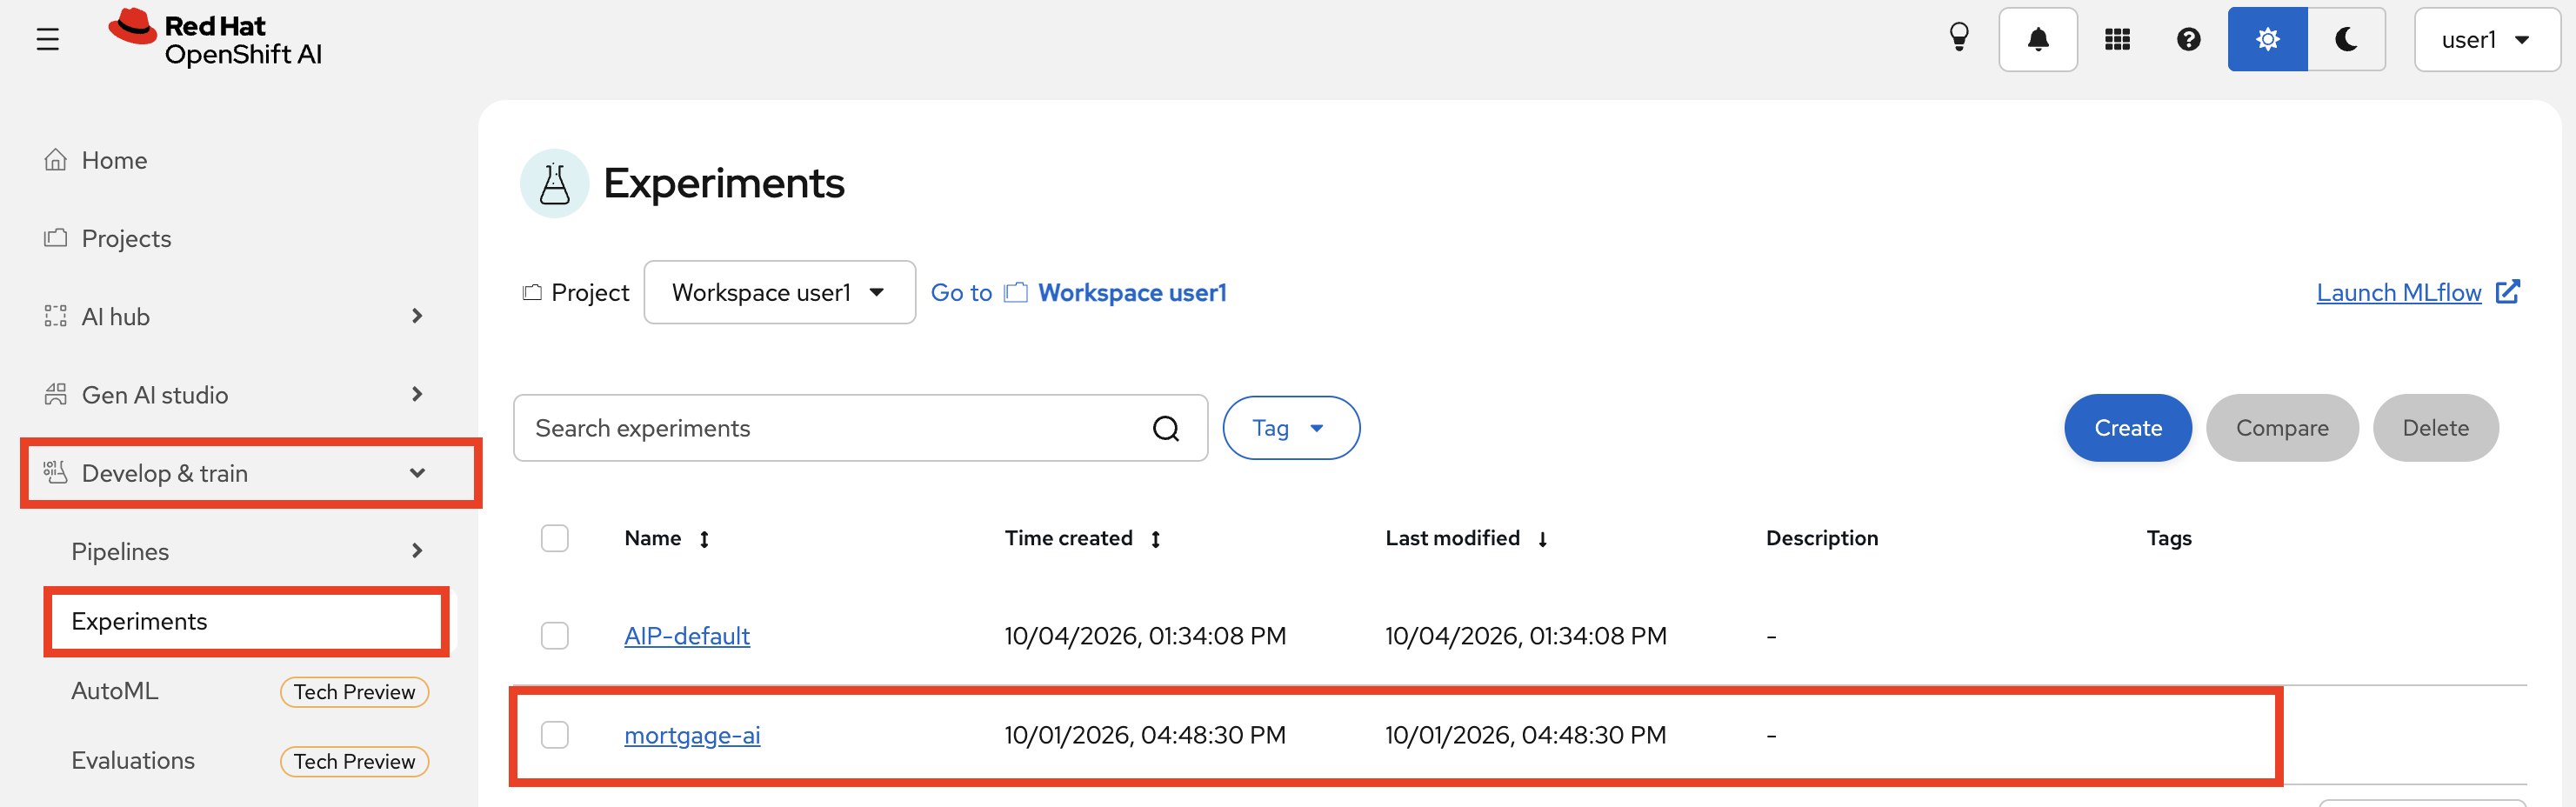
Navigate to OpenShift AI Dashboard > Develop & Train > Experiments:
-
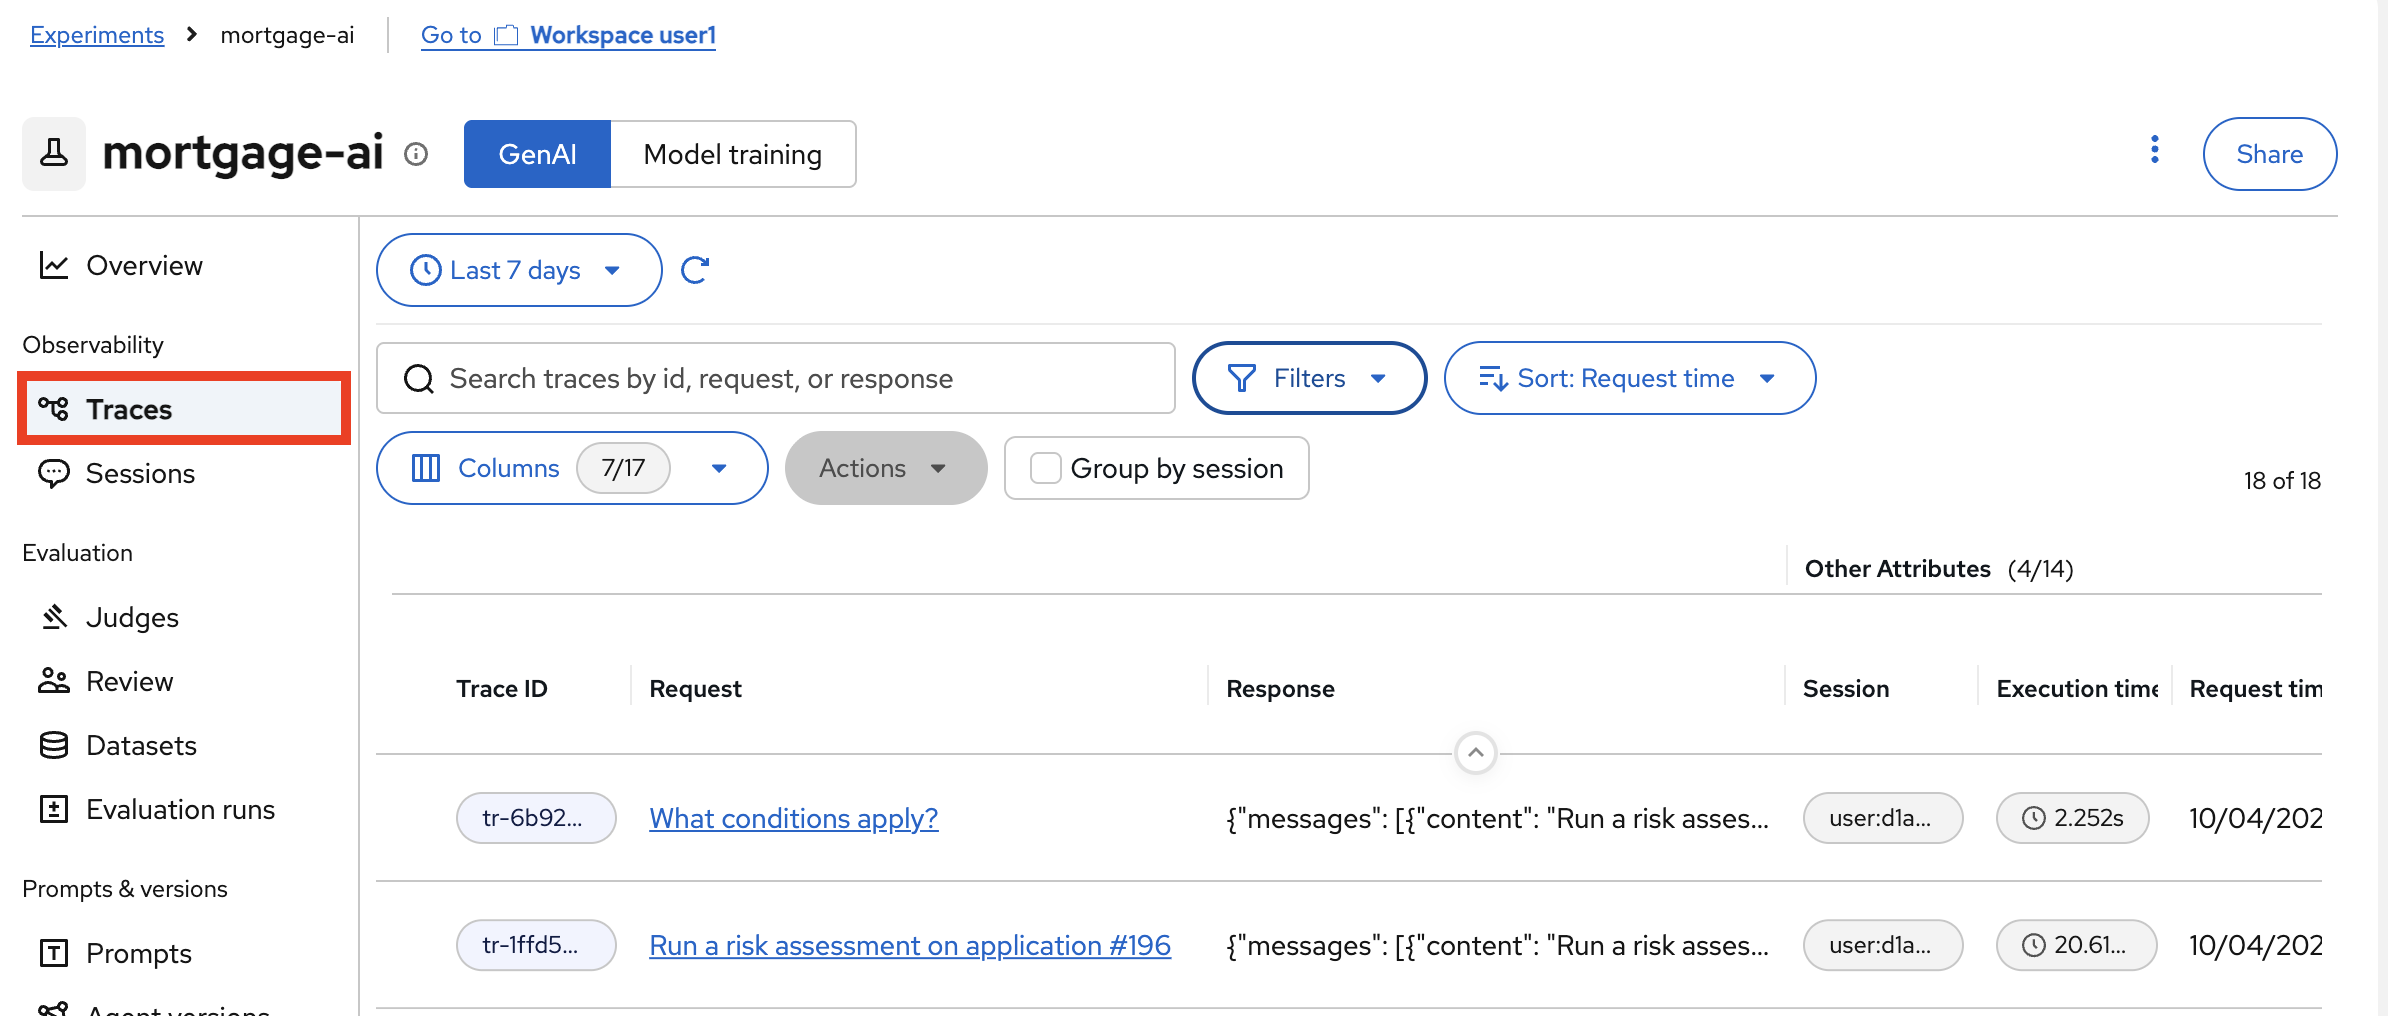
Select the experiment called mortgage-ai for the mortgage-ai project and click on Traces. You should see a list of recent agent interactions, including the risk assessment you just triggered.
-
Locate the trace from running the risk assessment and click it. It should be the one with the title
Run a risk assessment on application #44(application number may change 😅) -
Switch to Details & Timeline tab. Walk through the trace tree from top to bottom. You will see the full decision path:
input_shield
  └── agent
        └── ChatOpenAI
              └── tool_auth
                    └── tools
                          ├── uw_application_detail
                          ├── calculate_dti
                          ├── assess_asset_sufficiency
                          ├── uw_predict_loan_approval
                          └── generate_risk_recommendation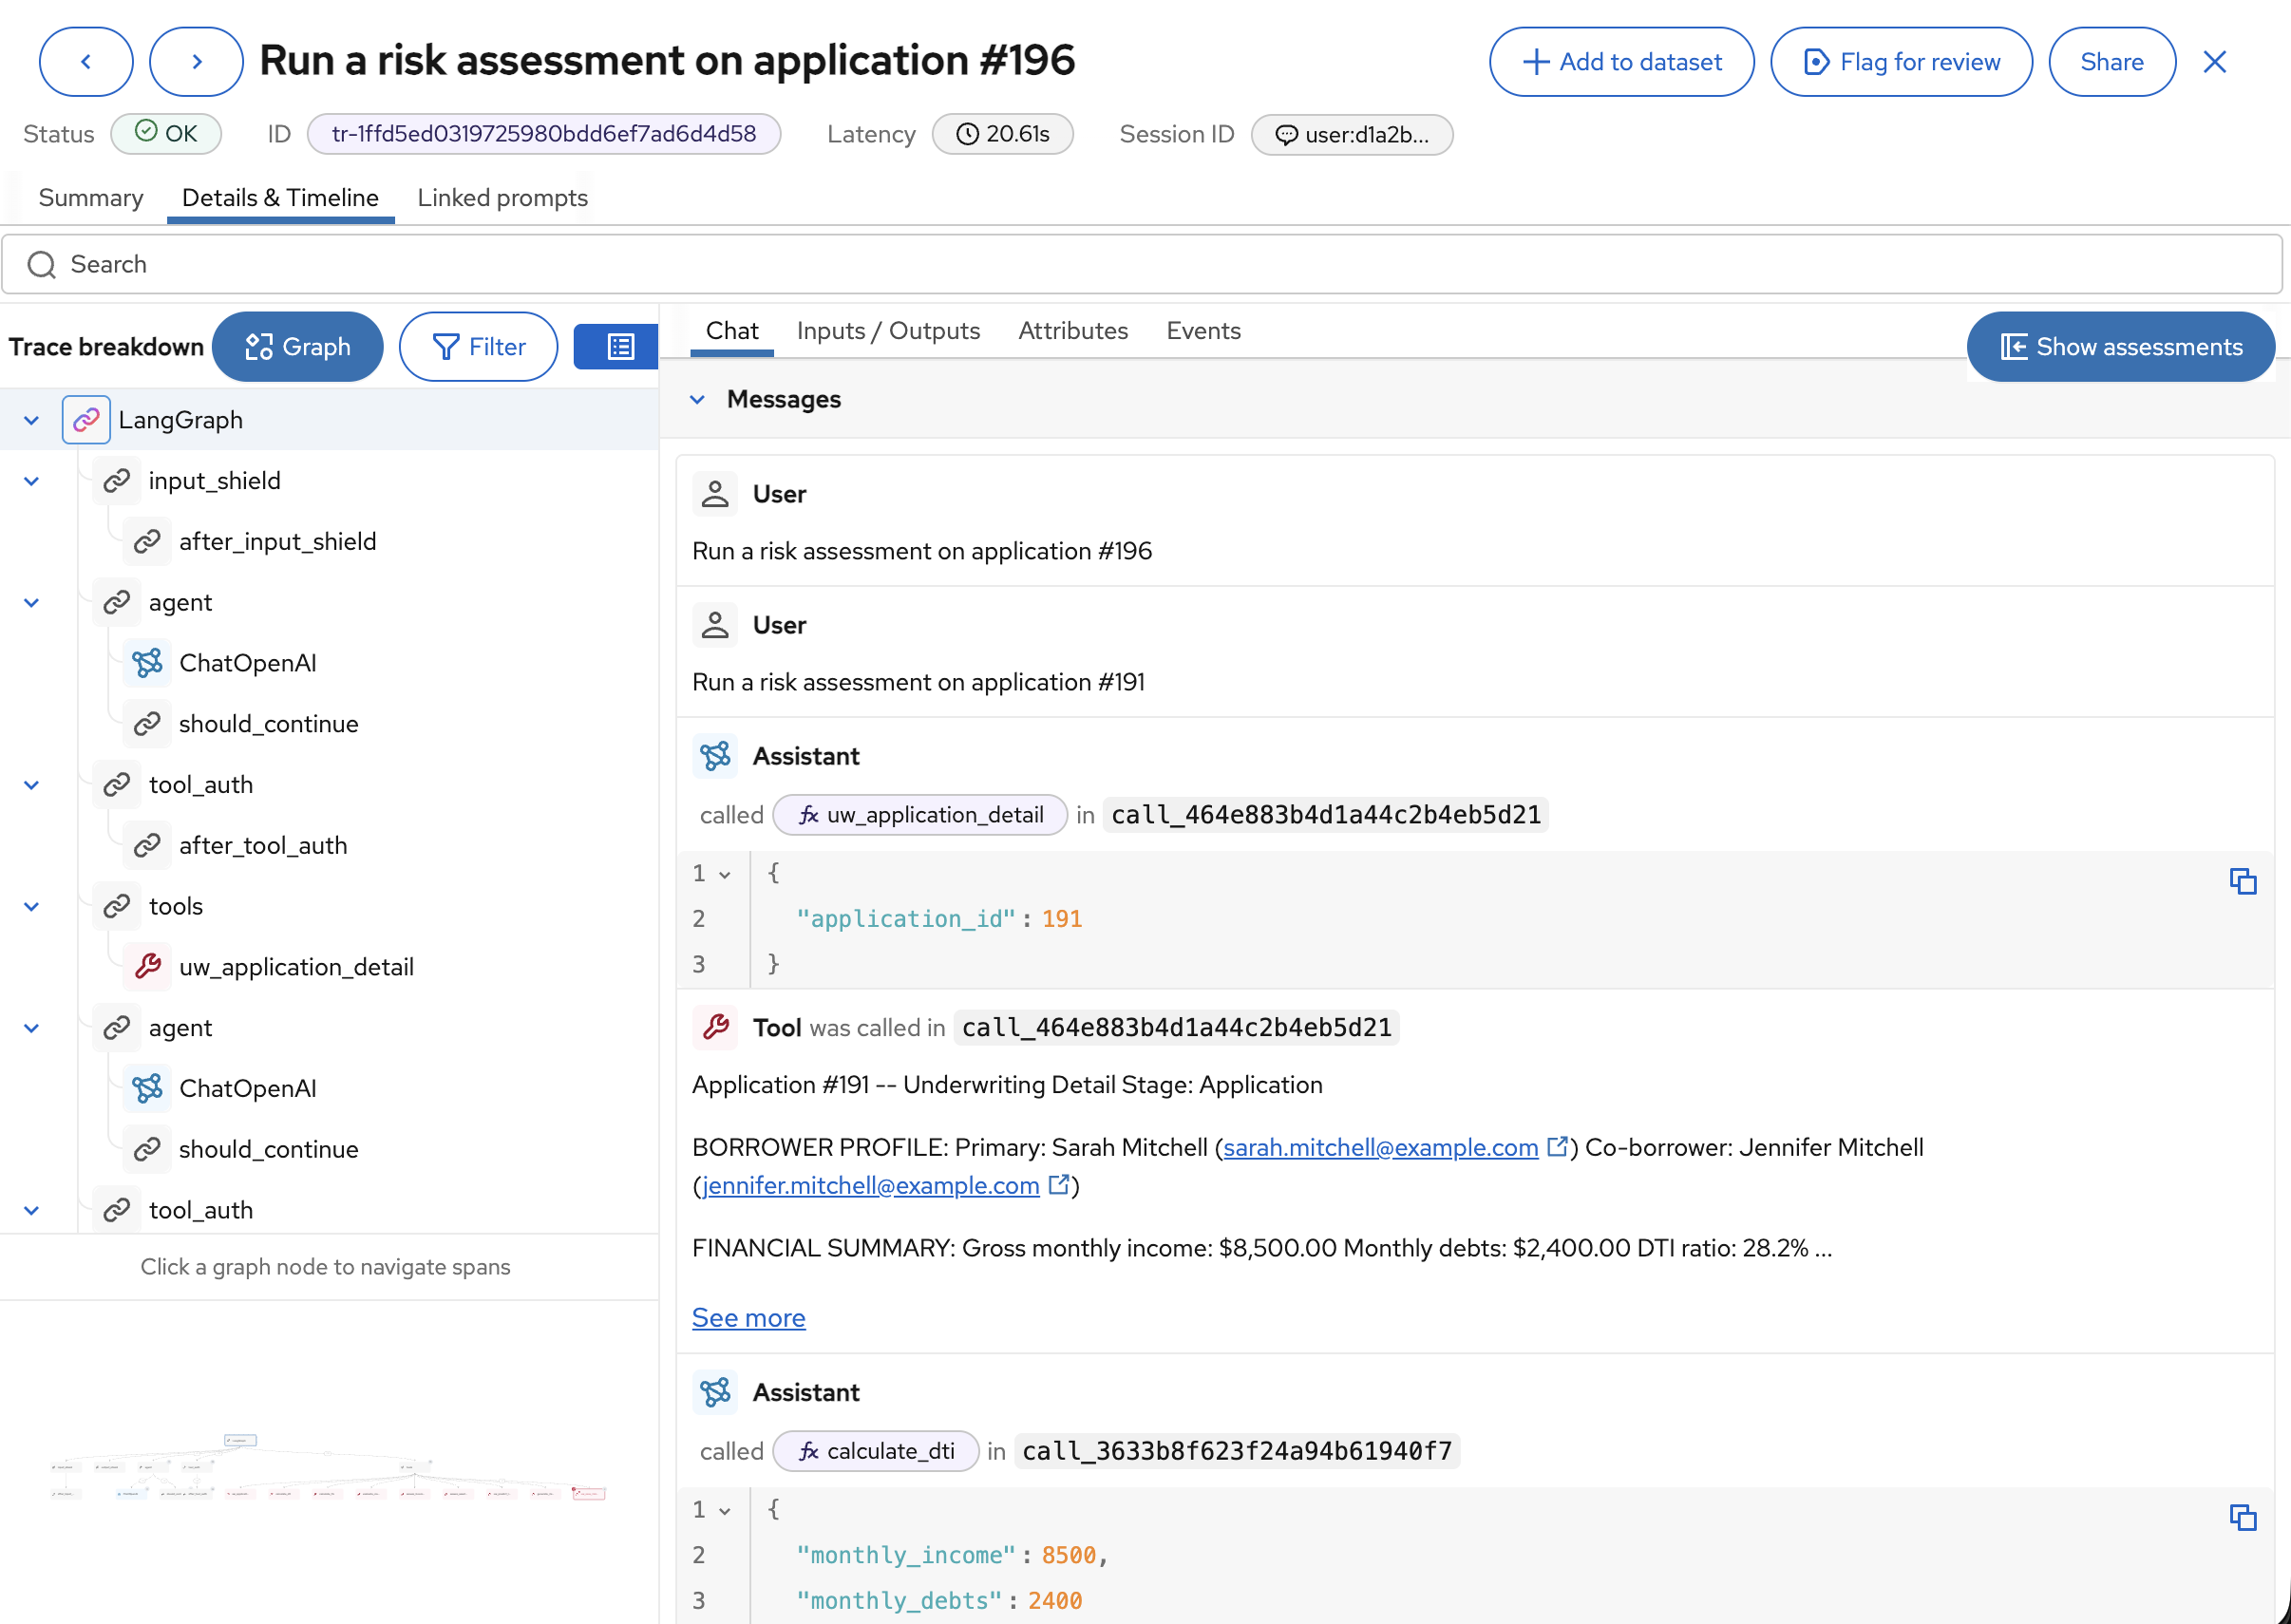
-
Scroll down and click on the
calculate_dtistep. Inspect the inputs (the gross monthly income and total monthly debts from the application) and the output:dti_value=29.6. Every argument passed to the tool and every value it returned is recorded: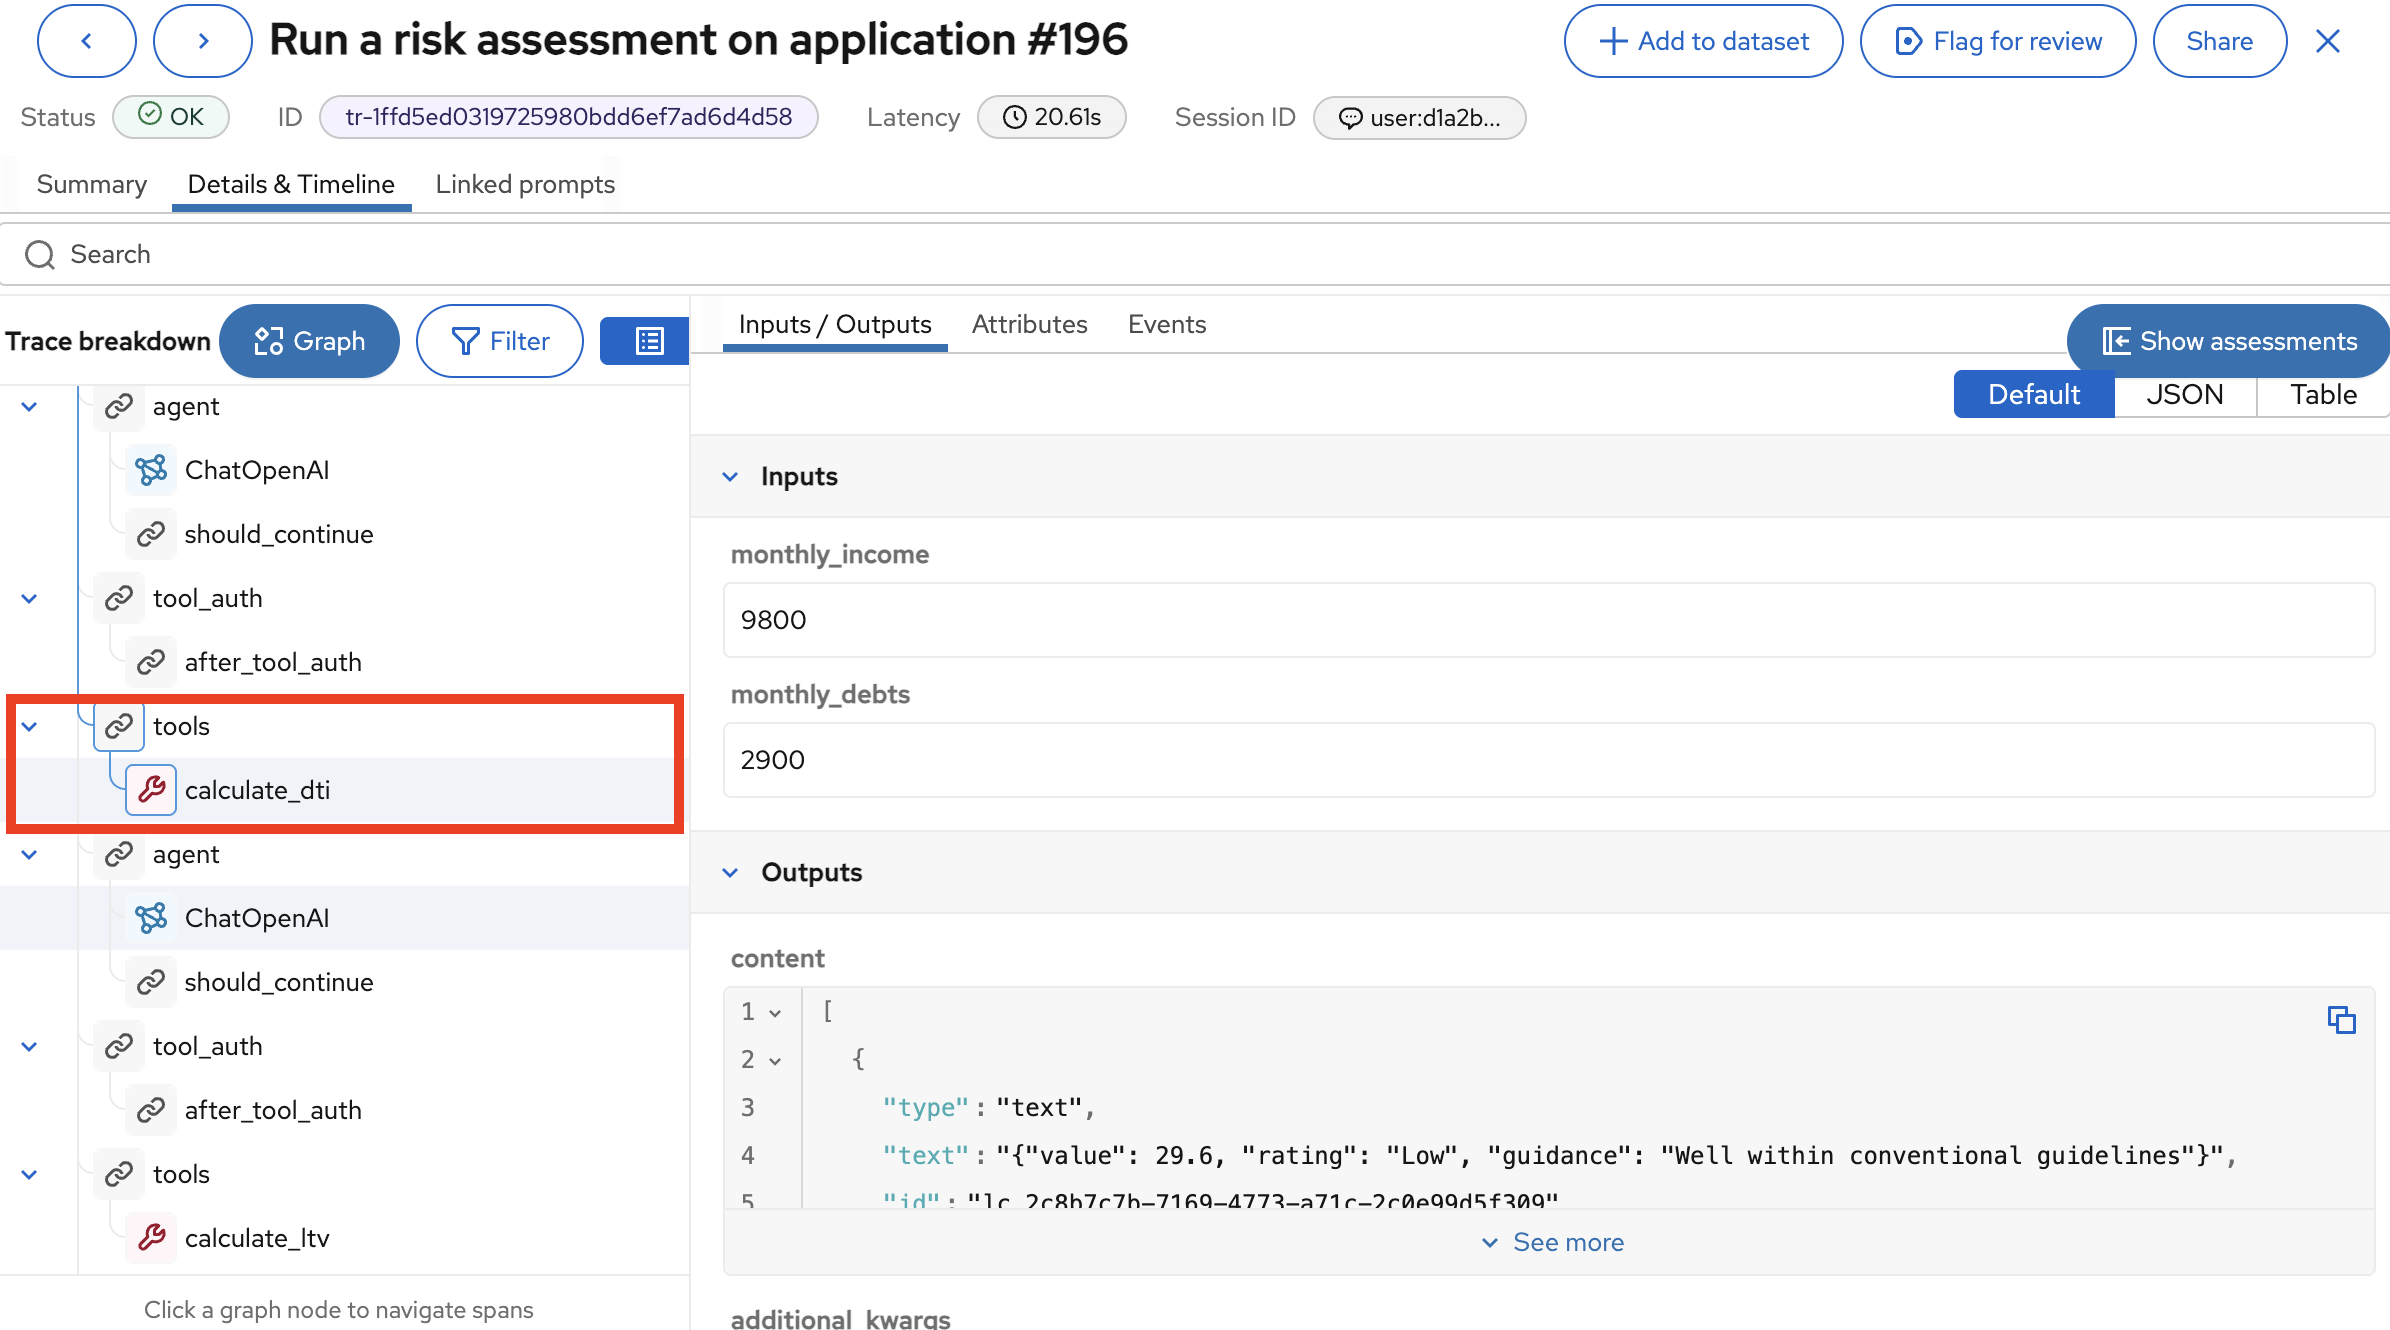
-
Click the "Show execution timeline" icon at the top to look at the total latency for the trace. Each step is timestamped, so you can see exactly where time was spent: the LLM call, the tool auth check, each individual tool execution.
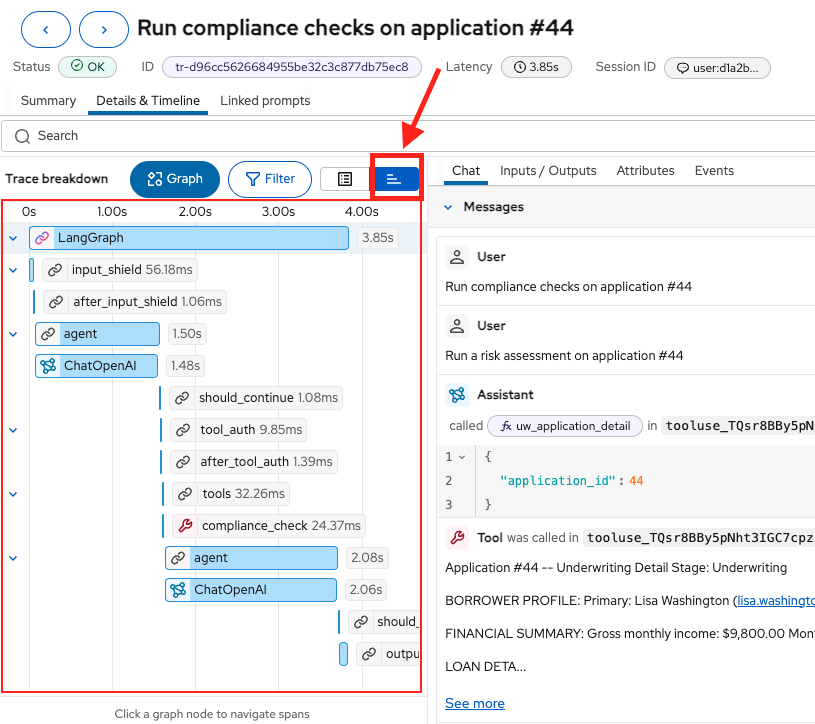
If the view is too small, you can always switch to Tabs view by clicking the < icon in the right corner to view the trace in full screen.
| When something goes wrong in production (a wrong recommendation, a slow response, a failed tool call), this is where you go first. The trace is a full audit log of every decision the agent made. |
What’s Next?
You observed Lenora calling tools and traced every step of her decision. But where do those tools come from? How does the platform know which tools Lenora is allowed to call? And how can you give any model access to the same tools through the Playground?
That is what MCP (the Model Context Protocol) provides. In the next exercise, you will explore the MCP catalog and use the Risk Server directly. And since tool responses flow back into the model’s context like any other text (invisible to the user, but fully visible to the model), you may already be wondering what happens if that content isn’t trustworthy. Something we will come back to.