Debugging in Dev Mode
Debugging is an art of finding errors (bugs) and eradicating (debug) them from a piece of code written in any programming language. Quarkus apps are no different in this regard and you can use the raw Java command line debugger (jdb) or, if your IDE supports it, graphical debugging. Most IDEs have integration with Java debuggers, including Eclipse Che, so let’s exercise it.
Write some bad code
Let’s introduce a subtle off-by-one bug in our application and use the debugger to debug it.
Open up the GreetingResource.java class again, and add another RESTful endpoint that returns the last letter in a name:
    @GET
    @Path("/lastletter/{name}")
    @Produces(MediaType.TEXT_PLAIN)
    public String lastLetter(@PathParam("name") String name) {
        int len = name.length();
        String lastLetter = name.substring(len);
        log.info("Got last letter: " + lastLetter);
        return lastLetter;
    }
A bug has been reported where the last letter is not working. To reproduce the bug, try to retrieve the last letter of the string Foo by running this in a Terminal (your app should still be running - if it is not, use Start Live Coding again):
curl http://localhost:8080/hello/lastletter/FooDue to the bug, nothing is returned from curl. It should have given us back an o. You’ll also see Got last letter: in the console output of the Quarkus app terminal.
You can probably spot the bug right away but let’s see how you could find this with the debugger, and more importantly fix it and re-test very quickly.
Attach debugger
In Live Coding mode, Quarkus apps also listen for debugger connections on port 5005. Your app should still be running.
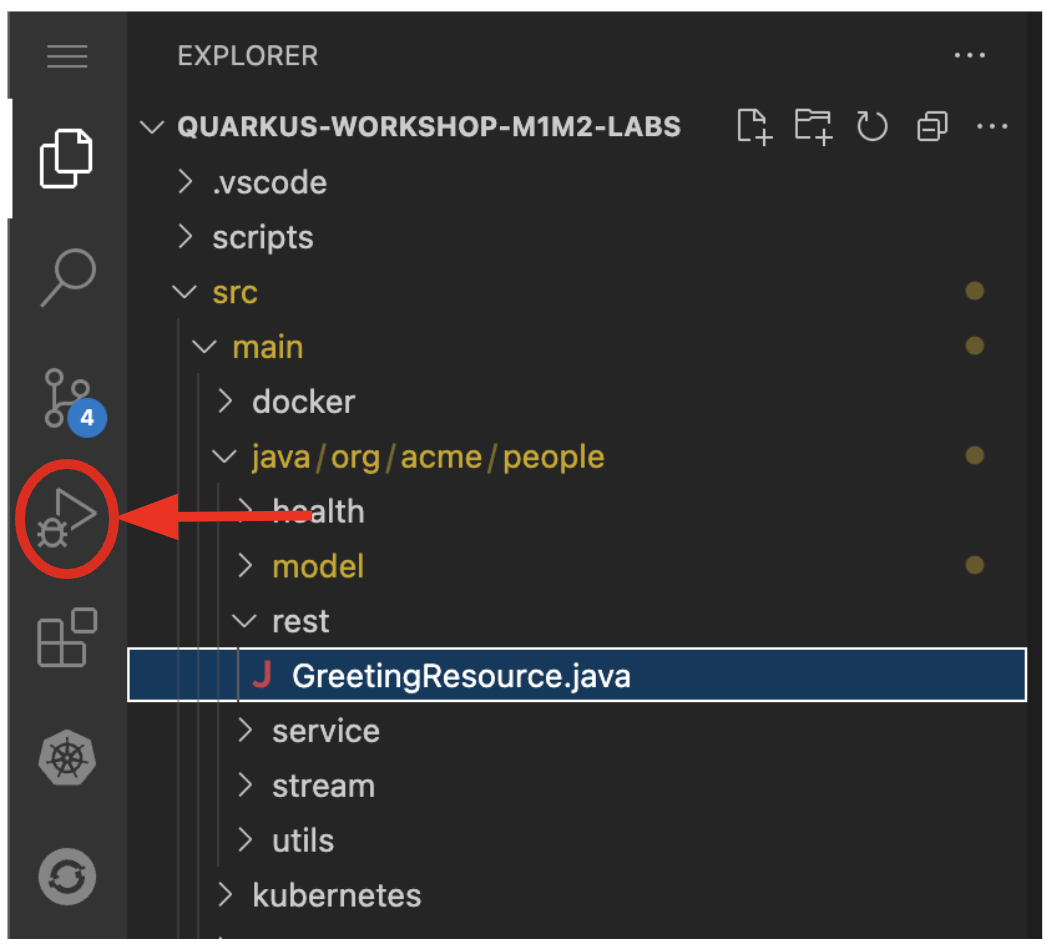
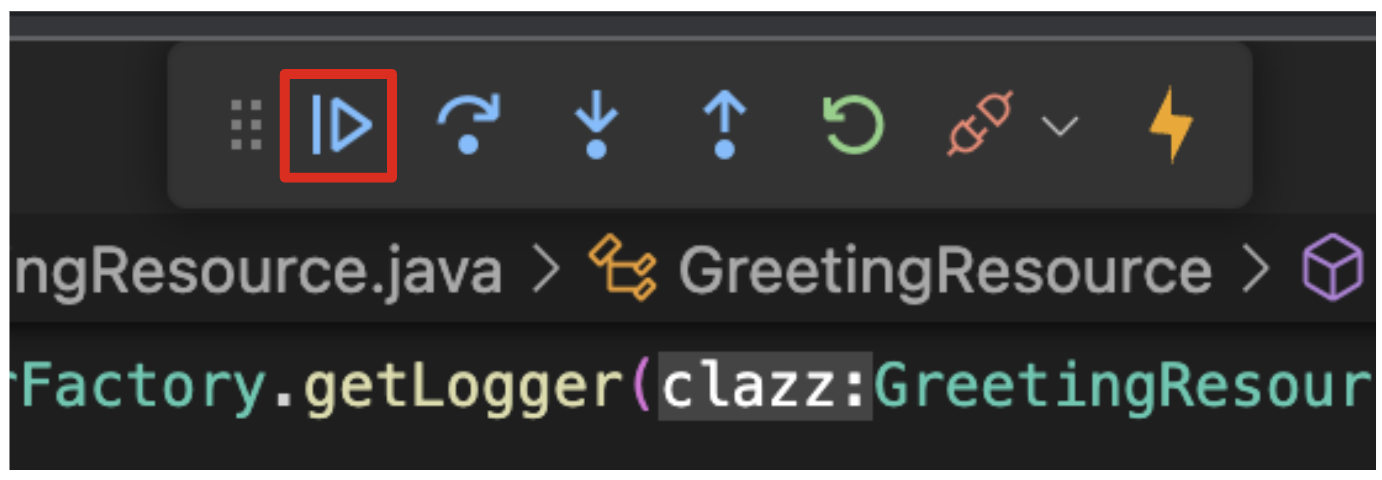
To connect to the running app, access the debugger by selecting on the debug icon:
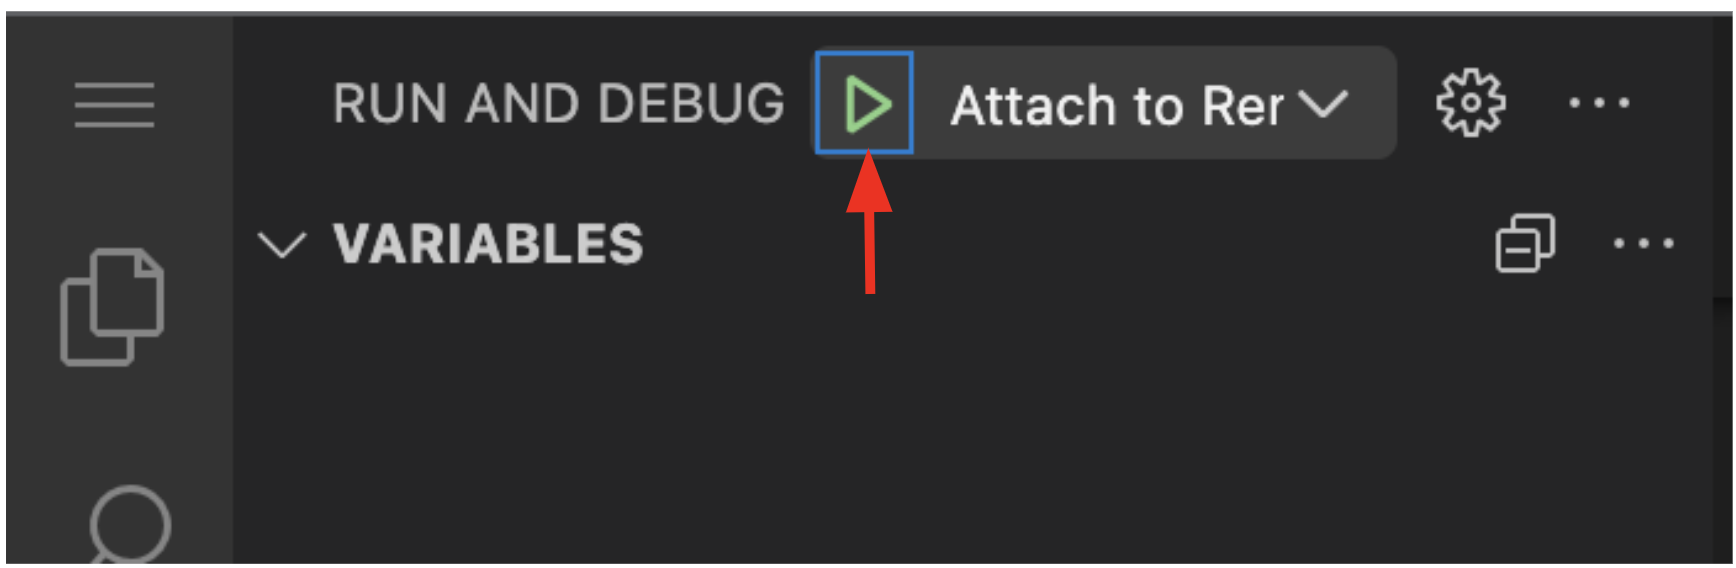
The debugger view will appear with several small buttons used to start/stop execution, step into/over/out of code, and other operations. Ensure that Attach to App is selected in the drop-down, and select the Start Debugging button to attach the debugger to the app:
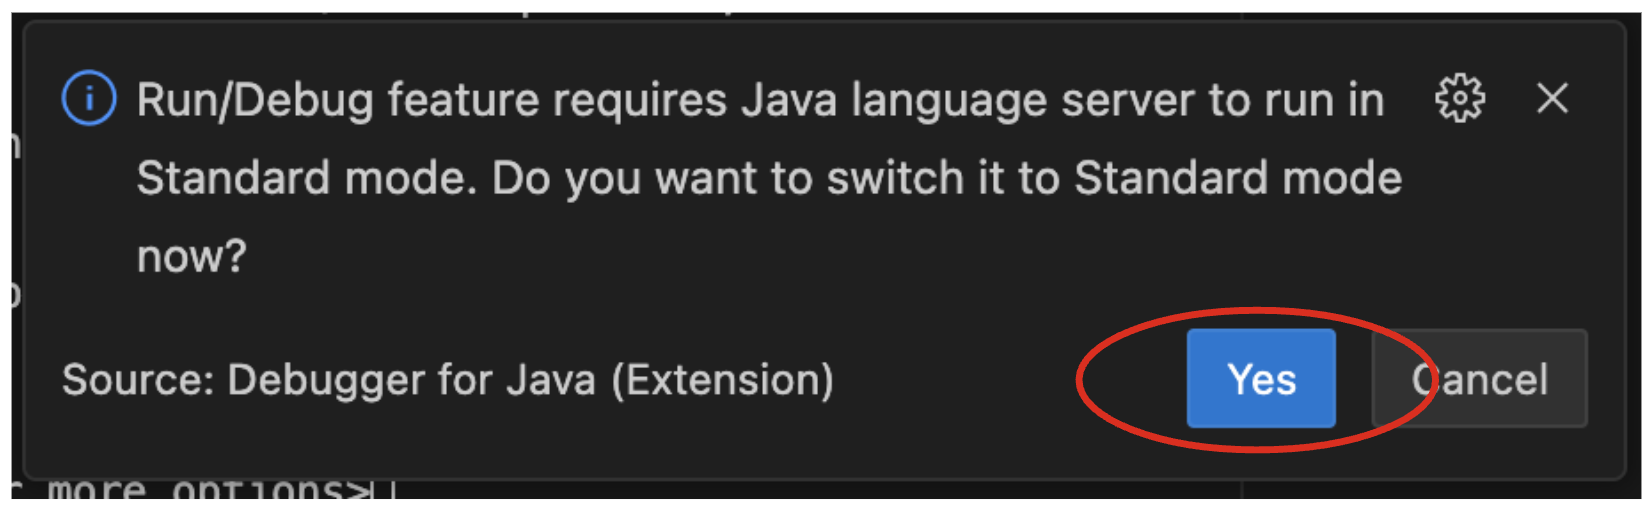
Click on Yes to enable the Debug mode:
Set a Breakpoint
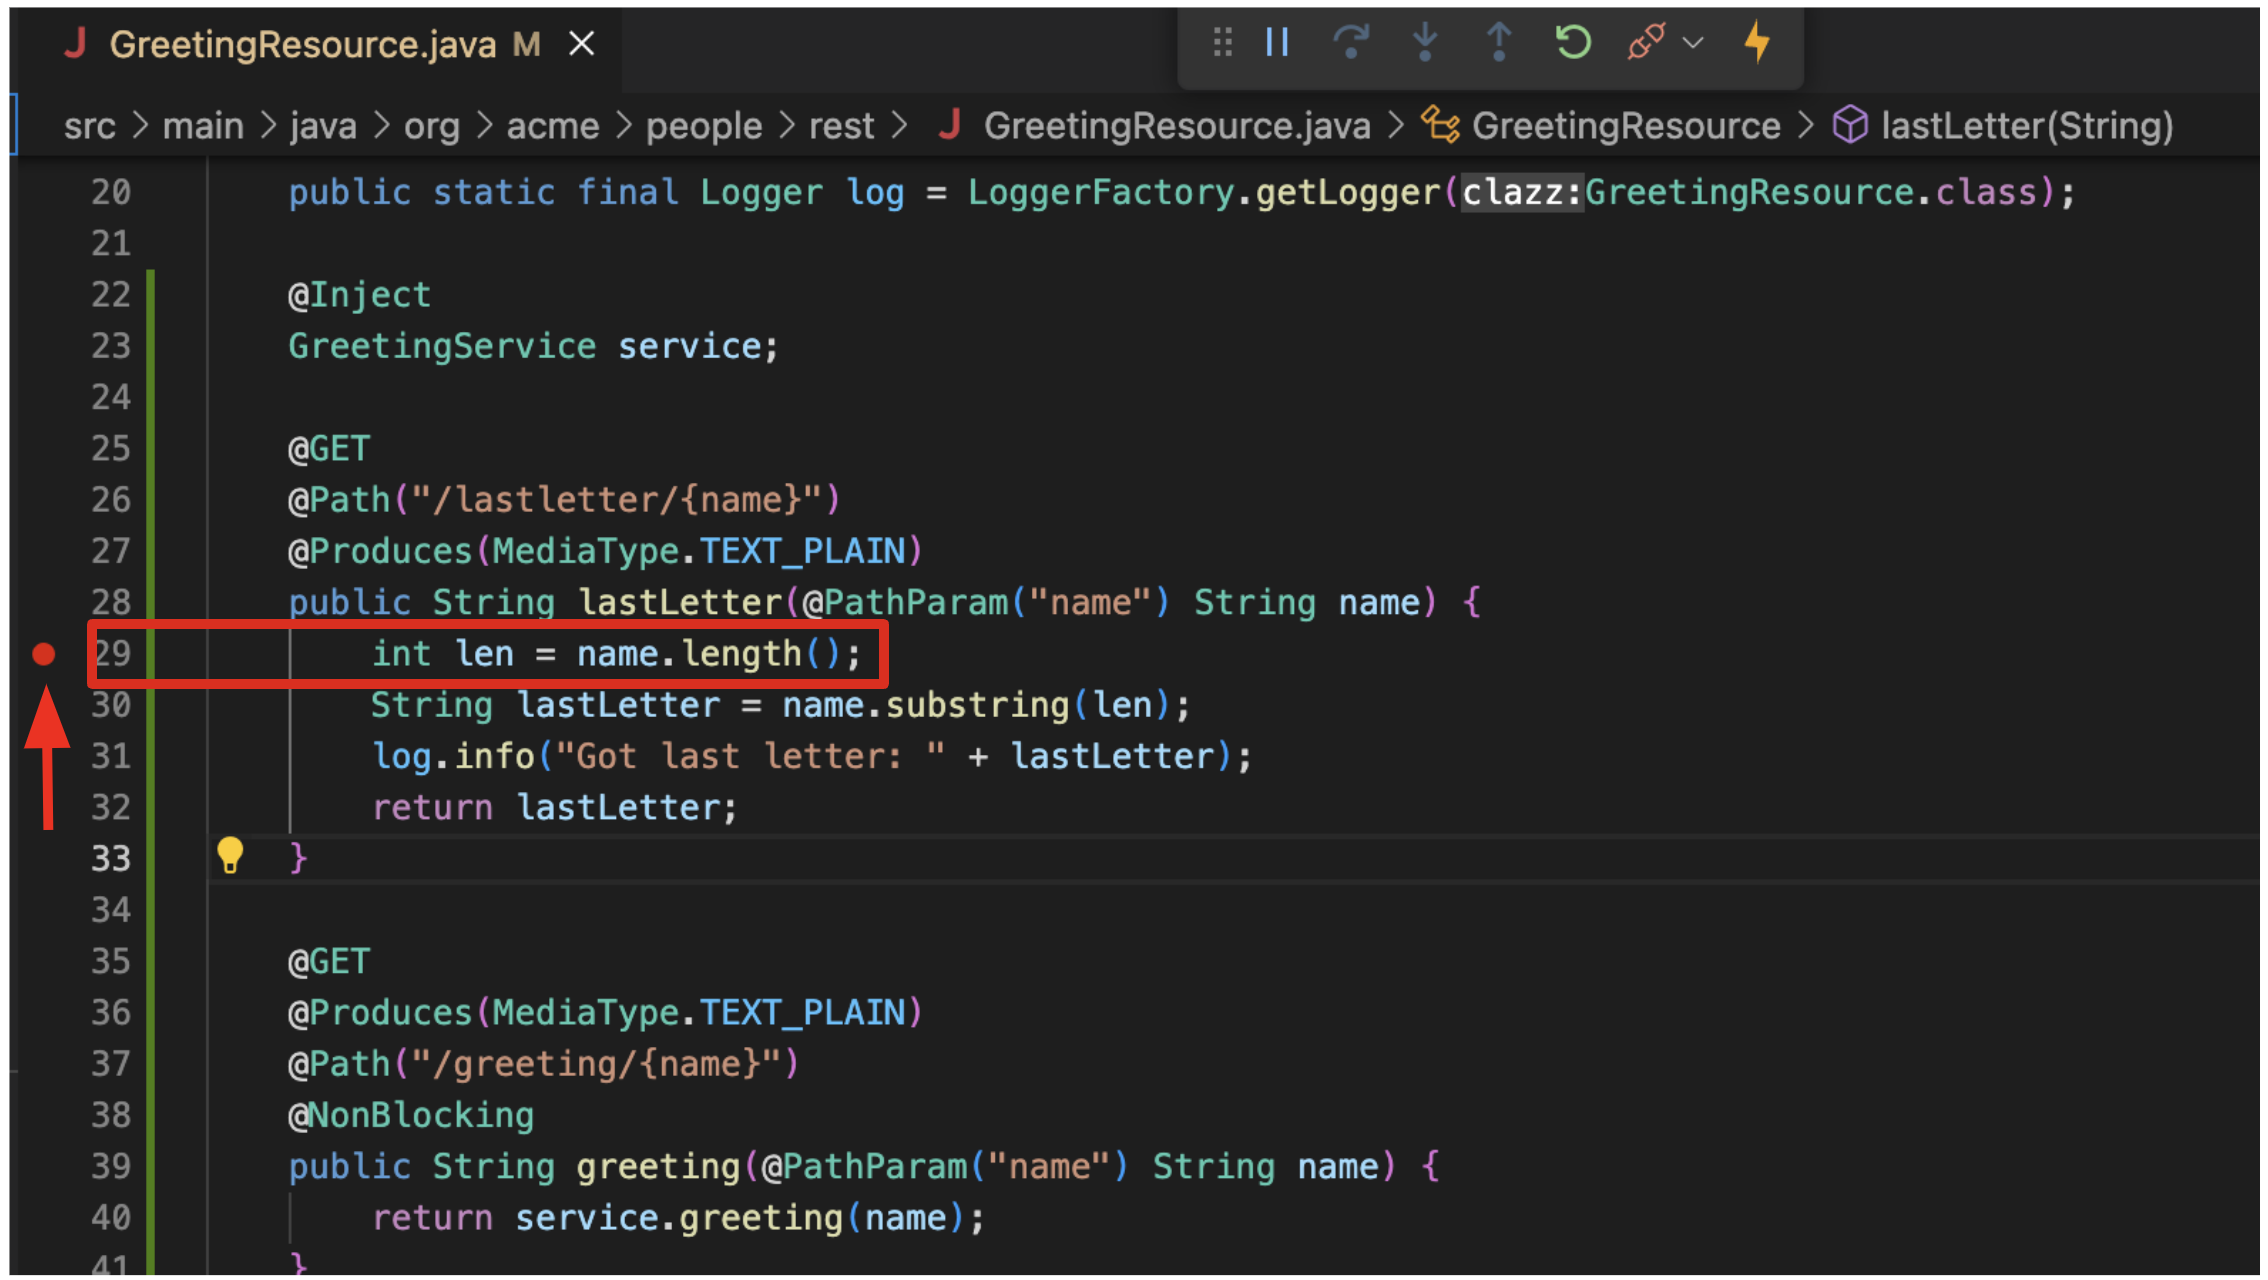
To debug the app, let’s step through our function that has the bug. In the left gutter of the code, to the left of the line numbers, select once next to int len = name.length(); to set a breakpoint and cause a red circle to appear:
|
Your line numbers may be different depending on where you placed this code in the file. |
Trigger the bug
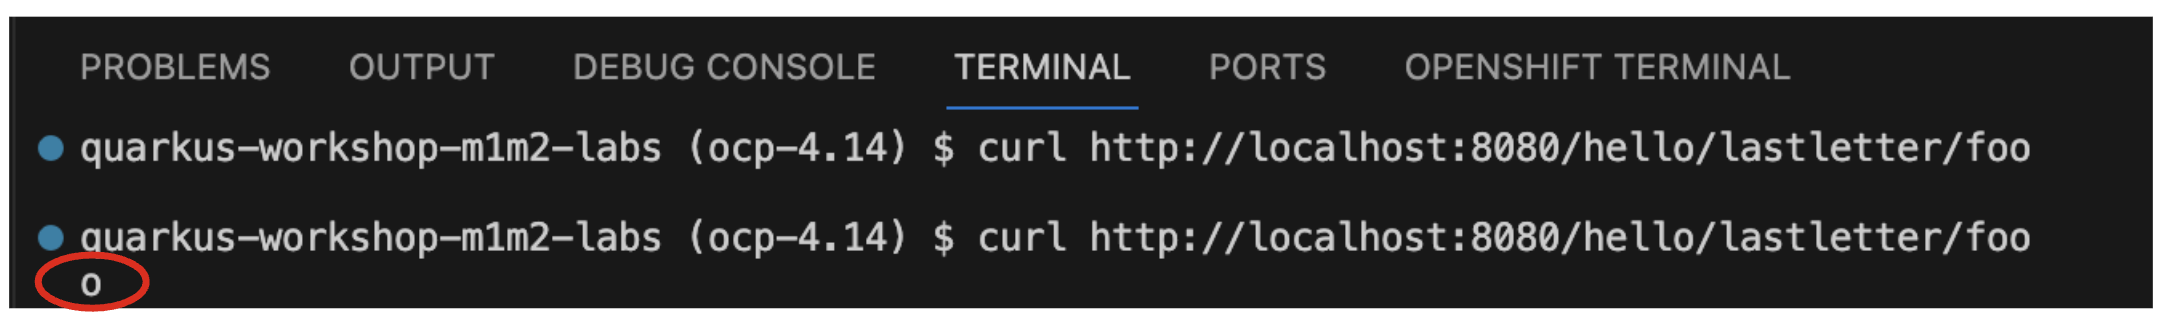
Now that we have a breakpoint, in a Terminal issue the same curl command as before:
curl http://localhost:8080/hello/lastletter/fooThis time, the command will appear to hang as the breakpoint has been reached. The line where you set the breakpoint will be highlighted:
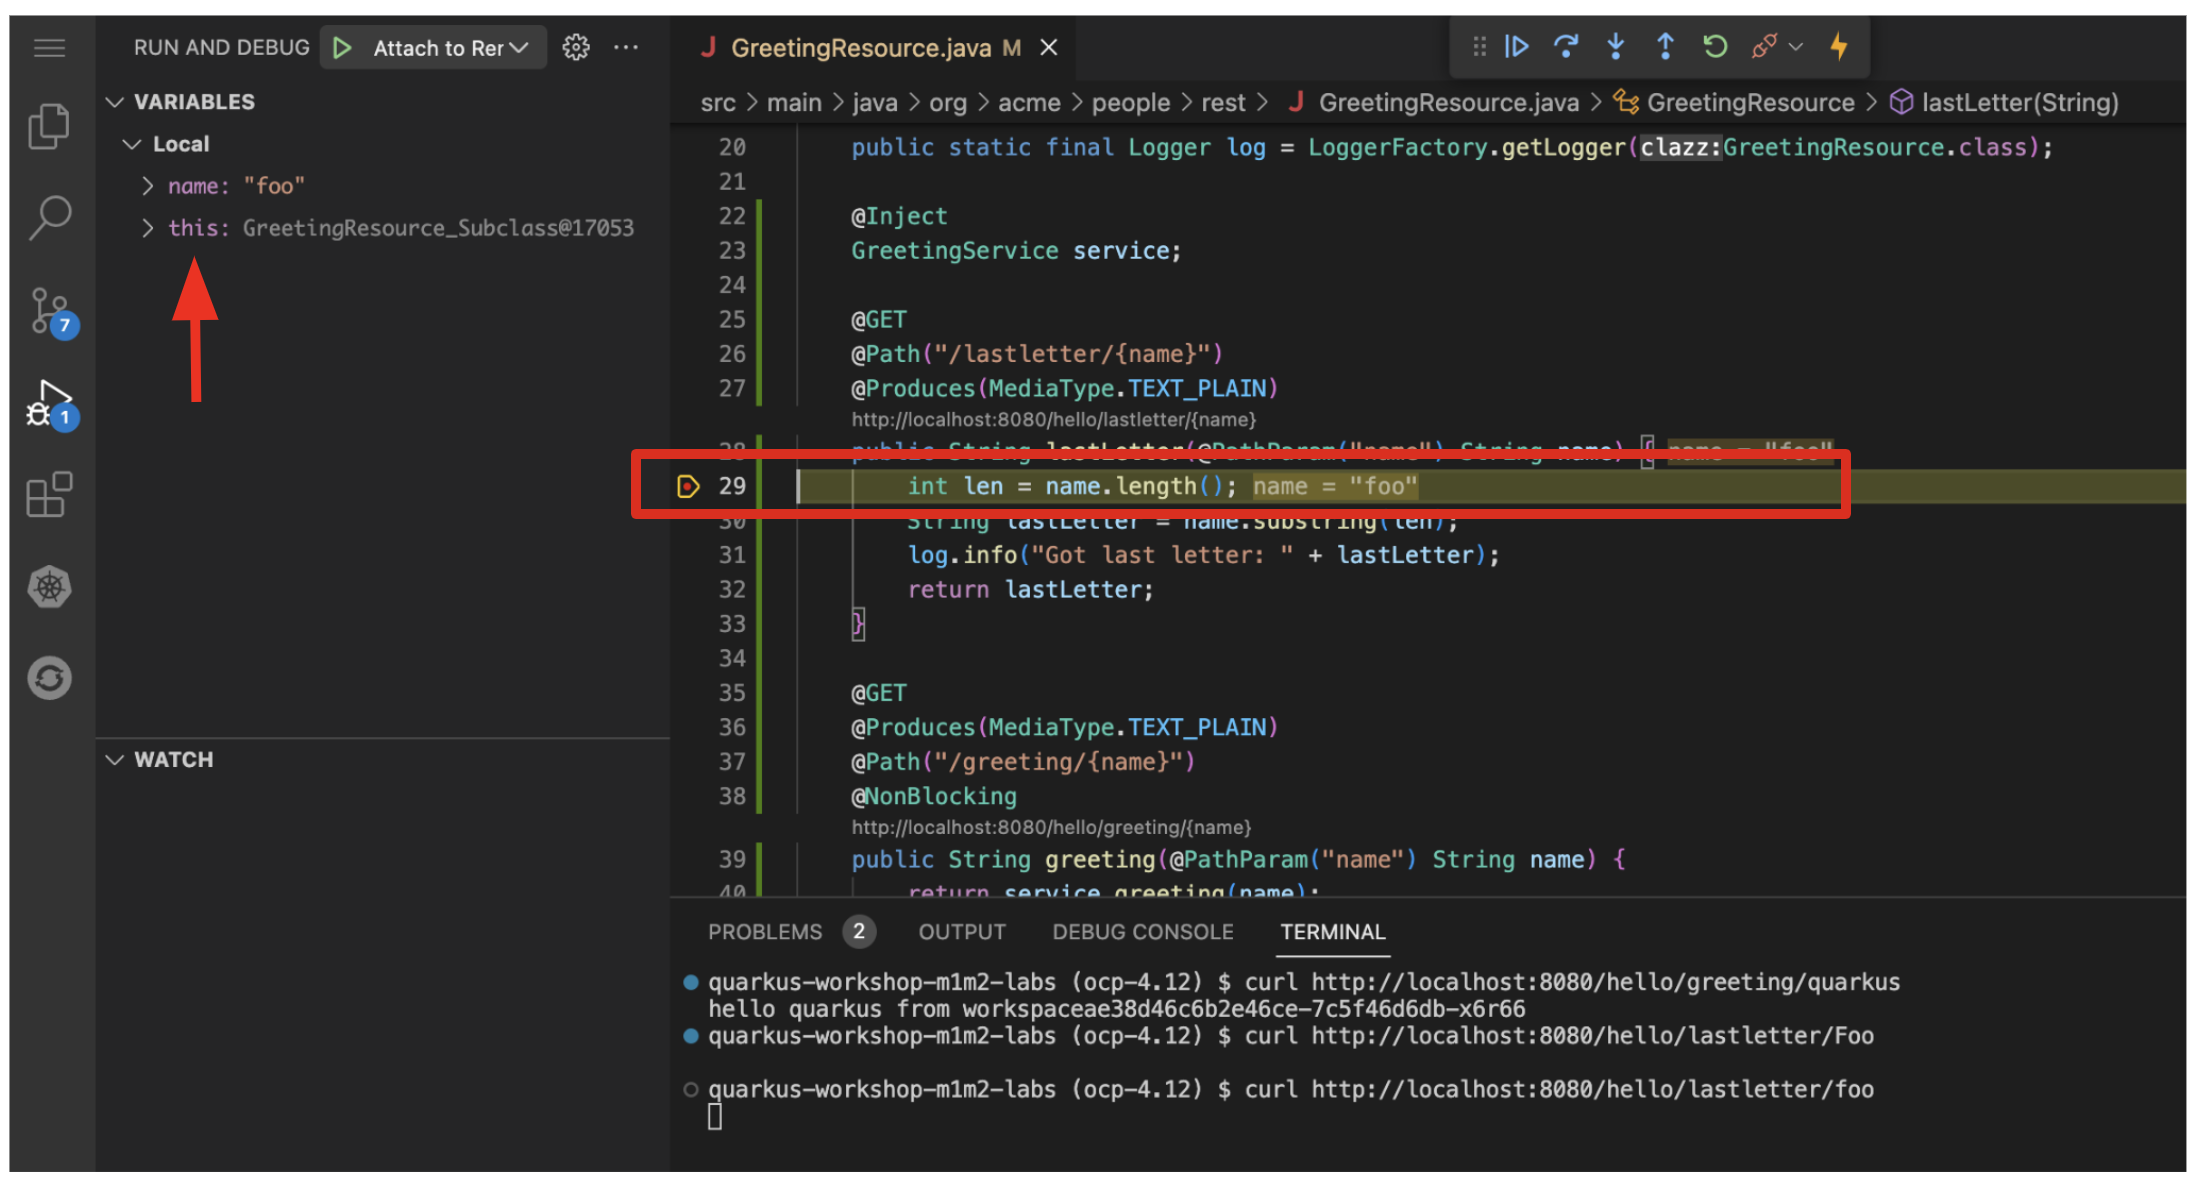
You will see four main sections of the debug view:
-
Threads - A list of active threads at the point where the breakpoint was reached.
-
Call Stack - This is an ordered list of stack frames showing the path through the code from the beginning of the thread to the current location in our code.
-
Variables - Here you can see the value of local variables in the selected stack frame. In our code we have no local variables defined yet, but once we start stepping through the code, newly defined variables (like
len) will appear here. -
Breakpoints - This lists the breakpoints you’ve set. Each Breakpoint can be further configured, or selectively disabled, by right-selecting on the breakpoint in the breakpoint list.
Step over the current line by selecting Step Over:
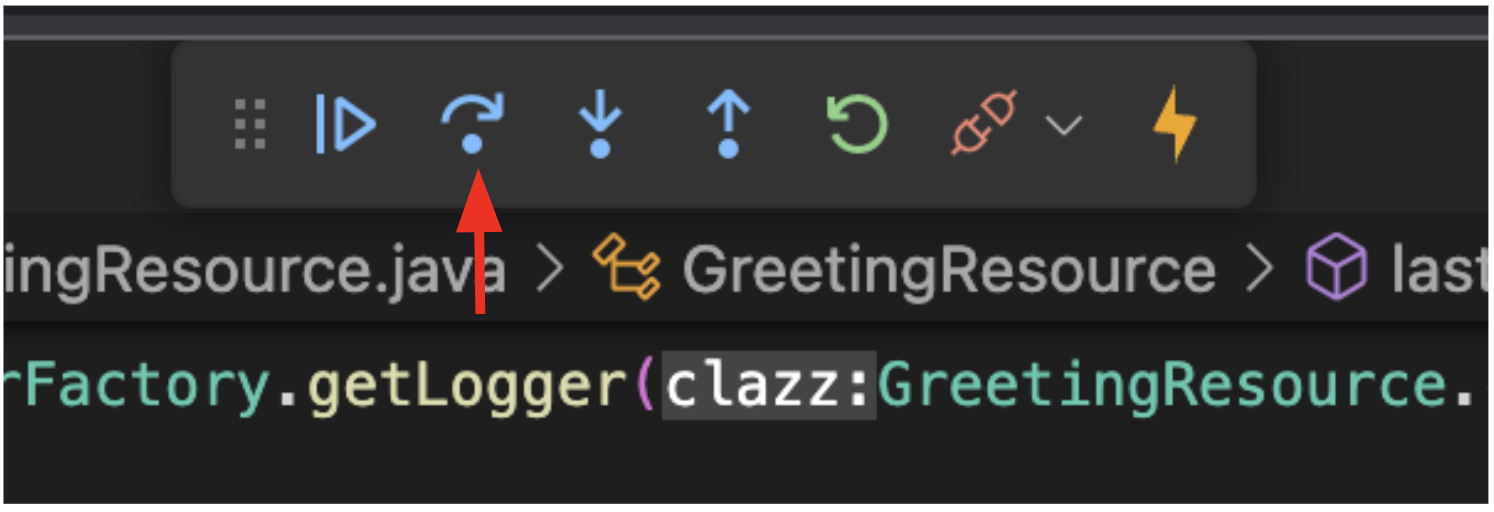
This will fully execute the current line, and advance to the next line in the code and stop again. (You could also step into methods for deeper debugging).
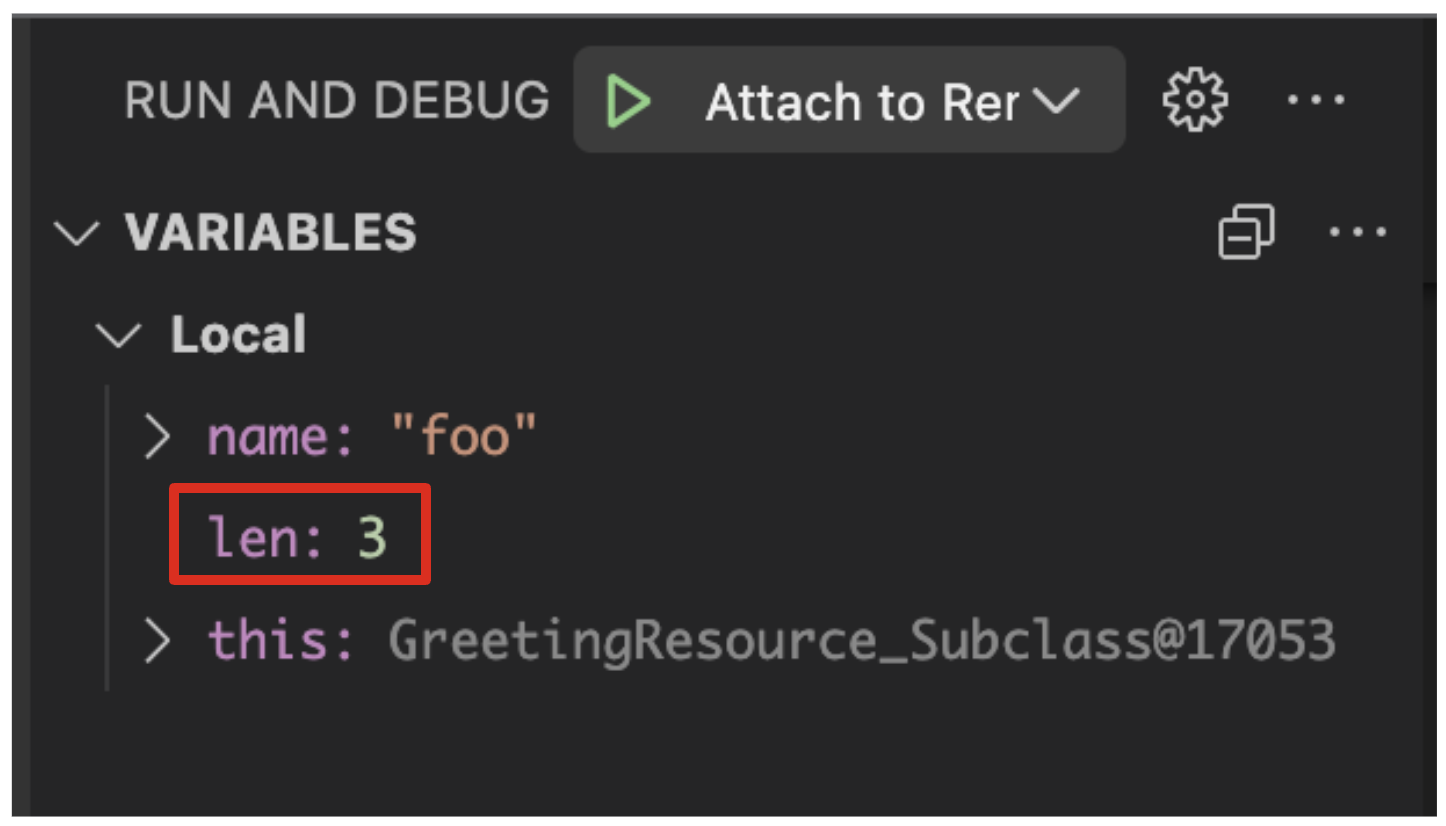
At this point, len is defined (and listed on the right side):
-
Step Over again, which executes the line to grab the last letter using
lenan offset to thesubstringmethod. See the bug? Look at the value oflastLetterin the variables list on the right - it’s empty!
We need to pass an offset that is one before the end, to get the last letter.
Select the Continue button to let the method continue, log the erroneous value to the console, and return the value (your curl command may have timed out).
Fix the bug
Fix the code by changing the line that calls substring() to read:
String lastLetter = name.substring(len - 1);With the bug fixed, re-trigger the method by running the curl command again in a Terminal:
curl http://localhost:8080/hello/lastletter/foo ; echoThe breakpoint will be hit once again. Step over the lines to verify the value of lastLetter is correct and you see a proper Got last letter: o on the console. before the method returns. You’ve fixed the bug!
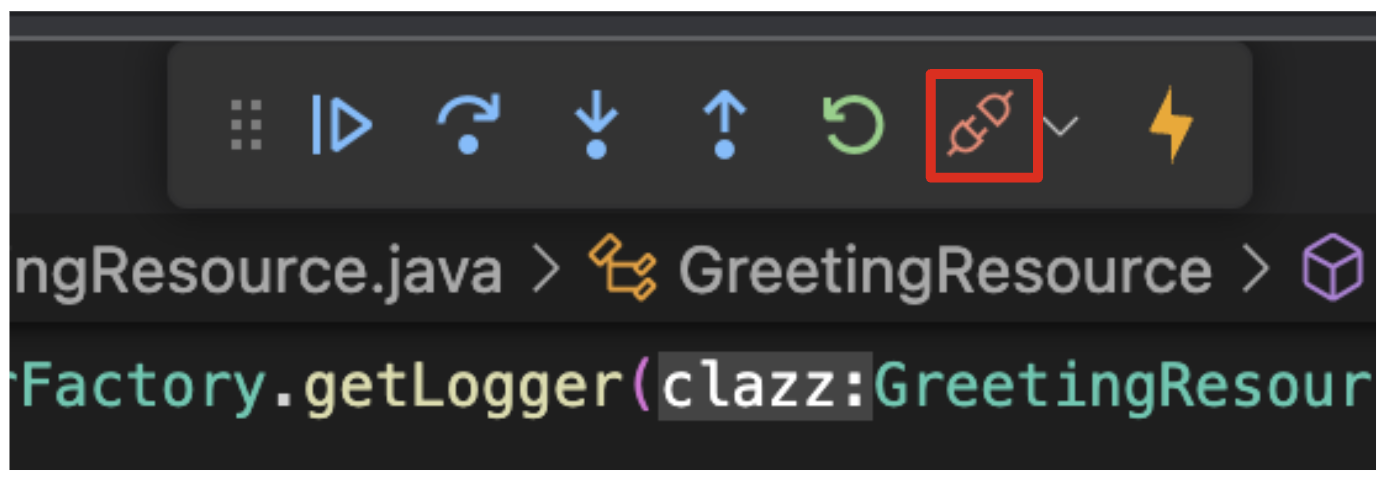
|
Occasionally the debugger gets disconnected from the running app. If your breakpoints aren’t being hit, try to select the Disconnect button, and then reconnect with the Start Debugging button, and try again. |
Remove the breakpoint by selecting on the red circle to de-highlight it. Run the curl command once more to see the full bugfix which should return the last letter of the generated name now: You should see o.
select Disconnect button to quit the debugging session.