Advanced Quarkus Development
Learning Objectives
After completing this module, you will be able to:
-
Discover and integrate Quarkus extensions for enterprise capabilities
-
Implement database persistence using Hibernate ORM with Panache
-
Document RESTful APIs using OpenAPI and Swagger UI
-
Build reactive applications with asynchronous messaging and Apache Kafka
-
Monitor application performance using Micrometer and Prometheus
-
Visualize metrics with Grafana dashboards for production observability
-
Implement distributed tracing using OpenTelemetry and Jaeger
-
Secure APIs with JWT Bearer Token authentication and Red Hat build of Keycloak
-
Apply Role-Based Access Control (RBAC) for microservices authorization
-
Deploy production-ready, enterprise-grade Quarkus applications to Red Hat OpenShift
Explore the Project
Let’s take a look at the Explorer menu on the left-hand side of the IDE. Your Quarkus project was already imported when the workspace was created.
-
The project contains:
-
The Maven structure
-
An
org.acme.people.rest.GreetingResourceresource exposed on/hello, along with a simple test -
A landing page that is accessible on
http://localhost:8080after starting the application -
The application configuration file
-
Other source files we’ll use later
-
-
Navigate to
src → main → java → org.acme.people.restin the project tree and selectGreetingResource.java.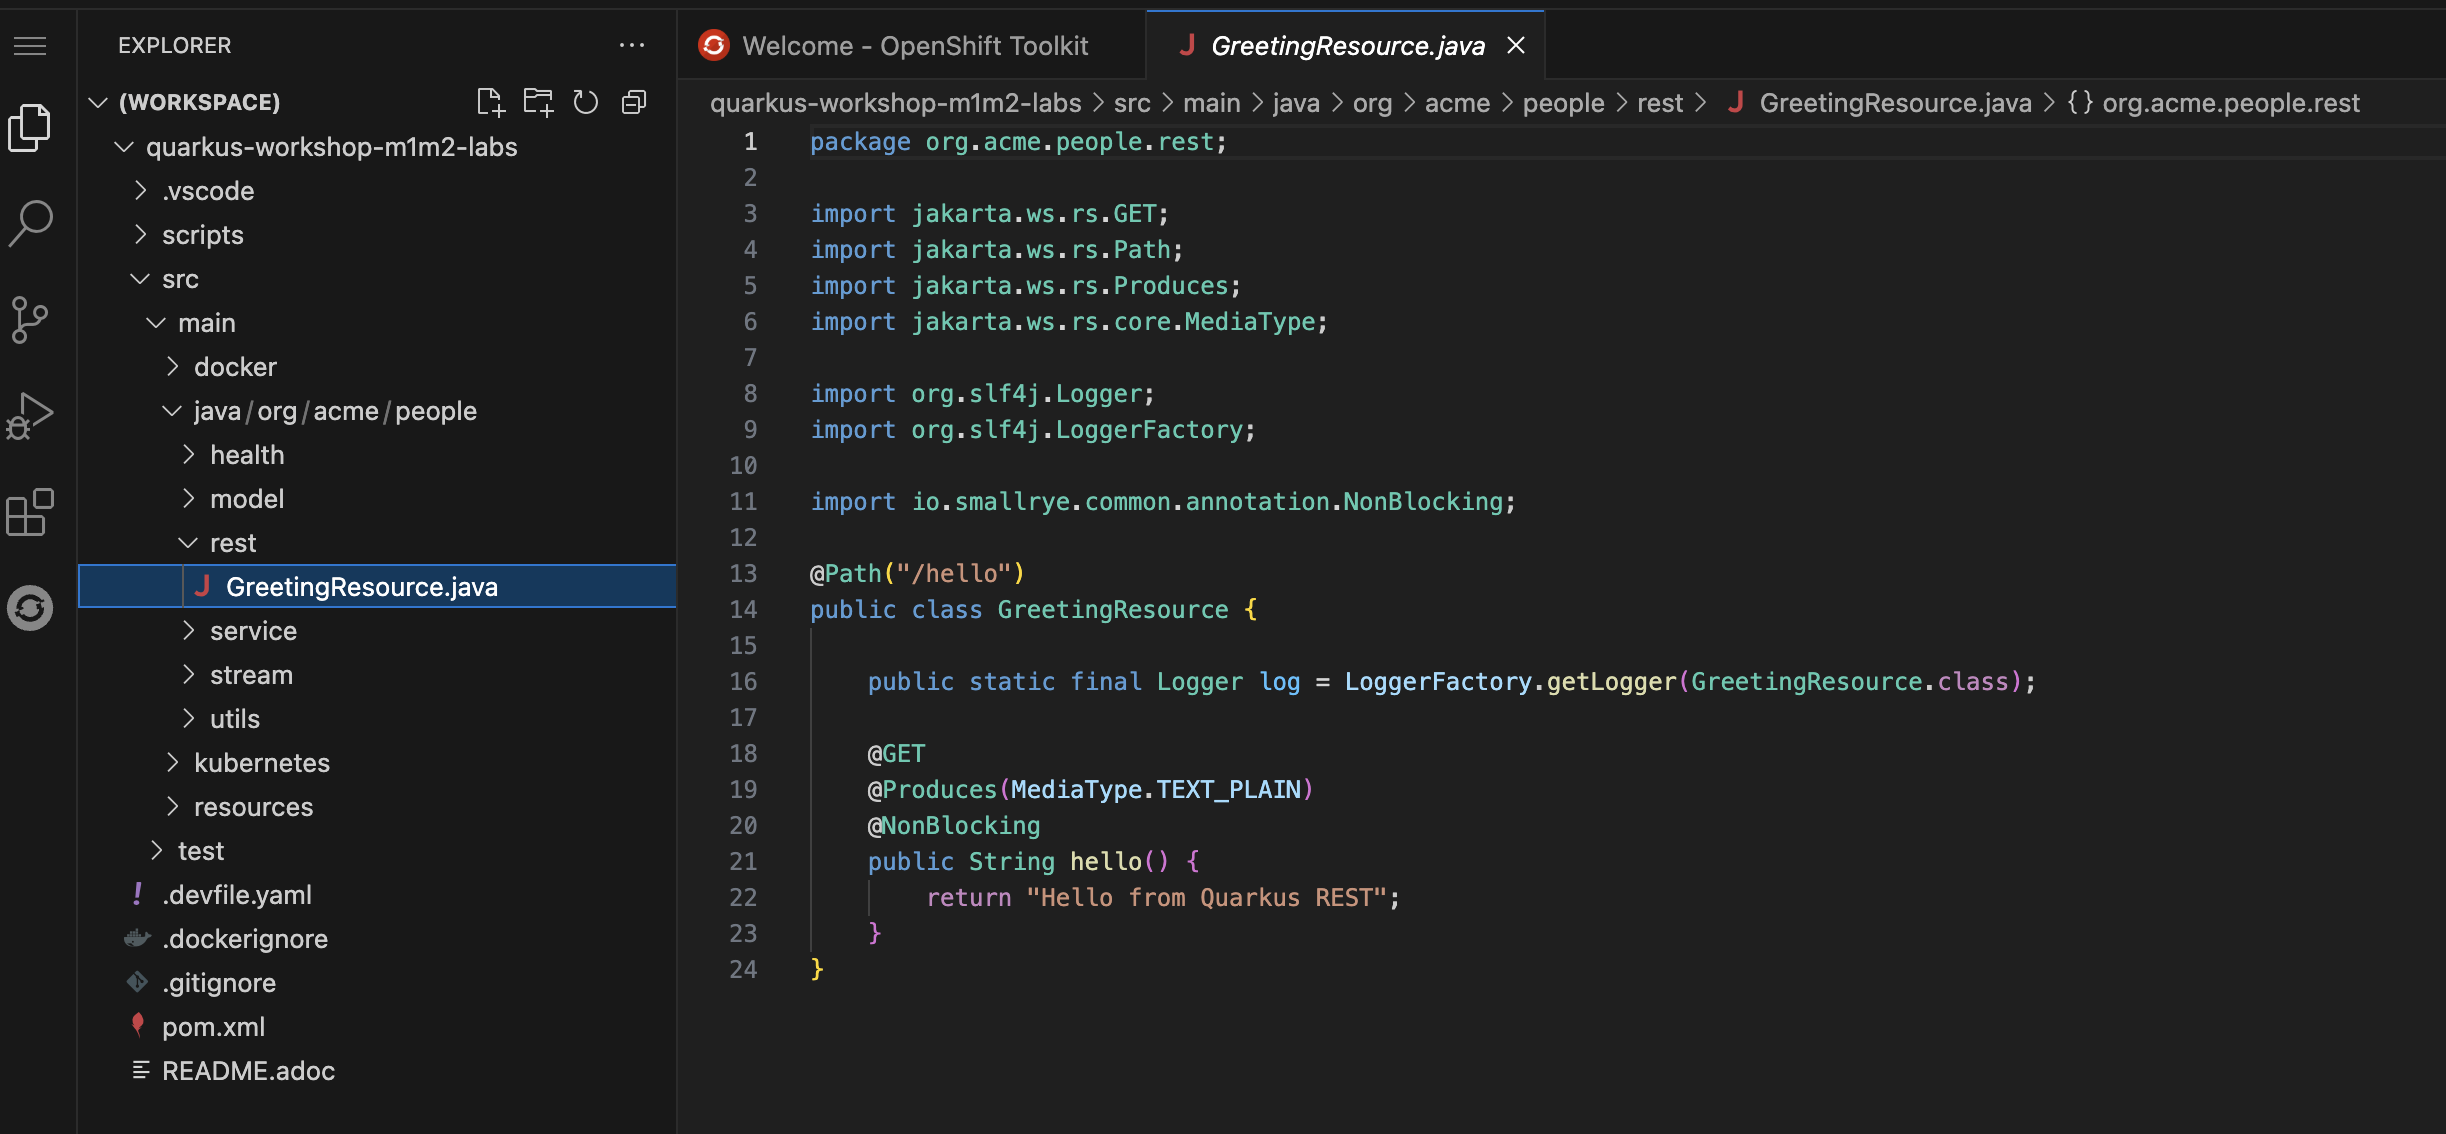
-
This class has a very simple RESTful endpoint definition that returns hello to requests on
/hello.@Path("/hello") public class GreetingResource { @GET @Produces(MediaType.TEXT_PLAIN) public String hello() { return "Hello from Quarkus REST"; } }Compared to vanilla JAX-RS, with Quarkus there is no need to create an
Applicationclass. It’s supported but not required. In addition, only one instance of the resource is created and not one per request. You can configure this using the differentScopedannotations (ApplicationScoped,RequestScoped, etc).
Running the Application in Quarkus Dev Mode for Live Coding
Live Coding (also referred to as Quarkus dev mode) allows us to run the app and make changes on the fly. Quarkus will automatically re-compile and reload the app when changes are made. This is an efficient style of developing that you will use throughout the lab.
-
Before starting the dev mode, you need to append the following configuration to
application.propertiesin thesrc/main/resourcesdirectory. This allows you to access the Dev UI from the cloud IDE since the Dev UI is designed for running your localhost.%dev.quarkus.dev-ui.hosts={user}-quarkus-workshop-index-webpage.{openshift_cluster_ingress_domain}Note that the changes will be automatically saved in the IDE. -
Run the following
mvn(Maven) commands to run Quarkus dev mode in the terminal.mvn clean quarkus:dev -Dquarkus.http.host=0.0.0.0 -Dquarkus.analytics.disabled=true -
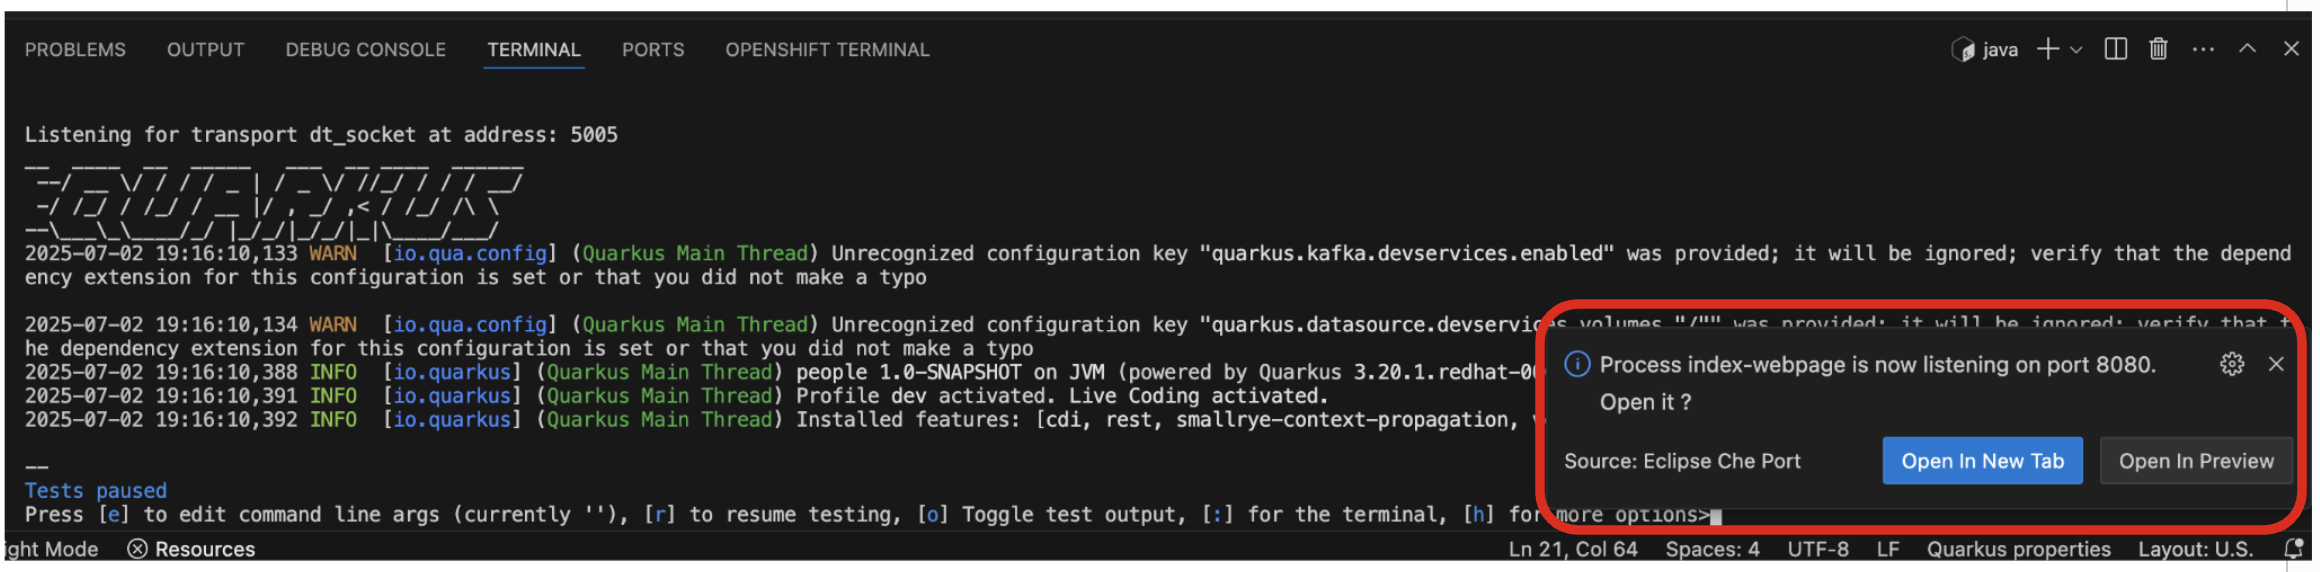
When the dev mode starts, you will see a popup to access the welcome page.
-
Leave this terminal window open throughout the lab! You will complete the entire lab without shutting down Quarkus Live Coding mode, so be careful not to close the tab (if you do, you re-run it). This is very useful for quick experimentation.
The first time you build the app, new dependencies may be downloaded via maven. This should only happen once, after that things will go even faster
You may see WARNINGs like
Unrecognized configuration keyorDuplicate entry. These are configuration values that will take effect later on and can be safely ignored for now. Occasionally you may get an error (e.g.NullPointerException) during Live Reloading. In this case, simply close the terminal and restart live coding using the task. -
Note the amazingly fast startup time! The app is now running locally (within the VS Code container in which the workspace is also running).
localhostrefers to the Kubernetes pod, not your laptop (so therefore opening localhost:8080 in your browser will not do anything). -
You can also see Tests paused by default when a Quarkus application gets started. We will learn more details in the Testing Quarkus App lab.
-
When you select Open In New Tab to access the welcome page, you should see the popup message below.
-
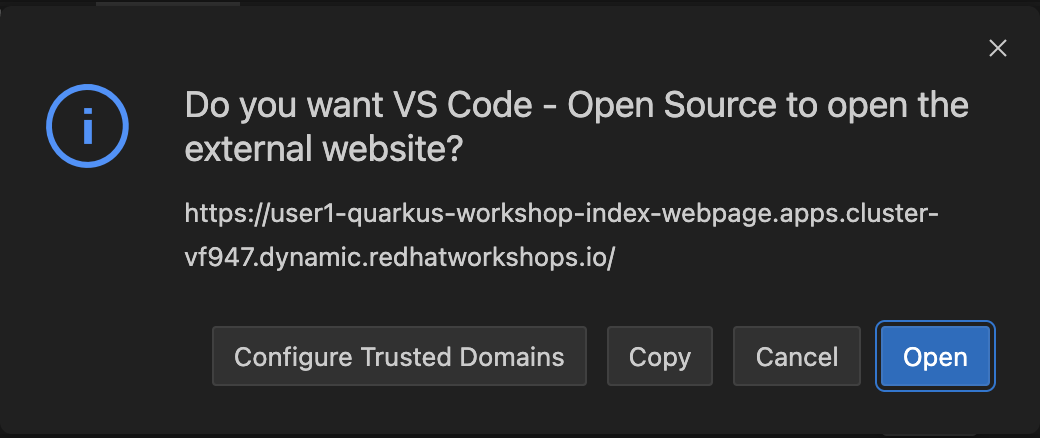
Select
Open. A new tab in your web browser will open automatically.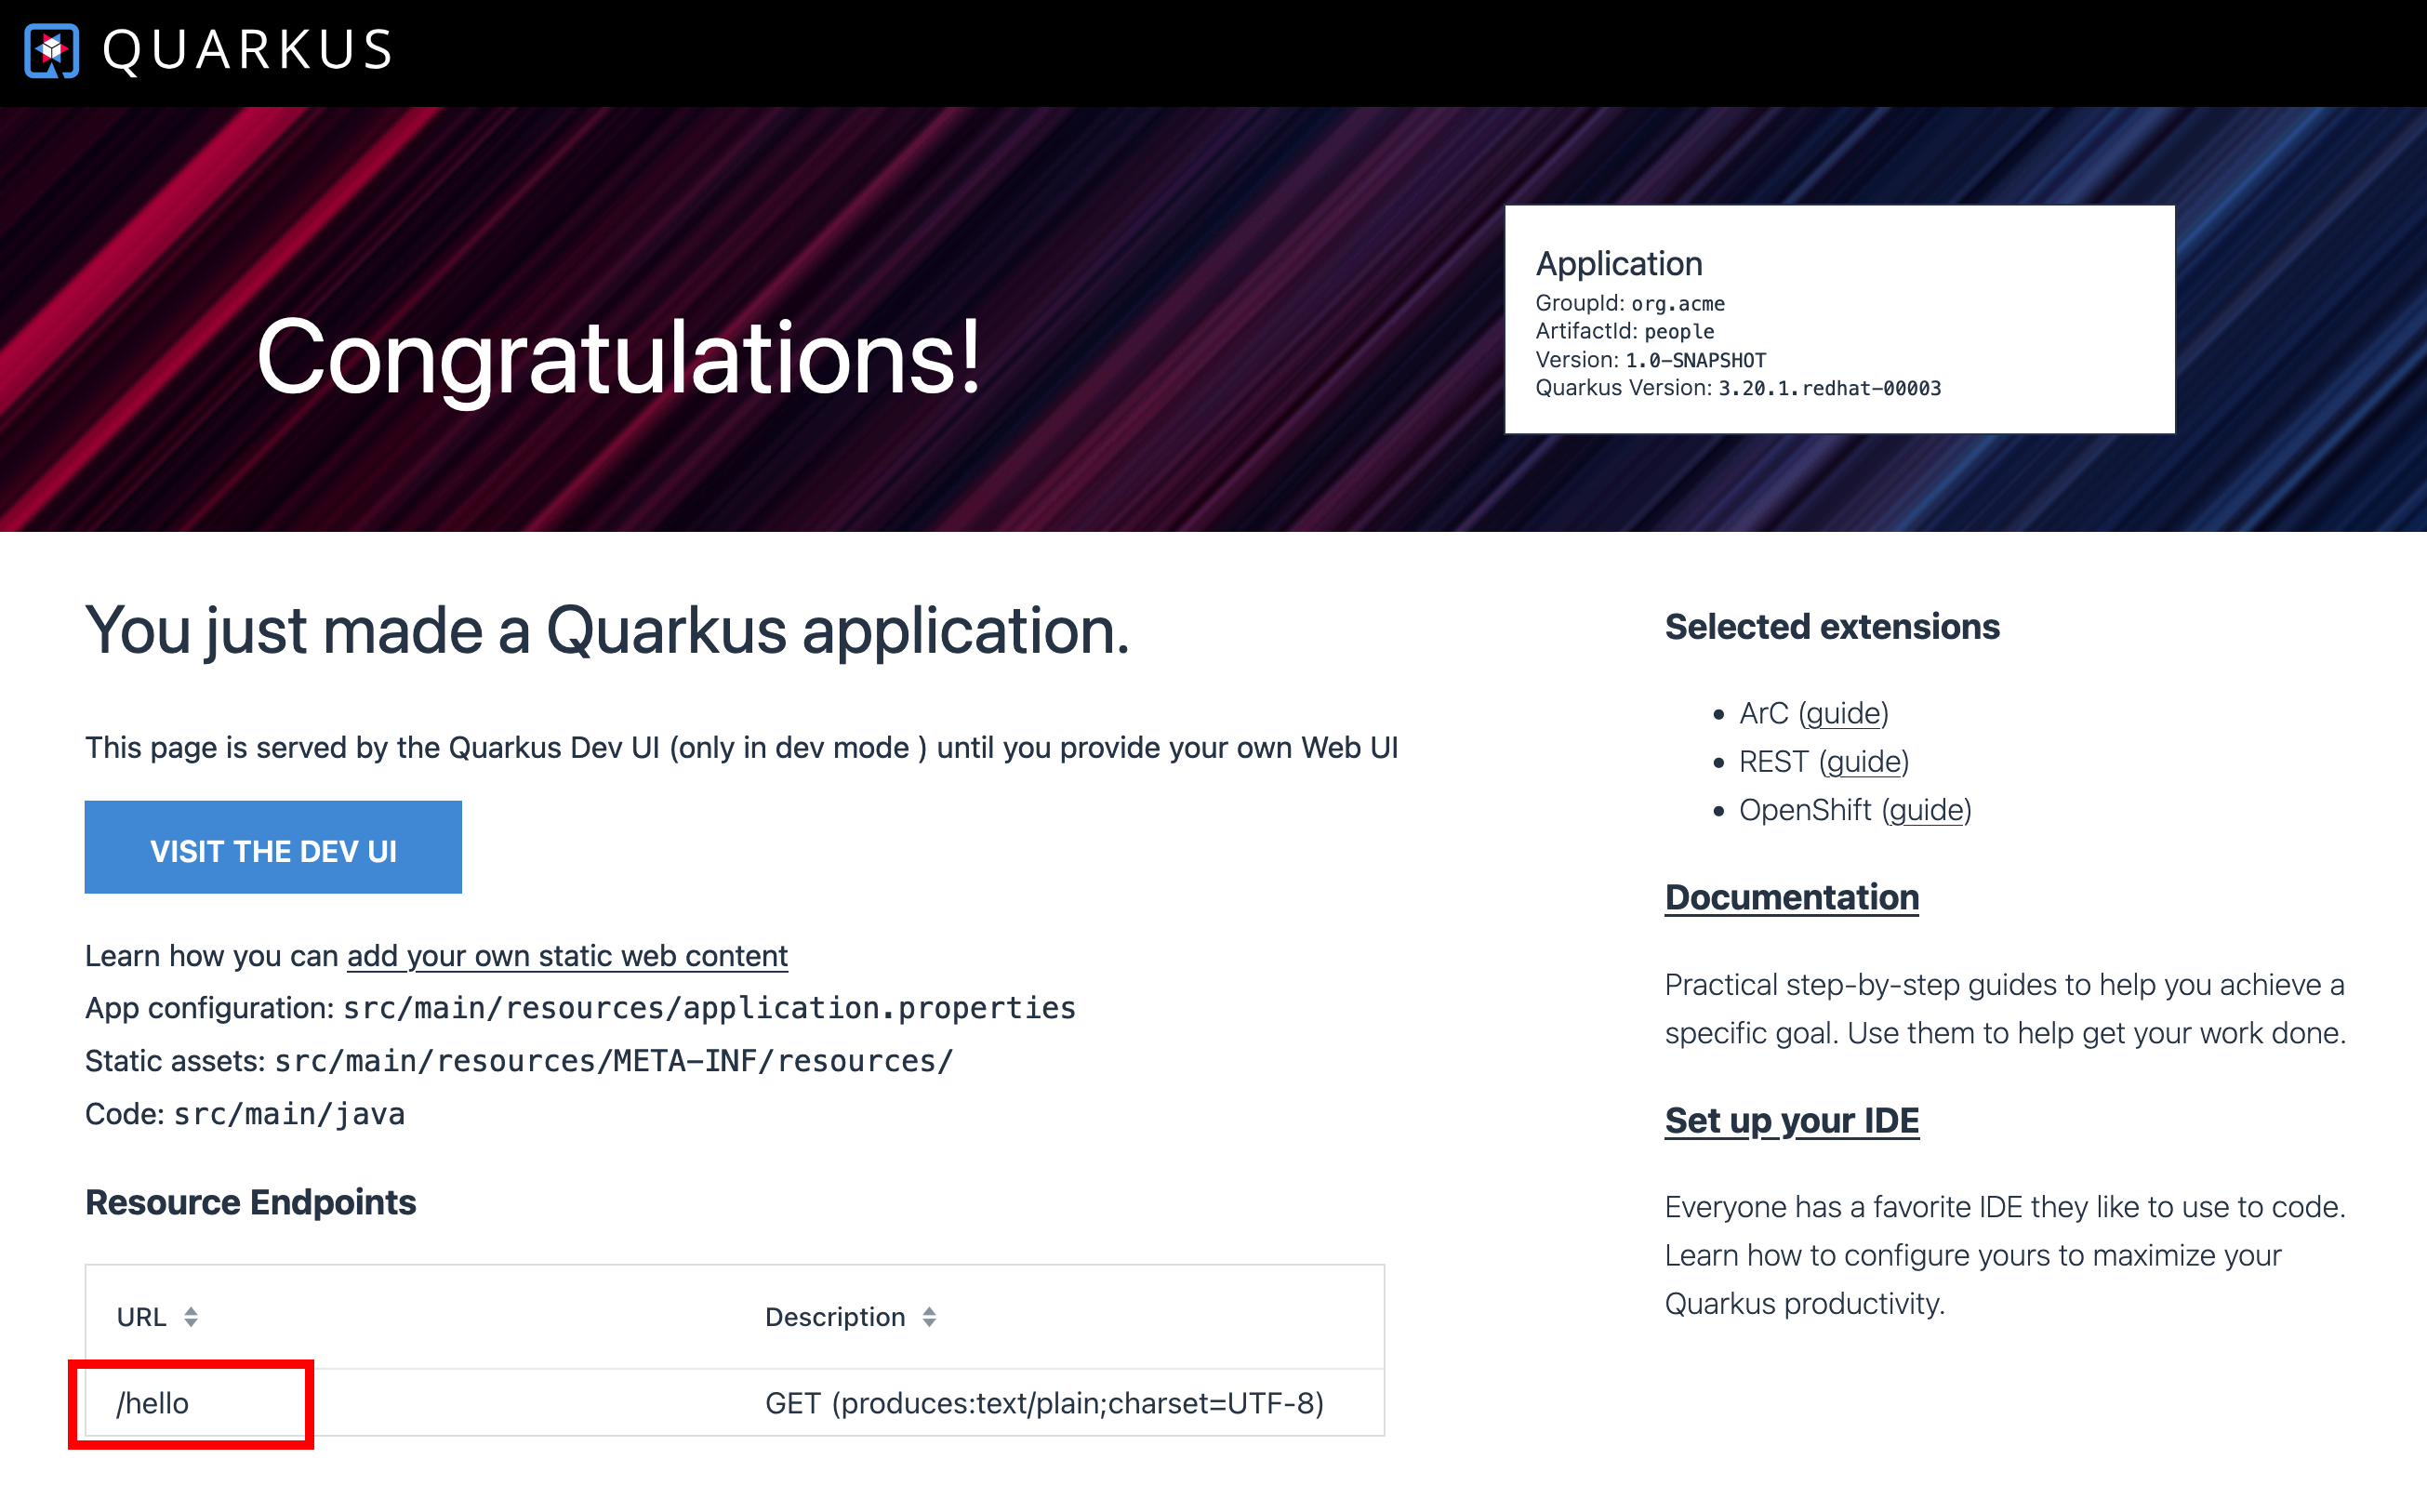
-
Select
/helloendpoint on the Quarkus welcome. You should see the following page: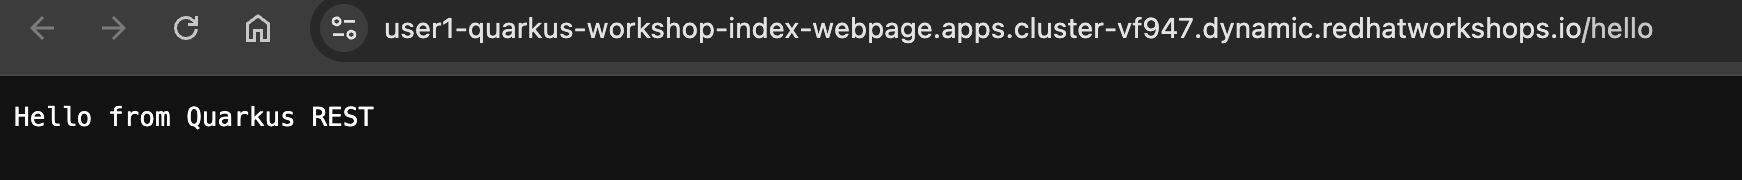
-
When you fail to access the hello endpoint URL, make sure if the new opened tab has the http protocol.
-
You can also test the endpoint using the curl command. Open a new terminal by selecting
+icon: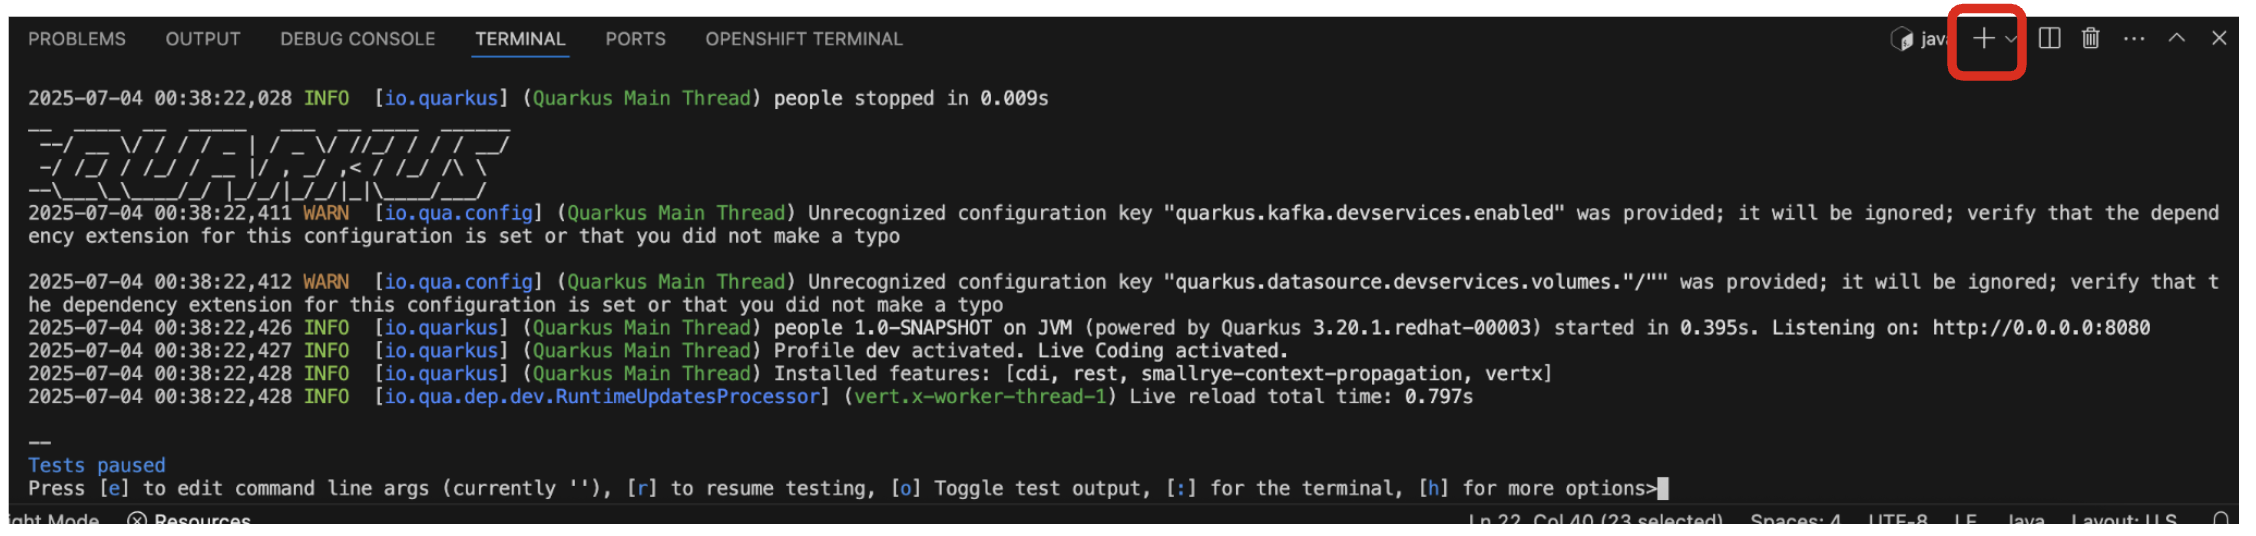
-
Invoke the
helloendpoint using the following curl command:curl http://localhost:8080/hello -
The output should look like this:
Hello from Quarkus REST -
Now, let’s exercise the live reload capabilities of Quarkus. In VS Code, open the
GreetingResource.javafile in the src/main/java/org/acme/people/rest directory and changereturn "Hello from Quarkus REST";toreturn "Hola from Quarkus REST";in the editor. After making this change, reload the same browser tab that was showingHello from Quarkus REST. It should now showHola from Quarkus REST. -
Wow, how cool is that? Supersonic Subatomic live reload! Go ahead and change it a few more times and access the endpoint again. And we’re just getting started. Leave the app running so we can continue to change it on the fly in the next section.
quarkus:devruns Quarkus in development mode. This enables live reload with background compilation, which means that when you modify your Java files your resource files and refresh your browser these changes will automatically take effect.This will also listen for a debugger on port
5005. If you want to wait for the debugger to attach before running you can pass-Ddebugon the command line. If you don’t want the debugger at all you can use-Ddebug=false. We’ll use this later.
Deploy app
-
Deploy the
peoplemicroservice by executing the following shell script in a CodeReady Workspaces Terminal:sh scripts/deploy-people.sh {user} -
Wait for the script to complete before continuing.
-
When the script completes, the app is deployed to OpenShift. You can see it in the OpenShift Console. Login with your assigned username and password (e.g.
{user}/{password}):
-
Once logged in, select the name of your project (
{user}-quarkus):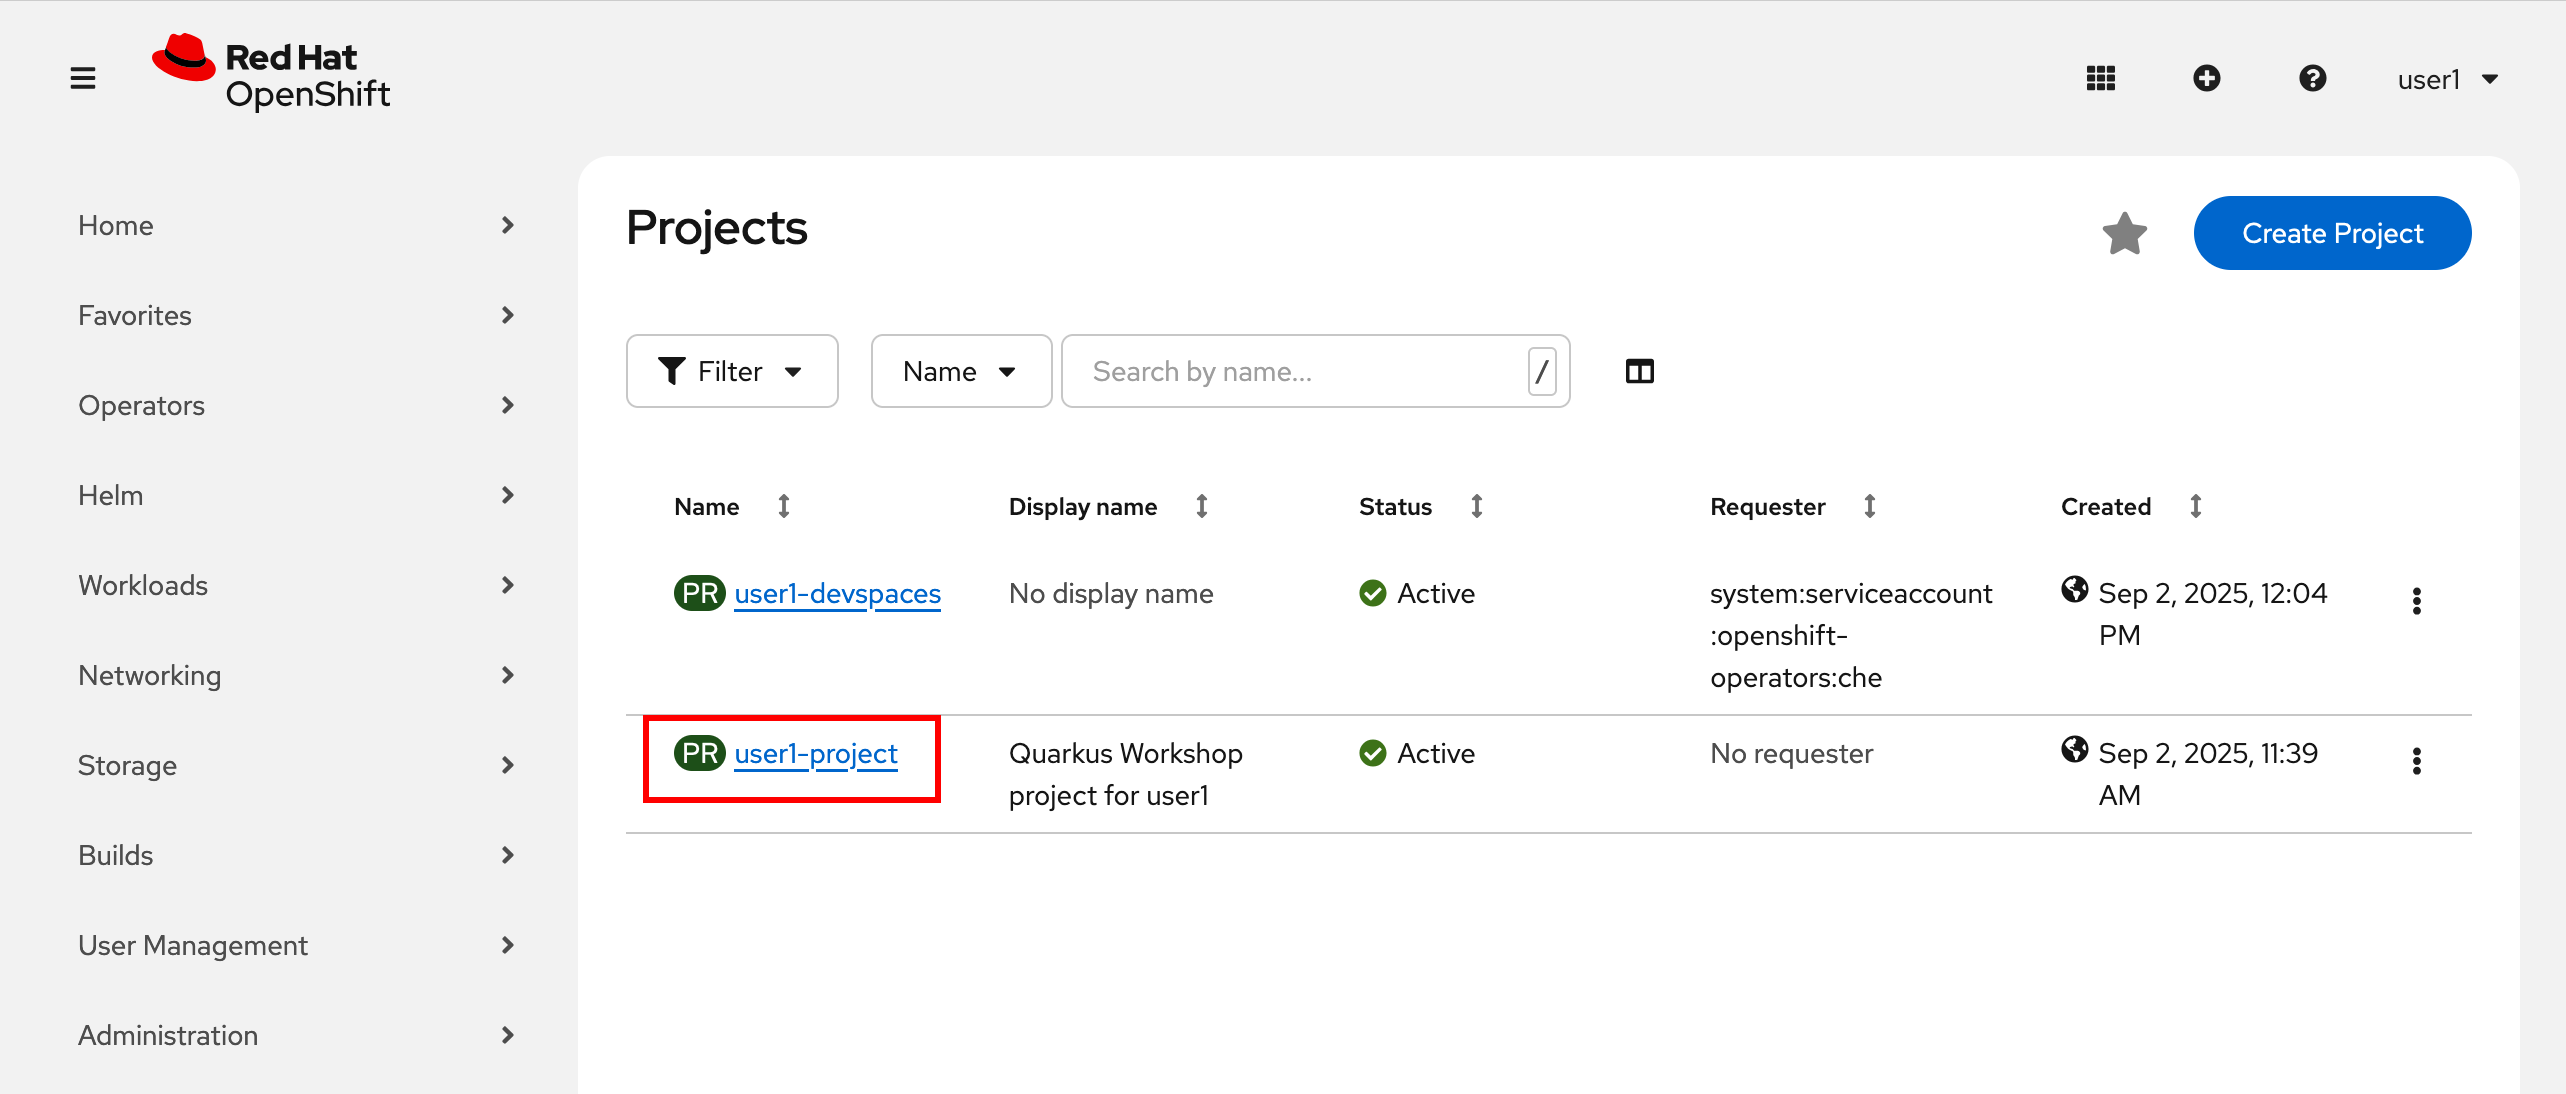
-
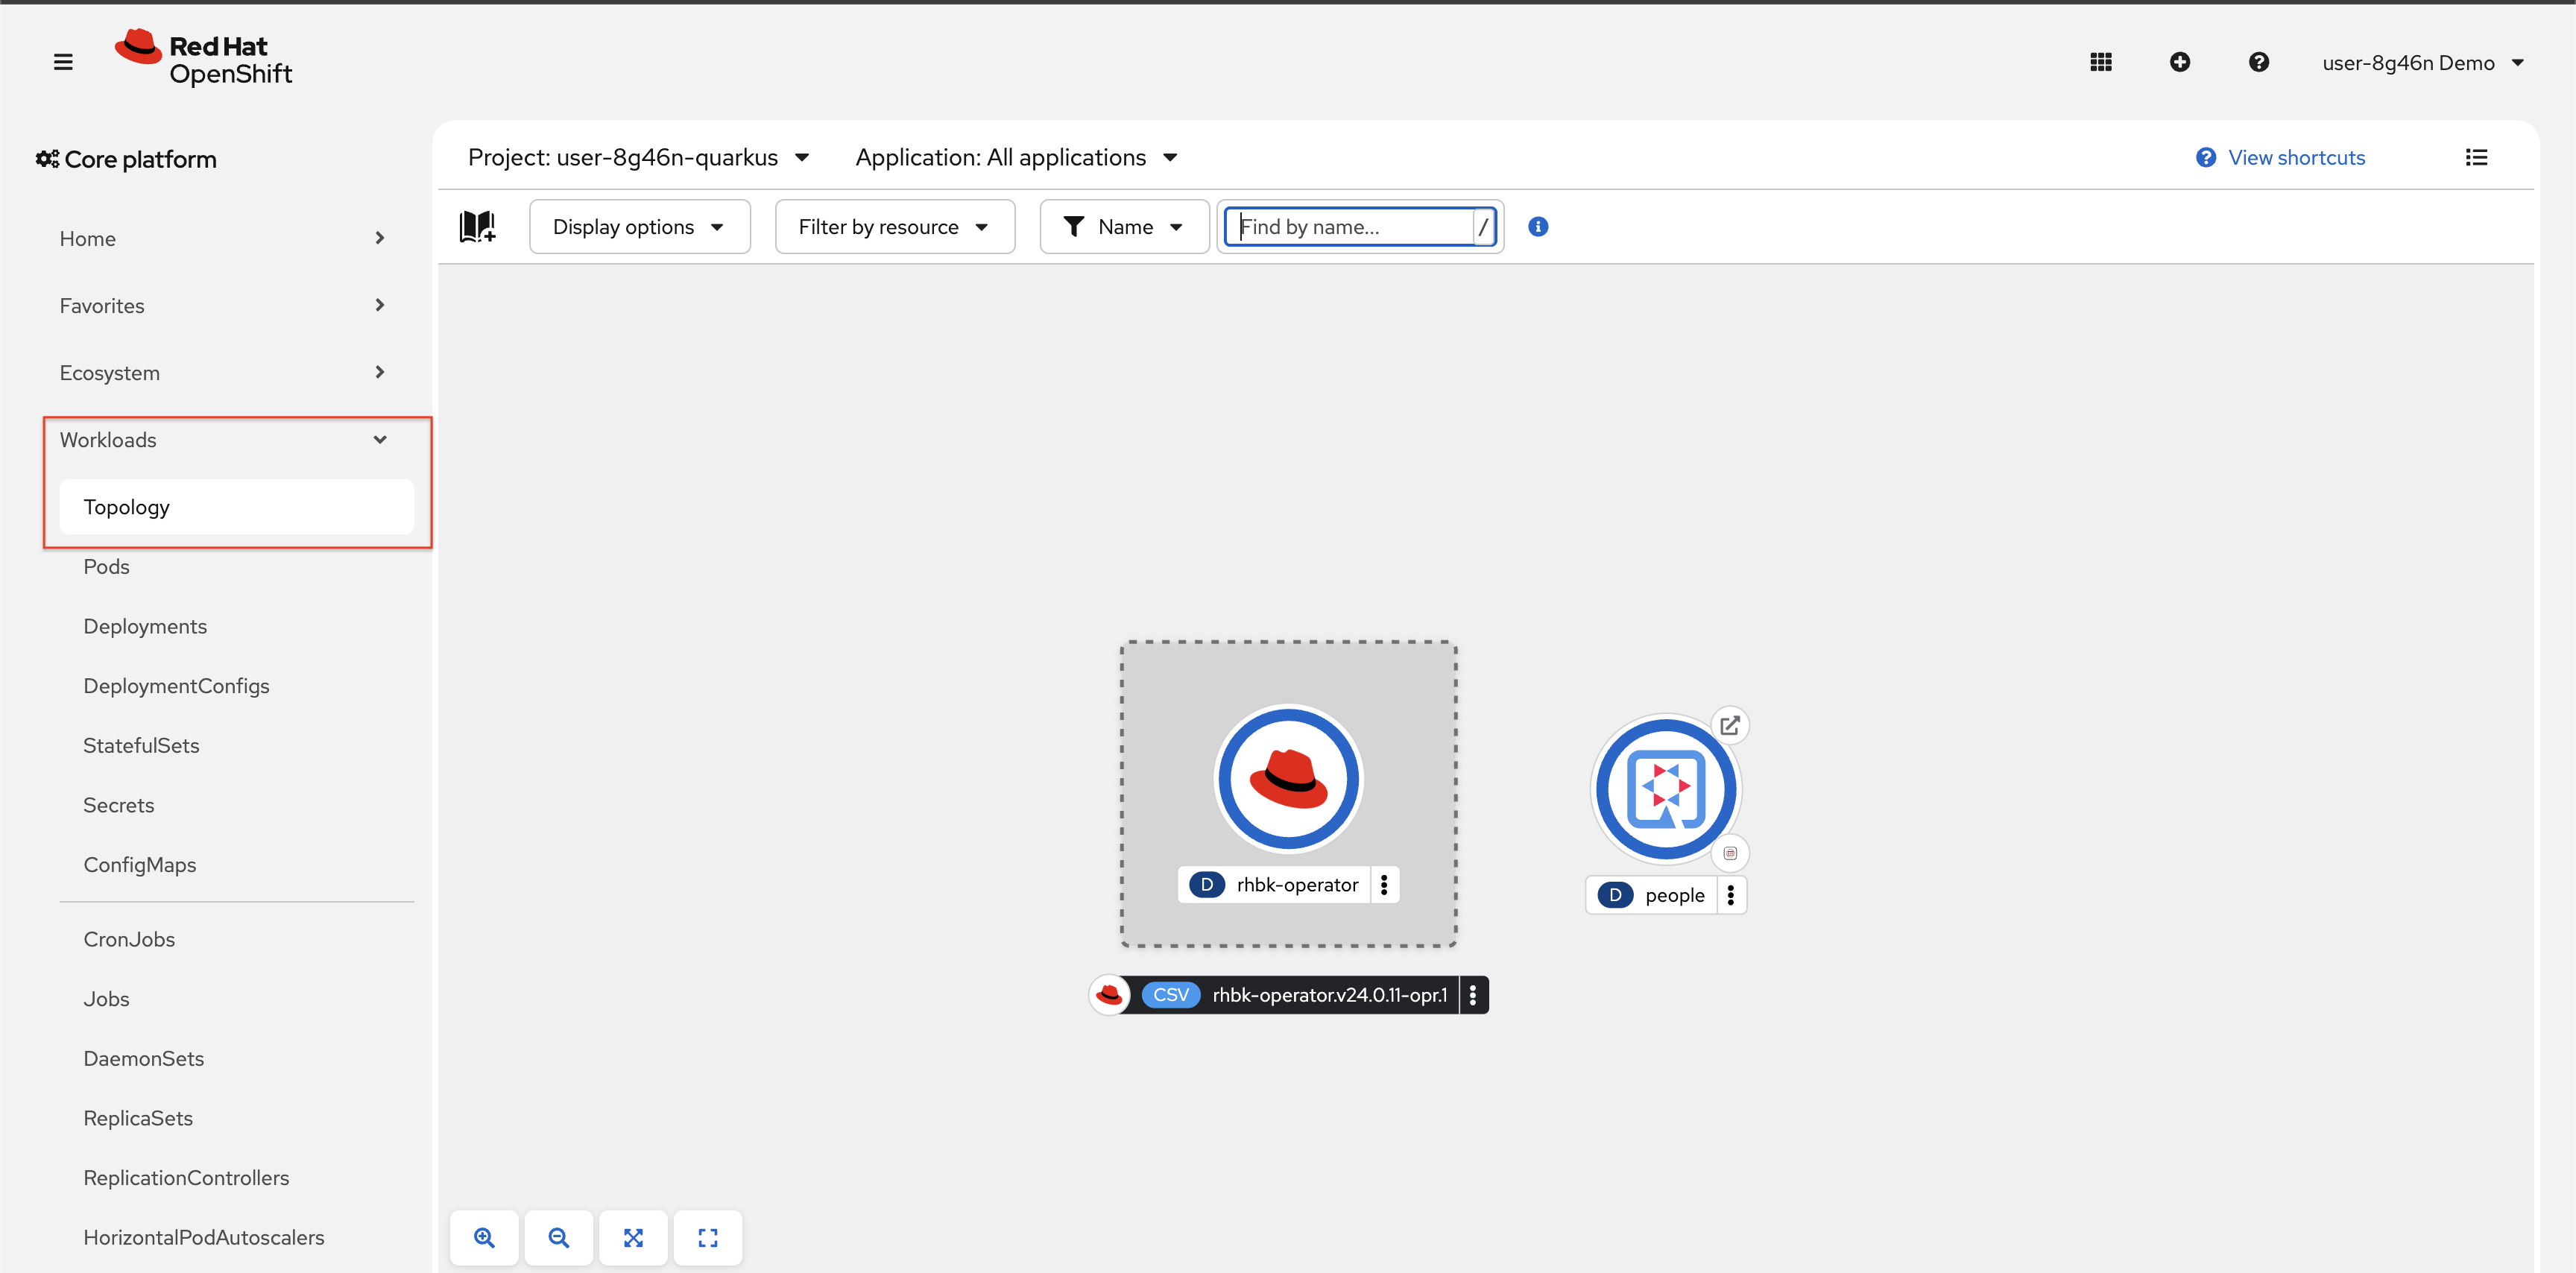
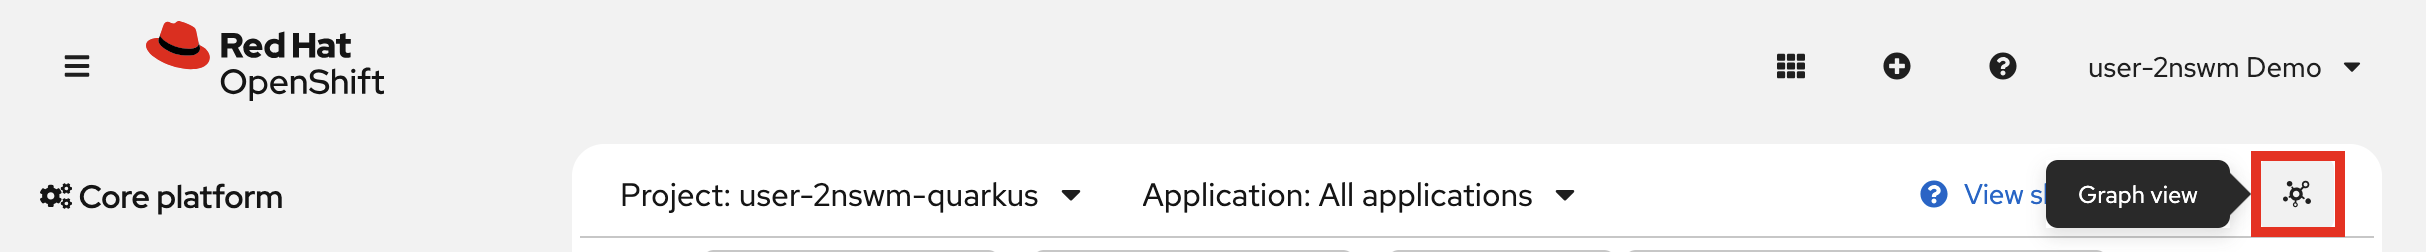
In the sidebar menu, navigate to Workloads → Topology menu.
-
If needed, switch from List view to Graph view using the view mode button in the upper right:
-
You can see the single
peopledeployment that we just deployed earlier using the CLI: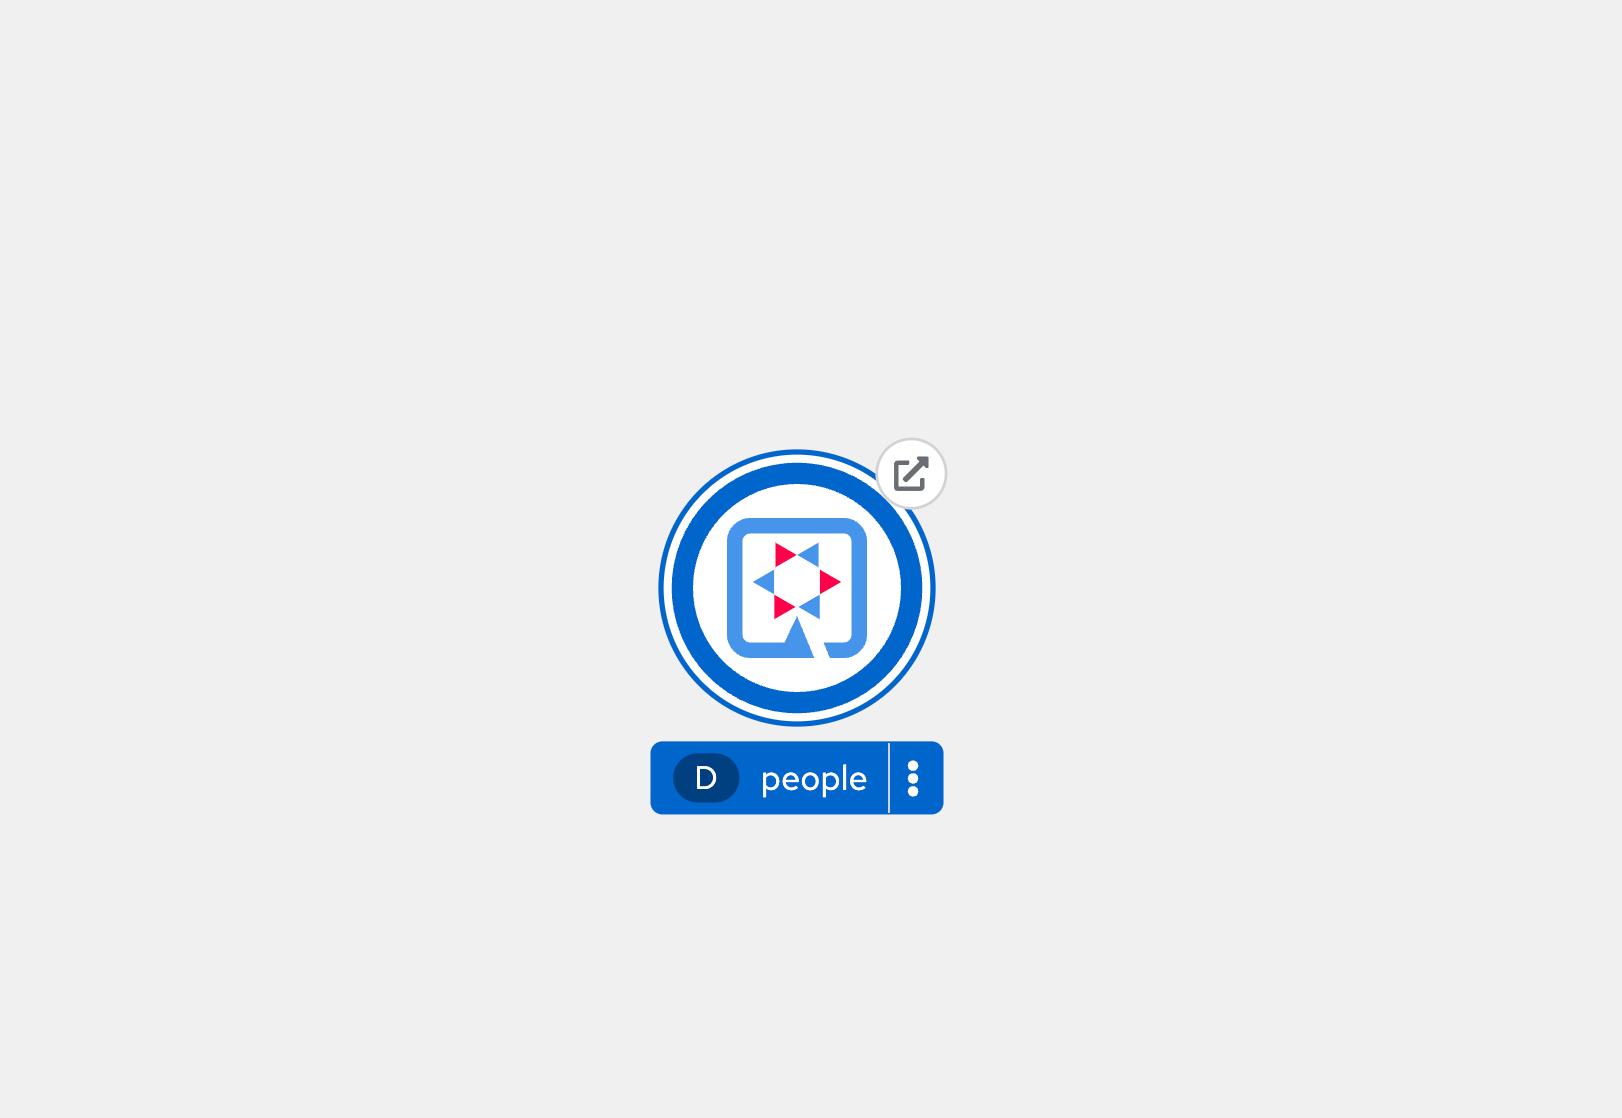
You have to restore the following configuration to
application.propertiesin thesrc/main/resourcesdirectory to access the Dev UI from the cloud IDE since the above bash script overwrote it.%dev.quarkus.dev-ui.hosts={user}-quarkus-workshop-index-webpage.{openshift_cluster_ingress_domain}