Distributed Tracing with OpenTelemetry and Tempo
This exercise shows how your Quarkus application can utilize OpenTelemetry (OTel) to provide distributed tracing for interactive web applications.
OpenTelemetry Metrics and Logging are not yet supported.
-
Quarkus now supports the OpenTelemetry Autoconfiguration for Traces. The configurations match what you can see at OpenTelemetry SDK Autoconfigure with the
quarkus.*prefix. -
Extensions and the libraries they provide, are directly instrumented in Quarkus. The use of the OpenTelemetry Agent is not needed nor recommended due to context propagation issues between imperative and reactive libraries.
In a distributed cloud-native application, multiple microservices are collaborating to deliver the expected functionality. If you have hundreds of services, how do you debug an individual request as it travels through a distributed system? For Java enterprise developers, the OpenTelemetry framework enables you to instrument, generate, collect, and export telemetry data (metrics, logs, and traces) which helps you analyze your application performance and behavior. Let’s find out how.
Install Tempo
Tempo is a distributed tracing system created by Grafana Labs. It is used for monitoring and troubleshooting microservices-based distributed systems, including:
-
Distributed context propagation
-
Distributed transaction monitoring
-
Root cause analysis
-
Service dependency analysis
-
Performance / latency optimization
You’ll use Tempo as a backend to collect the telemetry data because Tempo exposes a collector through which apps (like our People app) report tracing details. Tempo stores and reports on this tracing activity.
|
What are Traces and Spans? At the highest level, a trace tells the story of a transaction or workflow as it propagates through a (potentially distributed) system. A trace is a directed acyclic graph (DAG) of spans: named, timed operations representing a contiguous segment of work in that trace. Each component (microservice) in a distributed trace will contribute its own span or spans. |
Tempo is installed and managed through its Kubernetes Operator (just like AMQ Streams and Kafka that you used in previous exercises).
Under Ecosystem in the sidebar menu, click on Installed Operators and then select TempoMonolithic
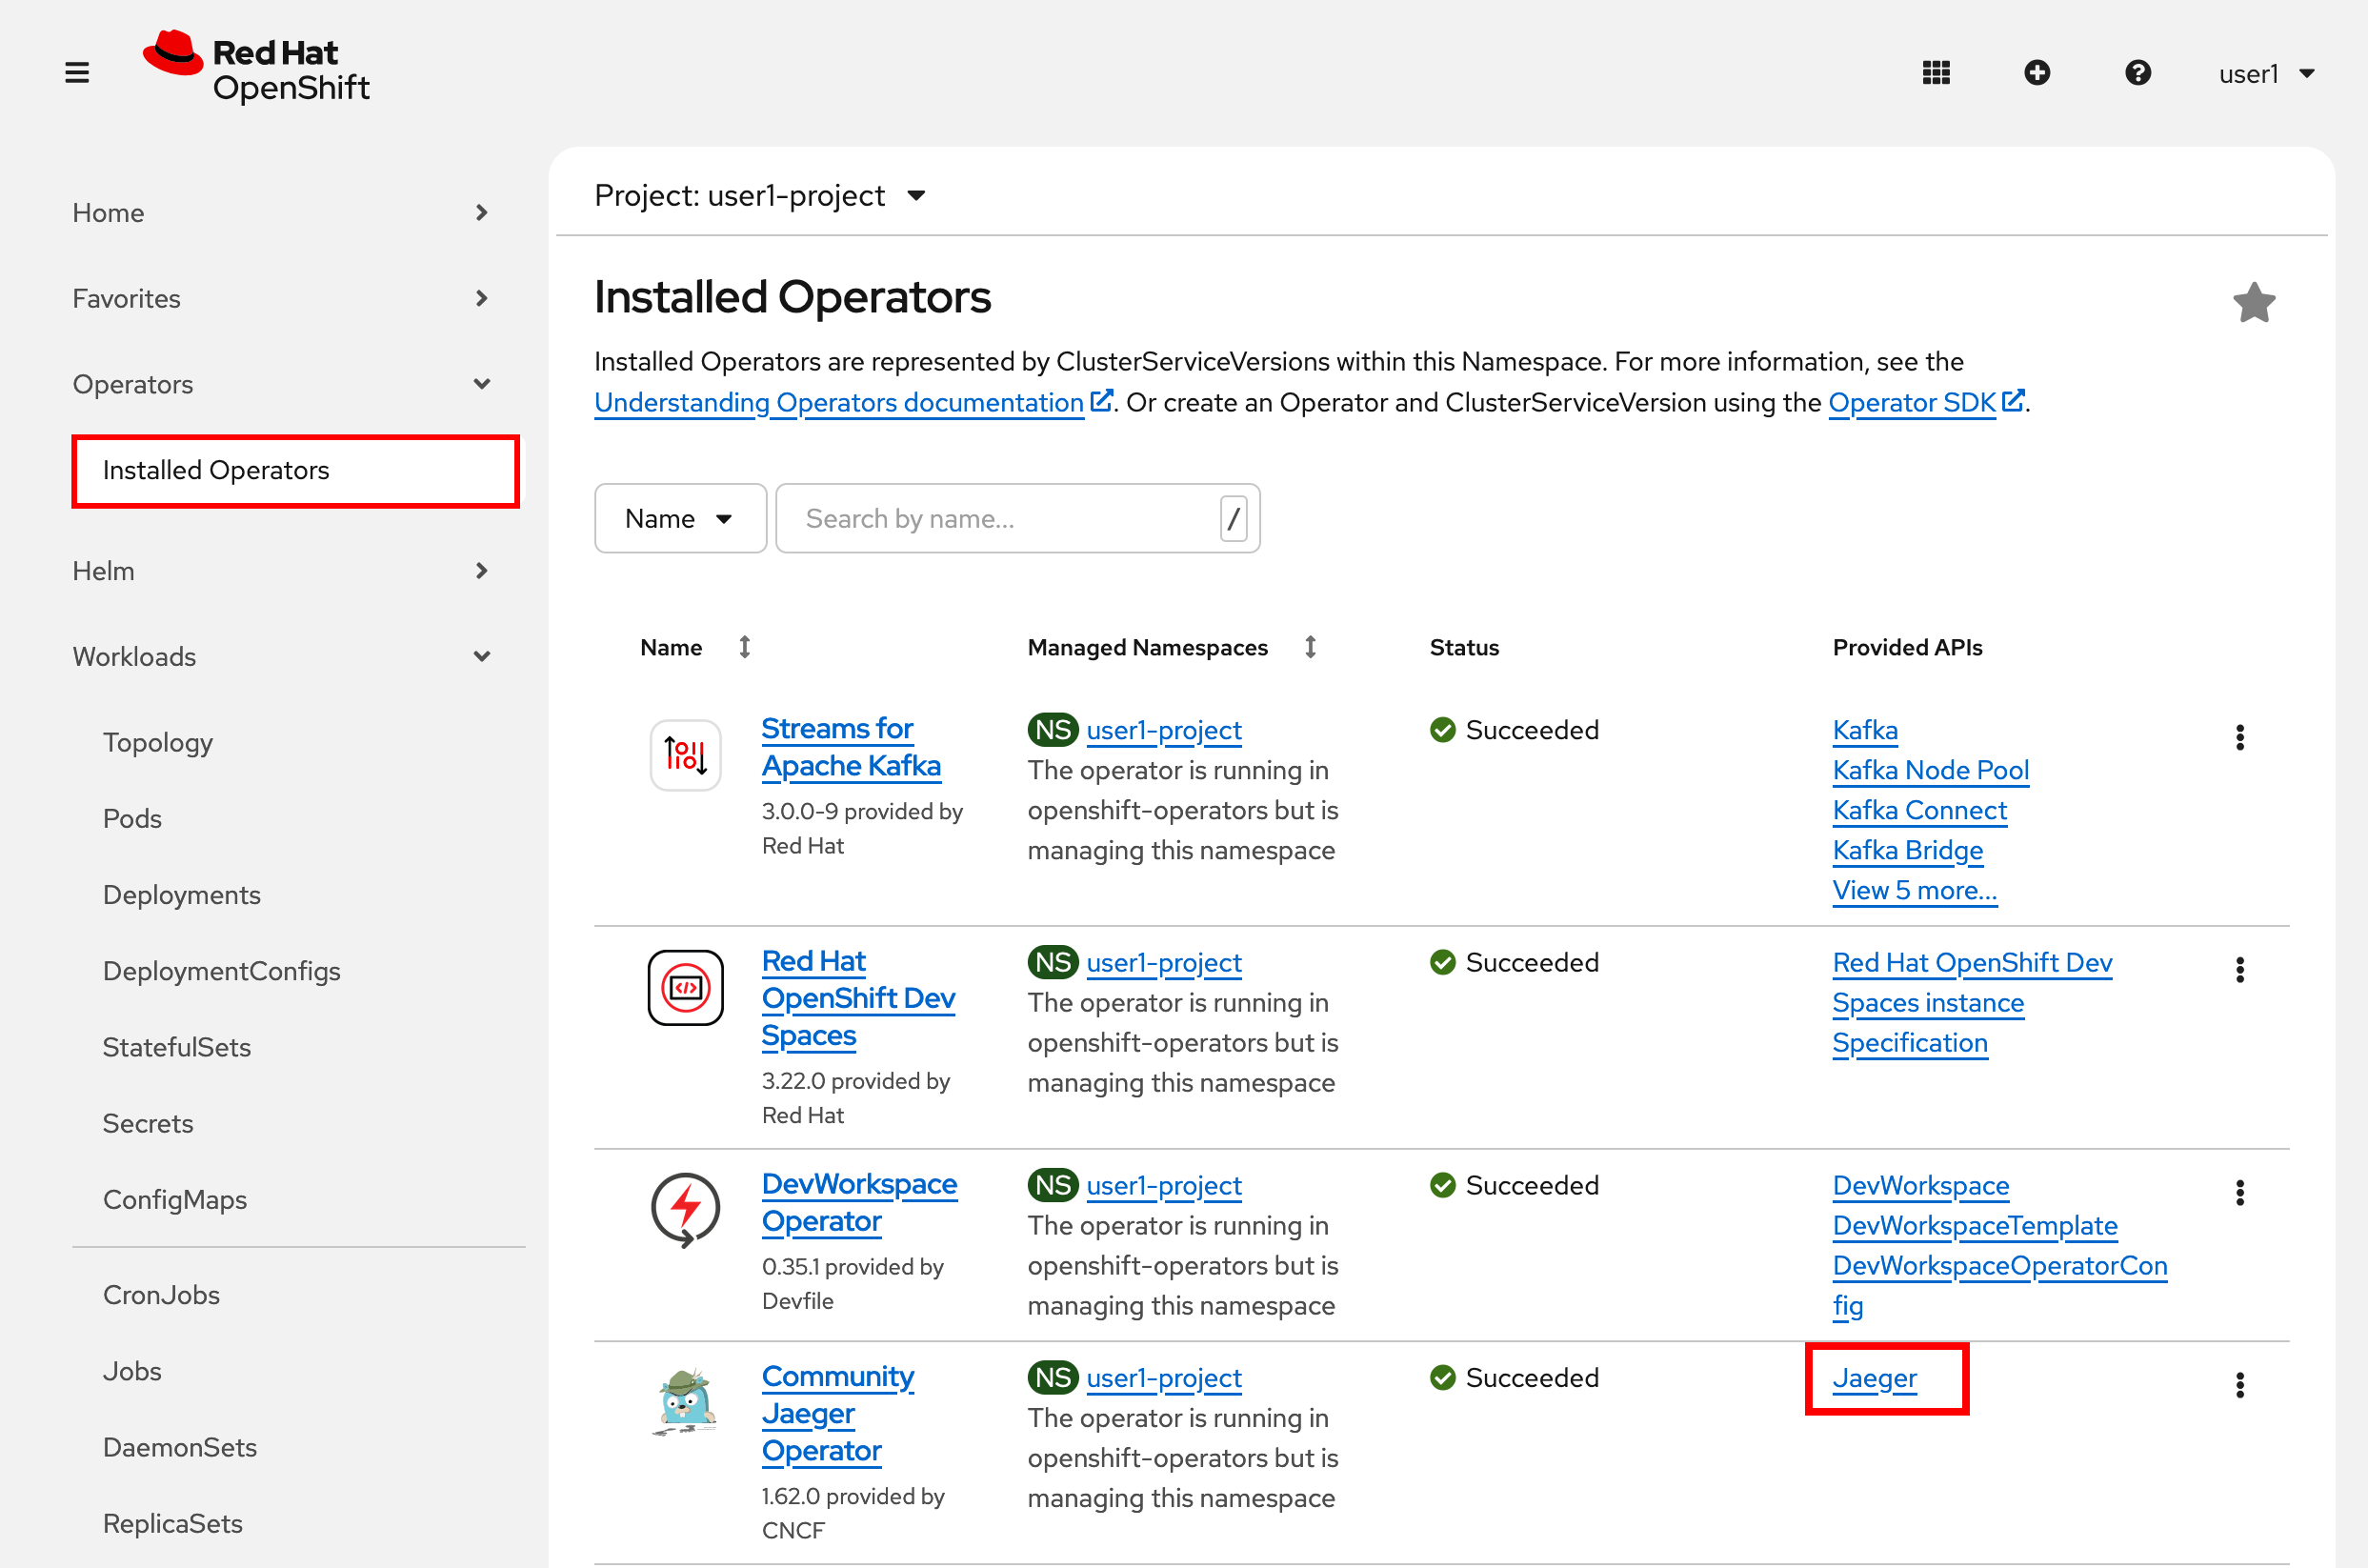
Select the Current namespace only option before clicking on the Create TempoMonolithic button:
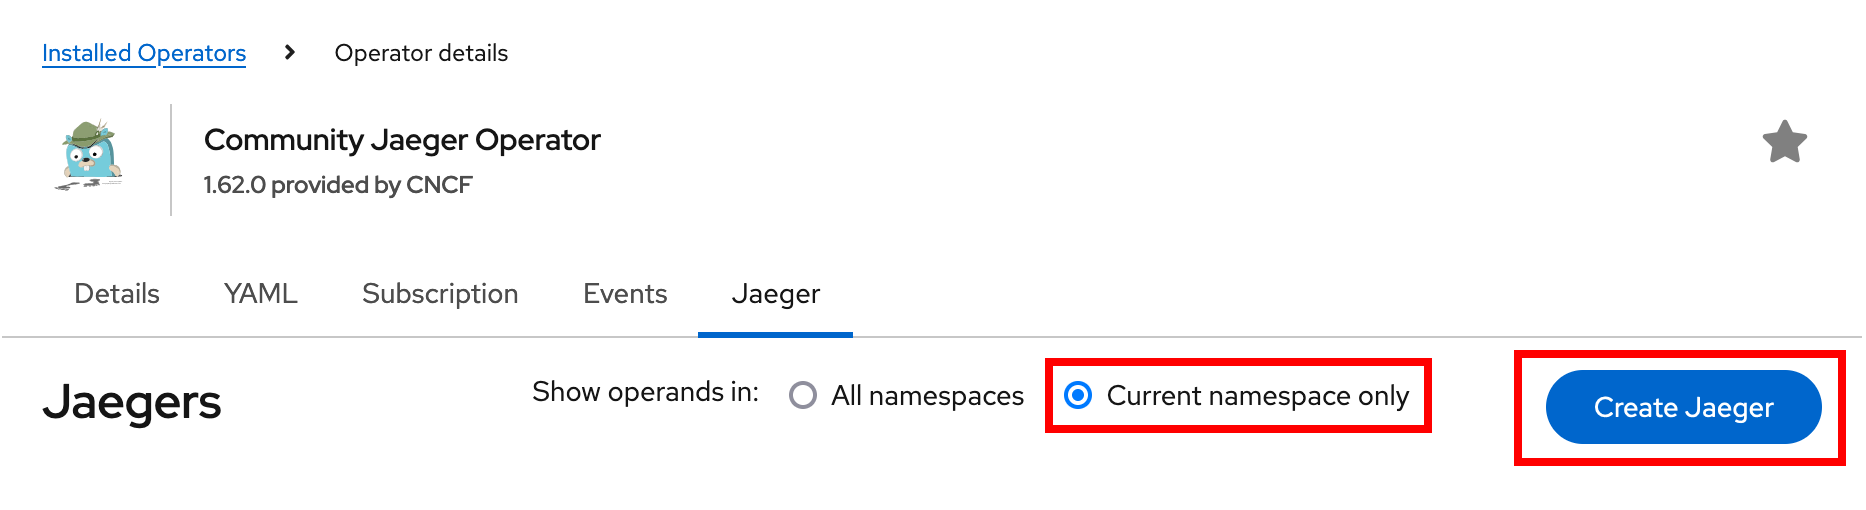
This will open a dialog for you to configure the Tempo service before it’s installed.
Change the input type to YAML, then paste in the following:
apiVersion: tempo.grafana.com/v1alpha1
kind: TempoMonolithic
metadata:
  name: tempo
spec:
  storage:
    traces:
      backend: memory
      size: 2Gi
  jaegerui:
    enabled: true
    route:
      enabled: true
Click the Create button to deploy your new TempoMonolithic instance.
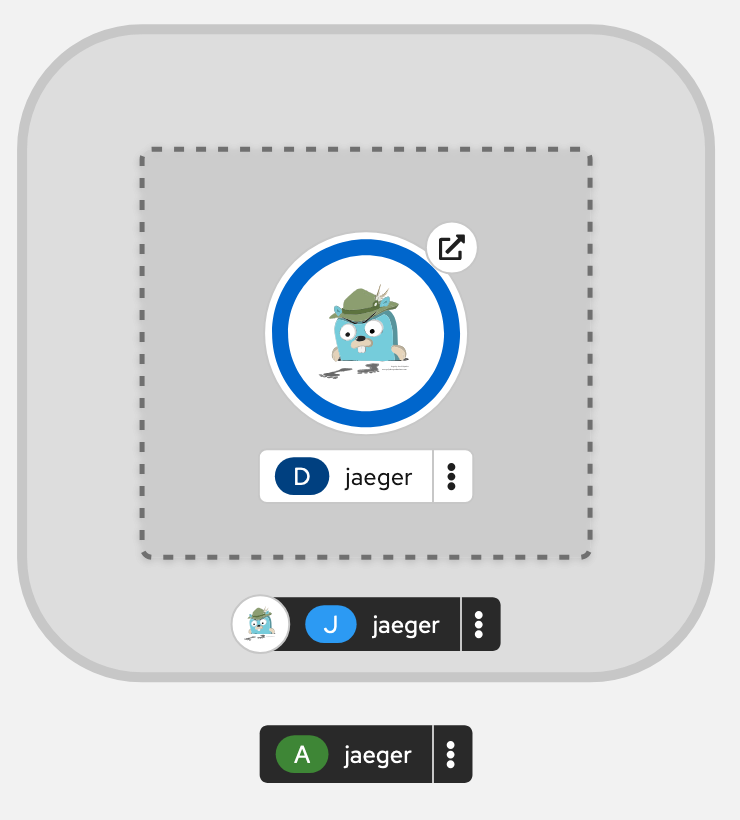
This will create a new TempoMonolithic Kubernetes object in your namespace, triggering the Operator to deploy Tempo. In the Topology View you’ll see Tempo spin up:
Tempo exposes its data at different ports for different protocols. Most interactions involve the HTTP collector at tempo-tempo:3200 but other protocols like gRPC are also supported on different ports. You can see them by clicking on the Service details:
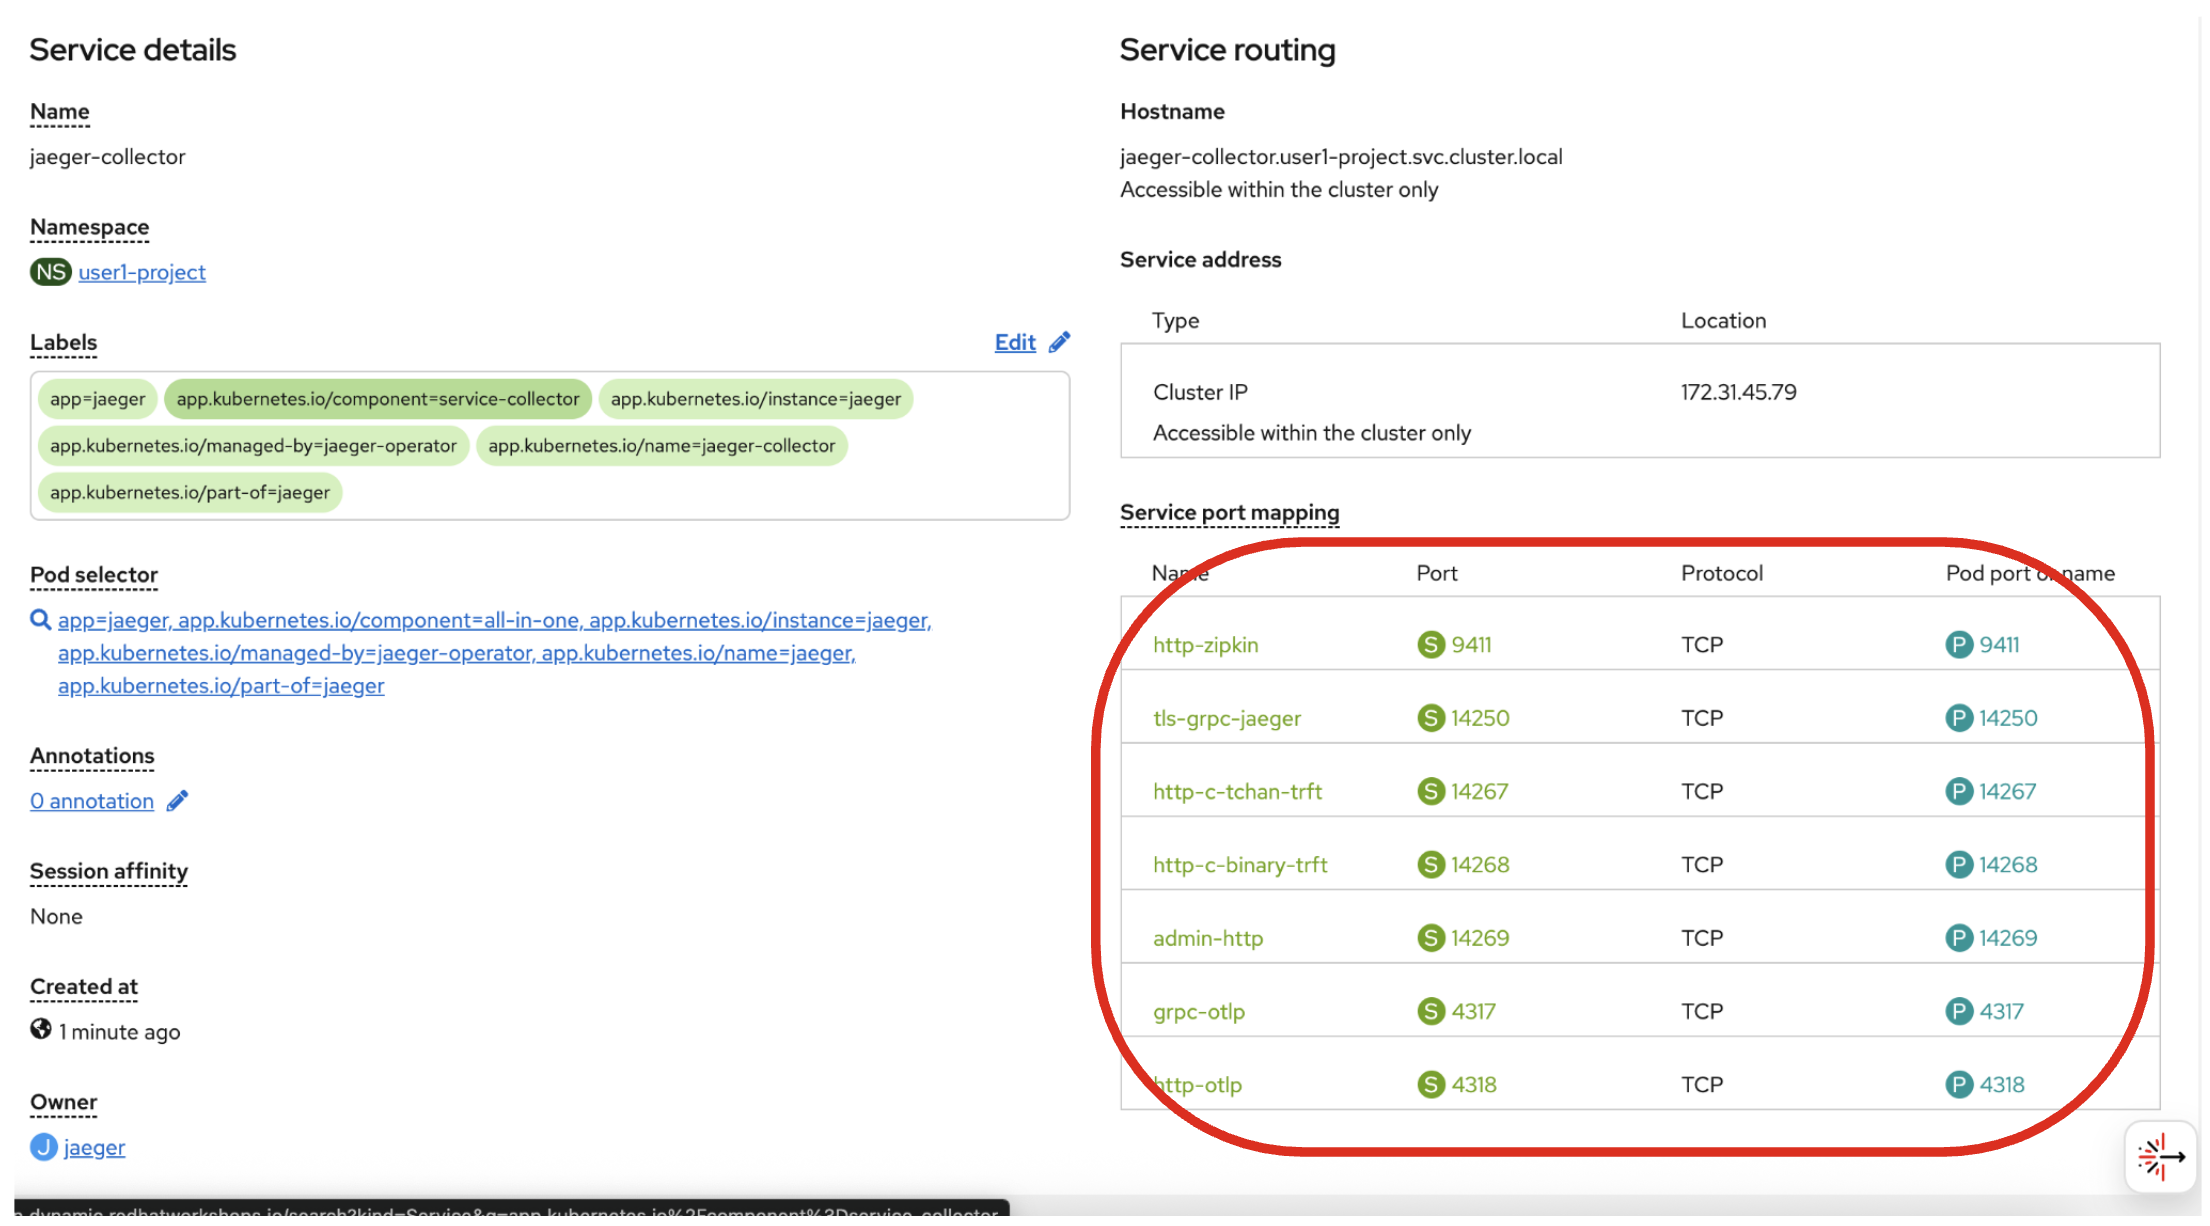
Your app will use the otlp endpoints on ports 4317 and 4318 to interact with OpenTelemetry in the next section.
Install OpenTelemetry Collector
OpenTelemetry Collector enables you to offload data quickly alongside your application services in terms of retries, batching, encryption or even sensitive data filtering. You will create an OpenTelemetry Collector to send the telemetry data to the Tempo server.
View the otel.yml in the src/main/kubernetes directory.
apiVersion: opentelemetry.io/v1beta1
kind: OpenTelemetryCollector
metadata:
  name: otel
spec:
  config:
    exporters:
      otlp/tempo:
        endpoint: tempo-tempo:4317
        tls:
          insecure: true
    receivers:
      otlp:
        protocols:
          grpc:
            endpoint: 0.0.0.0:4317
          http:
            endpoint: 0.0.0.0:4318
    service:
      pipelines:
        traces:
          receivers: [otlp]
          exporters: [otlp/tempo]
Then, run the following oc command in the VS Code terminal to setup your otel-collector:
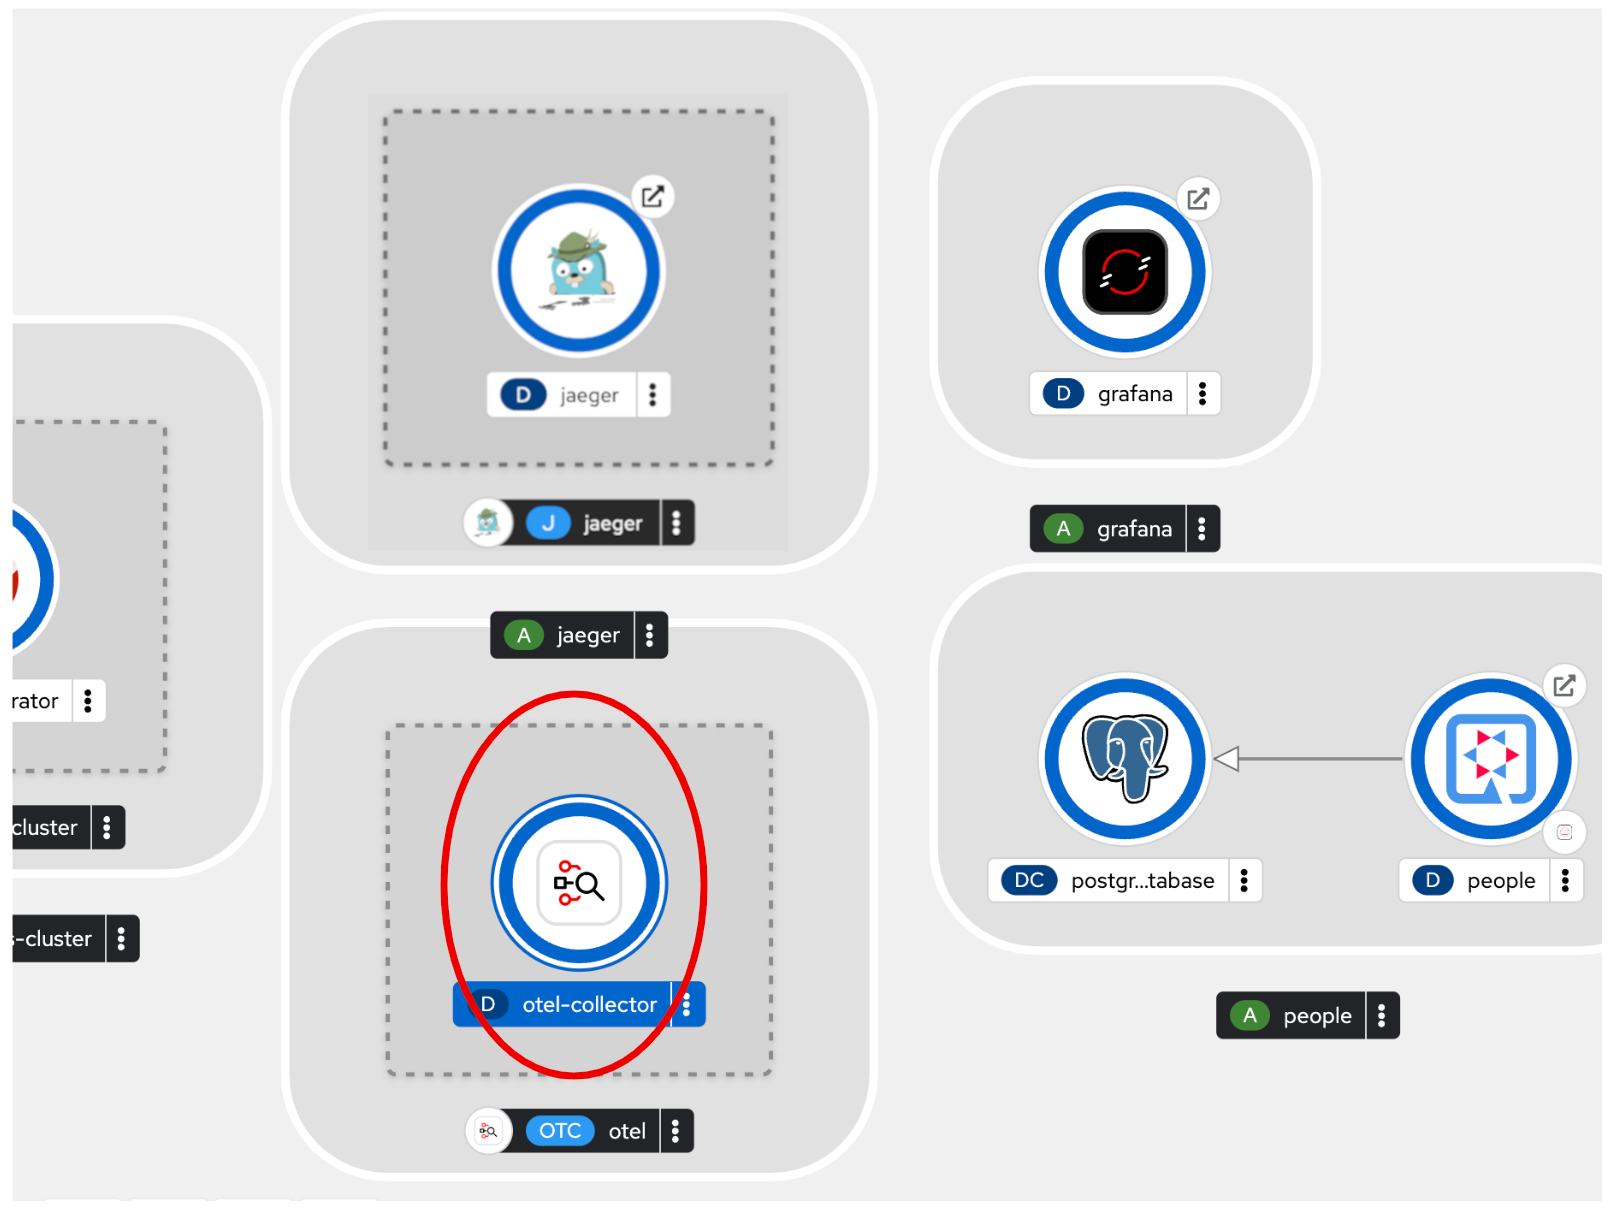
oc apply -f src/main/kubernetes/otel.ymlGo back to the Topology view, you will see the otel-collector deployed.
Add OpenTelemetry to Quarkus
With Tempo installed, let’s turn back to our Quarkus app. Like other exercises, we’ll need the following extensions to enable OpenTelemetry in our app. Install it with:
mvn quarkus:add-extension -Dextensions="quarkus-opentelemetry, rest-client, quarkus-rest-client-jackson"You will see:
[INFO] [SUCCESS] ✅  Extension io.quarkus:quarkus-rest-client has been installed
[INFO] [SUCCESS] ✅  Extension io.quarkus:quarkus-opentelemetry has been installed
[INFO] [SUCCESS] ✅  Extension io.quarkus:quarkus-rest-client-jackson has been installed
This will add the necessary entries in your pom.xml to bring in the OpenTracing capability, and an HTTP REST Client we’ll use pater.
Configure Quarkus
Next, open the application.properties file (in the src/main/resources directory). Add the following lines to it to configure Tempo to send spans via the OTLP gRPC Exporter in Quarkus:
%prod.quarkus.otel.exporter.otlp.traces.endpoint=http://otel-collector:4317Test it out
Like many other Quarkus frameworks, sensible defaults and out of the box functionality means you can get immediate value out of Quarkus without changing any code. By default, all JAX-RS endpoints (like our /hello and others) are automatically traced. Let’s see that in action by re-deploying our traced app.
Let’s re-build and re-deploy the application:
mvn clean package -DskipTests && \
oc label deployment/people app.kubernetes.io/part-of=people --overwrite && \
oc annotate deployment/people app.openshift.io/connects-to=postgres-database --overwrite
Confirm deployment
Run and wait for the app to complete its rollout:
oc rollout status -w deployment/peopleTrigger traces
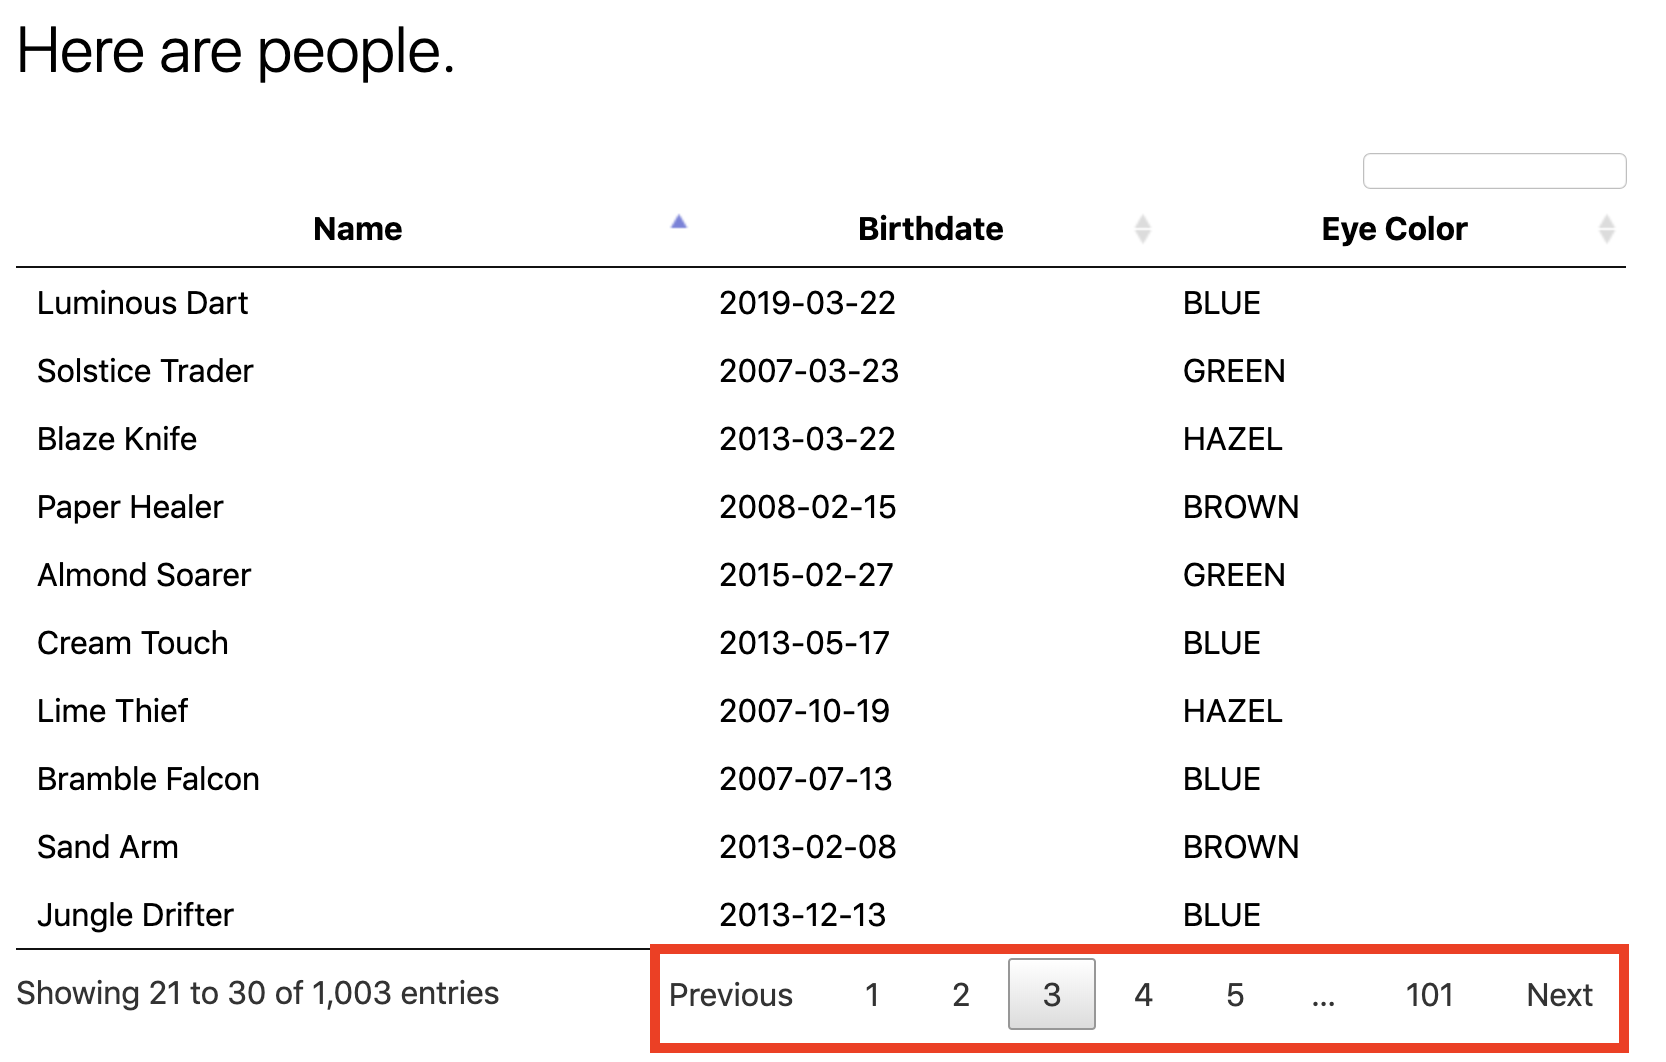
You’ll need to trigger some HTTP endpoints to generate traces. Access the graphical person browser powered by the DataTables library we created earlier.
Exercise the table a bit by paging through the entries and using various search terms to force several RESTful calls back to our app:
Inspect traces
Open the Jaeger Query UI. By default, Tempo offers a Jaeger UI that uses the same login details as OpenShift, so click the Login with OpenShift button and enter your credentials:
-
Username:
{user} -
Password:
{password}
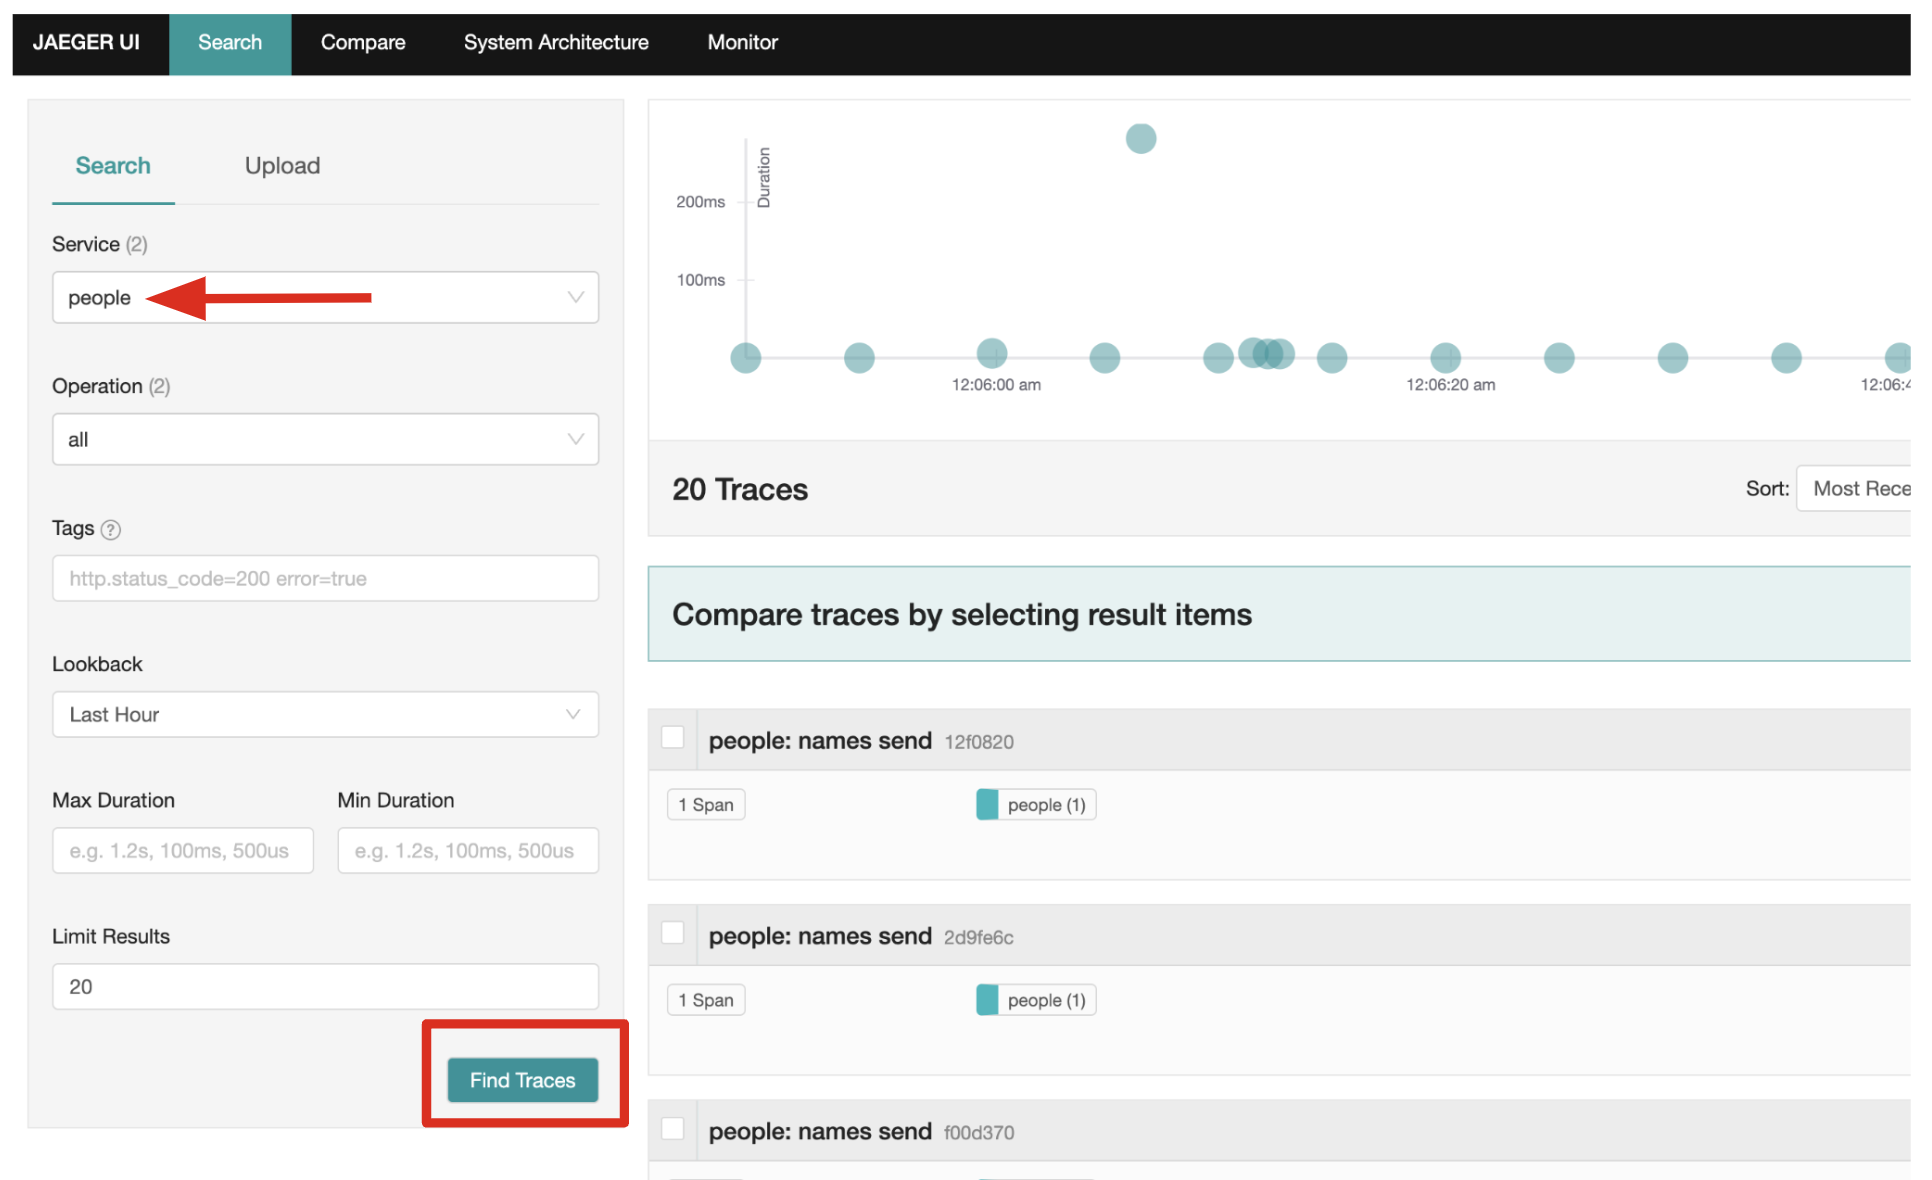
Then, click Allow Selected Permissions to allow Tempo to access your account details. You’ll end up on the Jaeger query page. Using the menu on the left, select the people Service, and click Find Traces. Jaeger will show the collected traces on the right:
Select one of the traces from "a few seconds ago" to show the individual spans of each trace:
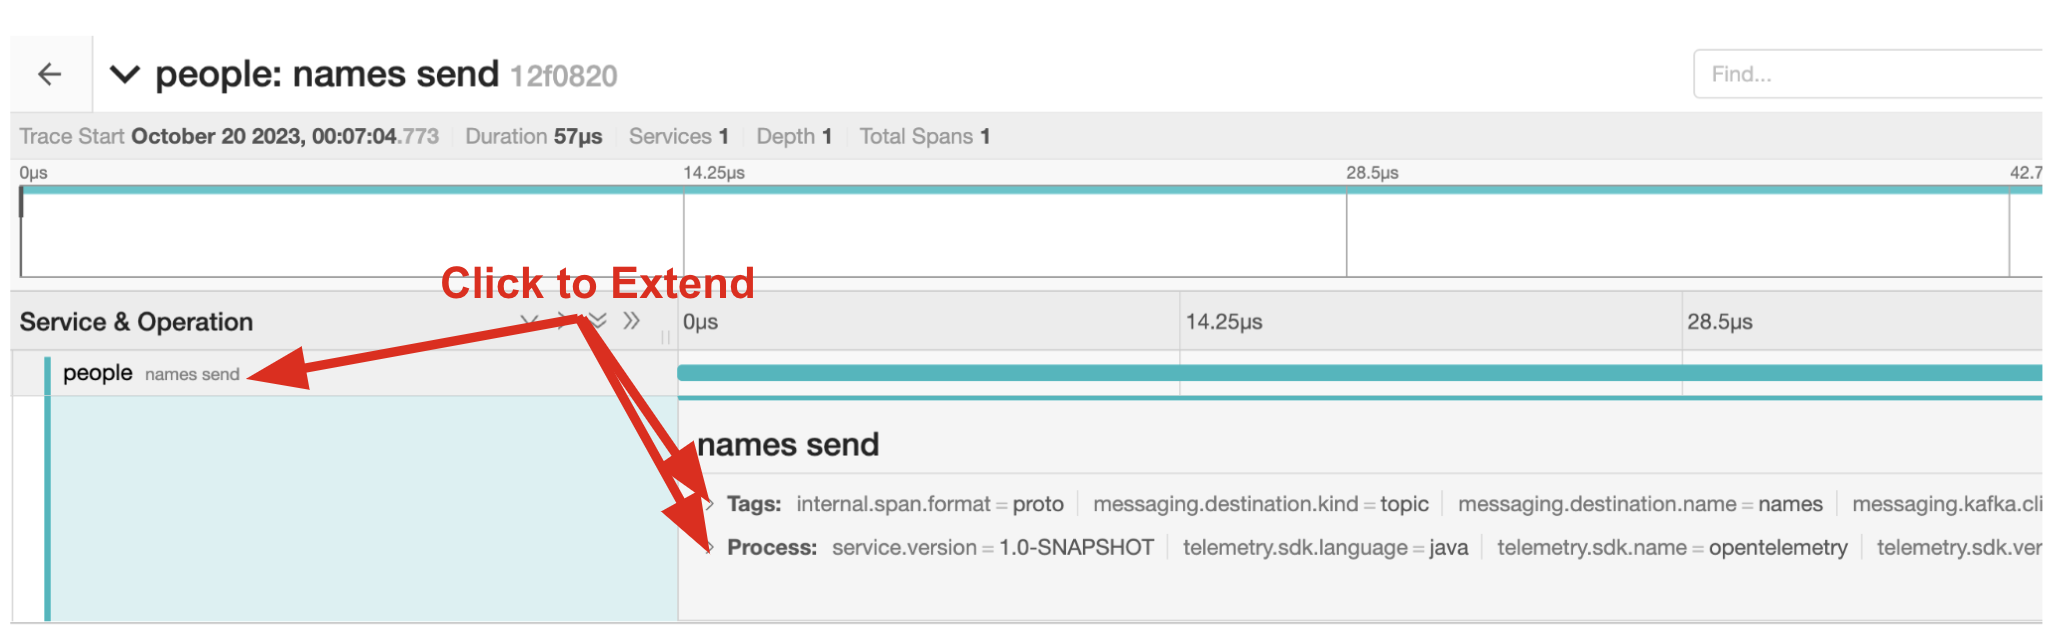
You can see that this trace (along with the others) shows the incoming HTTP GET operation to the /datatable endpoint we created earlier, along with the time it took, and other ancillary info about the request. Not terribly interesting as it’s a single call, but you can imagine with a real world app and multiple microservices working together, that traces could reveal a lot of detail.
|
Service Mesh technologies like Istio can provide even more tracing prowess as the calls across different services are traced at the network level, not requiring any frameworks or developer instrumentation to be enabled for tracing. |
Tracing external calls
This exercise shows how to use the MicroProfile REST Client with Quarkus in order to trace external, outbound requests with very little effort.
We will use the publicly available Star Wars API to fetch some characters from the Star Wars universe. Our first order of business is to setup the model we will be using, in the form of a StarWarsPerson POJO.
Create model
Create a new class file in the org.acme.people.model package called StarWarsPerson.java with the following content:
package org.acme.people.model;

public class StarWarsPerson {

    private String name;
    private String mass;

    public String getName() {
        return name;
    }

    public void setName(String name) {
        this.name = name;
    }

    public String getMass() {
        return mass;
    }

    public void setMass(String mass) {
        this.mass = mass;
    }
}
This contains a subset of the full Star Wars model, just enough to demonstrate tracing.
Create interface
Using the MicroProfile REST Client is as simple as creating an interface using the proper JAX-RS and MicroProfile annotations. Create a new Java class file in the org.acme.people.service package called StarWarsService.java with the following content:
package org.acme.people.service;

import org.acme.people.model.StarWarsPerson;
import org.eclipse.microprofile.rest.client.annotation.ClientHeaderParam;
import org.eclipse.microprofile.rest.client.inject.RegisterRestClient;

import jakarta.ws.rs.GET;
import jakarta.ws.rs.Path;
import jakarta.ws.rs.PathParam;
import jakarta.ws.rs.Produces;

@RegisterRestClient //(1)
@Path("/api") //(2)
public interface StarWarsService {

    @GET
    @Path("/people/{id}") //(2)
    @Produces("application/json") //(3)
    @ClientHeaderParam(name="User-Agent", value="QuarkusLab") //(4)
    StarWarsPerson getPerson(@PathParam("id") int id); //(5)
}| 1 | @RegisterRestClient allows Quarkus to know that this interface is meant to be available for CDI injection as a REST Client |
| 2 | @Path, @GET and @PathParam are the standard JAX-RS annotations used to define how to access the service |
| 3 | While @Consumes and @Produces are optional as auto-negotiation is supported, it is heavily recommended to annotate your endpoints with them to define precisely the expected content types. It will also allow to narrow down the number of JAX-RS providers (which can be seen as converters) included in the native executable. |
| 4 | The Star Wars API requires a User-Agent header, so with Quarkus we add that with @ClientHeaderParam. Other parameters can be added here as needed. |
| 5 | The getPerson method gives our code the ability to query the Star Wars API by id. The client will handle all the networking and marshalling leaving our code clean of such technical details. |
Configure endpoint
In order to determine the base URL to which REST calls will be made, the REST Client uses configuration from application.properties. To configure it, add this to your application.properties (in src/main/resources):
org.acme.people.service.StarWarsService/mp-rest/url=https://swapi.infoHaving this configuration means that all requests performed using our code will use https://swapi.info as the base URL.
Note that org.acme.people.service.StarWarsService must match the fully qualified name of the StarWarsService interface we created in the previous section.
Using the configuration above, calling the getPerson(int) method of StarWarsService with a value of 1 would result in an HTTP GET request being made to https://swapi.info/api/people/1/. Confirm you can access the Star Wars API using curl:
curl -s https://swapi.info/api/people/1 | jqYou should get Luke Skywalker back:
{
  "name": "Luke Skywalker",
  "height": "172",
  "mass": "77",
  "hair_color": "blond",
  "skin_color": "fair",
  "eye_color": "blue",
  "birth_year": "19BBY",
  "gender": "male",
  "homeworld": "https://swapi.info/api/planets/1/",
  ....<more here>....
}
Final step: add endpoint
We need to @Inject an instance of our new StarWarsService and call it. Open the existing PersonResource class and add the following injected field and method:
    @Inject
    @RestClient
    StarWarsService swService; //(1)

    @GET
    @Path("/swpeople")
    @Produces(MediaType.APPLICATION_JSON)
    public List<StarWarsPerson> getCharacters() {
        return IntStream.range(1, 6) //(2)
            .mapToObj(swService::getPerson)  //(3)
            .collect(Collectors.toList());  //(4)
}| 1 | Our injected service |
| 2 | Generate a stream of 5 integers that we will use as IDs to pass to the service |
| 3 | For each of the integers, call the StarWarsService::getPerson method |
| 4 | Collect the results into a list and return it |
You’ll need to add a few imports at the top of the file:
import org.acme.people.model.StarWarsPerson;
import org.acme.people.service.StarWarsService;
import org.eclipse.microprofile.rest.client.inject.RestClient;
import java.util.stream.IntStream;
Test it out
Let’s re-build and re-deploy the application:
mvn clean package -DskipTests && \
oc label deployment/people app.kubernetes.io/part-of=people --overwrite && \
oc annotate deployment/people app.openshift.io/connects-to=postgres-database --overwrite
Confirm deployment
Run and wait for the app to complete its rollout:
oc rollout status -w deployment/peopleTrigger traces
Access the endpoint by running the following command:
curl -s https://$(oc get route people -o=go-template --template='{{ .spec.host }}')/person/swpeople | jqYou should see:
[
  {
    "mass": "77",
    "name": "Luke Skywalker"
  },
  {
    "mass": "75",
    "name": "C-3PO"
  },
  {
    "mass": "32",
    "name": "R2-D2"
  },
  {
    "mass": "136",
    "name": "Darth Vader"
  },
  {
    "mass": "49",
    "name": "Leia Organa"
  }
]
Inspect traces
Reload the Jaeger Query UI. Then, select GET /person/swpeople in the Operation and click Find Traces.
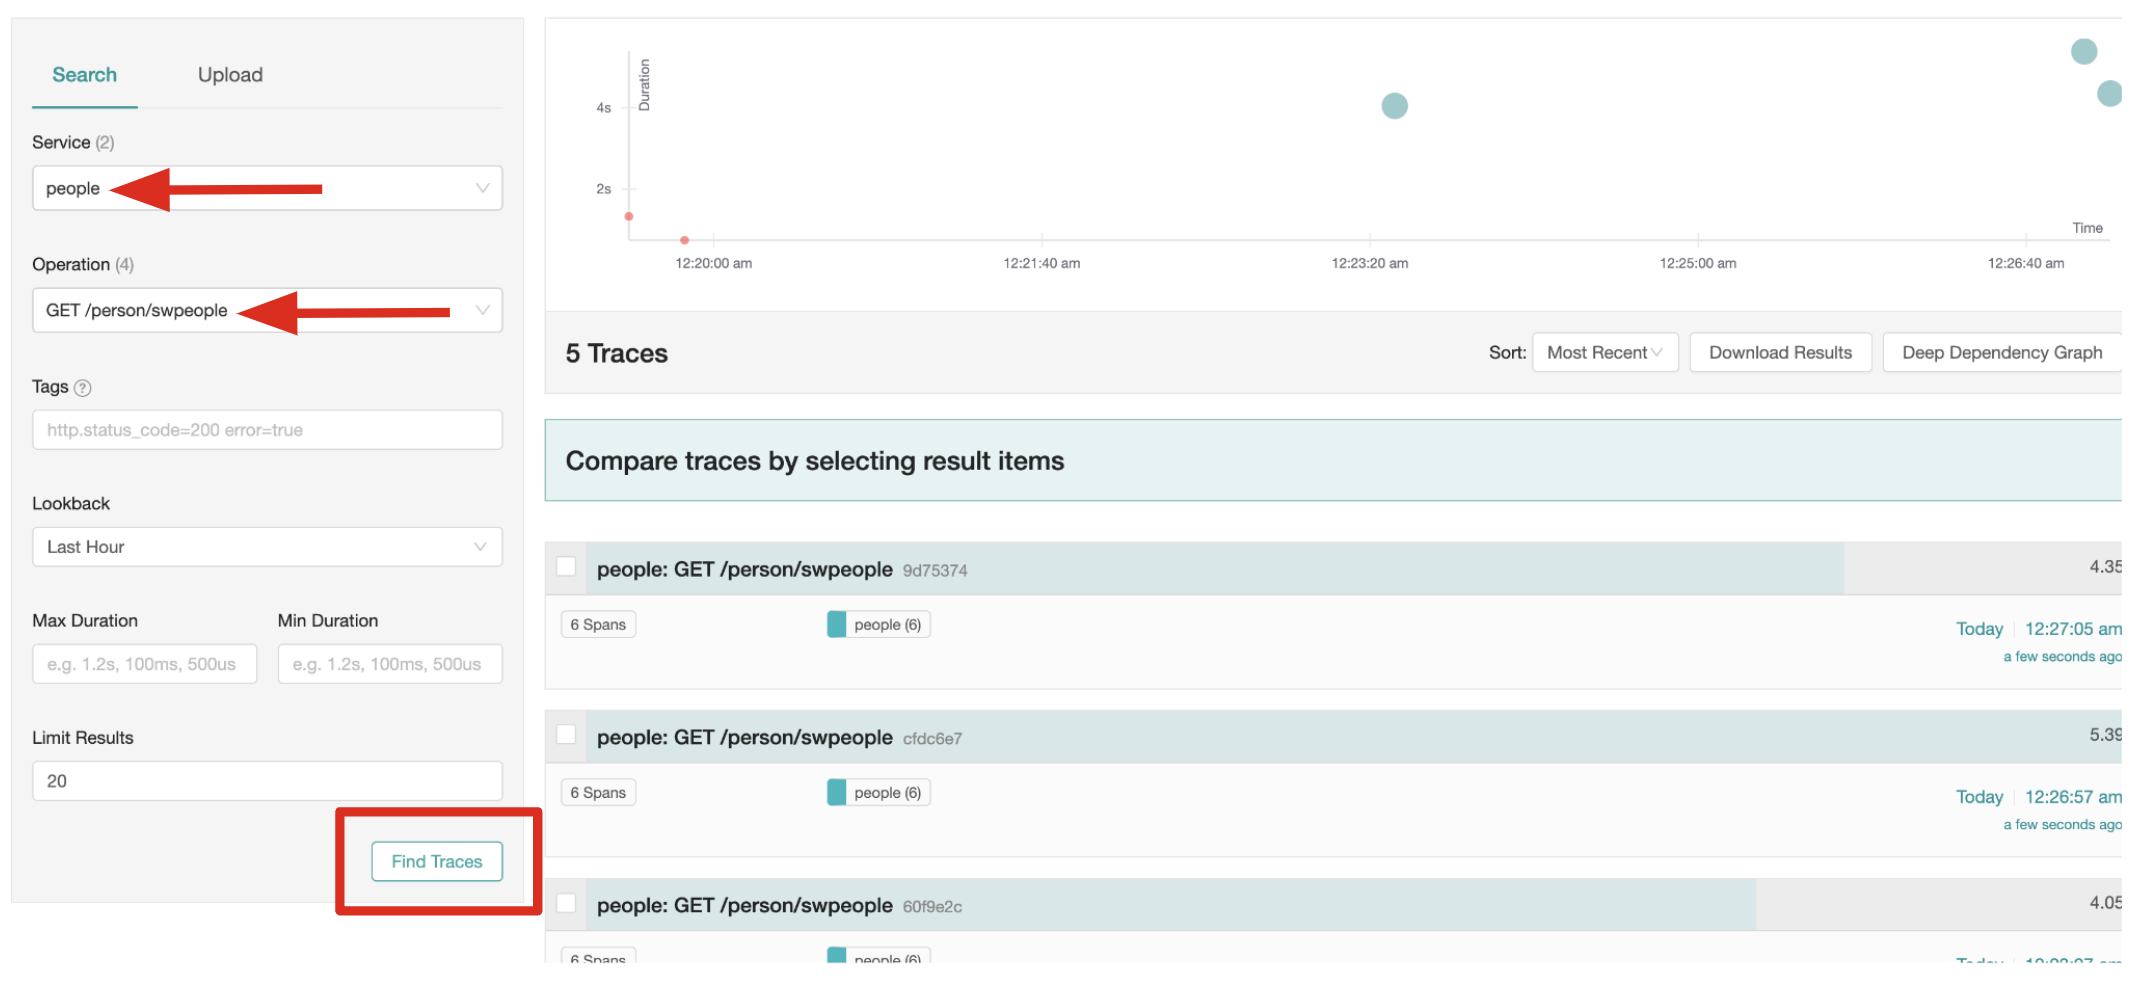
The new trace should appear the top with multiple spans. Select it to display details:
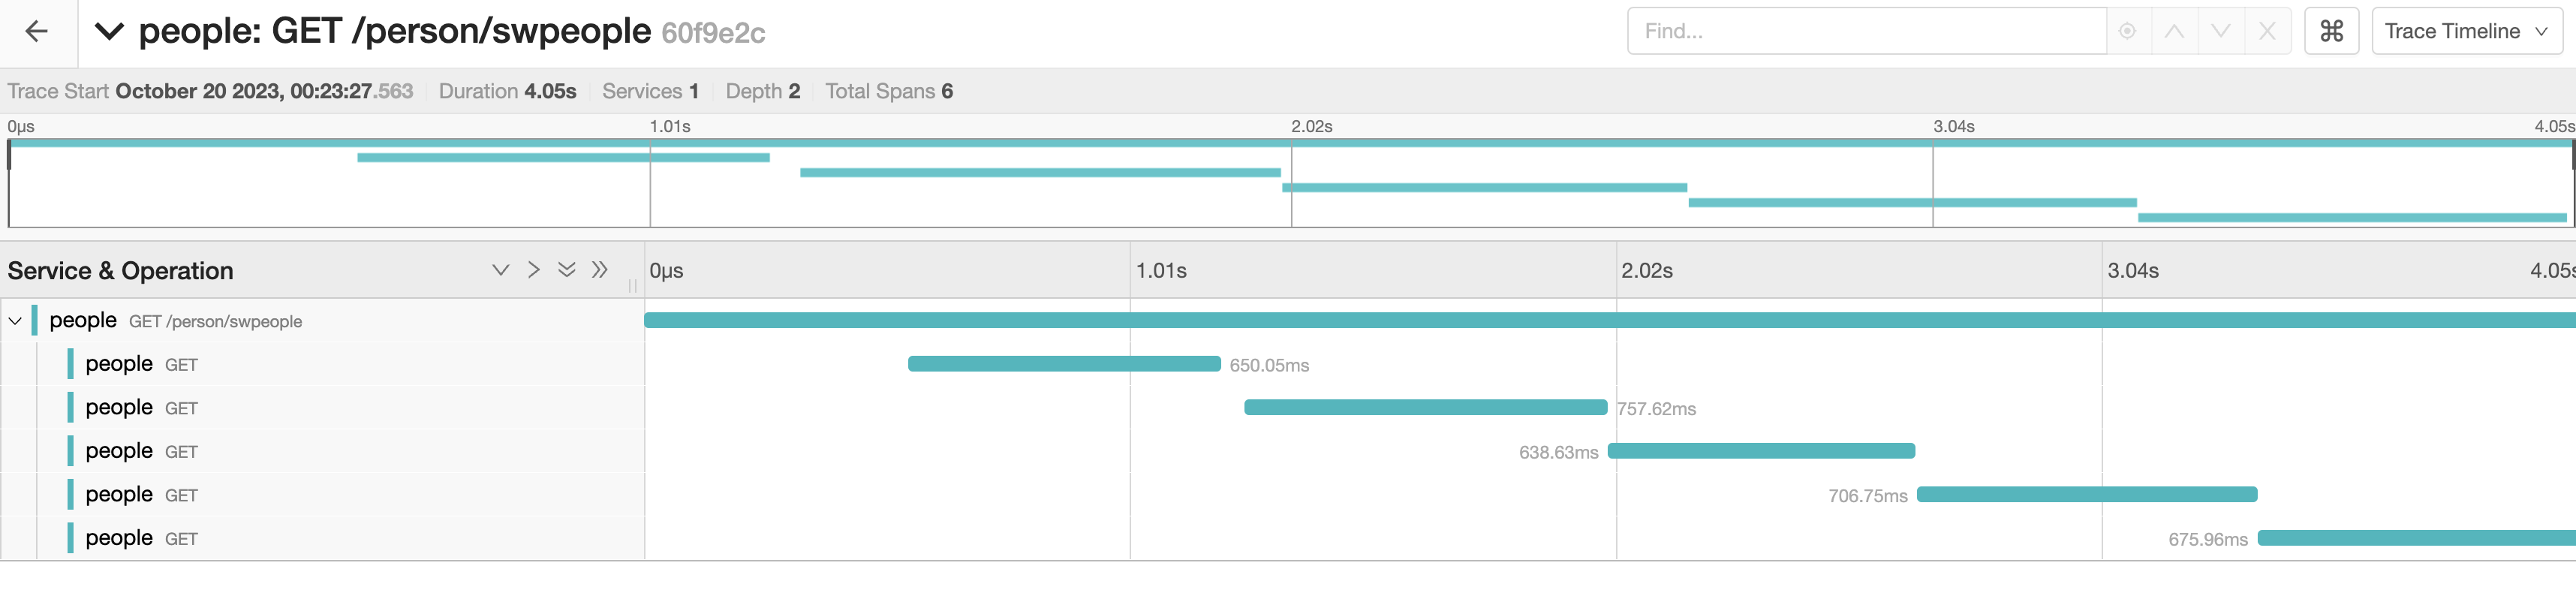
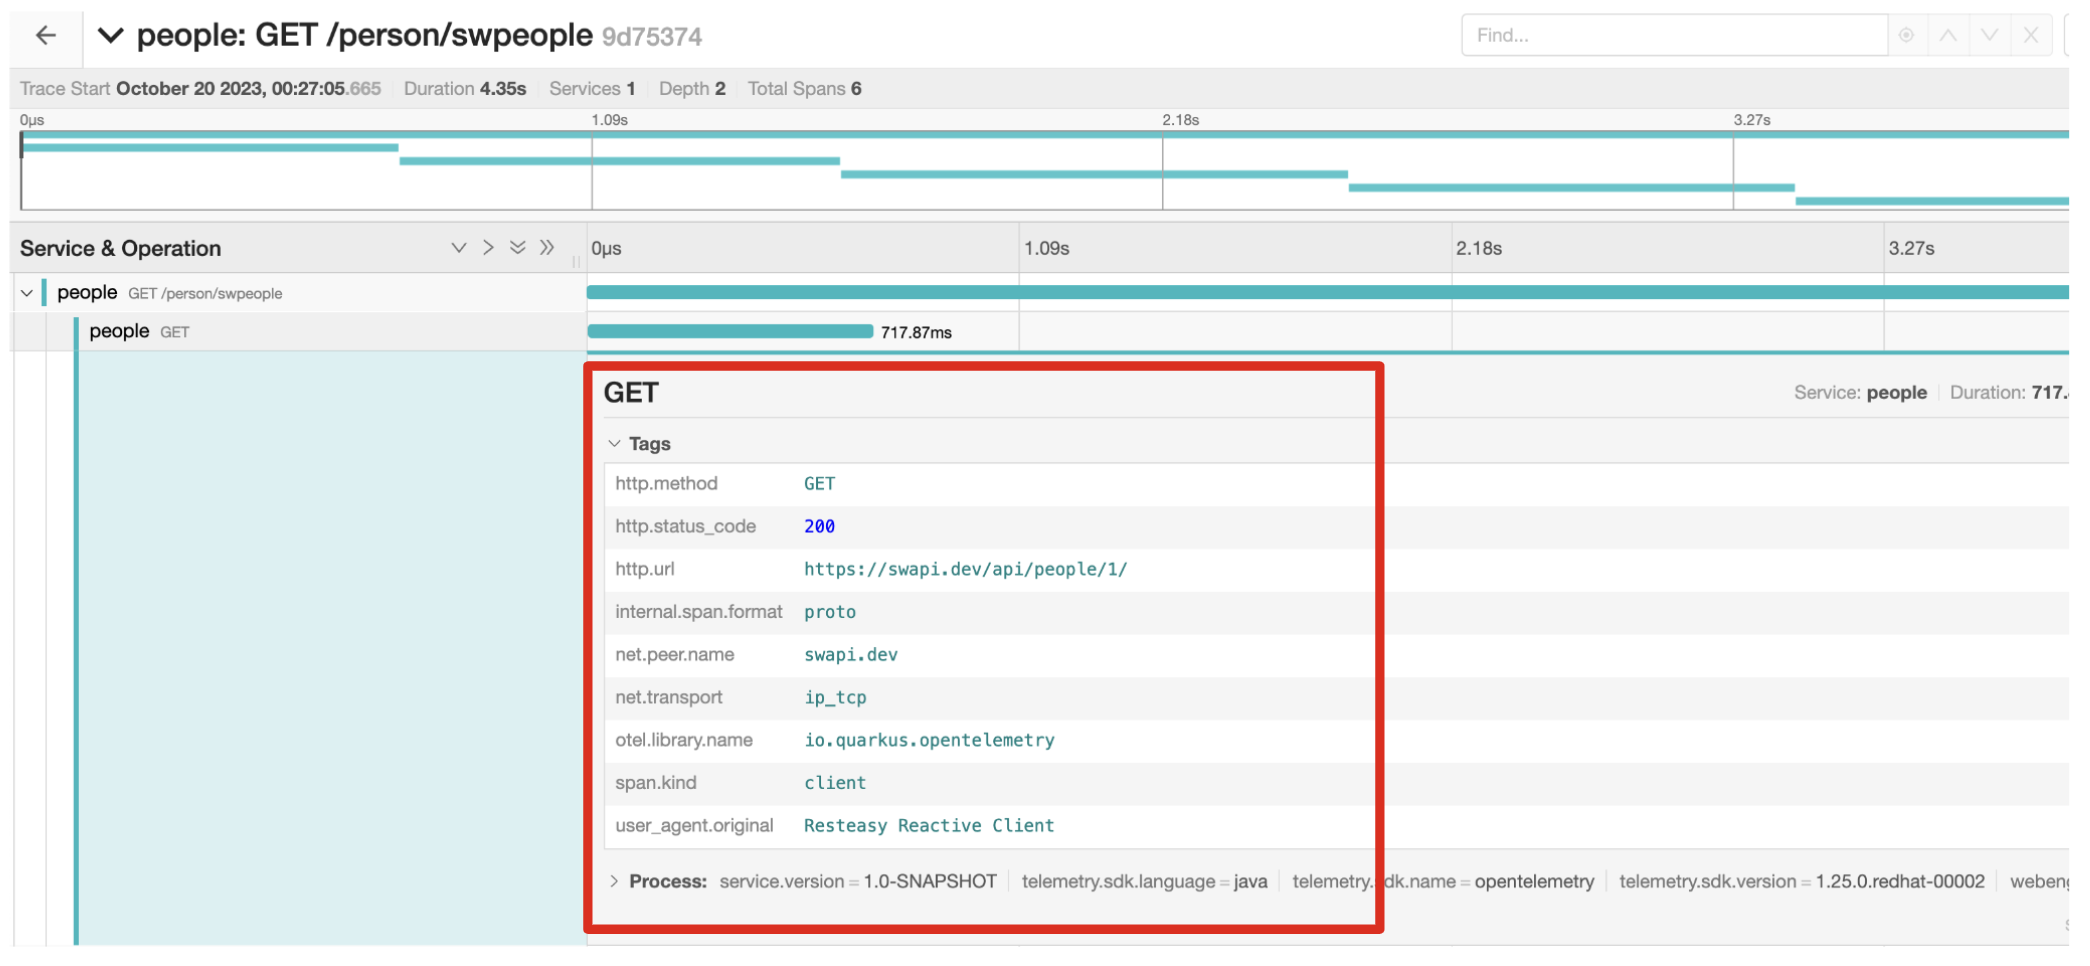
You can see that this trace (along with the others) shows multiple spans: the incoming HTTP GET operation to the /swperson endpoint we created earlier, and the external calls to the Star Wars API. Expand the traces to show the detail:
Extra credit: Explicit method tracing
An annotation is provided to define explicit Span creation. This works on top of the "no-action" setup we did in the previous steps.
The @Traced annotation, applies to a class or a method. When applied to a class, the @Traced annotation is applied to all methods of the class. If the annotation is applied to a class and method then the annotation applied to the method takes precedence. The annotation starts a Span at the beginning of the method, and finishes the Span at the end of the method.
If you have time after this workshop, add a @Traced annotation to some of the other methods and test them out.
Congratulations!
You’ve seen how to enable automatic tracing for JAX-RS methods as well as create custom tracers for non-JAX-RS methods and external services by using OpenTelemetry and Tempo. This specification makes it easy for Quarkus developers to instrument services with distributed tracing for learning, debugging, performance tuning, and general analysis of behavior.