Module 4: AI-powered troubleshooting
Your team at Parasol Insurance has been experimenting with a couple of R&D projects on OpenShift — a web frontend/backend prototype and a new payments processing service. These are not in production yet, but if the testing goes well, they will be. A colleague mentions that the web prototype is timing out, and you have noticed some alerts firing on the payments app. Time to figure out what is going on before the next demo with stakeholders.
Fortunately, OpenShift includes built-in AI capabilities that help developers investigate application problems without needing to memorize oc commands, write PromQL queries, or navigate between multiple console views. OpenShift Lightspeed uses the Model Context Protocol (MCP) to query your cluster in real time — examining pod state, logs, metrics, alerts, and network policies — and presents findings in plain language.
In this module, you will use these platform features to investigate and resolve issues in your R&D applications, and build custom monitoring dashboards to keep an eye on things as development progresses.
Learning objectives
By the end of this module, you will be able to:
-
Use OpenShift Lightspeed to investigate application issues through natural language
-
Diagnose network connectivity problems using AI-driven cluster introspection
-
Investigate firing alerts and identify root causes across correlated metrics and logs
-
Request AI-assisted remediation actions (like rolling back a broken deployment)
-
Generate interactive Perses charts and build custom monitoring dashboards
Before you begin
Your environment includes two R&D projects that your team has been testing on OpenShift:
| Application | Namespace | Scenario |
|---|---|---|
Parasol Web (frontend + backend) |
|
Network connectivity issue — frontend cannot reach backend |
Parasol Payments (API + database + reporting) |
|
Database connection exhaustion causing payment failures |
Both apps have been acting up recently — timeouts, error spikes, and alerts popping up. Your team lead has asked you to look into it before the next stakeholder review. You will use OpenShift Lightspeed to investigate and resolve the issues.
-
Verify your applications are deployed. Switch to the OpenShift Console tab on the right (or open it in a new tab if you prefer). If you are not already logged in, log in with your credentials:
Username:
{user}Password:
{password}Navigate to Home > Projects. Among the namespaces used in other modules, you should also see:
-
{user}-parasol-web -
{user}-parasol-payments
-
-
Navigate to Observe > Alerting in the OpenShift console and select
{user}-parasol-paymentsfrom the project dropdown. You may see alerts firing — this is expected and part of the exercise.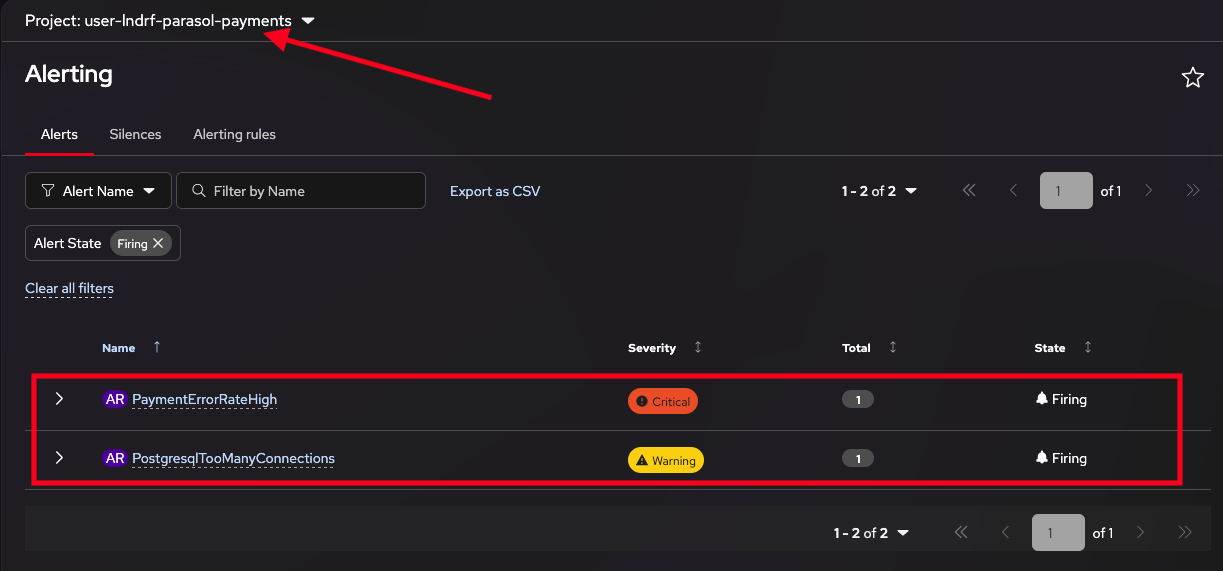
These are user-level alerts defined by your application’s
PrometheusRuleandServiceMonitorresources — not platform alerts managed by cluster admins. OpenShift observability supports both: platform-level monitoring for infrastructure health, and user workload monitoring that lets developers define custom metrics, alerts, and dashboards scoped to their own applications.
Exercise 1: Investigate a timeout issue
Estimated time: 10 minutes
Let’s start with something straightforward. The Parasol web prototype has a frontend that continuously attempts to connect to a backend service. Something is preventing the connection, and the frontend logs are full of timeout errors. This is the kind of issue that would normally have you digging through service definitions, network policies, and pod labels — but instead, you will describe the symptom and let Lightspeed track it down.
Step 1: Check the symptoms
-
In the OpenShift console, navigate to Workloads > Pods and select the
{user}-parasol-webproject. -
You should see two pods:
frontendandbackend. Both are running, but the frontend is not able to reach the backend. -
Click on the
frontendpod, then select the Logs tab. You should see repeated timeout errors:Trying to connect to backend-service... ERROR: Connection timeout to backend-service!
Step 2: Ask Lightspeed to investigate
-
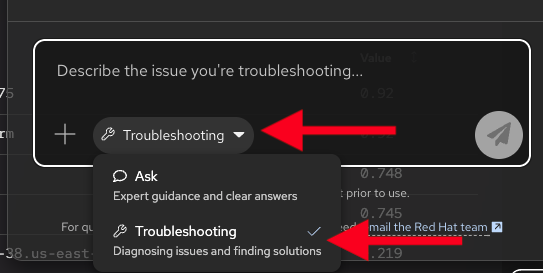
Open the OpenShift Lightspeed chat by clicking the chat icon in the bottom-right corner of the console. Select the troubleshooting mode from the mode selector dropdown.
-
Ask Lightspeed to investigate the issue:
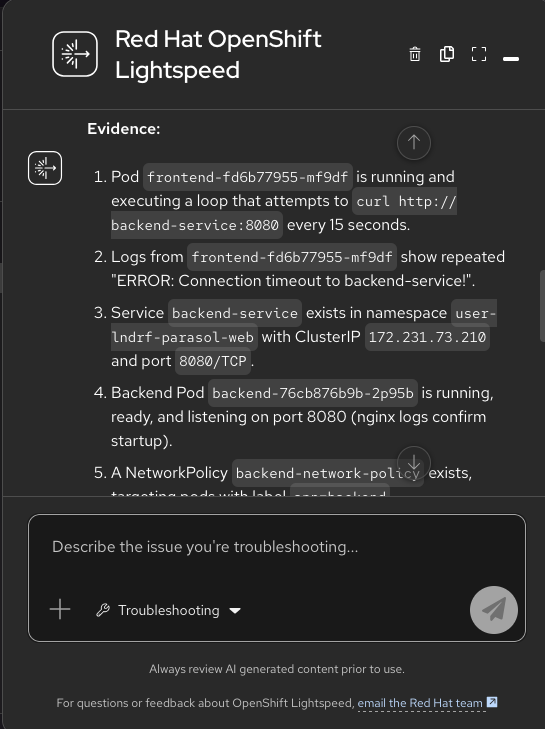
Investigate the timeout connection issue in the {user}-parasol-web namespace. Don't make any changes just yet!Lightspeed will query your cluster via MCP — examining pods, services, network policies, and logs — to identify the root cause.
-
Review the findings. Lightspeed should identify that a NetworkPolicy named
backend-network-policyis blocking traffic from the frontend to the backend. The policy only allows ingress from pods with the labeltier: backend, but the frontend pod has the labeltier: frontend.
Step 3: Fix the issue
Lightspeed identified the root cause — a NetworkPolicy that was configured too restrictively, blocking the frontend from reaching the backend. Now ask Lightspeed to fix it:
Please fix the NetworkPolicy so that the frontend can reach the backend service.| This is a mutable operation — Lightspeed will modify a Kubernetes resource in your namespace. For this workshop, we have configured Lightspeed to allow read and write operations within your own namespaces (not across the cluster). Your organization’s policies may require different configuration — for example, restricting write operations entirely, or requiring explicit confirmation before changes are applied. This is the power of the platform: allowing your admins and platform engineers to align AI capabilities to your security and compliance policies. |
Lightspeed will update the NetworkPolicy to allow traffic from the frontend pods. After the fix is applied, navigate back to the frontend pod and select the Logs tab. You should now see successful connections:
Trying to connect to backend-service...
Success!
| If Lightspeed suggests the fix but does not apply it, you can ask "Go ahead and apply that fix" or "Please update the NetworkPolicy with the corrected configuration." |
That was a single-cause issue with a clear symptom. Lightspeed found the misconfigured NetworkPolicy, explained the problem, and fixed it — all through conversation. But real-world problems are rarely that clean. In the next exercise, you will tackle something messier — a cascading failure where one bad deployment triggers a chain reaction across multiple services.
Exercise 2: Diagnose and fix a critical alert
Estimated time: 15 minutes
While you were investigating the frontend timeout, something more serious has surfaced. The Parasol payments application — the one your team is preparing for its first stakeholder demo — has alerts firing. The PaymentErrorRateHigh alert indicates that more than 15% of payment API requests are returning 5xx errors. But here is the thing: nobody touched the payments-api code. The root cause is somewhere else, buried in a chain of cascading failures across services. This is exactly the kind of problem where Lightspeed shines — tracing the causal trail from symptom to source.
Step 1: Confirm the alert
-
Navigate to Observe > Alerting in the OpenShift console. Select your
{user}-parasol-paymentsnamespace from the project dropdown at the top. You should see thePaymentErrorRateHighalert (Critical) and may also see aPostgresqlTooManyConnectionsalert (Warning).
If the alerts are not yet firing, wait a few minutes. A recent deployment may take a few minutes to start causing issues.
Step 2: Ask Lightspeed to investigate
-
In the Lightspeed chat, ask it to investigate the alert:
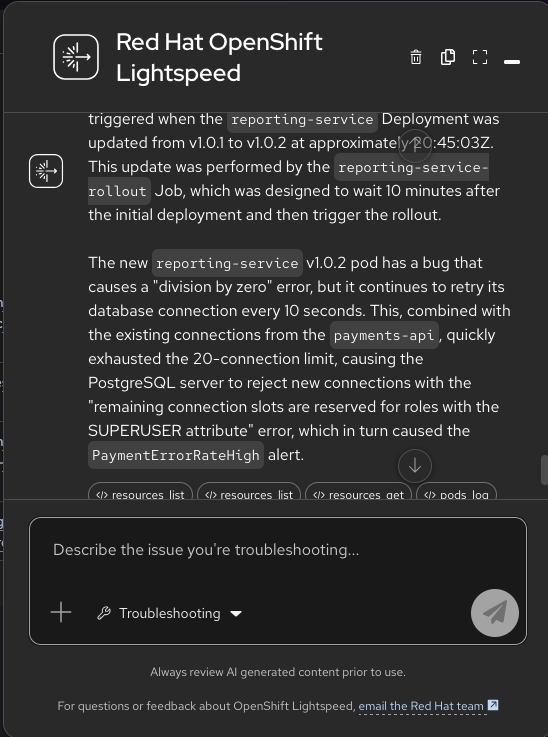
Investigate the root cause of the PaymentErrorRateHigh alert in the {user}-parasol-payments namespaceLightspeed will perform a multi-step investigation:
-
Query the firing alerts and their thresholds
-
Examine pod logs for the payments-api, reporting-service, and postgres
-
Query Prometheus metrics for error rates and database connection counts
-
Correlate the findings to identify the root cause
-
-
Review the findings. Lightspeed should identify the database connection exhaustion as the cause of the payment failures. If it suggests increasing
max_connectionsor other database tuning, ask a follow-up to dig deeper into why the connections are being exhausted:Did anything change recently with the deployments in this namespace that could have caused this?This should lead Lightspeed to discover that the
reporting-servicewas recently updated to versionv1.0.2, and that this version is the source of the connection leak. The full cascade looks like this:-
The
reporting-servicewas recently updated to versionv1.0.2 -
This version has a bug that leaks database connections — it opens connections but never closes them
-
The leaked connections exhaust the PostgreSQL
max_connectionslimit (set to 20) -
Once connections are exhausted, the
payments-apican no longer connect to the database -
Payment requests start failing with 5xx errors, triggering the
PaymentErrorRateHighalert
-
Step 3: Request a rollback
Now that you understand the root cause, ask Lightspeed to fix it:
Please roll back the reporting-service deployment to the previous version to fix this issueLightspeed will execute the rollback by patching the deployment image back to v1.0.1 (the last known good version). You can watch the rollout in the OpenShift console under Workloads > Deployments in the {user}-parasol-payments namespace.
After the rollback:
-
The reporting-service restarts with the working version
-
Database connections are released
-
The payments-api recovers and starts processing payments successfully
-
The
PaymentErrorRateHighandPostgresqlTooManyConnectionsalerts resolve (this may take 1-2 minutes as Prometheus re-evaluates the alert conditions)
| You can verify the fix by asking "Is the PaymentErrorRateHigh alert still firing?" or "Show me the current error rate for the payments API." If the alerts are still showing, give it another minute and check again. |
Exercise 3: Build a custom monitoring dashboard
Estimated time: 10 minutes
Now that the immediate fires are out, you want to set up ongoing monitoring for your applications. OpenShift Lightspeed can generate interactive Perses charts directly in the chat — and you can export them to persistent dashboards that continue to show live metrics.
Step 1: Create a dashboard
-
Navigate to Observe > Dashboards (Perses) in the OpenShift console.
-
Click Create to create a new dashboard. Name it
Parasol Payments Monitorand select your{user}-parasol-paymentsnamespace.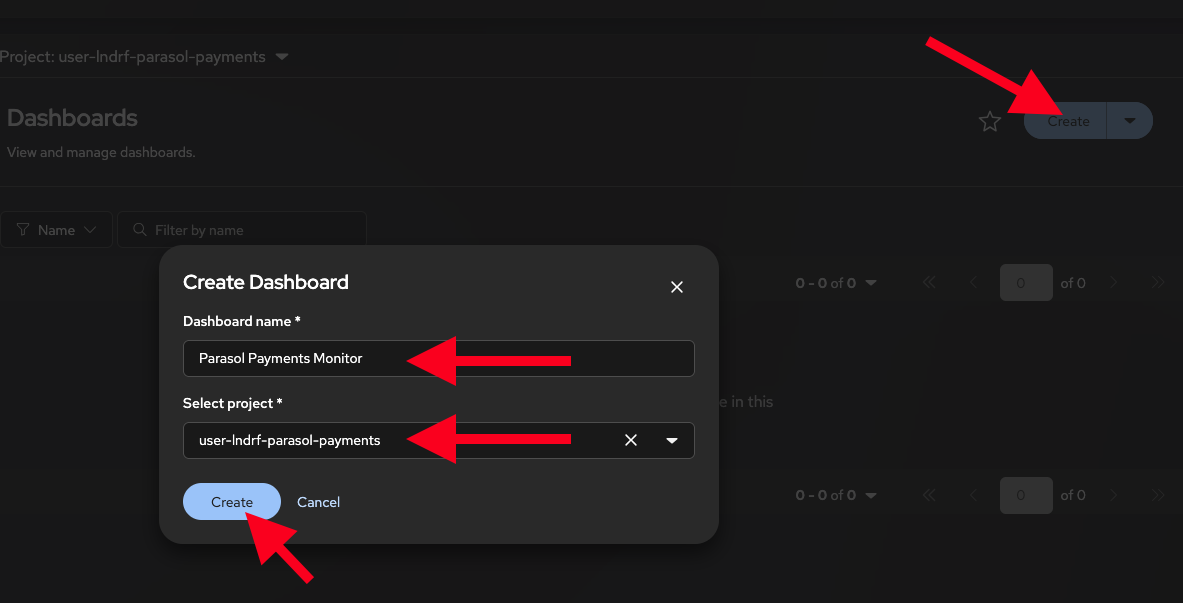
Step 2: Generate charts with Lightspeed
In the Lightspeed chat, you will generate three charts — one at a time — to build up a useful monitoring view for the payments application.
-
First, ask for the HTTP request rate:
Show me the HTTP request rate by response code for the payments-api service in the {user}-parasol-payments namespace over the last 30 minutes. Visualize it.Lightspeed will generate an interactive Perses chart directly in the chat UI.
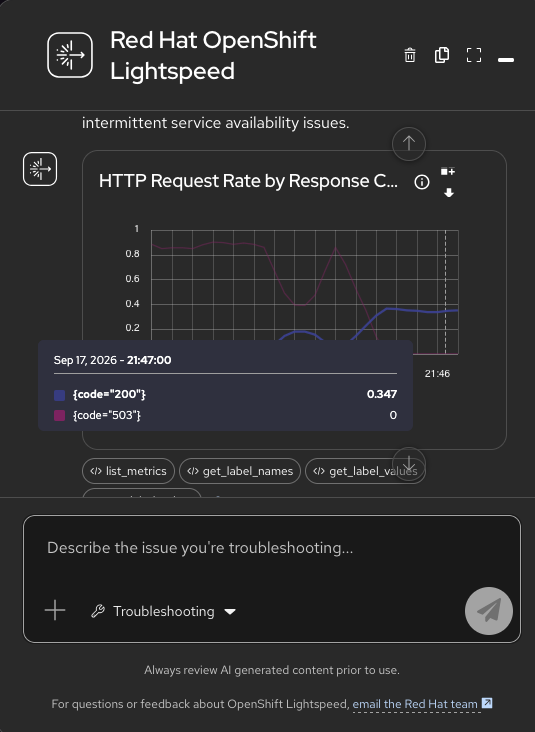
-
Next, ask for the payment error rate:
Show me the payment API error rate (5xx responses as a percentage of total requests) in the {user}-parasol-payments namespace over the last 30 minutes. Visualize it. -
Finally, ask for CPU usage:
Show me the CPU usage by pod in the {user}-parasol-payments namespace over the last 30 minutes. Visualize it.
Step 3: Export to your dashboard
Now scroll back through the conversation and add the charts you find most useful to your dashboard.
-
Click the Add To Dashboard button on a chart you want to keep. If you do not see the Add To Dashboard button, navigate to Observe > Dashboards (Perses) first and make sure you are viewing your
Parasol Payments Monitordashboard, then try again from the Lightspeed chat.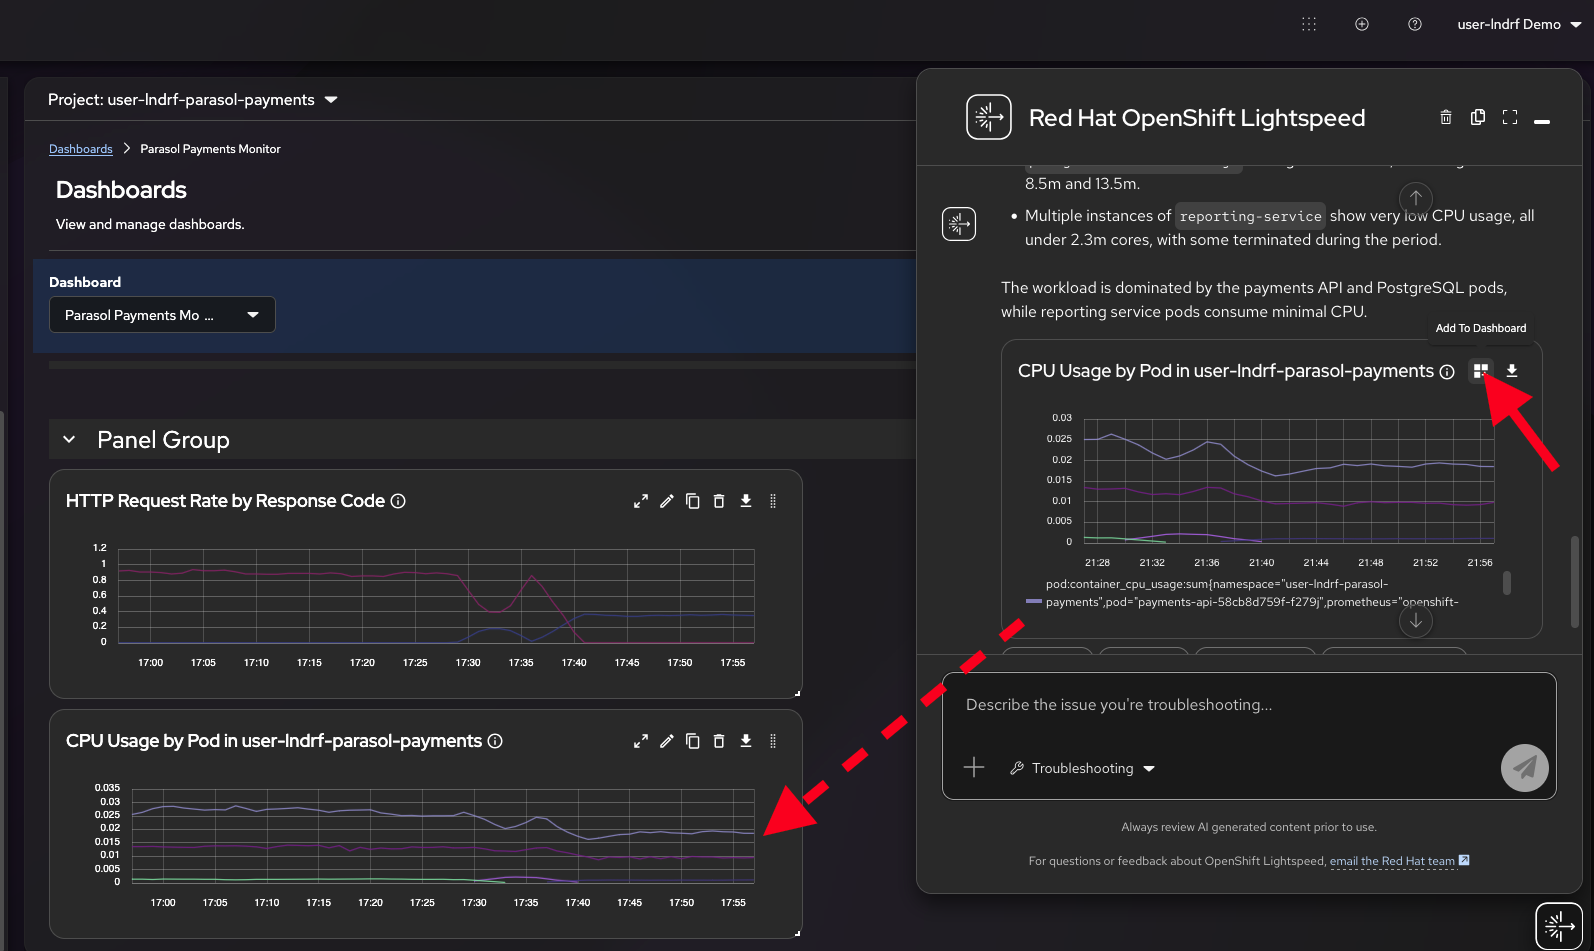
-
The chart will be added to your dashboard. Repeat for each chart you want to keep.
-
Once you have added the charts you want, minimize the Lightspeed chat by clicking the _ button to reveal the full dashboard view, then click Save to persist it.
-
Your charts are now saved and show live, updating metrics — a custom monitoring dashboard built entirely through conversation.
This workflow allows you to build monitoring dashboards through natural language — no need to hand-craft PromQL queries or manually configure chart panels. As you investigate issues, you can capture the most useful metrics into dashboards that persist beyond your conversation and serve as ongoing monitors for your applications.
Key takeaways
-
OpenShift Lightspeed provides AI-driven root cause analysis through natural language conversation
-
The AI correlates Prometheus metrics, pod logs, events, and Kubernetes resource state to identify issues
-
Developers can investigate and resolve issues in their own namespaces without cluster-admin access
-
AI-assisted remediation (like rollbacks) can be requested through conversation
-
Inline Perses charts can be generated during investigation and exported to persistent dashboards
-
Custom dashboards built through natural language provide ongoing monitoring without PromQL expertise