Dealing with Vulnerabilities Early
The traditional approach to security is to scan at the end of the pipeline — or worse, after deployment. By then, fixing vulnerabilities means rework, delays, and emergency patches. A better approach is to shift left: give developers the tools to identify and fix vulnerabilities as early as possible, while they are still writing code.
In this section, you will set up your secured development environment, then use Red Hat Dependency Analytics to find and fix vulnerabilities in the application’s dependencies — before you even push a commit.
| This module does not cover the full capabilities of Red Hat Developer Hub or how it supports developers in their daily workflow. For the developer experience, see Module 1: The Developer Experience. Here, we focus on the security guardrails added to the development process. |
Section 1: Understanding the components
Exercise 1: Explore the application component in Developer Hub
-
Open Red Hat Developer Hub at https://backstage-developer-hub-rhdh.{openshift_cluster_ingress_domain} and log in with your credentials:
Username:
{user}Password:
{password} -
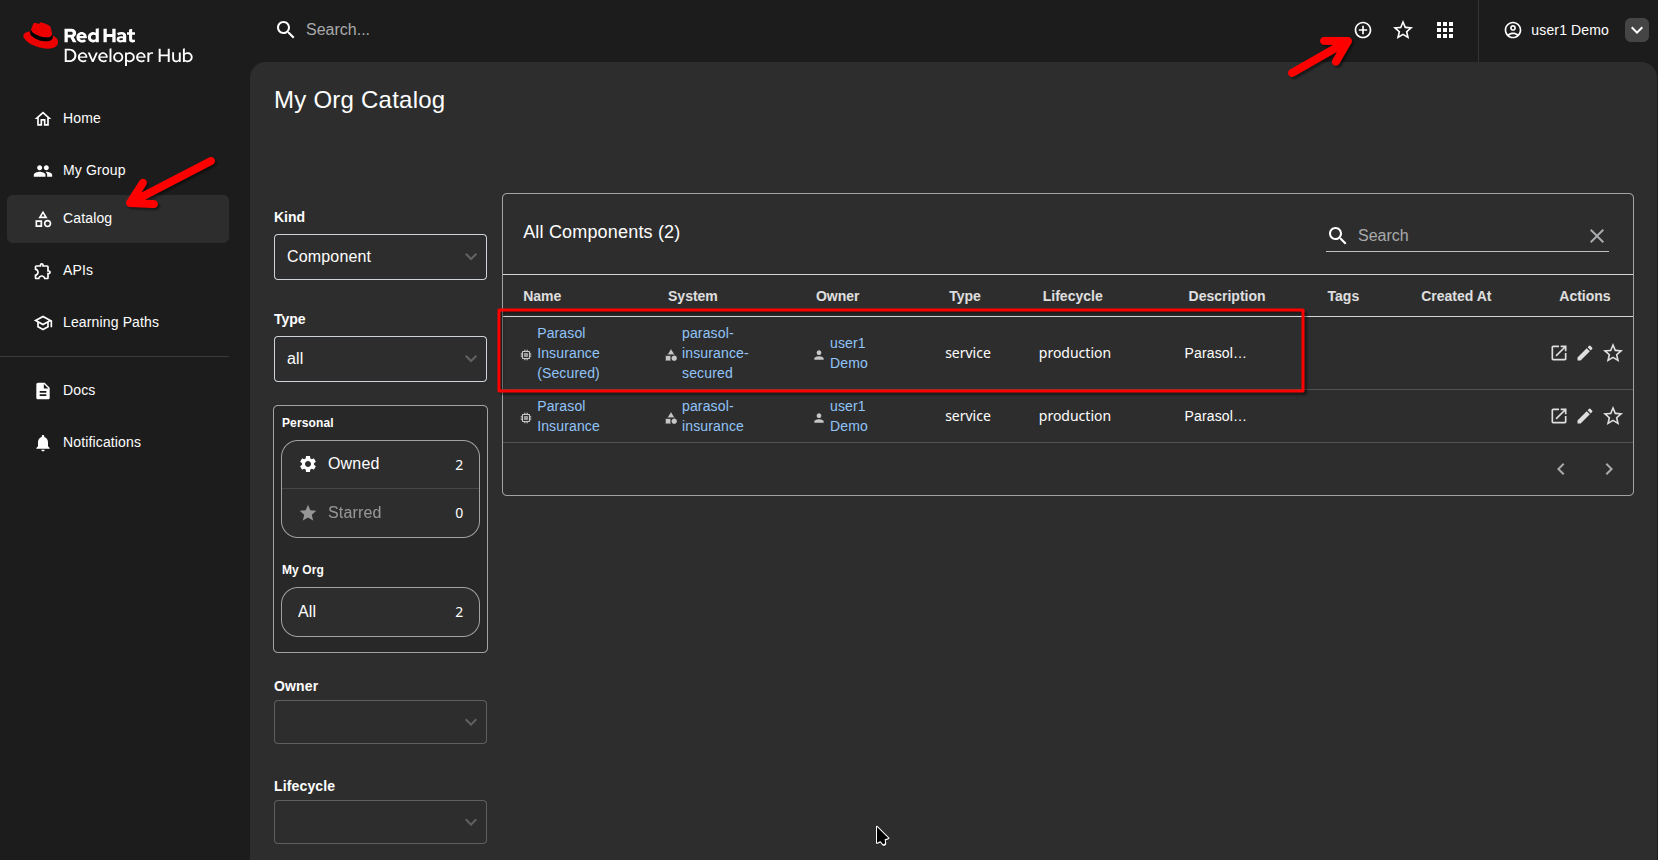
Click Catalog in the left sidebar.
-
Find and click on Parasol Insurance (Secured).
This is the version of the Parasol Insurance application that uses secured build pipelines. If you have done Module 1, you will recognize it as the same application.
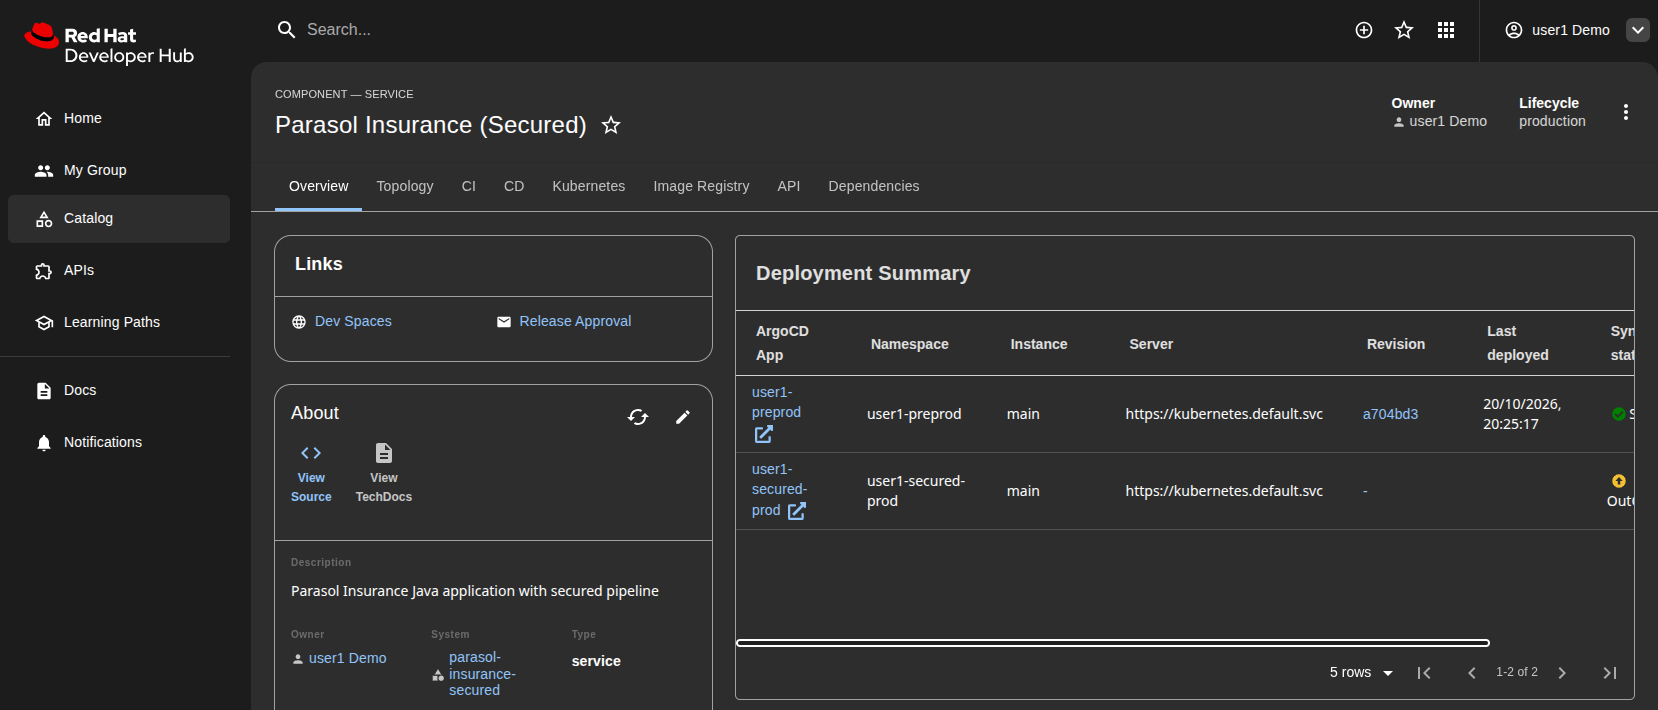
Take a moment to explore the component page:
-
The Topology tab shows a visual map of the application’s deployments and their relationships
-
The CI tab displays pipeline runs — builds, security scans, and promotion pipelines. You will use this tab frequently throughout this module
-
The CD tab shows ArgoCD sync status for the preprod and secured-prod deployments
We will come back to these tabs later, after creating a fully independent sandbox environment for development in the next exercise.
-
Exercise 2: Create a secured sandbox environment
Just like in Module 1, you will create an isolated development environment — but this time using the secured template that includes additional security checks in the pipeline.
-
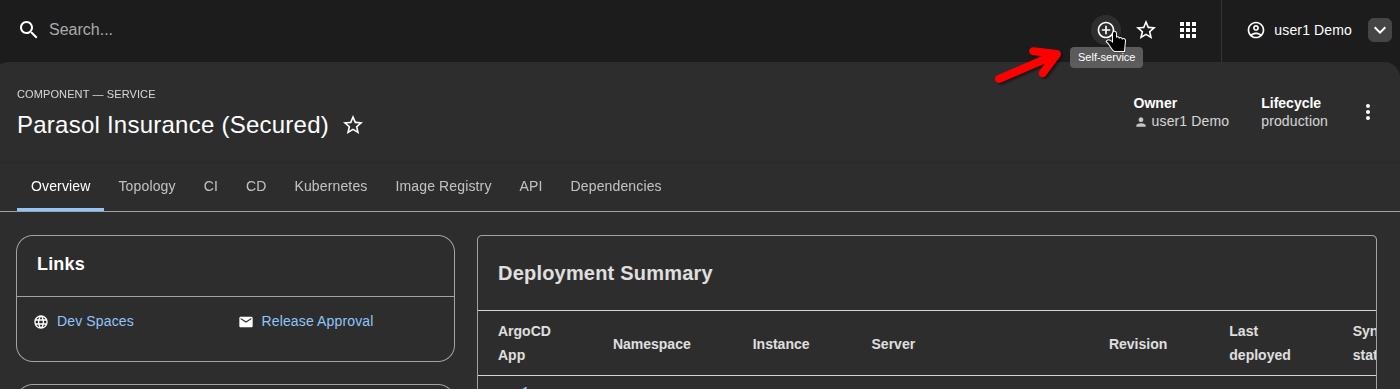
Click the Self-Service button (the + icon) at the top of the page.
-
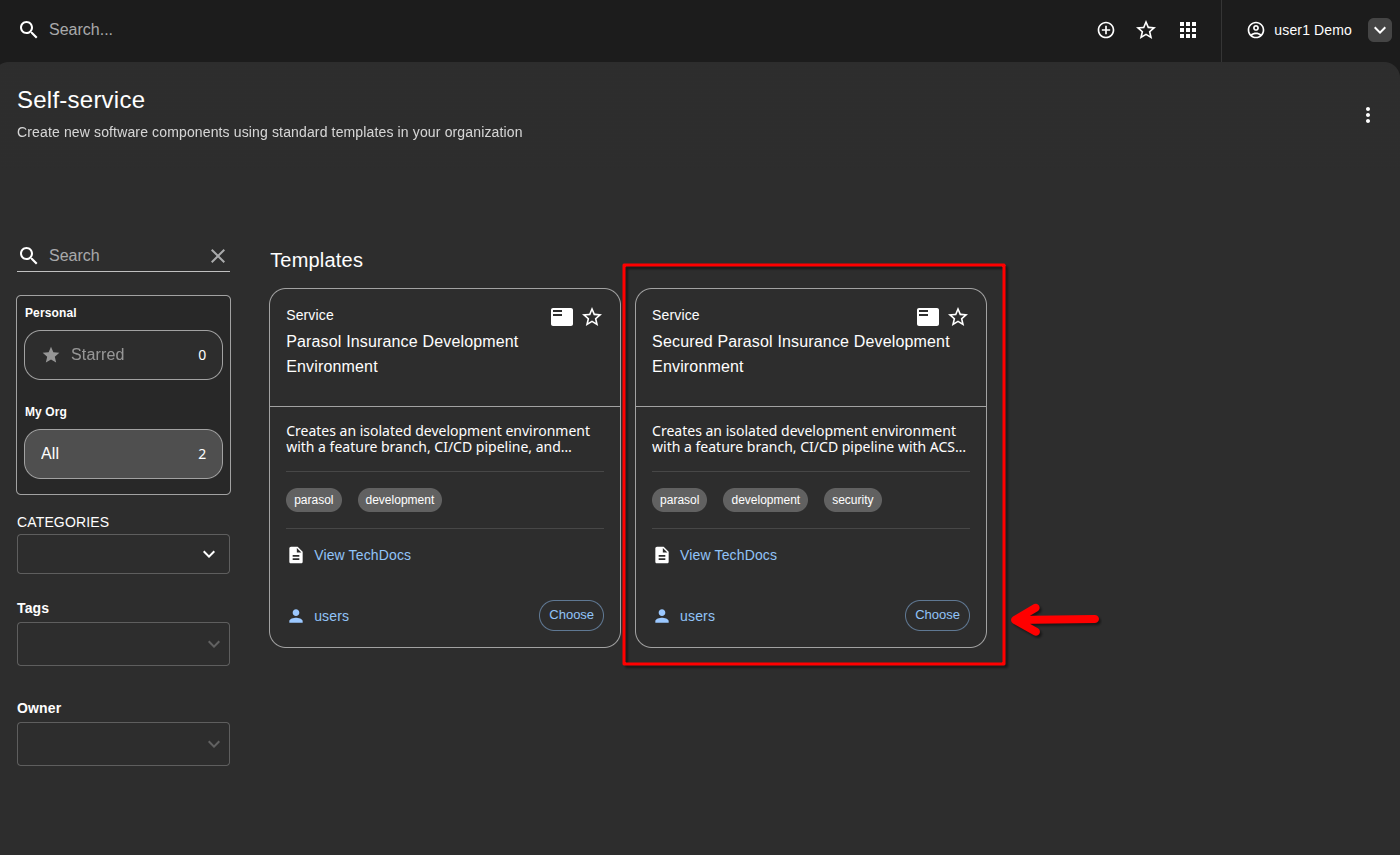
Select the Secured Parasol Insurance Development Environment template.
-
Enter a branch name for your sandbox, for example:
sec-fixKeep the branch name short. It will be used in namespace names and OpenShift Routes. -
Click Review, then Create and watch the provisioning:
-
A feature branch is created in the secured source repository
-
A sandbox namespace with its own CI/CD pipeline is created
-
A new component is registered in Developer Hub
-
An initial build is triggered automatically
-
-
When provisioning completes, click Open in Catalog to see your new sandbox component.
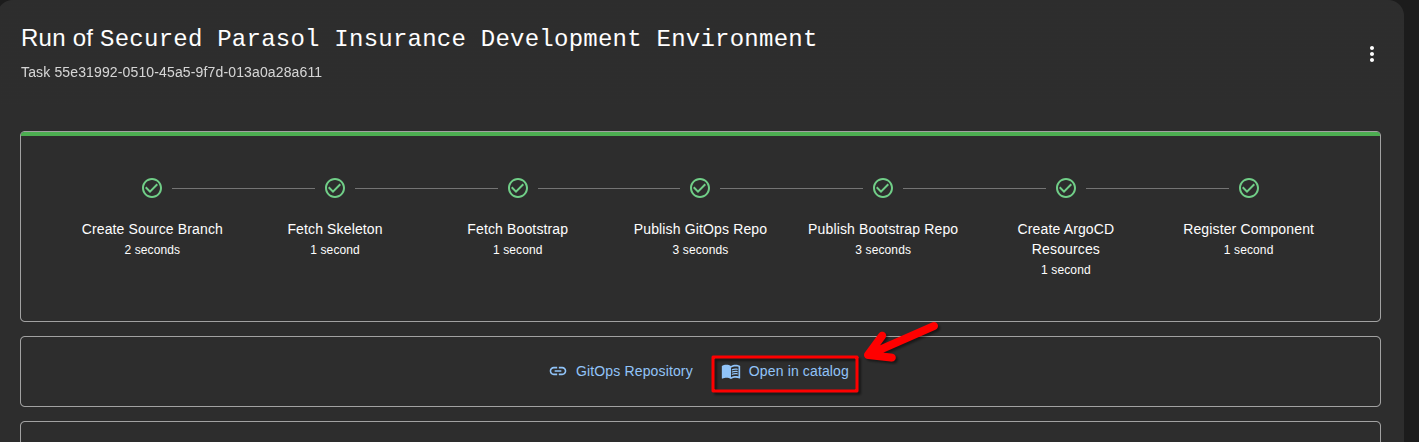
Alternatively, you can also find it in the catalog as Parasol Insurance Secured Dev (your-branch-name). This is your isolated sandbox development environment.
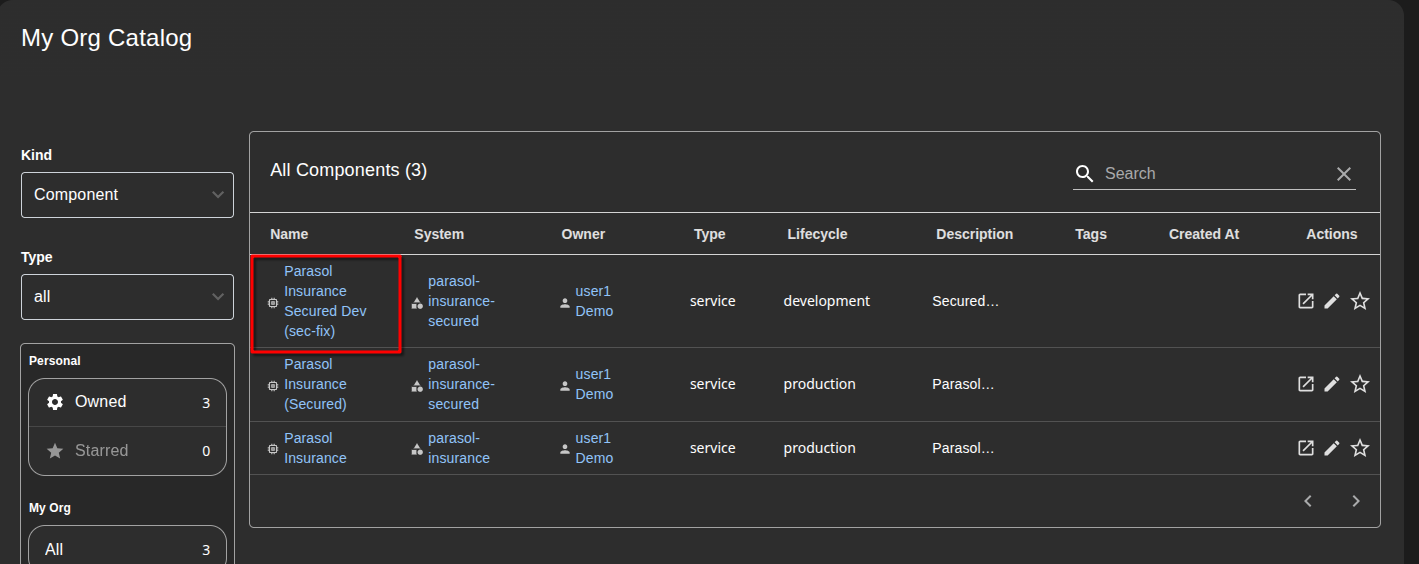
-
Open it, click on the CI tab to verify the initial build pipeline has started.
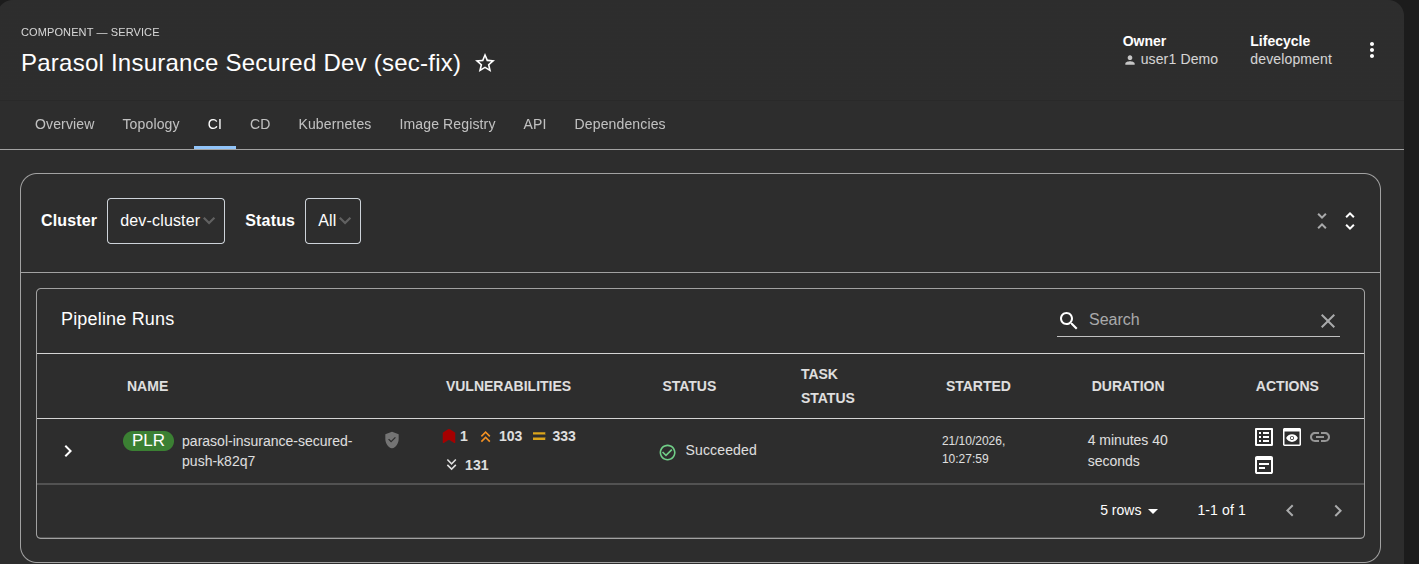
This screenshot shows a succeeded pipeline run — you do not have to wait for it to finish. Let’s move on.
Section 2: Red Hat Dependency Analytics
Red Hat Dependency Analytics (RHDA) is an IDE extension that analyzes your application’s dependencies in real time. It identifies known vulnerabilities, provides remediation recommendations, and integrates with Red Hat’s Trusted Profile Analyzer (TPA) for enriched vulnerability data — including backport remediations from Lightwell that are not available in public databases.
Exercise 1: Open Dev Spaces and trigger an analysis
-
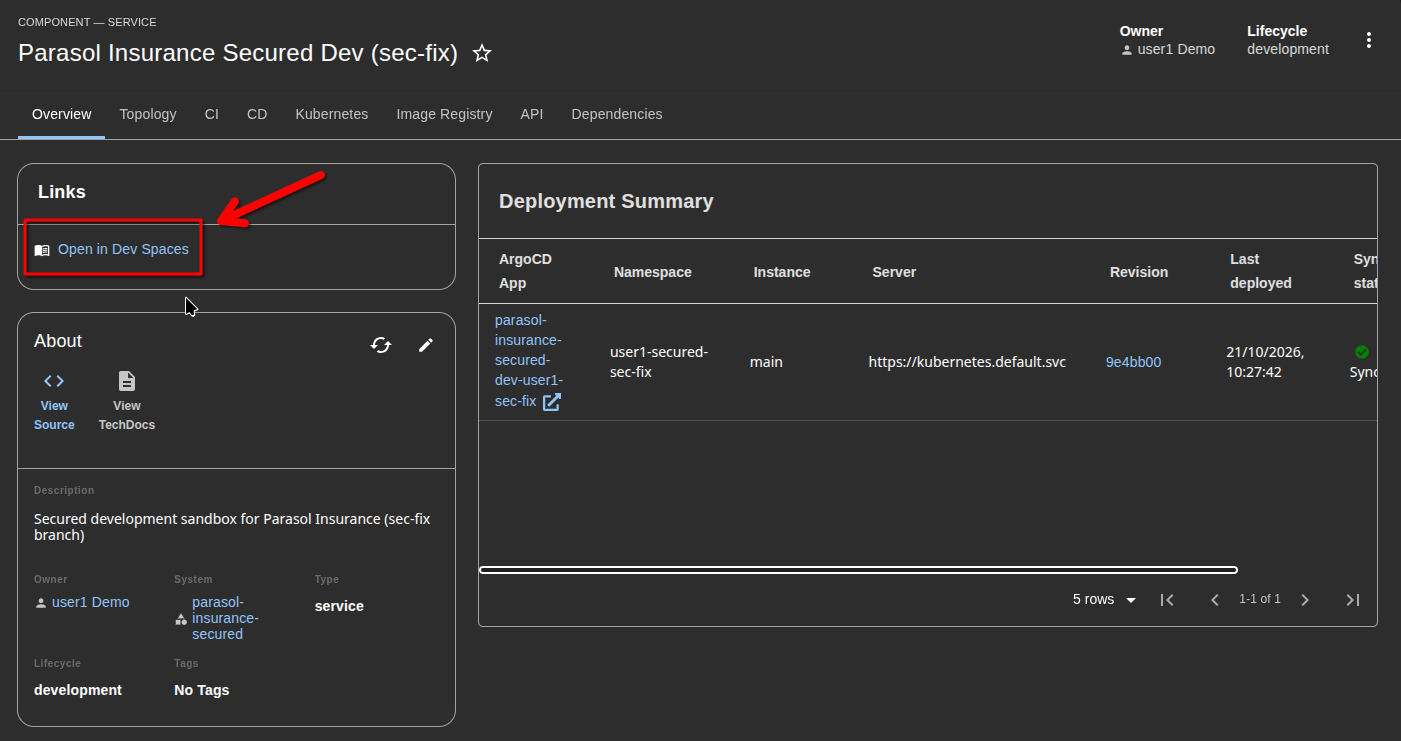
On your sandbox component page in Developer Hub (Click on the Overview Tab), click the Dev Spaces link to open a cloud development environment.
-
The workspace will take a moment to start. When prompted, accept the security prompts and trust the workspace.
If you see a popup asking about trusting the authors, click Yes, I trust the authors. Details — Startup sequence
The Dev Spaces startup involves several steps. Follow along with the screenshots below:
-
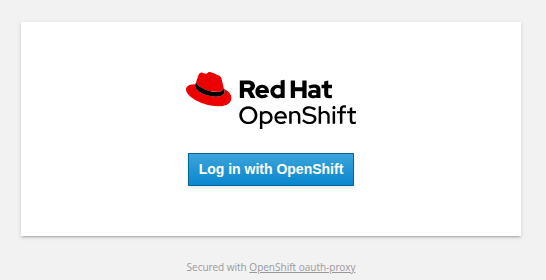
Login with OpenShift
-
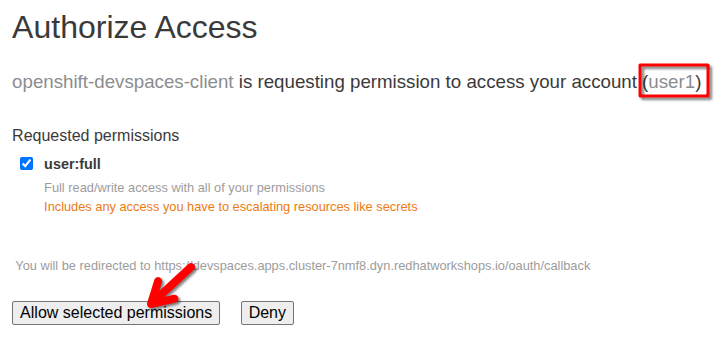
Grant permissions
-
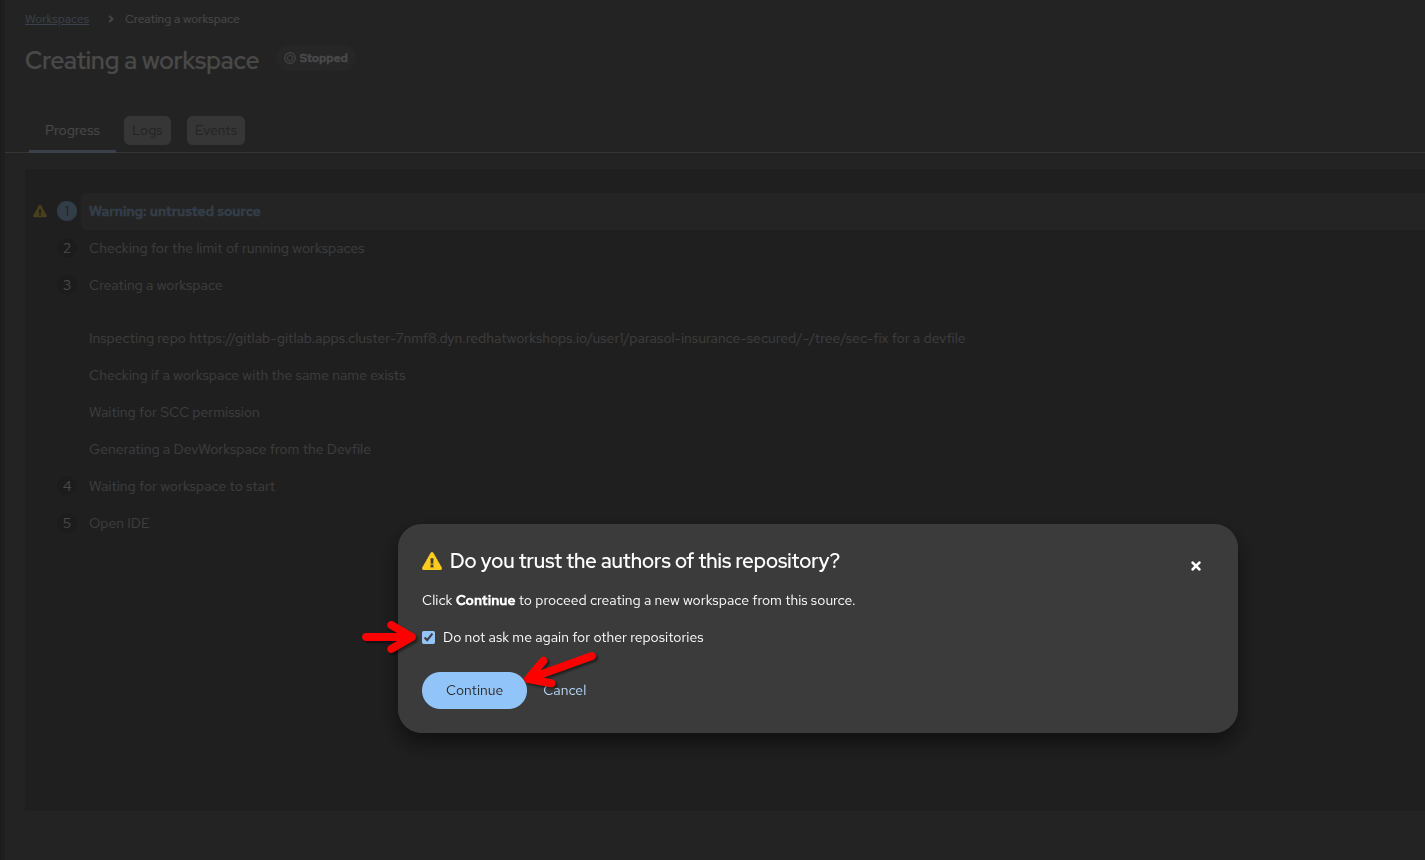
Trust the authors (and optionally allow for other repos, too)
-
If asked, login to GitLab with
{user}/{password}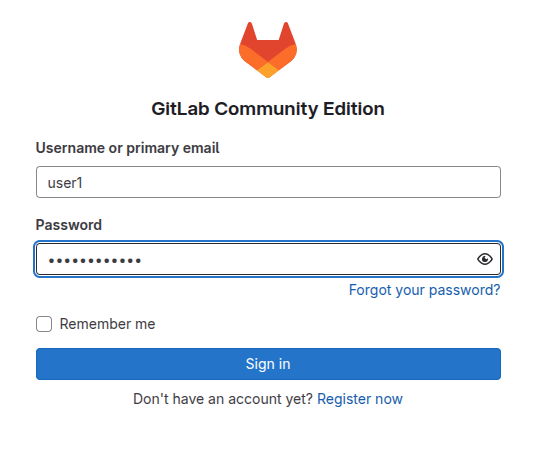
-
Authorize DevSpaces
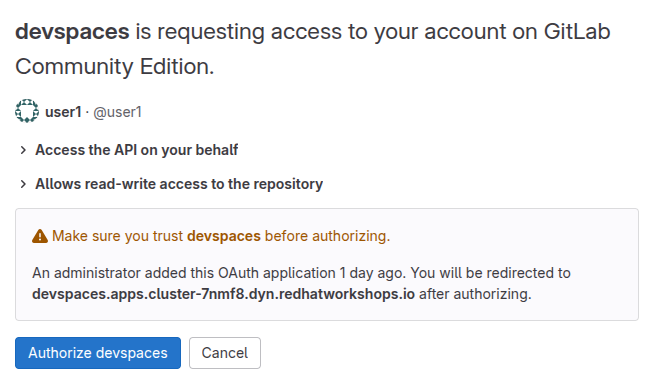
-
Trust the extension publishers
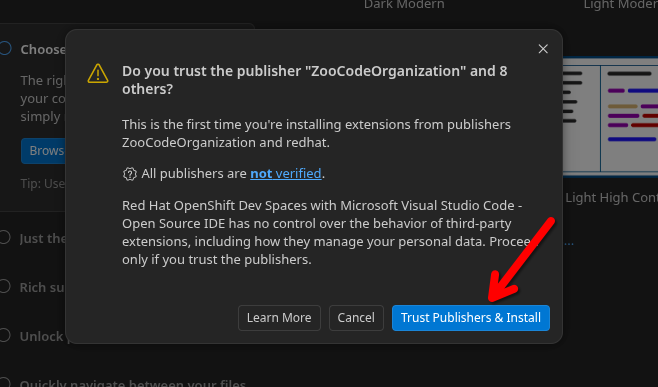
-
Trust the Workspace
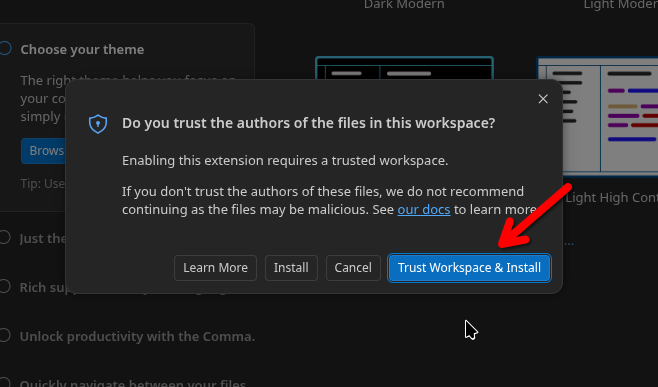
-
Allow the workspace to run the gitsign helper (gitsign login)
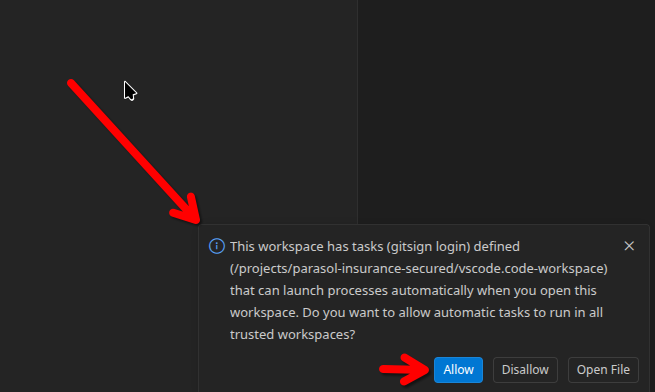
If you missed the task prompt, go to the Burger Menu at the top left, select Terminal → Run Task…
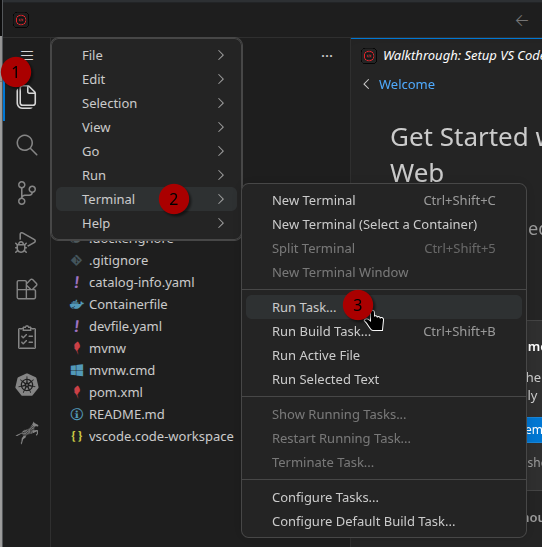
then run gitsign login
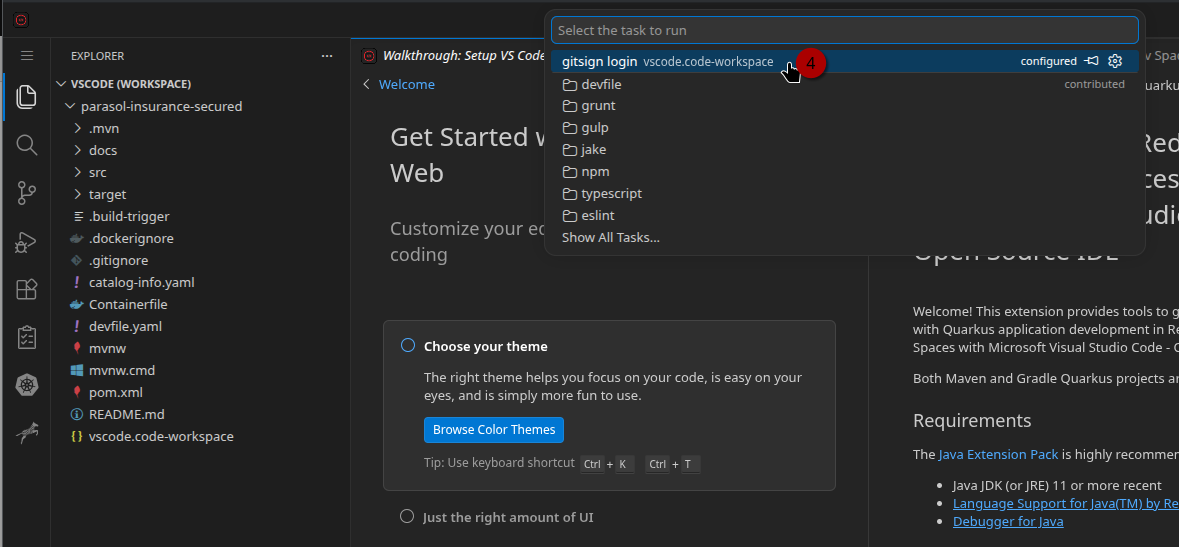
-
-
Wait for the Java environment to settle — you will see progress indicators in the bottom status bar as extensions load. You can clean up your IDE by closing all the "Welcome" panels and the chat panel on the right. Notice the Java: Ready message at the bottom.
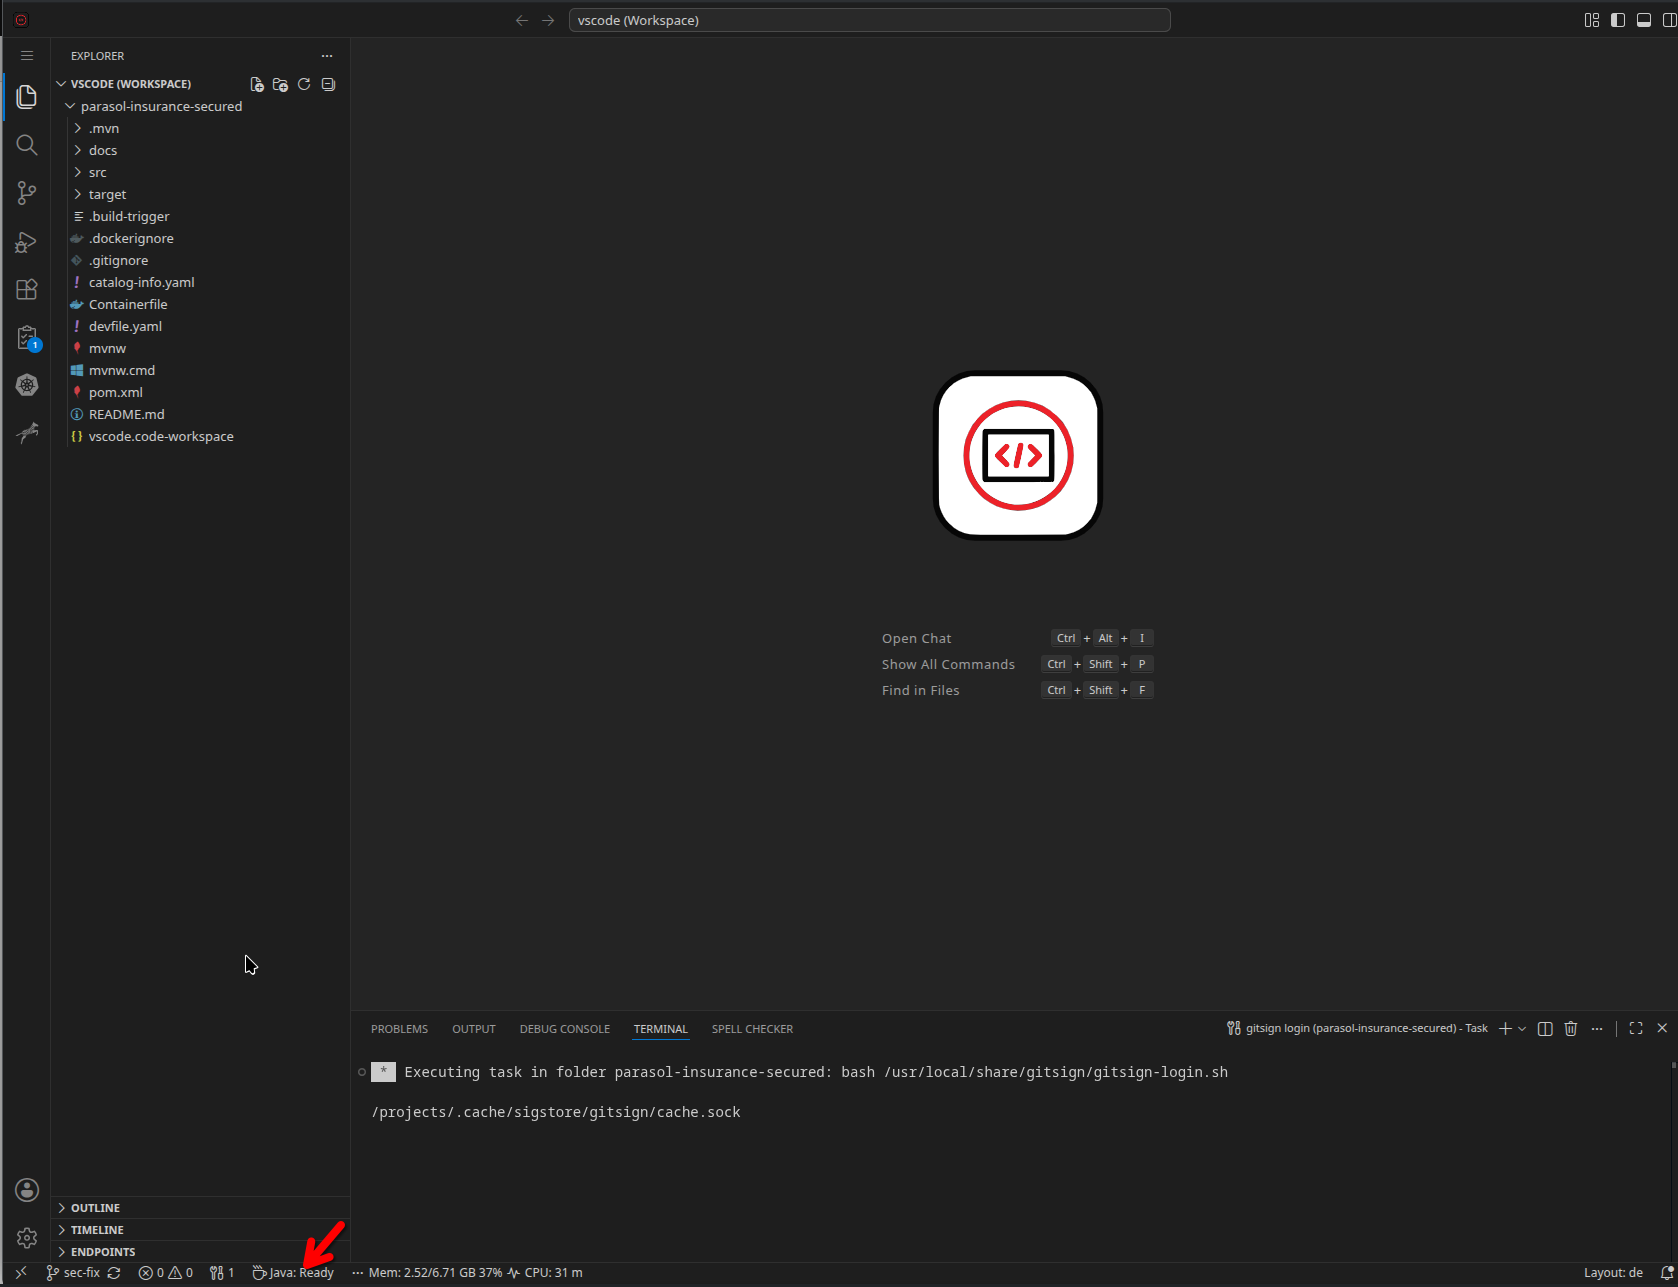
-
In the file explorer, click on pom.xml to open it.
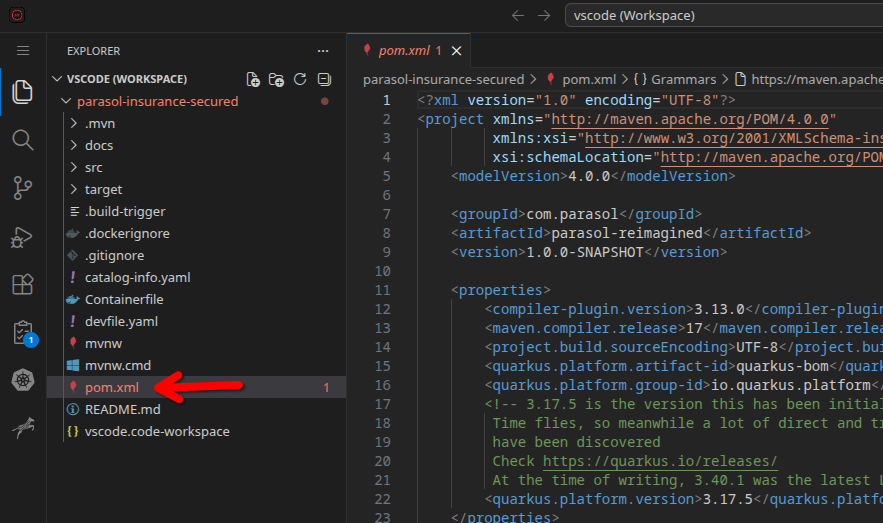
-
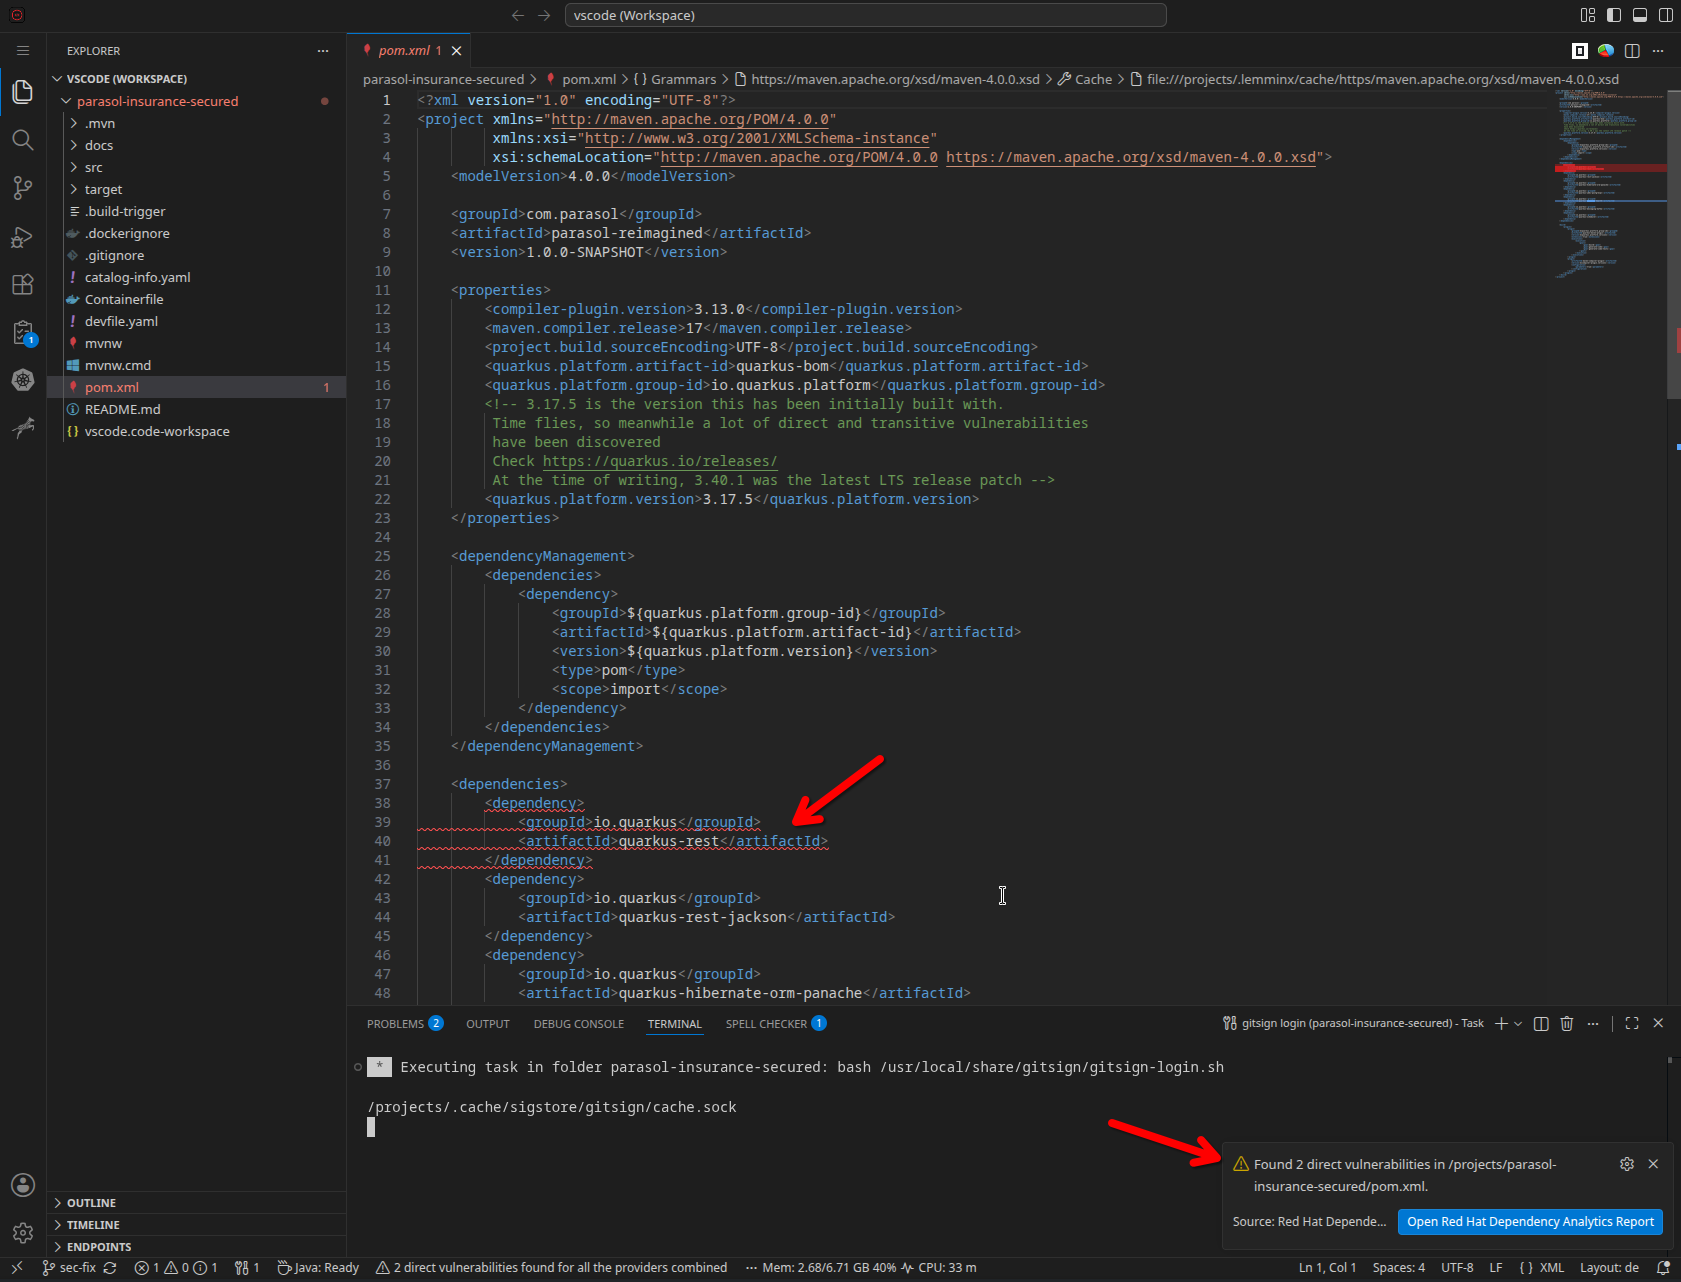
Wait a few seconds (it takes a moment to initialize on first start). Red Hat Dependency Analytics will automatically start analyzing the file. You will see:
-
A notification in the bottom status bar showing the analysis is in progress

-
Dependency entries highlighted with colored underlines indicating vulnerability severity and a report popup
-
-
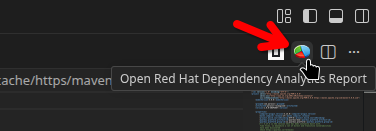
When the analysis completes, click the RHDA Report notification to open the full report. You can also click on the pie chart icon in the top right.
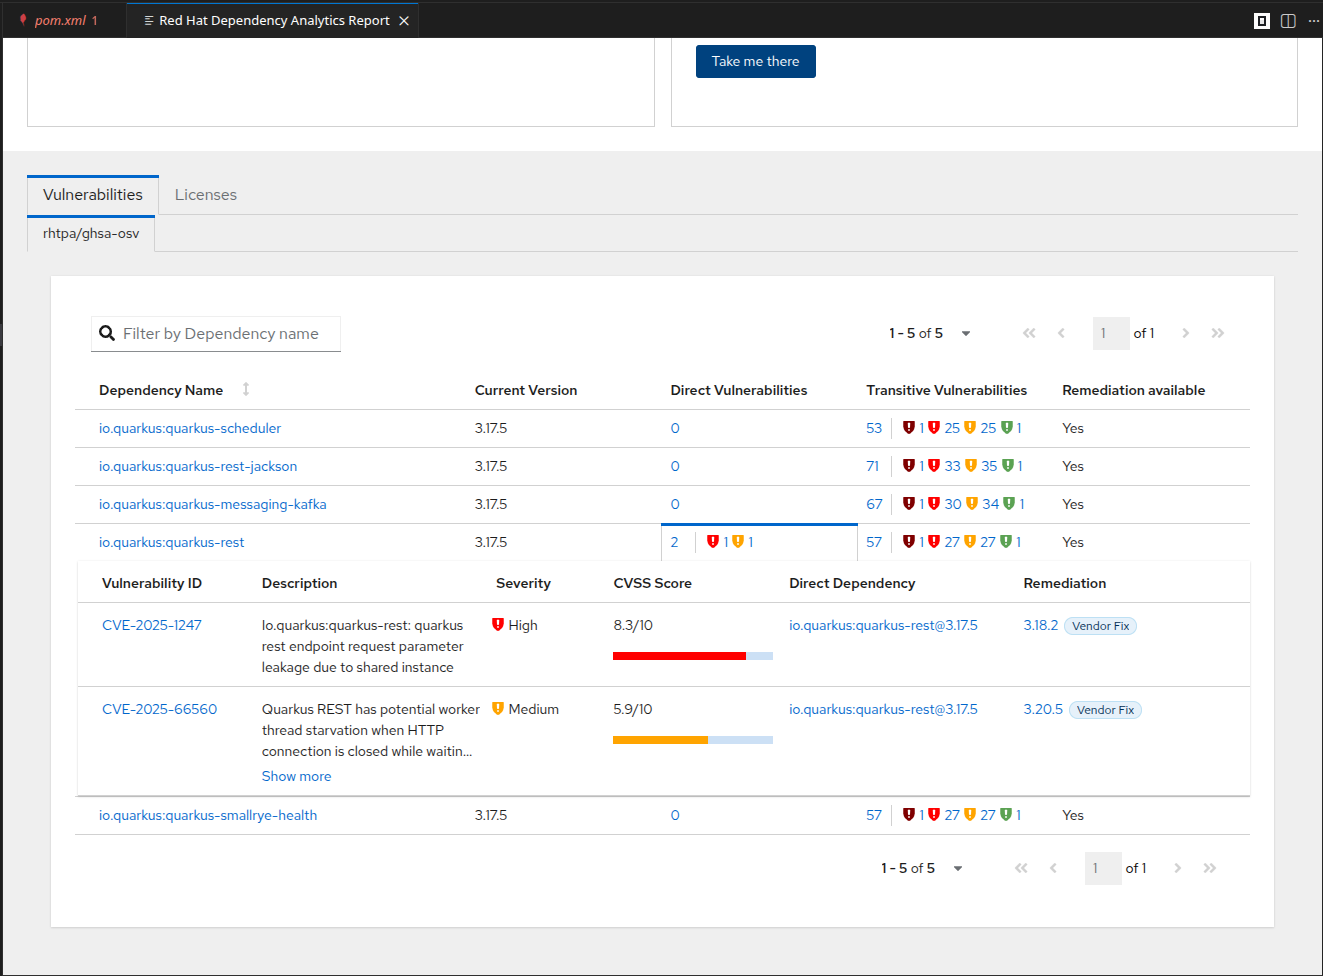
The report shows:
-
Direct and transitive vulnerabilities organized by severity
-
Lightwell remediation recommendations (backports and drop-in replacements) - if available / applicable
-
Upstream remediation recommendations (version bumps)
-
Exercise 2: Fix framework vulnerabilities
-
Go back to
pom.xmland notice the red squiggly lines on vulnerable dependencies. -
Hover over a highlighted dependency and click Quick Fix when the lightbulb appears.
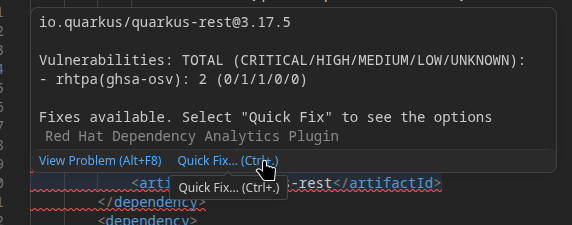
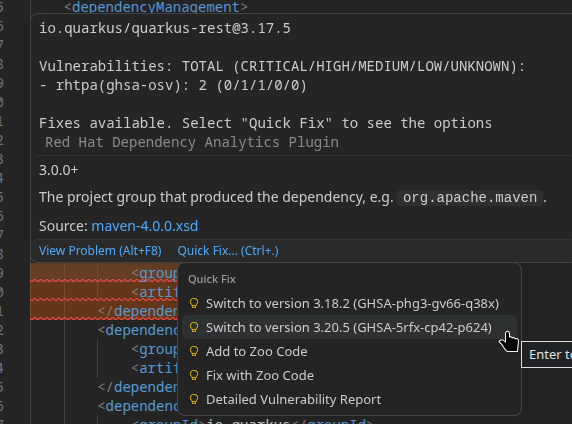
For framework dependencies (like Quarkus), applying a quick fix to a single dependency can cause version mismatches with the rest of the framework. Instead, update the entire framework version, as shown below. -
Find the Quarkus platform version in
pom.xml(look forquarkus.platform.version) and update it to a more recent version. 3.20.5 was the latest version fixing the direct vulnerability:<quarkus.platform.version>3.20.5</quarkus.platform.version> -
VSCode auto-saves the file. RHDA will automatically re-analyze. Check the report — direct framework vulnerabilities should be gone and others reduced.
-
Since there are no direct vulnerabilities found, there will be no warning — you can click on the shield button in the status bar or the pie chart on the top right.
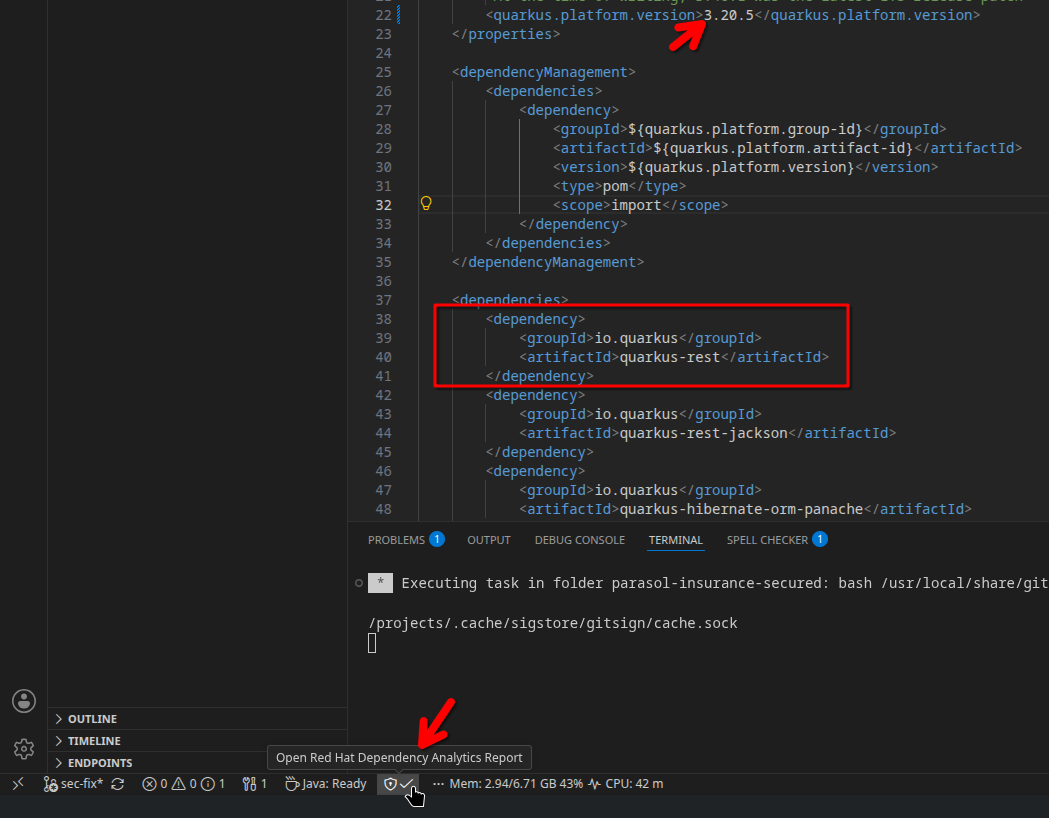
-
Also notice that the squiggly lines around the
quarkus-restdependency are gone. -
Now update to the latest framework version:
<quarkus.platform.version>3.40.1</quarkus.platform.version> -
After auto-save wait for the analysis to complete. The vulnerability count should drop to just a handful.
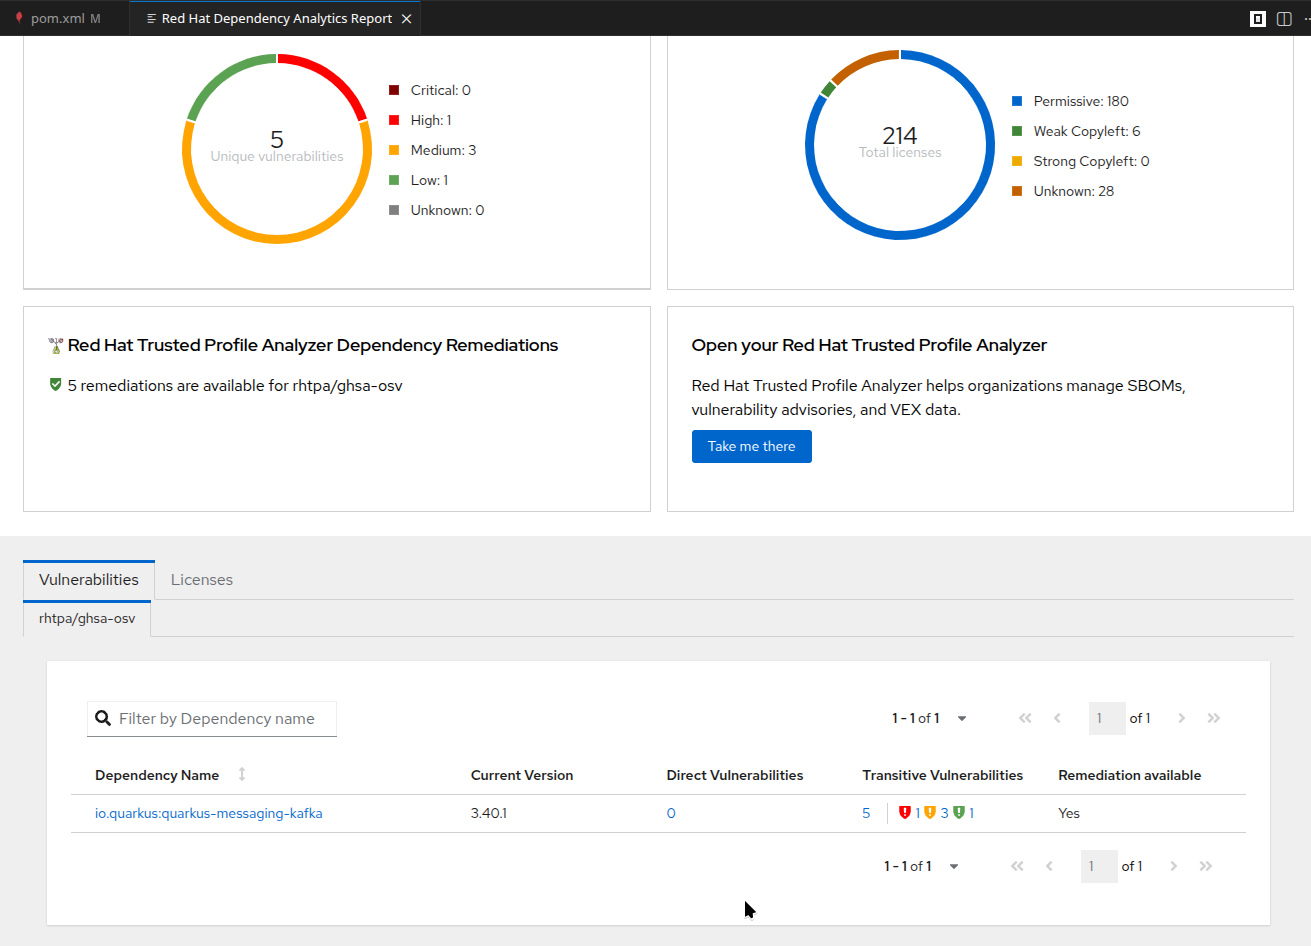
Why is this important?
Giving developers vulnerability information at the earliest possible stage — while they are still writing code — lets them make informed decisions. They can:
-
Choose to update a framework version before a pipeline ever runs
-
Understand the difference between a Lightwell backport (a drop-in fix that does not change the dependency version) and an upstream remediation (a version bump that may introduce breaking changes)
-
Prioritize which vulnerabilities to fix based on severity and exploitability
This is the essence of shift-left security: the developer has the information and the tools to act, rather than discovering problems in a CI/CD failure hours later.
How was it done?
To keep the exercise readable, we have added the details below. Expand to read how it was done.
Open to view implementation details
Red Hat Dependency Analytics queries a backend service called the Trusted Profile Analyzer (TPA). In this environment, TPA is deployed on the cluster and ingests vulnerability data from multiple sources:
-
CVE List v5 — the industry-standard vulnerability database
-
GitHub Security Advisories (GHSA) — vulnerability reports from the open source community
-
Lightwell — Red Hat’s commercial vulnerability intelligence service, providing backport remediations and drop-in replacements that are not available in public databases
RHDA is a VS Code (and IntelliJ) extension that has been configured via the workspace settings to use this cluster’s TPA instance:
"redHatDependencyAnalytics.backendUrl": "https://rhda.{subdomain}"When you open a pom.xml (or package.json, go.mod, etc.), RHDA sends the dependency tree to the backend, which matches it against the ingested vulnerability data and returns enriched results including Lightwell remediations.
You can also open Trusted Profile Analyzer directly from the Dependency Analytics report:
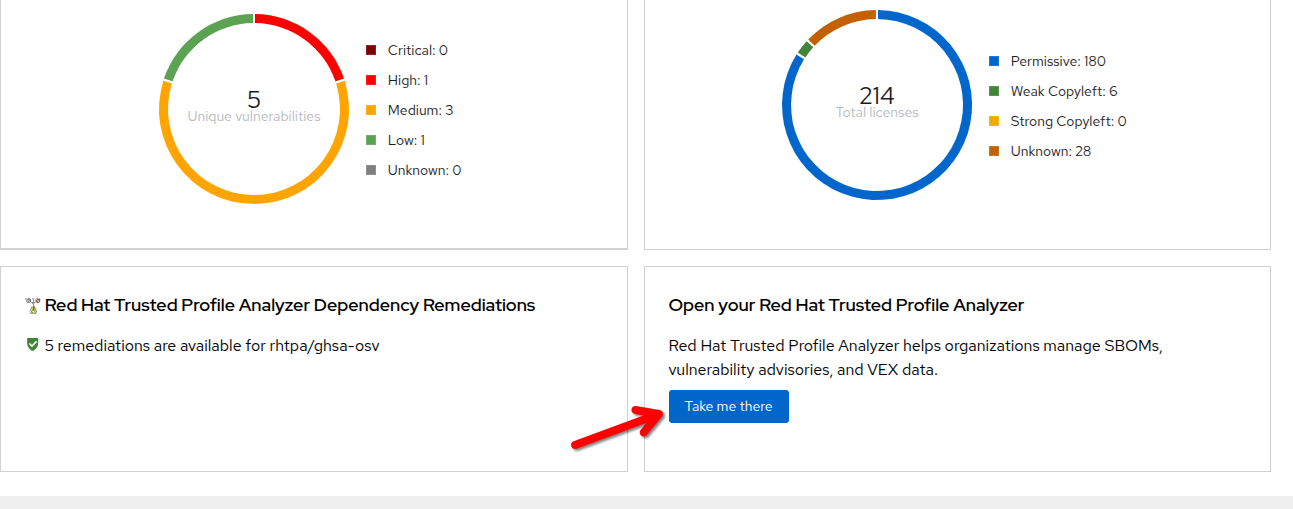
Next steps
Continue to Signing Your Commits to commit your vulnerability fix and sign it with your identity.